 Ting Peng1*†
 Jing-Liang Kang1,2†Xin-Ting Xiong1Fang-Ting Cheng1Xiao-Juan Zhou1
 Wen-Shan Dai1,2
 Min Wang1,2Zhong-Yang Li1Hua-Nan Su1Ba-Lian Zhong1*
- 1National Navel Orange Engineering Research Center, College of Life Sciences, Gannan Normal University, Ganzhou, China
- 2China-USA Citrus Huanglongbing Joint Laboratory, Ganzhou, China
Candidatus Liberibacter asiaticus (CLas) is the causative agent of Huanglongbing (HLB), which has caused great economic losses to the citrus industry. The molecular mechanism of the host response to CLas in wild citrus germplasm has been reported less. Eighteen weeks after inoculation via grafting, all the CLas-inoculated Chongyi wild mandarin (Citrus reticulata) were positive and showed severe anatomical aberrations, suggesting its susceptibility to HLB. Transcriptomics and metabolomics analyses of leaves, barks, and roots from mock-inoculated (control) and CLas-inoculated seedlings were performed. Comparative transcriptomics identified 3,628, 3,770, and 1,716 differentially expressed genes (DEGs) between CLas-infected and healthy tissues in the leaves, barks, and roots, respectively. The CLas-infected tissues had higher transcripts per kilobase per million values and more genes that reached their maximal expression, suggesting that HLB might cause an overall increase in transcript accumulation. However, HLB-triggered transcriptional alteration showed tissue specificity. In the CLas-infected leaves, many DEGs encoding immune receptors were downregulated. In the CLas-infected barks, nearly all the DEGs involved in signaling and plant-pathogen interaction were upregulated. In the CLas-infected roots, DEGs encoding enzymes or transporters involved in carotenoid biosynthesis and nitrogen metabolism were downregulated. Metabolomics identified 71, 62, and 50 differentially accumulated metabolites (DAMs) in the CLas-infected leaves, barks and roots, respectively. By associating DEGs with DAMs, nitrogen metabolism was the only pathway shared by the three infected tissues and was depressed in the CLas-infected roots. In addition, 26 genes were determined as putative markers of CLas infection, and a hypothesized model for the HLB susceptibility mechanism in Chongyi was proposed. Our study may shed light on investigating the molecular mechanism of the host response to CLas infection in wild citrus germplasm.
Introduction
Also known as citrus greening disease, Huanglongbing (HLB) is one of the most destructive diseases of citrus and has resulted in huge economic losses to the citrus industry. It is caused by the phloem-limited, gram-negative, alpha-proteobacteria Candidatus Liberibacter spp. [i.e., C. L. asiaticus (CLas), C. L. africanus (CLaf), and C. L. americanus (CLam)] (Albrecht and Bowman, 2008). CLas is transmitted via grafting with CLas-infected scions and phloem-feeding psyllids [Asian citrus psyllid (ACP) Diaphorina citri] (Bové, 2006). Once infected, the anatomical aberration in newly growing flushes was observed at the early invasion of the pathogen (Folimonova and Achor, 2010). As HLB develops, infected citrus plants will manifest a series of typical symptoms, such as leaves with an asymmetrical pattern of blotchy yellowing or mottling and malformed fruits with aborted seeds (Fu et al., 2016). Eventually, CLas can reduce resource availability for roots and then leads to starvation, which results in widespread tree death due to the decreased photoassimilate transport (Wang and Trivedi, 2013).
To investigate the underlying pathogenetic mechanism of HLB, studies have scanned changes in gene expression levels in CLas-infected citrus (Wang et al., 2016; Rawat et al., 2017; Zhao et al., 2019). In CLas-infected leaves, many differentially expressed genes (DEGs) involved in carbohydrate metabolism, particularly starch pathways, were found to be significantly upregulated (Albrecht and Bowman, 2008). A study performed on citrus phloem by microarray revealed that HLB could disrupt various biological functions, such as sugar metabolism, plant defense, phytohormones, and cell wall metabolism (Kim et al., 2009). The transcriptome of the CLas-positive citrus roots showed that HLB could alter some biological processes, such as cell wall modifications, protease-involved protein degradation, carbohydrate metabolism, hormone synthesis and signaling, transcription activities, and stress responses (Zhong et al., 2015). Nevertheless, there are rare reports on the comparison of transcript differences among various CLas-positive tissues, especially in wild citrus germplasms.
Moreover, bioinformatic analysis of four RNA-Seq datasets on HLB response and tolerance in leaves revealed that sucrose and starch metabolism was highly linked with disease symptoms, but that DEGs in each data set varied because of the conditions of leaves, infection stages, and environments (Balan et al., 2018). Therefore, analysis on transcriptional level alone might be difficult to screen the critical molecular signals in response to CLas infection. Metabolomics could identify low-molecular-weight metabolites (<1 kDa) that alter their accumulation in response to physiological challenges (Padhi et al., 2019; Huang et al., 2020). Integrated transcriptomics and metabolomics analysis may identify key HLB-related pathways, in which DEGs and differentially accumulated metabolites (DAMs) are both enriched.
To evaluate the influences of HLB on various tissues, RNA-seq and metabolome libraries were constructed with leaves, barks, and roots from healthy and CLas-infected Chongyi wild mandarin (Citrus reticulata), wild citrus germplasm in Jiangxi province, China (Peng et al., 2021). Based on the number of reads per gene, the number of DEGs between CLas-infected vs. healthy leaves/barks/roots was estimated, and their putative functions were investigated. Parallel gene expression changes among tissues were compared by scaling transcripts per million. Meanwhile, relationships between DEGs and DAMs in typical HLB-affected pathways were analyzed.
Materials and Methods
Plant Materials and Inoculation
Seeds of Chongyi wild mandarin (C. reticulata) were sampled in Chongyi County, Jiangxi province, China. One-year-old seedlings were grafted with healthy (control) and CLas-infected buds from sweet orange trees. All the plants were maintained in the same greenhouse (at 25–28°C). The leaves were monitored biweekly by nested PCR to detect CLas. After 18 weeks, leaves, barks, and roots from CLas-positive and healthy seedlings were collected for paraffin sectioning, RNA-Seq, and ultra-high performance liquid tandem chromatography quadrupole time of flight mass spectrometry (UPLC-QTOFMS).
Paraffin Sectioning
Tissues were fixed in formaldehyde-acetic acid-ethanol fixative, dehydrated in ethanol, and then embedded in paraffin. After being deparaffinized with xylene and stained with a fast green, the sliced sections were analyzed with a DM6 B (Leica, Wetzlar, Germany) microsystem combined with a DFC 7000T (Leica, Wetzlar, Germany) camera.
Transcriptome Profiling and Data Processing
The RNA-Seq libraries were constructed, and high-throughput sequencing was carried out by Novogene (Beijing, China) using HiSeq 2000 (Illumina, San Diego, CA, United States). All sequencing adaptors, unknown nucleotides, and low-quality reads (quality score <20) were removed from the raw reads, and the resulting clean reads were used in subsequent analyses. HISAT2 (Kim et al., 2015) was performed to map the clean reads to the sweet orange (Clonorchis sinensis) genome (Xu et al., 2013). StringTie was used to estimate the abundance of transcripts in each sample (Pertea et al., 2016), and then the information of all the transcripts was assembled into a single gene transfer format (GTF) file using the “merge” option. Using the resulting GTF file as reference, StringTie was again used to obtain total gene expression information. Subsequently, the R subread package was applied to compute the number of uniquely mapping reads unambiguously attributed to each gene (Liao et al., 2019), which was used as input in DESeq2 (Love et al., 2014). A matrix of TPM per gene across all samples was generated to compare gene expression differences among the tissues.
DEG Detection and Functional Enrichment
To check for similarities among these samples, a principal component analysis (PCA) in DESeq2 was performed based on per-gene unique reads counts. Genes with a total read number across all samples ≥18 were kept. Based on the same dataset, a clustering analysis was also performed using hclust in the “the stats” package in R (http://www.R-project.org) to detect clusters among all the 18 samples. Samples in unreasonable clusters were removed.
The DESeq2 package was used for DEGs detection between CLas-infected barks (B), leaves (L), and roots (R), and their corresponding controls (CY), namely, HLB_B vs. CY_B, HLB_L vs. CY_L, and HLB_R vs. CY_R. Before analysis, genes with several reads less than the total number of samples were filtered. Genes with a false discovery rate (FDR) <0.05 and log2 (Fold Change) [|log2(FoldChange)| >1] were considered as putative DEGs. Sequence similarity comparisons of the C. sinensis genome were performed with Arabidopsis thaliana using Blastx. Using C. sinensis as background, KOBAS 3.0 (Ai and Kong, 2018) was employed to annotate the Kyoto Encyclopedia of Genes and Genomes (KEGG) pathways of DEGs.
Expression Normalization and Expression Pattern
Genes with zero TPM were filtered. The absolute gene expression, using normalized TPM value, was calculated according to Brawand et al. (2011). In detail, genes with a TPM value in the interquartile range (25–75%) of each sample were selected. Variance per gene across all samples was calculated to yield 1,000 least-varying genes and obtain median TPM values in each sample. Then, these median TPM values were used to derive the scaling factor of each sample, which was then utilized to normalize all the TPM values. The normalized TPM value matrix of all the genes was then used to estimate gene expression differences among all the tissues.
To investigate gene expression variations among the tissues, common DEGs identified in all three comparisons were filtered to estimate gene expression patterns among the tissues. Based on the normalized TPM values of these DEGs, the average TPM of each gene across biological replicates was presented as the expression level of this gene in the corresponding tissue, and the average was estimated by dividing the maximal value in all the tissues to generate relative expression profiles (Darbellay and Necsulea, 2020). Finally, the relative expression profiles were clustered with the K-means algorithm in R to investigate gene expression patterns among the barks, leaves, and roots.
Metabolome Profiling and Data Processing
The UPLC-QTOFMS analysis was carried out by Biotree (Shanghai, China). Quality control (QC) samples were prepared by mixing the same volume from all the samples. The UPLC-QTOFMS analysis was performed on 1290 Infinity LC System (Agilent, Sta. Clara, CA, United States) coupled to an Agilent 6538 Accurate-Mass Quadrupole Time-of-Flight (Q-TOF) (Agilent, Sta. Clara, CA, United States) mass spectrometer. The metabolomic data were collected in a centroid mode and the mass range was set at 50–1,100 m/z using an extended dynamic range.
The raw metabolomics data were converted into a normal file (.mzXML) using MSConvert (ProteoWizard 3.0). MZmine 2.1 (Pluskal et al., 2010) was applied for identifying features, deisotopes, feature alignments, and gap-filling to avoid missing some features in the first alignment algorithm. After removing the complexes, all adducts were searched against an internal retention time metabolite library. Data on both positive and negative ions were subjected to statistical analysis. Tables with metabolite peaks (mz/rt) of all the three tissues under both healthy and symptomatic conditions were formatted as comma-separated values (.csv). The resulting three-dimensional data of the peak number, sample name, and normalized peak area were fed to the SIMCA14.1 software package (V14.1; MKS Data Analytics Solutions, Umea, Sweden) for orthogonal projections to latent structures discriminant analysis (PLS-DA).
The DAMs were selected based on a statistically significant threshold of variable influence on projection (VIP) values acquired from the PLS-DA (VIP ≥1 and p ≤ 0.05). MetaboAnalyst was employed for KEGG enrichment analysis (Xia and Wishart, 2016). The DAVID Functional Annotation tool was applied to investigate the interactions of DEGs and DAMs in pathways (Huang et al., 2009).
Putative Marker Gene Identification for Symptomatic Tissues
Gene expression specificity across tissues was estimated using the equation: , where rirepresents the ratio between the expression level (normed TPM value) of a gene in sample i and the maximal expression level across samples (Liao et al., 2006). The average tau value of all the biological replicates was calculated and used as the specific expression level for a given tissue. The tau value ranged from 0 to 1. A higher tau value indicated greater variation in expressional level across tissues, namely, higher tissue specificity.
To identify the putative markers for HLB infection, genes with expression levels (TPM) ≥2 in at least one sample of each tissue were selected. The putative marker genes should have a high expression specificity index (tau ≥ 0.85) in a specific healthy tissue and maximal expression in the corresponding symptomatic tissue (Liao et al., 2006). Due to the shortage of Chongyi samples, some putative marker genes were verified by qRT-PCR with the CLas-infected and healthy leaves from C. sinensis.
Results
Confirmation of HLB and Anatomical Aberrations in CLas-Infected Tissues
After 18 weeks of grafting, all the CLas-inoculated Chongyi seedlings were positive by Nested PCR amplification (Supplementary Figure 1). Subsequently, anatomical differences between the CLas-positive and healthy tissues were compared. More enlarged vascular bundles of lateral veinlets and air cavities were observed in the CLas-infected leaves (Figures 1A,B). Cells of phloem, xylem, parenchyma, and cortex arranged irregularly after CLas infection (Figure 1). Particularly, more sclereids and phloem fibers accumulated in the CLas-infected barks (Figures 1E,F). In the CLas-infected roots, the cortical tissue collapsed and separated from the epidermis (Figures 1G,H). Approximately 1 year after inoculation, the remaining CLas-positive Chongyi seedlings died out. Therefore, Chongyi was considered to be susceptible to HLB.
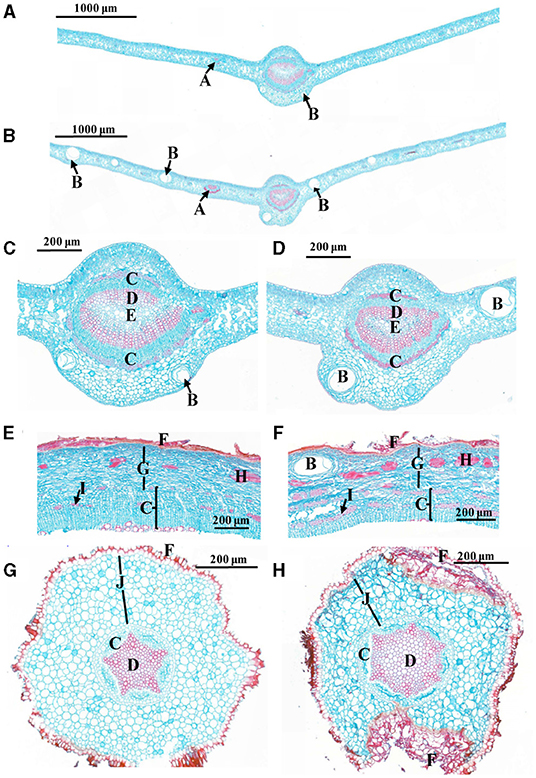
Figure 1. Comparisons of cross-sections between healthy (A,C,E,G) and C. L. asiaticus (CLas)-infected (B,D,F,H) tissues. (A–D) Leaves; (C,D) are the close-ups of midvein from (A,B); (E,F) barks; (G,H) roots. A: vascular bundle of lateral veinlet; B: air cavity; C: phloem; D: xylem; E: pith; F: epidermis; G: parenchyma cell; H: sclereid; I: phloem fiber; J: cortex.
DEGs and DAMs Induced by CLas Inoculation
Around 83.34–86.06% of the clean reads could be mapped to the C. sinensis genome (Supplementary Table 1). Genes with a total read number over 18 were used for PCA analysis. The PCA results indicated that principal component 1 (PC1) could explain about 75% variances, and PC2 could explain about 20% variances (Figure 2A). All of the samples could be divided into three main clusters in PC1 according to the tissue type, and PC2 separated these samples depending on whether a sample was healthy or CLas-infected. An Hclust analysis with all of the expressed genes yielded similar results, i.e., there were three main clusters (leaves, roots, and barks), and the root samples were clustered with the bark samples (Figure 2B). However, the two results both indicated that HLB_L1 was clustered with the healthy leaves and that HLB_B3 was clustered with the healthy barks. Therefore, HLB_L1 and HLB_B3 were excluded from the subsequent analysis.
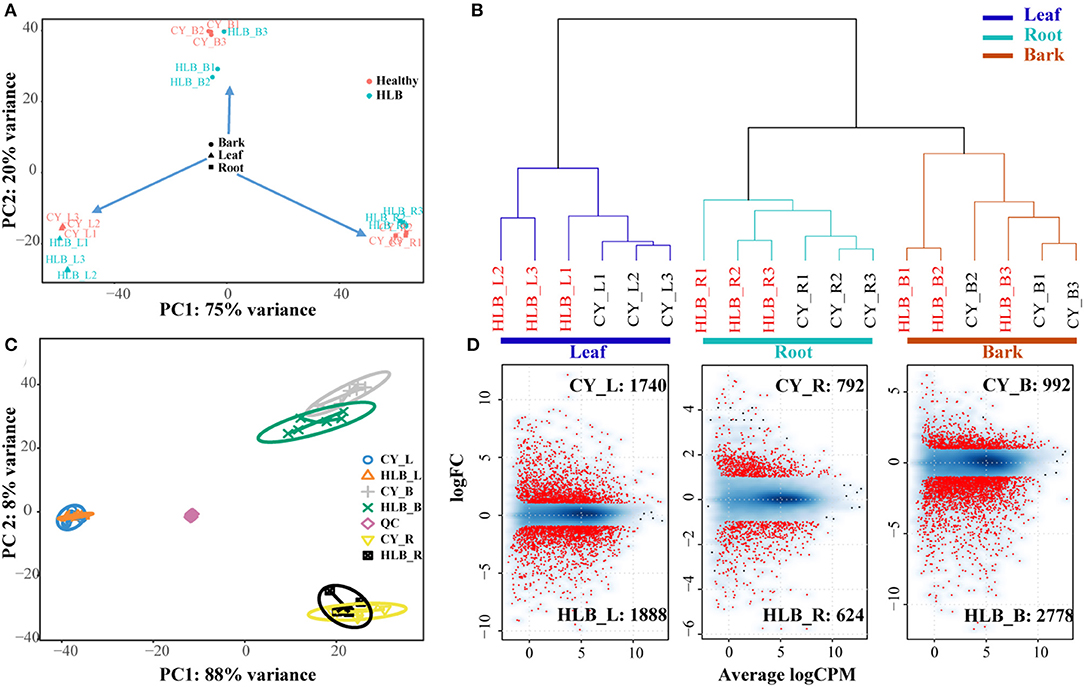
Figure 2. Cluster analysis of all the differentially expressed genes (DEGs) and detected metabolites between CLas-infected and healthy tissues. (A) Principal component analysis (PCA) analysis of all the samples based on all the expressed genes; (B) Hclust analysis of all the samples based on all the expressed genes; (C) sPLS-DA analysis of all the samples based on all of the metabolites; (D) analysis of DEG detection: a smooth scatter was used to convert the number of points in each plot coordinate into a vector of colors representing the local point density.
For the metabolites, there were 2,541 and 2,003 peaks identified in the negative and positive ion modes. Of these peaks, 130 and 193 could be mapped as known metabolites, which included amino acids, organic acids, sugars, polyamines, nitrogenous compounds, and polyphenols. Three tissue-specific groups were clustered by the sPLS-DA, whereas PC1and PC2 explained 88 and 8%variances among all of the metabolomic samples, respectively (Figure 2C). From the heatmap of all the detected metabolites (Supplementary Figure 2), more noticeable differences were observed among the CLas-infected and healthy tissues.
There were 3,628 DEGs in the leaves, 3,770 in the barks, and 1,716 in the roots, among which 1,888 in HLB_L, 2,778 in HLB_B, and 624 in HLB_R were upregulated, and 1,740 in CY_L, 992 in CY_B, and 792 in CY_R were upregulated (Figure 2D). Meanwhile, 3,240 DEGs in the barks (Supplementary Table 2), 3,038 in the leaves (Supplementary Table 3), and 1,216 in the roots (Supplementary Table 4) had citrus gene IDs. For the KEGG pathway enrichment analysis, 24,376 coding sequences of the longest transcript in C. sinensis were extracted to represent the corresponding genes. DEGs with a coding gene sequence were used as input sequences in KOBAS.
Metabolite intensities of the healthy and CLas-positive samples among the three tissues were compared. Subsequently, 62 DAMs in the barks (Table 1), 71 in the leaves (Table 2), and 50 in the roots (Table 3) could be matched to a corresponding KEGG compound ID. The majority of DAMs in the CLas-infected barks and leaves were increased, but half in the CLas-infected roots were decreased, suggesting that HLB affected roots more greatly at the metabolic level.
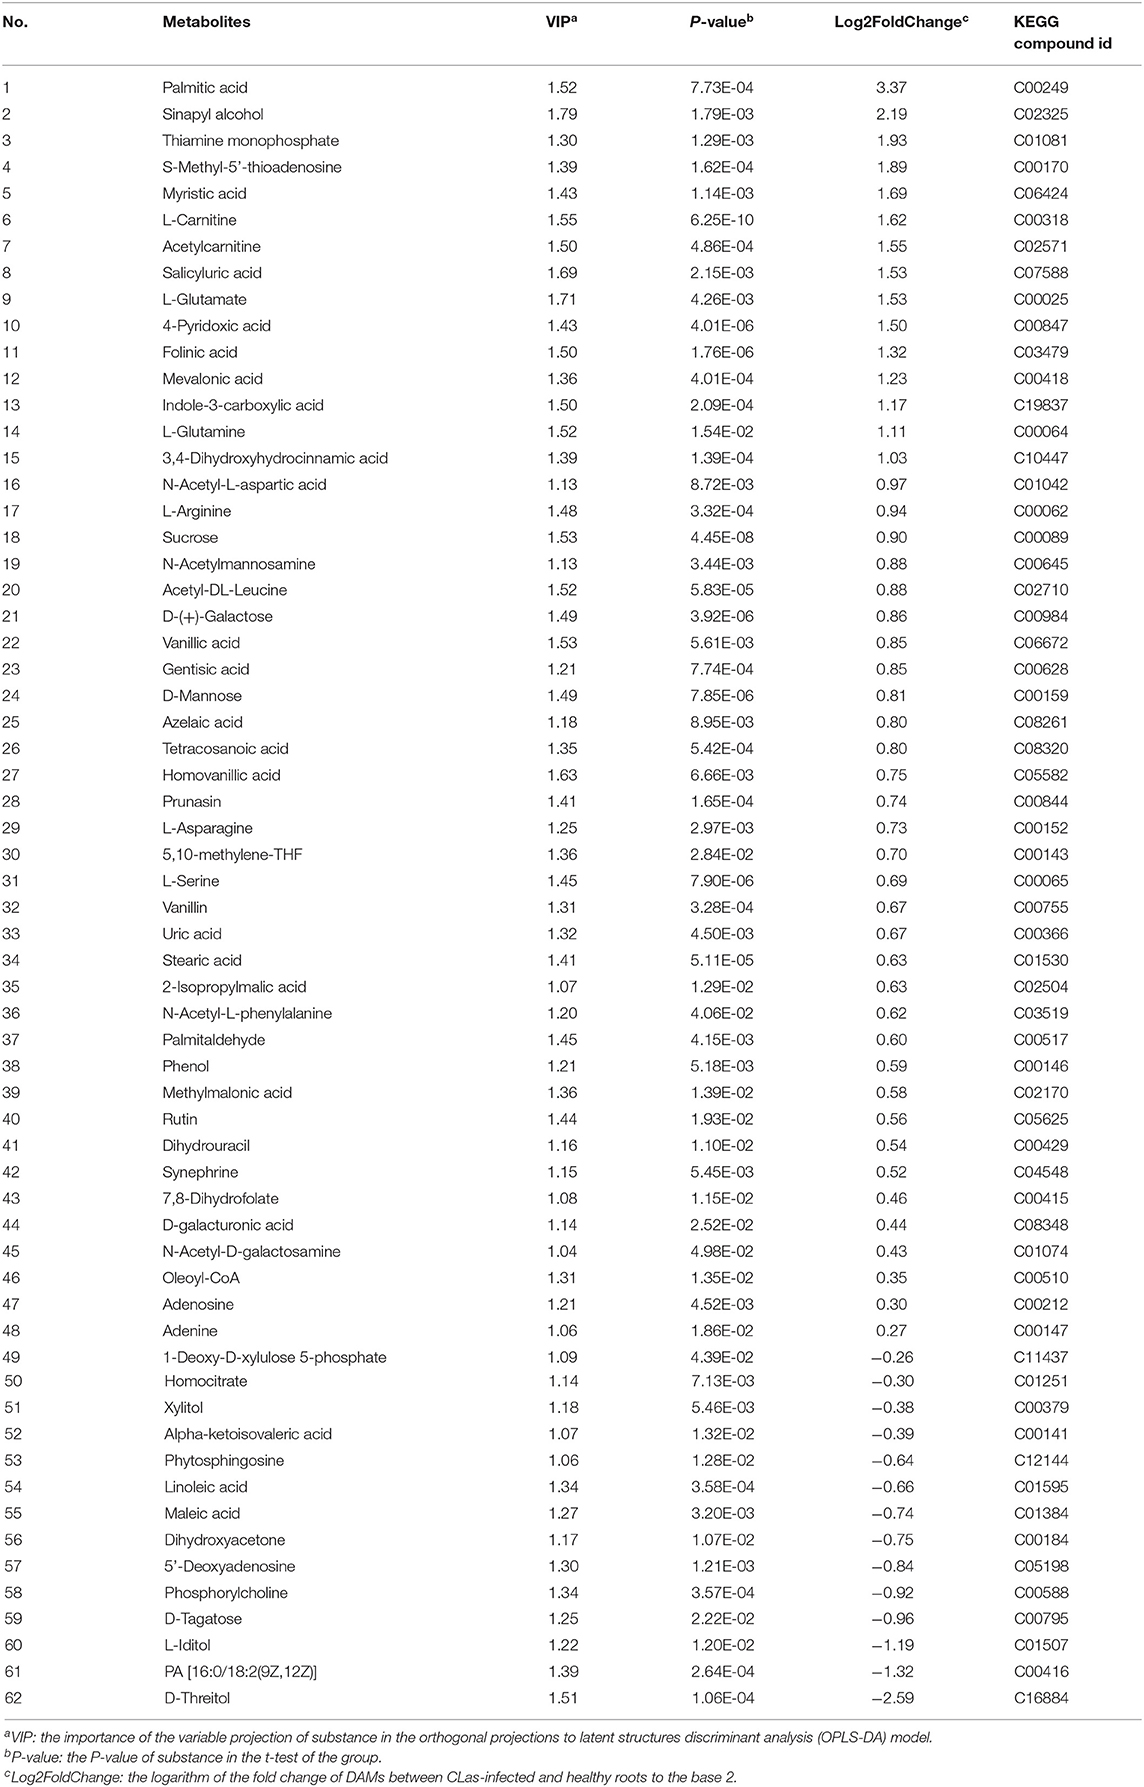
Table 1. Differentially accumulated metabolites (DAMs) between C. L. asiaticus (CLas)-infected and healthy barks.
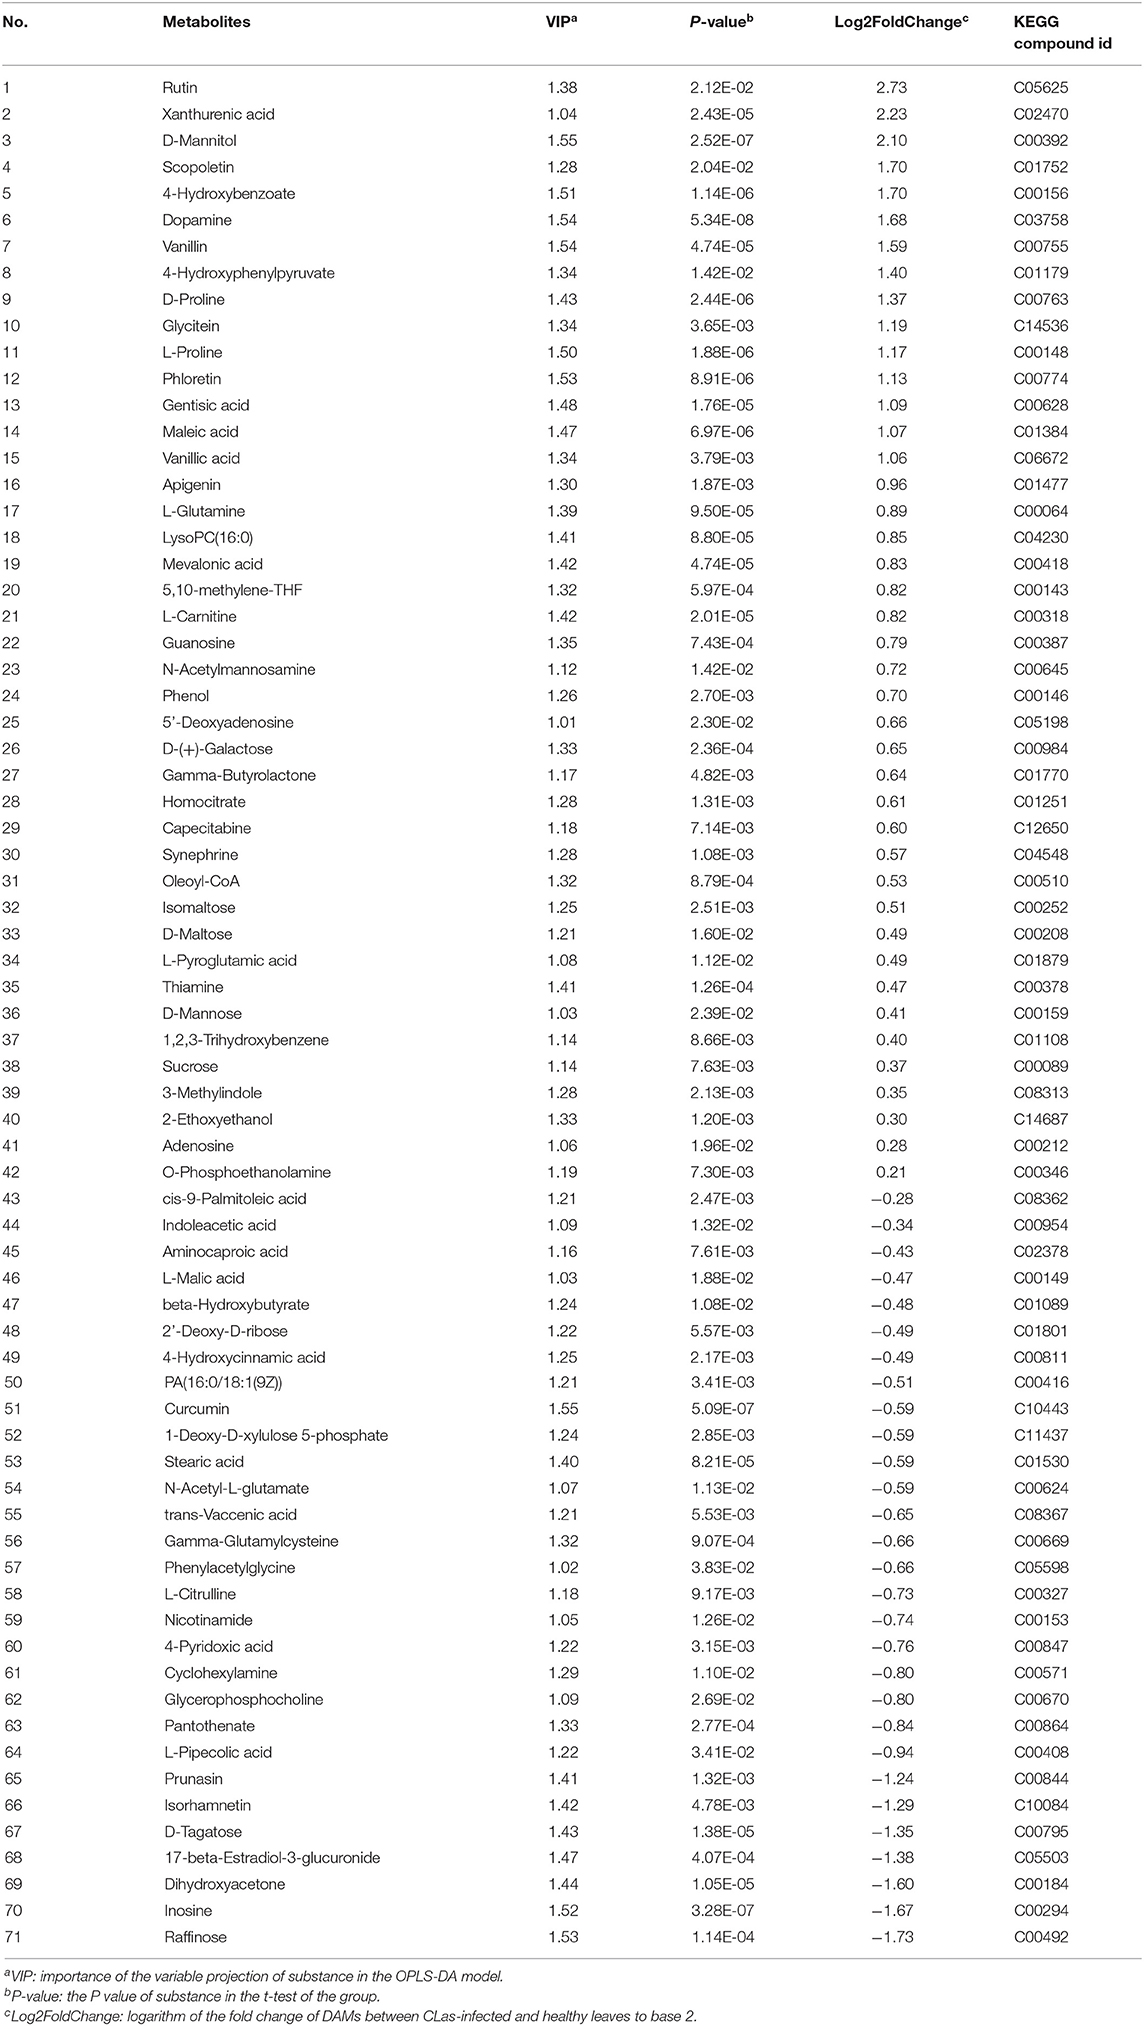
Table 2. DAMs between CLas-infected and healthy leaves.
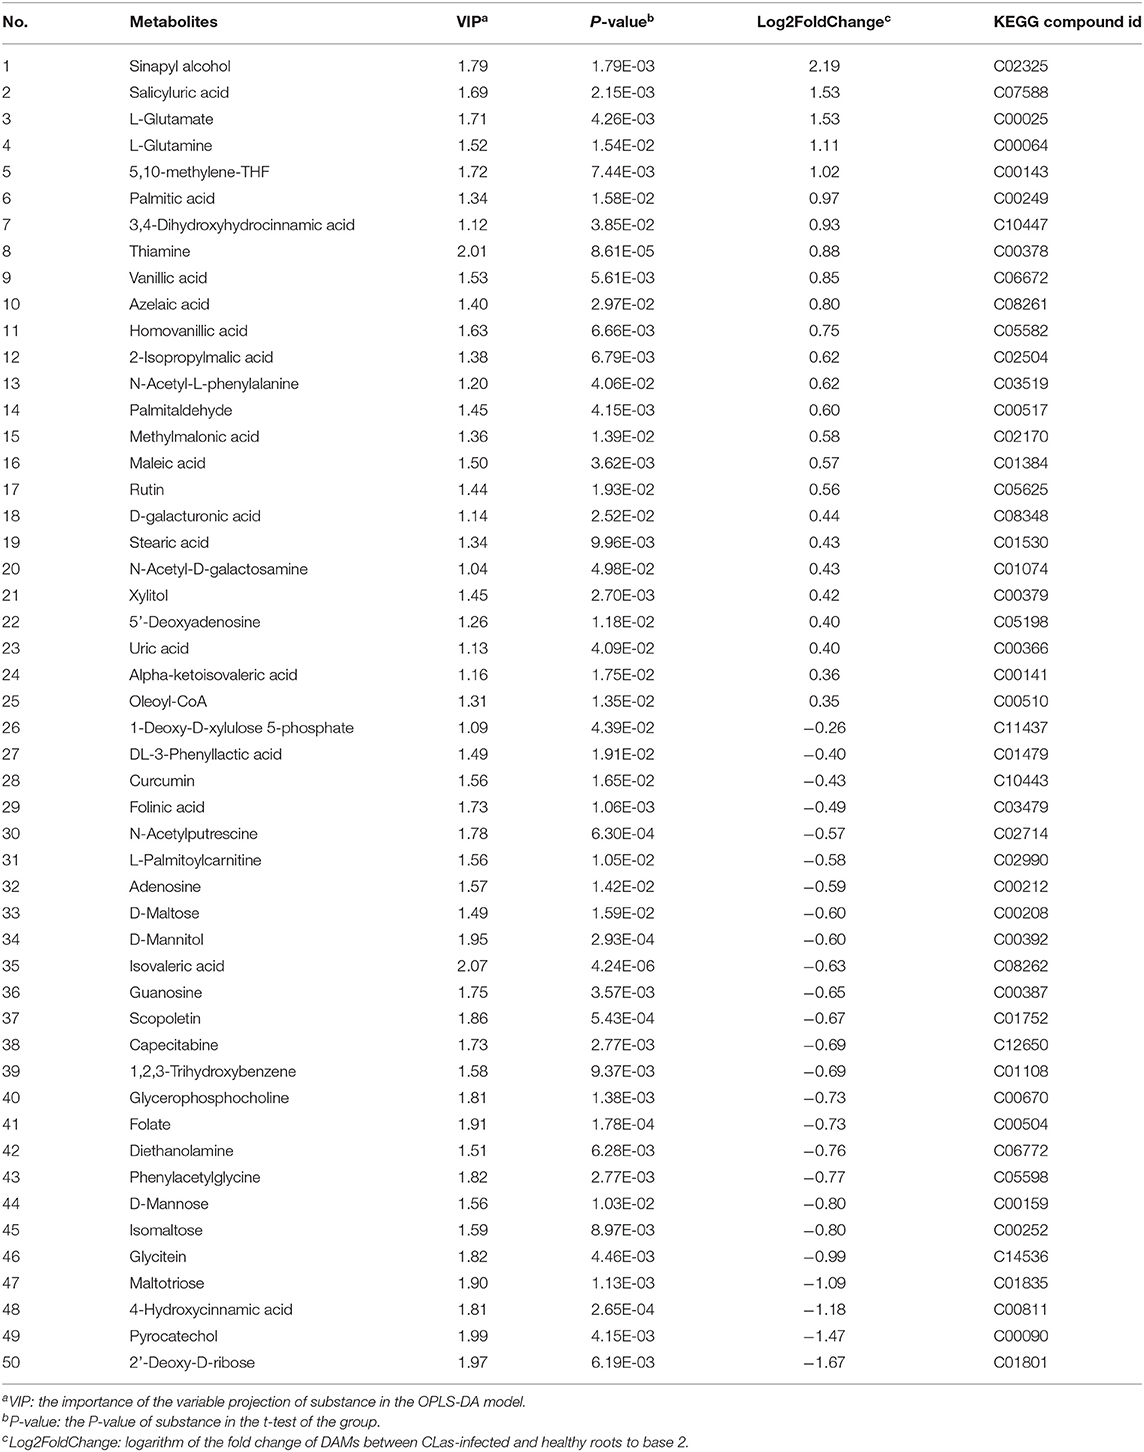
Table 3. DAMs between CLas-infected and healthy roots.
Based on the number of DEGs enriched in the KEGG pathways (Supplementary Tables 5–7), the top 10 pathways in each tissue are shown in Figure 3A. Moreover, “metabolic pathways” had the highest number of DEGs in all the three tissues (barks: 300 DEGs, corrected p-value (CP) = 6.10E-5; leaves: 243 DEGs, CP = 0.232; roots: 80 DEGs, CP = 0.832), followed by “biosynthesis of secondary metabolites” (barks: 205 DEGs, CP = 4.23E-07; leaves: 181 DEGs, CP = 0.0001). Among all the significantly enriched pathways, “starch and sucrose metabolism,” “glycosaminoglycan degradation,” “plant-pathogen interaction,” “nitrogenmetabolism,” “carotenoid biosynthesis,” and “plant hormone signal transduction” were shared in all three tissues.
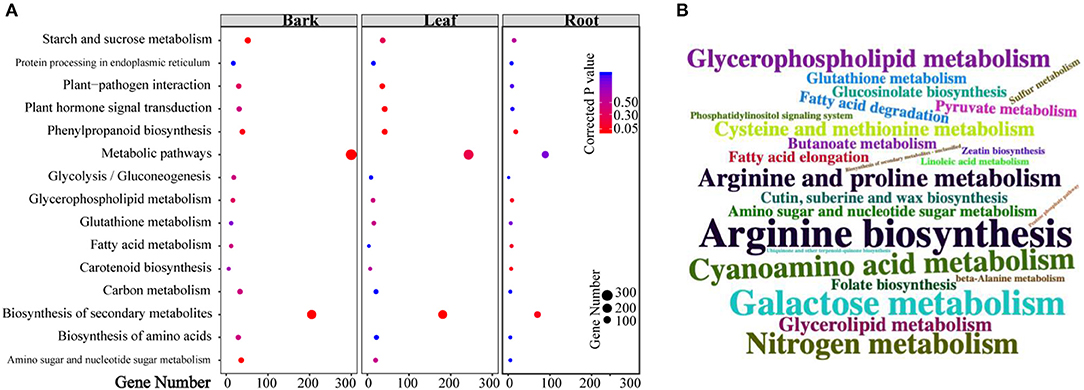
Figure 3. Kyoto Encyclopedia of Genes and Genomes (KEGG) pathway enrichment analysis of differentially expressed genes (DEGs) and differentially accumulated metabolites (DAMs). (A) Pathways that enriched top10 gene numbers in each comparison between CLas-infected and healthy tissues; (B) pathways that enriched detected metabolites: larger size means more metabolites were detected in this pathway.
Similarly, more DAMs were enriched in “metabolic pathways” and “biosynthesis of secondary metabolites” in the three tissues (Figure 3B; Supplementary Tables 8–10). In addition, 56 pathways in the barks (Supplementary Table 11), 54 in the leaves (Supplementary Table 12), and 45 in the roots (Supplementary Table 13) displayed significant changes in both gene expression and metabolite content, suggesting that the results of transcriptomics and metabolomics were consistent with each other.
Common DEGs in the Three Tissues Exhibited Eight Expression Patterns
To compare expression variation among the three tissues, the expression patterns of common DEGs were analyzed. There were 304 common DEGs shared by the three tissues, while 1,884, 1,930, and 6,30 were specific to the leaves, barks, and roots, respectively (Supplementary Figure 3a). The clustering result from these 304 DEGs revealed that there was an increase in the sum of squares when the number of groups (K) was reduced from nine to eight (Supplementary Figure 3b). Thus, it might be proper to divide the 304 common DEGs into eight different expression patterns. As shown in Figure 4, DEGs in clusters 2 (N = 63), 3 (N = 43), 4 (N = 33), 6 (N = 4 2), and 7 (N = 56) were upregulated in the CLas-infected tissues, but the DEGs in clusters 1 (N = 29), 5 (N = 19), and 8 (N = 18) were downregulated.
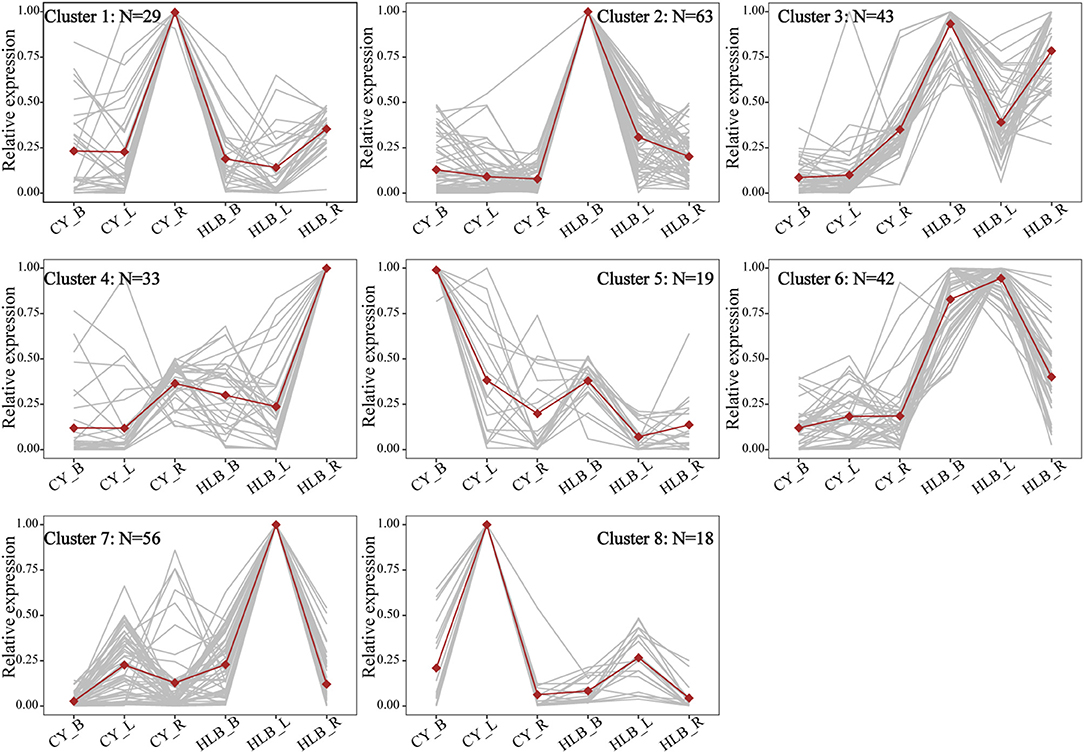
Figure 4. Expression patterns of common DEGs among all tissues. CY_B, CY_L, and CY_R represent healthy barks, leaves, and roots, respectively. HLB_B, HLB_Y, and HLB_R represent CLas-infected barks, leaves, and roots, respectively. Normalized TPM values were averaged across replicates for each tissue. Dots represent the average profiles of genes belonging to each cluster. Gray lines represent the profiles of individual genes from a cluster.
Especially, six common DEGs of the three tissues involved in starch and sucrose metabolism are shown in Supplementary Figure 4, namely, pectinesterase (PME1), probable trehalose-phosphate phosphatase D (TPPD), UDP-glucuronate 4-epimerase 1 (GAE1), probable pectinesterase/pectinesterase inhibitor 44 (PME44), beta-glucosidase 40 (BGLU40), and trehalose 6-phosphate phosphatase (TPPA). All of them were upregulated in HLB_L/B/R, except for BGLU40, which was downregulated in HLB_R. Therefore, significant changes among the pathways related to carbohydrates occurred at the transcriptional level.
CLas-Infected Tissues Had Higher Transcripts Per Kilobase Per Million (TPM) Values and More Genes That Reached the Maximal Expression (GME)
Expression levels of a total of 19,558 genes were normalized by scaling their TPM values, and the average of log2(normed TPM) of gene expression in biological replicates was represented as the expression level of this gene in the corresponding tissue. Median TPM values in the CLas-infected leaves, barks, and roots were 0.722, 0.657, and 0.485, respectively, and those in the corresponding control tissues were 0.661, 0.467, and 0.468. However, the TPM distribution of all the expressed genes was nearly the same among all the tissue samples (Figure 5A). As for the percentage of GMEs in each tissue, 24, 18, and 15% of the genes reached their maximal expressions in the CLas-infected leaves, barks, and roots, respectively, which were higher than those in the controls (Figure 5B). Higher TPM values and more GMEs in the CLas-infected tissues suggested that HLB infection might cause an overall increase in transcript accumulation.
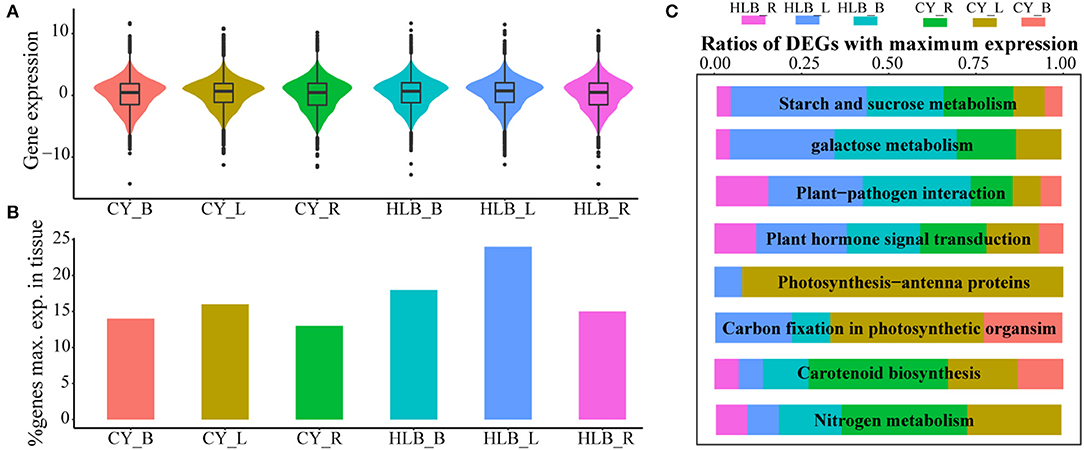
Figure 5. Relative gene expressions among all tissues. (A) Gene expression distributions among all tissues; (B) comparison of the expressed gene number with maximal expression among the three tissues. Genes of each tissue with maximal expression are computed based on average expression values across biological replicates; (C) relative ratios with maximal gene expression among eight typical HLB-affected pathways in all the tissues.
However, GMEs in eight individual pathways varied (Figure 5C). In the pathways related to “starch and sucrose metabolism,” “galactose metabolism,” “plant-pathogen interaction,” and “plant hormone signal transduction,” the CLas-infected tissues had more genes that reached their maximal expression levels than the healthy tissues, suggesting that HLB significantly affected these pathways, especially in the CLas-infected leaves and barks (Figure 5C). Nevertheless, “carbon fixation in photosynthetic organism,” “photosynthesis-antenna protein,” “carotenoid biosynthesis” and “nitrogen metabolism” had more GMEs in the healthy tissues than in the CLas-infected tissues, indicating that HLB suppressed related physiological processes, particularly photosynthesis in leaves and carotenoid and nitrogen metabolism in roots (Figure 5C).
DEGs Related to Early Signal Perception and Transduction
Plants possess an enormous number of cell-surface localized and intracellular receptors to perceive early immunogenic signals, containing pattern recognition receptors (PRRs, namely, leucine-rich repeat receptor-like proteins and kinases) and nucleotide-binding–leucine-rich-repeat (NLR) receptors consisting of toll/interleukin-1 receptor/resistance (TIR) and coiled-coil (CC) types (Monteiro and Nishimura, 2018; Wan et al., 2019). There were 41, 60, and 38 DEGs related to PRRs in HLB_B/L/R, respectively (Supplementary Table 14). The majority of PRRs were upregulated in HLB_B/R but were downregulated in HLB_L (Figure 6). Surprisingly, two well-known PRRs, flagellin-sensing 2 (FLS2) and EF-Tu receptor (EFR), were identified as DEGs in HLB_L/R but not in HLB_B (Supplementary Table 14). As for NLRs, only one CC-type NLR was found in HLB_B, but 30, 23, and 12 TIR-type NLRs were identified in HLBs_B/L/R, respectively (Supplementary Table 15). All the NLRs were annotated as disease resistance proteins whose transcriptional expressions were all nearly upregulated in HLB_B, but half of them were downregulated in HLB_L (Figure 6). The transcriptional expressions of other upstream immunity-related signaling protein kinases, such ascysteine-rich receptor-like kinases (CRKs), glutamate-like receptors (GLRs), mitogen-activated protein kinase kinase kinases (MAPKKKs), and mitogen-activated protein kinases (MAPKs), were also significantly changed in HLB_L/B/R but varied among the tissues (Figure 6). Calcium- and phytohormone-mediated signal transduction was mentioned in the following parts.
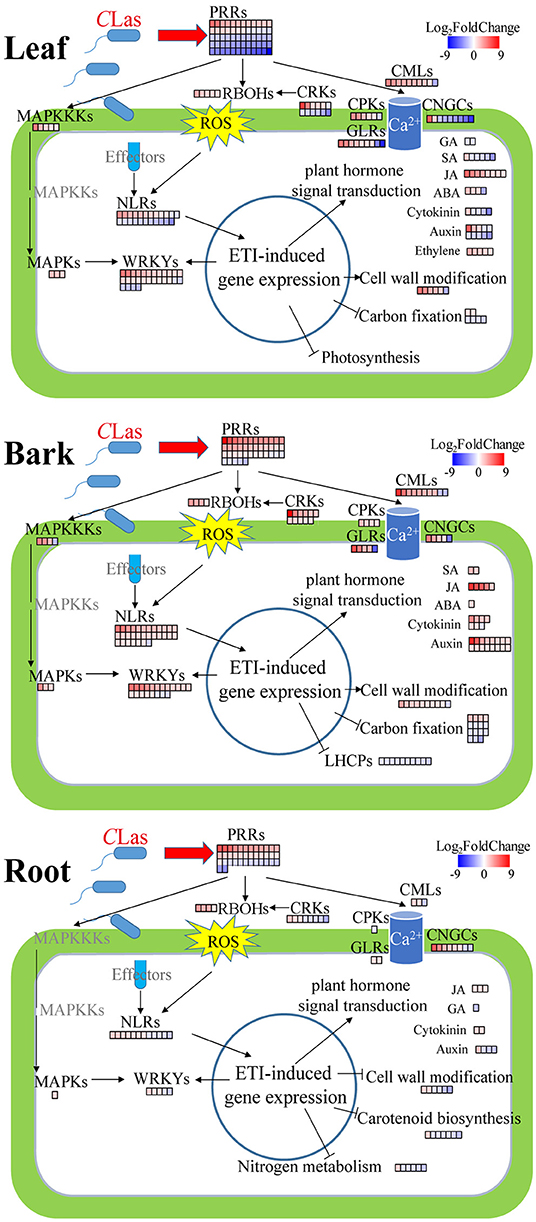
Figure 6. Summary of defense-related DEGs in CLas-infected leaves, barks, and roots. Red, upregulation; blue, downregulation. PRRs, pattern recognition receptors; RBOHs, plant respiratory burst oxidase homologs; ROS, reactive oxygen species; MAPKKKs, mitogen-activated protein kinase kinase kinases; MAPKs, mitogen-activated protein kinases; CMLs, calmodulin-like proteins; CPKs, calcium-dependent protein kinases; CNGCs, cyclic nucleotide-gated channels; CRKs, cysteine-rich receptor-like kinases; GLRs, glutamate-like receptors; NLRs, nucleotide-binding–leucine-rich-repeat receptors; ETI, effector-triggered immunity. MAPKKKs, MAPKs, CPKs, CRKs, and GLRs are immunity-related signaling protein kinases. These DEGs are listed in Supplementary Tables 16–20. It is to be noted that the phytohormone-related DEGs presented in this Figure are involved in signaling instead of synthesis or degradation.
DEGs Involved in Plant-Pathogen Interaction and Plant Hormone Signal Transduction
In the “plant-pathogen interaction” pathway, there were more GMEs in the CLas-infected tissues (Figure 5C), indicating that CLas infection triggered the innate immunity system to fight against the pathogen. In this pathway, there were 31% GMEs in HLB_B (6% in CY_B), 27% in HLB_L (8% in CY_L), and 15% in HLB_R (12% in CY_R). These findings suggested that HLB might cause more defense responses in barks and leaves than in roots after 18 weeks of inoculation. There were 30, 36, and 9 DEGs related to plant-pathogen interaction enriched in the barks, leaves, and roots, respectively (Supplementary Table 16). These DEGs included calmodulin-like proteins (CML3, 8, 16, 18, 23, 25, 27, 30, 38, 41, 42, and 44), calcium-dependent protein kinases (CPK2, CPK5, and CPK9), plant respiratory burst oxidase homologs (RBOHB, RBOHC, RBOHD, and RBOHF), cyclic nucleotide-gated ion channels (CNGC1, CNGC2, and CNGC8), enhanced disease susceptibility 1 (EDS1), heat shock protein 90s (HSP90-1 and HSP90-5), disease resistance proteins (RIN4, RPM1, and RPP13), WRKYs (WRKY22 and WRKY33), etc.
In the “plant hormone signal transduction” pathway, the number of GMEs increased from 7 to 21% in the barks and 15 to 26% in the leaves, but it decreased from 19 to 12% in the roots after CLas infection (Figure 5C). There were 31, 42, and 10 DEGs in the barks, leaves and roots, respectively (Supplementary Table 17), including four DEGs mainly related to abscisic acid (ABA), 28 related to auxin, 11 related to cytokinin, five related to ethylene, three related to gibberellin (GA), eight related to jasmonic acid (JA), and seven related to salicylic acid (SA). Among these DEGs, there were genes encoding kinases, such as Arabidopsis histidine kinase 4 and ethylene receptor 2. Some DEGs encoded transcription factors, such as ethylene insensitive 3 and TGACG-binding factors (TGAs). Several non-expresser of pathogenesis-related genes (NPR) were also identified, such as NPR3 and NPR5. Interestingly, all the five DEGs related to ethylene were universally upregulated and exclusively found in the CLas-infected leaves. Although the DEGs related to SA were mainly detected in the CLas-infected leaves, five out of the six were downregulated. Moreover, all the DEGs related to JA were upregulated regardless of tissue type. Expressions of some DEGs involved in plant-pathogen interaction and plant hormone signal transduction are illustrated in Figure 6.
HLB Affected the Accumulation of Transcripts and Metabolites Related to Carbohydrate Metabolism
At the transcriptional level, a total of 74 DEGs in “starch and sucrose metabolism” and 23 in “galactose metabolism” were detected (Supplementary Table 18), and more GMEs in HLB_L, as well as HLB_B, were observed in these two pathways (Figure 5C). Some of the DEGs were suggested to be involved in cell wall modification, and the majority of their expressions were upregulated in HLB_L/B (Figure 6). Integrated transcriptomics and metabolomics results revealed that these two pathways were enriched in both the leaves and the barks with the detection of related DEGs and DAMs, but that no related DAMs were detected in the roots (Figure 7). To be specific, significantly increased sucrose and maltose contents in HLB_L were accompanied by the downregulation of two cell wall invertase (CWINV), β-fructofuranosidase 1 (ATBFRUCT1) and CWINV4, and by the up-regulation of vacuolar invertase, At-β-Fructosidase4 (ATBETAFRUCT4), β-amylase1 (BAM1), and BAM3in “starch and sucrose metabolism”. In the “galactose metabolism” of HLB_L, the contents of sucrose, D-mannose, D-myo-inositol, α-D-galactose, and raffinose were all elevated, and so were the transcripts of α-galactosidase1 (agaL1), hexokinase-like 1 (HKL1), seed imbibition protein 1/2 (SIP1/2, genes encoding raffinose synthase. In the barks, the upregulation of sucrose synthase2 (SUS2), SUS6, and agaL2 promoted sucrose production. The upregulation ofHKL1 and hexokinase 1 (HXK1) elevated the accumulation of α-D-galactose (Figure 7).
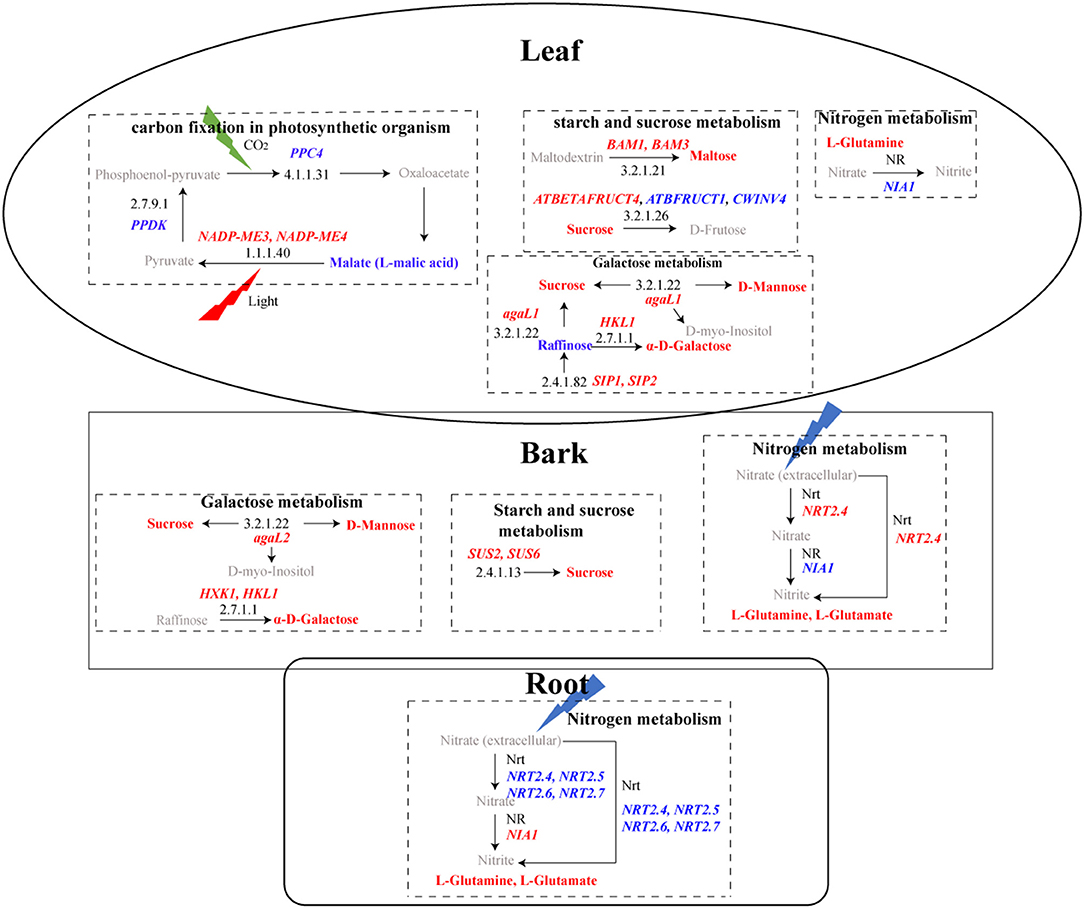
Figure 7. KEGG pathways with DEGs and DAMs in leaves, bark, and roots. In the rectangular box, pathways are represented in bold black, and black numbers represent the KEGG ID of enzymes. Upregulated genes are in red bold italicized words, while downregulated genes are in blue bold italicized words. The red bold represents upregulated metabolites, while the blue bold represents downregulated metabolites. Gray represents metabolites that were not detected.
HLB Altered the Accumulation of Photosynthesis-Related Transcripts and Metabolites
Two photosynthesis-related KEGG pathways were enriched: “photosynthesis-antenna protein” and “carbon fixation in photosynthetic organism”. The genes related to photosynthesis-antenna protein all belonged to the light-harvesting chlorophyll a/b-binding protein (LHCP) family (Supplementary Table 19). These 12 LHCPs only reached their maximum expression in the healthy leaves (Figure 5C) and were universally downregulated in the CLas-infected barks (Figure 6). Because their fragments per kilobase of exon model per million mapped fragments in the CLas-infected leaves/barks/roots were 788, 211, and 1, respectively, these results indicated that photosynthesis mainly occurred in the leaves and was hampered by HLB.
There were 18 DEGs enriched in “carbon fixation in photosynthetic organism” (Supplementary Table 19) and more GMEs in the healthy leaves and barks (Figure 5C). Their expressions were downregulated in the CLas-infected tissues (Figure 6). Although the malate content in HLB_L was significantly higher and two NADP-dependent malic enzymes (NADP-ME3/4) were upregulated, the downregulation of phosphoenolpyruvate carboxylase 4(PPC4) and Pyruvate orthophcosphate dikinase (PPDK) may significantly reduce CO2 fixation in the leaves (Figure 7). Therefore, photosynthesis was severely impaired in the CLas-infected leaves.
HLB Regulated DEGs and DAMs Involved in Carotenoid Biosynthesis and Nitrogen Metabolism
Carotenoids are essential for physiological processes in plants, such as photosynthesis and the production of phytohormones (Cazzonelli and Pogson, 2010). The number of GMEs in the healthy and CLas-infected barks was the same, but it decreased from 40 to 7% in the roots after infection (Figure 5C). Moreover, DEGs encoding carotenoid cleavage dioxygenases (CCDs), phytoene synthase (PSY), Zeaxanthin epoxidase (ZEP), and the iron-binding protein D27 were all downregulated in HLB_R (Supplementary Table 20). Thus, carotenoid biosynthesis was negatively influenced by HLB in the roots (Figure 6).
Nitrogen metabolism was the only pathway with detection of both DEGs and DAMs in the three tissues (Figure 7). Even though there were no DEGs directly related to it, L-glutamine was over-accumulated in all the three CLas-infected tissues. Among the DEGs related to nitrogen metabolism (Supplementary Table 20), five high-affinity nitrate transporters (NRTs) were all downregulated in HLB_R (Figure 6), which might influence the absorption of nitrogen from the external environment to the plant.
Putative Marker Genes in Tissues for Diagnosis of HLB Infection
By scanning tau values among all the tissues, a total of 26 genes that had tau > 0.85 in the healthy tissues and reached their maximal expression in the corresponding CLas-infected tissues were considered as putative markers of HLB infection, including 13 genes in the leaves, 11 in the barks, and two in the roots (Supplementary Table 21).
Based on the expression patterns of these 26 putative markers, the samples were vertically divided into two main clusters: one containing CLas-infected roots and all the controls, and the other containing CLas-infected barks and leaves (Figure 8A). Horizontally, cluster 1 contained two markers in Root; cluster 2 included eight markers in Bark 1; cluster 3 consisted of seven in Leaf 1, three in Bark 2, and six in Leaf 2. Therefore, genes in Root, Bark 1, and Leaf 1 could be considered as specific markers in the roots, barks and leaves, respectively. In addition, genes in Bark 2 and Leaf 2 could be putative gene makers in both CLas-infected barks and leaves due to their similar expression patterns.
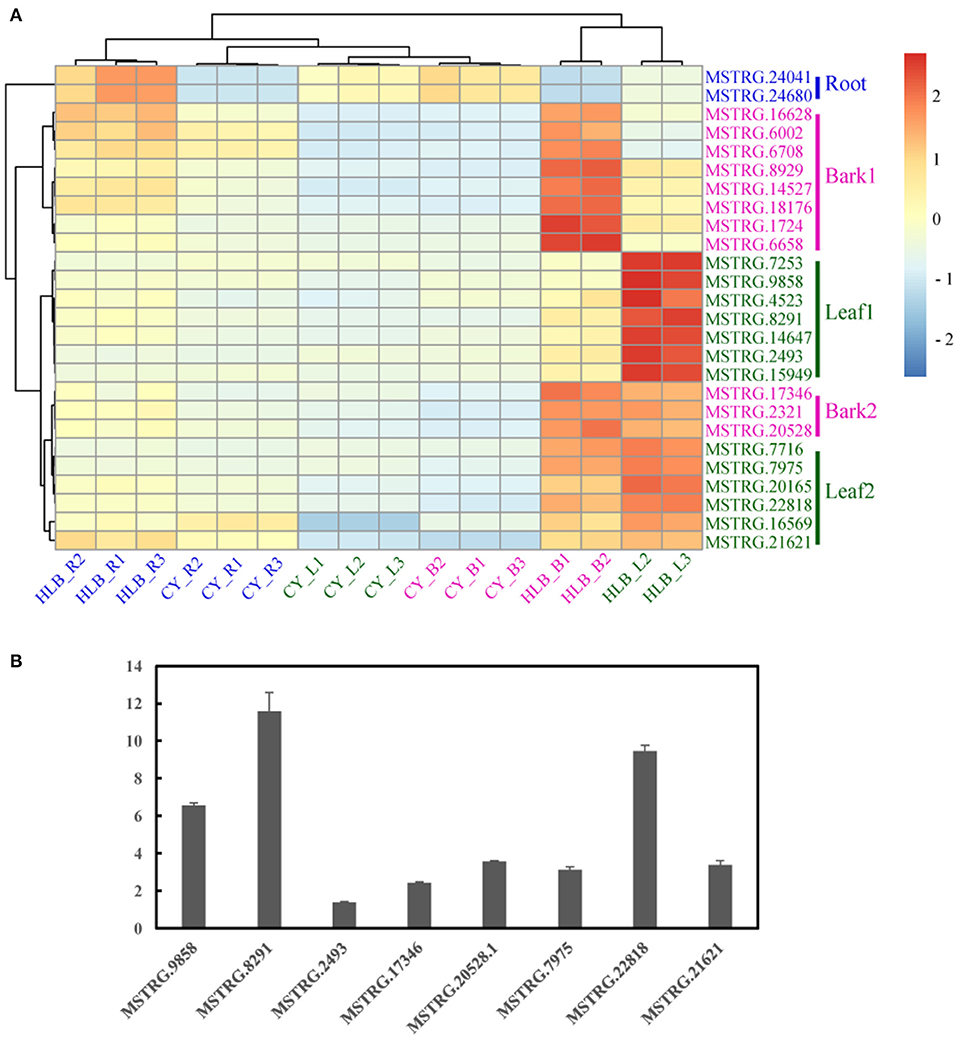
Figure 8. Heatmap of 26 putative marker genes in the three tissues (A) and quantitative reverse transcription (qRT)-polymerase chain reaction (PCR) verification of several putative marker genes in the leaves. (B) The expression level of the putative marker gene in healthy leaves was set as 1 in the qRT-PCR analysis.
Marker genes in Leaf 1, Bark 2, and Leaf 2 were verified by qRT-PCR using CLas-infected and healthy leaf samples from C. sinensis. Only eight putative marker genes could be consistently amplified, and their expression all increased in the CLas-infected samples (Figure 8B).
Discussion
Signal Perception and Propagation
Plants innately evolve a two-layered immune system, consisting of pattern-triggered immunity (PTI) and effector-triggered immunity (ETI) (Zhou and Zhang, 2020). The activation of the first layer of plant immunity PTI is initiated by intercellular receptors named PRRs, and the second layer, ETI, is conditioned by intracellular receptors named NLRs (Wan et al., 2019). NLRs contain TIR-type and CC-type NLRs depending on N-terminal singaling domains (Monteiro and Nishimura, 2018). In our study, many PRRs and NLRs were differentially expressed in the CLas-infected tissues (Supplementary Table 14; Figure 6), such as the two best characterized PRRs: flagellin-sensing 2 (FLS2) and EF-Tu receptor (EFR). Consistent with a recent report that PTI and ETI mutually potentiate to activate strong defenses against pathogens (Ngou et al., 2021), the majority of PRRs and NLRs in HLB_B/R were upregulated, but those in HLB_L were downregulated (Figure 6). A critical early signaling event connecting PTI and ETI is the production of reactive oxygen species (ROS) by NADPH oxidase respiratory burst oxidase homologs (RBOHs), such as RBOHB/D (Adachi et al., 2015; Yuan et al., 2021). However, the phosphorylation of WRKYs, essential components of both PTI and ETI, by MAPK is required for RBOHs-mediated ROS bursts (Adachi et al., 2015; Ngou et al., 2021). In addition, RBOHD could be directly activated by cysteine-rich receptor-like kinase 2 (CRK2) by phosphorylation, and the crk2 mutant was impaired in the full elicitor-induced ROS bursts as well as defense against pathogen attack (Kimura et al., 2020). In the barks, nearly all the above-mentioned genes were upregulated after CLas inoculation (Figure 6). Although the majority of CRKs (especially CRK2) were downregulated in HLB_L/R, the up-regulation of WRKYs, MAPKKKs, and MAPKs may compensate for the activation of RBOHB/C/D, whose transcripts were all significantly increased in these two tissues (Figure 6; Supplementary Table 16).
Most of the DEGs encoding other upstream immunity-related signaling protein kinases, glutamate-like receptors (GLRs), were upregulated in all the HLB tissues (Figure 6), which were suggested to be involved in various physiological pathways, such as Ca2+ signaling (Grenzi et al., 2021). Ca2+ is the most prominent second messenger that functions in a wide variety of environmental responses and developmental processes in plants (Lee and Seo, 2021). EF-hand calcium-binding proteins play a principal role in calcium signaling in plants, such as calmodulin (CaM), cyclic nucleotide-gated channel (CNGC), calmodulin-binding protein (CML), ATPase E1-E2 protein, and calcium-dependent protein kinase (CPK) (Mohanta et al., 2019). One CaM and three CNGCs were identified as DEGs in our study (Supplementary Table 16), which were reported to be critical in linking pathogen patterns to plant immunity (Tian et al., 2019). In total, 10 out of the 13 CMLs were upregulated (Supplementary Table 16), further proving their close relationship with plant defense (Lv et al., 2019). CPKs are calcium sensors and play important roles in ETI. For instance, CPK5 overexpressing Arabidopsis exhibited TN2-dependent autoimmunity and enhanced disease resistance (Liu et al., 2017). Meanwhile, CPK5 directly phosphorylated RBOHD in vivo, which was critical for rapid defense signal transduction and ROS-mediated cell-to-cell communication (Dubiella et al., 2013), consistent with the upregulation of CPK5 and RBOHD in HLB_L/B (Supplementary Table 16). In addition, ATPase E1-E2 protein, whose transcript significantly accumulated in HLB_L/B, was involved in Ca2+-translocation (Hayter and Peterson, 2004) (Supplementary Tables 2, 3). Since more than half of the DEGs identified in the plant-pathogen interaction pathway were calcium-related (Supplementary Table 16), calcium-based defense signal propagation is probably a pivotal event in CLas infection.
Multi-Immune Responses
To prevent biotrophic pathogen invasion, plant cells would initiate immune responses, such as autophagy, the ubiquitin-proteasome system, and programmed cell death (Greenberg and Yao, 2004; Üstün et al., 2018). There was one upregulated DEG annotated as autophagy-related protein (ATG) in each CLas-infected tissue, namely, ATG11 in the barks, ATG18H in the leaves and roots (Supplementary Tables 2–4). The ubiquitin-proteasome system contains various components, such as plant U-box (PUB) E3 ligases, FLS2, RBOHD (Trujillo, 2021), whose transcripts nearly all significantly accumulated in the CLas-infected tissues. These results suggested that HLB may trigger autophagy and the ubiquitin-proteasome system in Chongyi. In addition, transcripts of hypersensitive-induced reaction (HIR)1 and HIR2 significantly accumulated (Supplementary Table 2), which were reported to participate in the hypersensitive response (a programmed cell death phenomenon) and positively contributed to basal resistance against pathogen attack in the enhanced disease susceptibility 1 (EDS1)- and salicylic acid (SA)-dependent pathways (Qi et al., 2011; Li et al., 2019). Meanwhile, HIRs could contribute to ETI by forming complexes with a membrane-associated disease resistance protein RPS2 (Qi et al., 2011), whose transcriptional expression was also upregulated in the CLas-infected barks (Supplementary Table 2). Thus, multi-immune responses were triggered.
The EDS1 family of immunity regulators contains three proteins: EDS1, phytoalexin deficient 4 (PAD4), and senescence-associated gene 101 (SAG101), which could form mutually exclusive EDS1-SAG101 and EDS1-PAD4 heterodimers (Ngou et al., 2021). EDS1-SAG101 dimers have a helper NLR to mediate cell death and pathogen resistance (Lapin et al., 2019). EDS1-PAD4 functions as an integrator of cell surface and intracellular receptor signaling, which delivers signals from TIR-NLRs to transcriptional defense and host cell death (Dongus and Parker, 2021). Meanwhile, the EDS1-PAD4 module participates in phytohormone-mediated pathogen containment by inhibiting MYC2, a negative regulator of SA biosynthesis, and enhances the SA defense sector (Cui et al., 2018). Therefore, EDS1 is considered an immune regulatory hub (Lapin et al., 2020). In our study, EDS1 and PAD4 were both upregulated in the CLas-infected leaves and barks. Although SAG101 was not found, its two homologs were identified as DEGs, and the upregulation of SAG20 and SAG21 was consistent with their induced expression upon pathogen attack (Keates et al., 2003; Salleh et al., 2012).
Phytohormone Signal Pathways and Defense Response
Phytohormones, such as SA, jasmonic acid (JA), ethylene (ET), abscisic acid (ABA), auxin, and gibberellins (GAs), participate in defense responses (Berens et al., 2017). Among them, SA and JA are major defense-related phytohormones, while the other phytohormones participate in hormone signaling mainly through interactions with SA and JA (Pieterse et al., 2009). The transcriptional levels of DEGs involved in plant hormone signal transduction varied among the CLas-infected tissues, especially those related to SA (Supplementary Table 17; Figure 6). Non-expressor of pathogenesis-related genes 1 (NPR1), the main protein required for SA perception, interacts with TGACG-binding (TGA) transcription factors, which modulate SA biosynthesis positively (Budimir et al., 2021). Although NPR1 was not found in our study, Blade-on-petiole 2 (BOP2, a paralog of NPR1) and TGA1/7/9 were all downregulated in the CLas-infected leaves. Meanwhile, Cs2g10790 (NPR3), whose protein transcriptionally repressed genes involved in promoting SA-mediated basal immunity, such as systemic acquired resistance deficient 1 (SARD1) and WRKY70, was upregulated in the CLas-infected leaves and barks (Supplementary Table 17) (Ding et al., 2018). However, SARD1 and over 80% of the WRKYs were upregulated in HLB_L/B, probably because of the compensatory mechanism(s) to circumvent weakened SA signaling, such as MAPK signaling (Tsuda et al., 2013). In addition, three DEGs annotated as phenylalanine ammonium-lyase 1 (PAL1), encoding the key enzyme of the PAL pathway contributing to SA biosynthesis in immunity (Berens et al., 2017), were upregulated in HLB_B (Supplementary Table 2). Therefore, the above information indicated that SA-mediated defense response might be partially depressed in the leaves but not in the barks after CLas inoculation.
The pathogen of citrus canker appeared to promote JA accumulation through hijacking host ABA production, which could suppress SA-mediated defenses and benefit pathogen development (Long et al., 2019). Consistently, DEGs involved in JA, ET, and ABA signaling were nearly all upregulated in the CLas-infected leaves and barks (Figure 6), and so were those participating in JA biosynthesis, such as allene oxide cyclase 4 (AOC4), lipoxygenase 3(LOX3), 12-oxophytodienoate reductase 2(OPR2), and peroxisomal acyl-coenzyme A oxidase 1 (ACX1, Supplementary Tables 2, 3). Hence, JA signaling was probably dominated in the CLas-infected leaves and barks, which may suppress SA-mediated pathogen defense.
Alteration of Carbohydrate Metabolism and Cell Wall Composition
Huanglongbing severely influences functions related to carbohydrate biosynthesis and metabolism (Wu et al., 2020). The swelling of the middle lamella among cell walls surrounding sieve elements would drive starch accumulation in the leaves and phloem, and decrease starch transport to roots (Folimonova and Achor, 2010). In this study, the “starch and sucrose metabolism” and “galactose metabolism” pathways were upregulated in the CLas-infected leaves and barks but were down-regulated in the roots (Figure 5C). Consistently, the metabolomics results revealed that sucrose accumulation occurred in both the CLas-infected leaves and barks, but that no DAMs were detected in the roots (Figure 7), which might result in low carbohydrate storage in the roots.
Interestingly, many carbohydrate-related DEGs were annotated to participate in cell wall modification and remodeling. Cellulose, various hemicelluloses, and pectins are the three major types of polysaccharides in the cell wall of Arabidopsis leaves (Liepman et al., 2010). CEL1, an endo-1,4-β-glucanase, was required for cellulose formation of the cell wall during cell growth and expansion (Tsabary et al., 2003), and its transcripts significantly accumulated in the CLas-infected barks and roots (Supplementary Table 18). UDP-D-glucuronate 4-epimerases (GAEs) provide important precursors for the synthesis of pectins, which are the major component of the plant primary cell wall and critical for its integrity as well as immunity (Mølhøj et al., 2004; Bethke et al., 2016). GAE1/6 were depressed upon Botrytis cinerea and Pma ES4326 challenge in Arabidopsis (Bethke et al., 2016), but they were induced in our study (Supplementary Table 18). Meanwhile, several DEGs encoding pectin lyase-like superfamily proteins, which were reported to participate in plant cell wall modification (Hocq et al., 2020), were also identified (Supplementary Table 18). Pectinesterases (PMEs) contribute to cell wall integrity (Bethke et al., 2014), which may explain the upregulation of 11 PMEs (Supplementary Table 18).
UDP-glucose 4-epimerase (UGE) provides UDP-galactose for cell wall biosynthesis (Rösti et al., 2007). UDP-glucose 6-dehydrogenases 2 (UGD2) and UGD3 were required for the formation of the cell wall in growth (Reboul et al., 2011). Inferred from electronic annotation on the website of UniProtKB (https://www.uniprot.org/uniprot/), hexosyltransferases (GAUTs) may be involved in pectin and/or xylans biosynthesis in cell walls, and alpha-galactosidase 1/2 (AGAL1/2) may function in cell wall loosening and expansion. The expression of UGE1, UGD2, UGD3, GAUTs, and AGAL1/2 was all significantly upregulated (Supplementary Table 18). Meanwhile, trehalose was suggested to play a role in cell wall modification (Bae et al., 2005). Its biosynthesis in plants needs two indispensable enzymes: trehalose-phosphate synthase (TPS) and trehalose-6-phosphate phosphatase (TPP). The tps1 mutant in Arabidopsis showed an altered cell wall structure and starch accumulation (Gómez et al., 2006), suggesting that the downregulation of two TPS1 genes in the CLas-infected leaves may also cause starch accumulation. Therefore, cell wall was highly affected in Chongyi after CLas infection, which was considered as one of the typical characteristics of HLB-susceptible genotypes (Curtolo et al., 2020).
HLB Negatively Affects Carotenoid and Nitrogen Metabolism in Root
Carotenoids play essential roles in plant physiological processes, and phytoene synthase (PSY) is considered the most important regulatory enzyme in carotenogenesis (Cazzonelli and Pogson, 2010). PSY was suppressed in the CLas-infected roots (Supplementary Table 20), and so was zeaxanthin epoxidase (ZEP), encoding the other enzyme of carotenoid biosynthesis. Carotenoid cleavage dioxygenases (CCDs) can catalyze carotenoids into various carotenoid cleavage products and provide substrates for phytohormone biosynthesis (Gao et al., 2021). CCD7 and CCD8 were all downregulated in the roots after CLas infection (Supplementary Table 20), probably because the suppression of carotenoid biosynthesis resulted in the reduction of degradation. Interestingly, strigolactones are carotenoid-derived phytohormones, whose biosynthesis requires CCD7 and CCD8 as well as the iron-binding protein D27 (Alder et al., 2012; Wang et al., 2020). D27 was down-regulated in CLas-infected roots, too. Consequently, HLB may repress strigolactone production in roots. However, root secrets strigolactones into the rhizosphere as a pre-symbiotic signal for arbuscular mycorrhizal symbiosis, which is critical for Citrus to obtain essential nutrients from the soil (Akiyama et al., 2005; An et al., 2018). Therefore, the suppression of carotenoid metabolism may cause a nutrient deficiency in roots, such as nitrogen (N) deficiency. Consistently, high-affinity nitrate transports (NRTs) 2.4, NRT2.5, NRT2.6, and NRT2.7, which could reduce the absorption of N from soil to roots, were all downregulated (Figure 7; Supplementary Table 20). Thus, the suppression of carotenoid and nitrogen metabolism may accelerate the deterioration of the CLas-infected roots and weaken the defense response of the whole plant.
A Hypothesized Model for HLB Susceptibility Mechanism in Chongyi Wild Mandarin
The comparison of transcriptomic profiles from the CLas-susceptible citrus genotypes and CLas-tolerant/resistant genotypes revealed the transcriptional alterations of susceptible plants, such as downregulation of receptors and WKRYs, induction of GA synthesis, and suppression of GA degradation (Curtolo et al., 2020). As mentioned above, the majority of receptors were depressed in the CLas-infected leaves (Figure 6). Although most WRKYs were upregulated in our study (Figure 6), WRKY70, which was suggested to play an important role in Poncirus trifoliata tolerance to HLB, was excluded (Peng et al., 2020). Two gibberellin 2-beta-dioxygenase 8 genes in the CLas-infected leaves and one, which was involved in GA degradation, in the barks were downregulated (Supplementary Tables 2, 3) (Liu et al., 2021). No GA synthesis-related DEGs were identified, but several Gibberellin stimulated Arabidopsis genes (GASAs) were upregulated in all the CLas-infected tissues (Supplementary Tables 2–4). GASAs were GA-induced and could promote GA response (Rubinovich and Weiss, 2010), suggesting that GA synthesis was probably induced in CLas-infected Chongyi. Thus, these results were consistent with the characteristics of susceptible Citrus genotypes, as summarized by Curtolo et al. (2020). Furthermore, CLas-enhanced JA synthesis and signaling may hamper defense response by antagonizing SA, making Chongyi more vulnerable to HLB. Based on the above arguments, along with severe anatomical aberrations in the CLas-infected tissues, a hypothesized model of the whole plant and tissue-specific HLB susceptible response of Chongyi is illustrated in Figure 9.
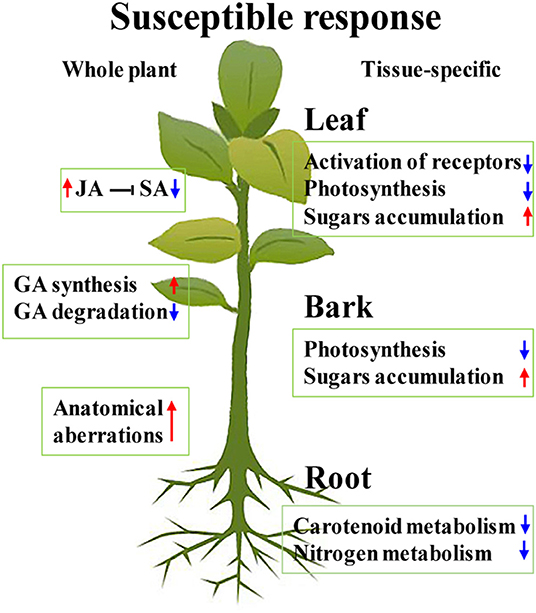
Figure 9. Hypothesized model for the whole plant and tissue-specific HLB susceptible response of Chongyi. Red arrows indicate induction, and blue ones indicate repression.
Data Availability Statement
The datasets presented in this study can be found in online repositories. The names of the repository/repositories and accession number(s) can be found in the article/Supplementary Material.
Author Contributions
TP and B-LZ conceived the study. X-TX, F-TC, and X-JZ conducted the management of grafting and seedling. TP and J-LK contributed to data analysis and writing of the manuscript. W-SD, MW, Z-YL, and H-NS significantly contributed to the writing of the manuscript. All authors discussed the results and commented on the manuscript.
Funding
This study was supported by the Natural Science Foundation of Jiangxi Province (20152ACB21005), the National Natural Science Foundation of China (32060670), the Major Science and Technology R&D Program of Jiangxi Province (20194ABC28007), and the National Key Research and Development Program of China (2018YFD0201500).
Conflict of Interest
The authors declare that the research was conducted in the absence of any commercial or financial relationships that could be construed as a potential conflict of interest.
Publisher's Note
All claims expressed in this article are solely those of the authors and do not necessarily represent those of their affiliated organizations, or those of the publisher, the editors and the reviewers. Any product that may be evaluated in this article, or claim that may be made by its manufacturer, is not guaranteed or endorsed by the publisher.
Supplementary Material
The Supplementary Material for this article can be found online at: https://www.frontiersin.org/articles/10.3389/fpls.2021.748209/full#supplementary-material
Supplementary Figure 1. Detection of CLas in seedlings grafted with (a) healthy and (b) CLas-positive buds. M, marker; P, positive control; N, negative control.
Supplementary Figure 2. Heatmap of all metabolites in the three tissues.
Supplementary Figure 3. (a) Venn diagram of DEGs among leaves, bark, and roots, and (b) K-mean analysis results of common DEGs expression patterns to choose best cluster number.
Supplementary Figure 4. Expression patterns of six common DEGs among three comparisons in “starch and sucrose metabolism”.
Supplementary Table 1. Quality estimation of raw reads in all transcriptome.
Supplementary Table 2. DEGs of Clas-infected barks and healthy barks.
Supplementary Table 3. DEGs of Clas-infected leaves and healthy leaves.
Supplementary Table 4. DEGs of Clas-infected roots and healthy roots.
Supplementary Table 5. KEGG pathway enrichment of DEGs between Clas-infected and healthy barks.
Supplementary Table 6. KEGG pathway enrichment of DEGs between Clas-infected and healthy leaves.
Supplementary Table 7. KEGG pathway enrichment of DEGs between Clas-infected and healthy roots.
Supplementary Table 8. KEGG pathway enrichment of DAMs between Clas-infected and healthy barks.
Supplementary Table 9. KEGG pathway enrichment of DAMs between Clas-infected and healthy leaves.
Supplementary Table 10. KEGG pathway enrichment of DAMs between Clas-infected and healthy roots.
Supplementary Table 11. The 56 Common KEGG pathways enriched by DAMs and DEGs in bark.
Supplementary Table 12. The 54 common KEGG pathways enriched by DAMs and DEGs in leaf.
Supplementary Table 13. The 45 common KEGG pathways enriched by DAMs and DEGs in root.
Supplementary Table 14. DEGs related to leucine-rich repeat receptor-like protein kinase in bark, leaf and root.
Supplementary Table 15. DEGs related to TIR-NBS-LRRs or CC-NBS-LRRs in bark, leaf and root.
Supplementary Table 16. DEGs related to plant-pathogen interaction.
Supplementary Table 17. DEGs related to plant hormone signal transduction.
Supplementary Table 18. DEGs related to starch, sucrose and galactose metabolism.
Supplementary Table 19. DEGs related to carbon fixation and photosynthesis-antenna proteins.
Supplementary Table 20. DEGs related to carotenoid biosynthesis and nitrogen metabolism.
Supplementary Table 21. Fifteen Putative gene markers of CLas in leaves, barks and roots. Tau healthy values are represented as the tau values of healthy leaves, barks and roots, and tau symptomatic values are represented as the tau values of CLasinfected leaves, barks and roots.
References
Adachi, H., Nakano, T., Miyagawa, N., Ishihama, N., Yoshioka, M., Katou, Y., et al. (2015). WRKY transcription factors phosphorylated by MAPK regulate a plant immune NADPH oxidase in Nicotiana benthamiana. Plant Cell 27, 2645–2663. doi: 10.1105/tpc.15.00213
Ai, C., and Kong, L. (2018).CGPS: a machine learning-based approach integrating multiple gene set analysis tools for better prioritization of biologically relevant pathways. J. Genet. Genomics 45, 489–504. doi: 10.1016/j.jgg.2018.08.002
Akiyama, K., Matsuzaki, K., and Hayashi, H. (2005). Plant sesquiterpenes induce hyphal branching in arbuscular mycorrhizal fungi. Nature 435, 824–827. doi: 10.1038/nature03608
Albrecht, U., and Bowman, K. D. (2008). Gene expression in Citrus sinensis (L.) Osbeck following infection with the bacterial pathogen Candidatus Liberibacter asiaticus causing Huanglongbing in Florida. Plant Sci. 175, 291–306. doi: 10.1016/j.plantsci.2008.05.001
Alder, A., Jamil, M., Marzorati, M., Bruno, M., Vermathen, M., Bigler, P., et al. (2012). The path from β-carotene to carlactone, a strigolactone-like plant hormone. Science 335, 1348–1351. doi: 10.1126/science.1218094
An, J., Sun, M., van Velzen, R., Ji, C., Zheng, Z., Limpens, E., et al. (2018). Comparative transcriptome analysis of Poncirus trifoliata identifies a core set of genes involved in arbuscular mycorrhizal symbiosis. J. Exp. Bot. 69, 5255–5264. doi: 10.1093/jxb/ery283
Bae, H., Herman, E., Bailey, B., Bae, H. J., and Sicher, R. (2005). Exogenous trehalose alters Arabidopsis transcripts involved in cell wall modification, abiotic stress, nitrogen metabolism, and plant defense. Physiol. Plantarum 125, 114–126. doi: 10.1111/j.1399-3054.2005.00537.x
Balan, B., Ibáñez, A. M., Dandekar, A. M., Caruso, T., and Martinelli, F. (2018). Identifying host molecular features strongly linked with responses to Huanglongbing disease in Citrus leaves. Front. Plant Sci. 9:277. doi: 10.3389/fpls.2018.00277
Berens, M. L., Berry, H. M., Mine, A., Argueso, C. T., and Tsuda, K. (2017). Evolution of hormone signaling networks in plant defense. Annu. Rev. Phytopathol. 55, 401–425. doi: 10.1146/annurev-phyto-080516-035544
Bethke, G., Grundman, R. E., Sreekanta, S., Truman, W., Katagiri, F., and Glazebrook, J. (2014). Arabidopsis PECTIN METHYLESTERASEs contribute to immunity against Pseudomonas syringae. Plant Physiol. 164, 1093–1107. doi: 10.1104/pp.113.227637
Bethke, G., Thao, A., Xiong, G., Li, B., Soltis, N. E., Hatsugai, N., et al. (2016). Pectin biosynthesis is critical for cell wall integrity and immunity in Arabidopsis thaliana. Plant Cell 28, 537–556. doi: 10.1105/tpc.15.00404
Bové, J. M. (2006). Huanglongbing: a destructive, newly-emerging, century-old disease of citrus. J. Plant Pathol. 88, 7–37. doi: 10.4454/jpp.v88i1.828
Brawand, D., Soumillon, M., Necsulea, A., Julien, P., Csárdi, G., Harrigan, P., et al. (2011). The evolution of gene expression levels in mammalian organs. Nature 478, 343–348. doi: 10.1038/nature10532
Budimir, J., Treffon, K., Nair, A., Thurow, C., and Gatz, C. (2021). Redox-active cysteines in TGACG-BINDING FACTOR 1 (TGA1) do not play a role in salicylic acid or pathogen-induced expression of TGA1-regulated target genes in Arabidopsis thaliana. New Phytol. 230, 2420–2432. doi: 10.1111/nph.16614
Cazzonelli, C. I., and Pogson, B. J. (2010). Source to sink: regulation of carotenoid biosynthesis in plants. Trends Plant Sci. 15, 266–274. doi: 10.1016/j.tplants.2010.02.003
Cui, H., Qiu, J., Zhou, Y., Bhandari, D. D., Zhao, C., Bautor, J., et al. (2018). Antagonism of transcription factor MYC2 by EDS1/PAD4 complexes bolsters salicylic acid defense in Arabidopsis effector-triggered immunity. Mol. Plant 11, 1053–1066. doi: 10.1016/j.molp.2018.05.007
Curtolo, M., de Souza Pacheco, I., Boava, L. P., Takita, M. A., Granato, L. M., Galdeano, D. M., et al. (2020). Wide-ranging transcriptomic analysis of Poncirus trifoliata, Citrus sunki, Citrus sinensis and contrasting hybrids reveals HLB tolerance mechanisms. Sci. Rep. 10:20865. doi: 10.1038/s41598-020-77840-2
Darbellay, F., and Necsulea, A. (2020). Comparative transcriptomics analyses across species, organs and developmental stages reveal functionally constrained lncRNAs. Mol. Biol. Evol. 37, 240–259. doi: 10.1093/molbev/msz212
Ding, Y., Sun, T., Ao, K., Peng, Y., Zhang, Y., Li, X., et al. (2018). Opposite roles of salicylic acid receptors NPR1 and NPR3/4 in transcriptional regulation of plant immunity. Cell 173, 1454–1467. doi: 10.1016/j.cell.2018.03.044
Dongus, J. A., and Parker, J. E. (2021). EDS1 signalling: at the nexus of intracellular and surface receptor immunity. Curr. Opin. Plant Biol. 62:102039. doi: 10.1016/j.pbi.2021.102039
Dubiella, U., Seybold, H., Durian, G., Komander, E., Lassig, R., Witte, C. P., et al. (2013). Calcium-dependent protein kinase/NADPH oxidase activation circuit is required for rapid defense signal propagation. Proc. Natl. Acad. Sci. U.S.A. 110, 8744–8749. doi: 10.1073/pnas.1221294110
Folimonova, S. Y., and Achor, D. S. (2010). Early events of citrus greening (Huanglongbing) disease development at the ultrastructural level. Phytopathology 100, 949–958. doi: 10.1094/PHYTO-100-9-0949
Fu, S., Shao, J., Zhou, C., and Hartung, J. S. (2016). Transcriptome analysis of sweet orange trees infected with ‘Candidatus Liberibacter asiaticus' and two strains of Citrus Tristeza Virus. BMC Genomics 17:349. doi: 10.1186/s12864-016-2663-9
Gao, J., Yang, S., Tang, K., Li, G., Gao, X., Liu, B., et al. (2021). GmCCD4 controls carotenoid content in soybeans. Plant Biotechnol. J. 19, 801–813. doi: 10.1111/pbi.13506
Gómez, L. D., Baud, S., Gilday, A., Li, Y., and Graham, I. A. (2006). Delayed embryo development in the ARABIDOPSIS TREHALOSE-6-PHOSPHATE SYNTHASE 1 mutant is associated with altered cell wall structure, decreased cell division and starch accumulation. Plant J. 46, 69–84. doi: 10.1111/j.1365-313X.2006.02662.x
Greenberg, J. T., and Yao, N. (2004). The role and regulation of programmed cell death in plant-pathogen interactions. Cell Microbiol. 6, 201–211. doi: 10.1111/j.1462-5822.2004.00361.x
Grenzi, M., Bonza, M. C., Alfieri, A., and Costa, A. (2021). Structural insights into long-distance signal transduction pathways mediated by plant glutamate receptor-like channels. New Phytol. 229, 1261–1267. doi: 10.1111/nph.17034
Hayter, M. L., and Peterson, C. A. (2004). Can Ca2+ fluxes to the root xylem be sustained by Ca2+-ATPases in exodermal and endodermal plasma membranes? Plant Physiol. 136, 4318–4325. doi: 10.1104/pp.104.041889
Hocq, L., Guinand, S., Habrylo, O., Voxeur, A., Tabi, W., Safran, J., et al. (2020). The exogenous application of AtPGLR, an endo-polygalacturonase, triggers pollen tube burst and repair. Plant J. 103, 617–633. doi: 10.1111/tpj.14753
Huang, D. W., Sherman, B. T., and Lempicki, R. A. (2009). Systematic and integrative analysis of large gene lists using DAVID bioinformatics resources. Nat. Protoc. 4, 44–57. doi: 10.1038/nprot.2008.211
Huang, L., Grosser, J., Gmitter, F. G., Sims, C. A., and Wang, Y. (2020). Effects of scion/rootstock combination on flavor quality of orange juice from Huanglongbing (HLB)-affected trees: atwo-year study of the targeted metabolomics. J. Agric. Food Chem. 68, 3286–3296. doi: 10.1021/acs.jafc.9b07934
Keates, S. E., Kostman, T. A., Anderson, J. D., and Bailey, B. A. (2003). Altered gene expression in three plant species in response to treatment with Nep1, a fungal protein that causes necrosis. Plant Physiol. 132, 1610–1622. doi: 10.1104/pp.102.019836
Kim, D., Langmead, B., and Salzberg, S. L. (2015). HISAT: a fast spliced aligner with low memory requirements. Nat. Methods 12, 357–360. doi: 10.1038/nmeth.3317
Kim, J. S., Sagaram, U. S., Burns, J. K., Li, J. L., and Wang, N. (2009). Response of sweet orange (Citrus sinensis) to ‘Candidatus Liberibacter asiaticus' infection: microscopy and microarray analyses. Phytopathology 99, 50–57. doi: 10.1094/PHYTO-99-1-0050
Kimura, S., Hunter, K., Vaahtera, L., Tran, H. C., Citterico, M., Vaattovaara, A., et al. (2020). CRK2 and C-terminal phosphorylation of NADPH oxidase RBOHD regulate reactive oxygen species production in Arabidopsis. Plant Cell 32, 1063–1080. doi: 10.1105/tpc.19.00525
Lapin, D., Bhandari, D. D., and Parker, J. E. (2020). Origins and immunity networking functions of EDS1 family proteins. Annu. Rev. Phytopathol. 58, 253–276. doi: 10.1146/annurev-phyto-010820-012840
Lapin, D., Kovacova, V., Sun, X., Dongus, J. A., Bhandari, D., von Born, P., et al. (2019). A coevolved EDS1-SAG101-NRG1 module mediates cell death signaling by TIR-domain immune receptors. Plant Cell 31, 2430–2455. doi: 10.1105/tpc.19.00118
Lee, H. J., and Seo, P. J. (2021). Ca2+talyzing initial responses to environmental stresses. Trends Plant Sci. 26, 849–870. doi: 10.1016/j.tplants.2021.02.007
Li, S., Zhao, J., Zhai, Y., Yuan, Q., Zhang, H., Wu, X., et al. (2019). The hypersensitive induced reaction 3 (HIR3) gene contributes to plant basal resistance via an EDS1 and salicylic acid-dependent pathway. Plant J. 98, 783–797. doi: 10.1111/tpj.14271
Liao, B. Y., Scott, N. M., and Zhang, J. (2006). Impacts of gene essentiality, expression pattern, and gene compactness on the evolutionary rate of mammalian proteins. Mol. Biol. Evol. 23, 2072–2080. doi: 10.1093/molbev/msl076
Liao, Y., Smyth, G. K., and Shi, W. (2019). The R package Rsubread is easier, faster, cheaper and better for alignment and quantification of RNA sequencing reads. Nucleic Acids Res. 8:e47. doi: 10.1093/nar/gkz114
Liepman, A. H., Wightman, R., Geshi, N., Turner, S. R., and Scheller, H. V. (2010). Arabidopsis - a powerful model system for plant cell wall research. Plant J. 61, 1107–1121. doi: 10.1111/j.1365-313X.2010.04161.x
Liu, B., Zhao, S., Li, P., Yin, Y., Niu, Q., Yan, J., et al. (2021). Plant buffering against the high-light stress-induced accumulation of CsGA2ox8 transcripts via alternative splicing to finely tune gibberellin levels and maintain hypocotyl elongation. Hortic. Res. 8:2. doi: 10.1038/s41438-020-00430-w
Liu, N., Hake, K., Wang, W., Zhao, T., Romeis, T., and Tang, D. (2017). CALCIUM-DEPENDENT PROTEIN KINASE5 associates with the truncated NLR protein TIR-NBS2 to contribute to exo70B1-mediated immunity. Plant Cell 29, 746–759. doi: 10.1105/tpc.16.00822
Long, Q., Xie, Y., He, Y., Li, Q., Zou, X., and Chen, S. (2019). Abscisic acid promotes jasmonic acid accumulation and plays a key role in Citrus canker development. Front. Plant Sci. 10:1634. doi: 10.3389/fpls.2019.01634
Love, M. I., Huber, W., and Anders, S. (2014). Moderated estimation of fold change and dispersion for RNA-seq data with DESeq2. Genome Biol. 15:550. doi: 10.1186/s13059-014-0550-8
Lv, T., Li, X., Fan, T., Luo, H., Xie, C., Zhou, Y., et al. (2019). The Calmodulin-binding protein IQM1 interacts with CATALASE2 to affect pathogen defense. Plant Physiol. 181, 1314–1327. doi: 10.1104/pp.19.01060
Mohanta, T. K., Yadav, D., Khan, A. L., Hashem, A., Abd_Allah, E. F., and Al-Harrasi, A. (2019). Molecular players of EF-hand containing calcium signaling event in plants. Int. J. Mol. Sci. 20:1476. doi: 10.3390/ijms20061476
Mølhøj, M., Verma, R., and Reiter, W. D. (2004). The biosynthesis of D-Galacturonate in plants. functional cloning and characterization of a membrane-anchored UDP-D-Glucuronate 4-epimerase from Arabidopsis. Plant Physiol. 135, 1221–1230. doi: 10.1104/pp.104.043745
Monteiro, F., and Nishimura, M. T. (2018). Structural, functional, and genomic diversity of plant NLR proteins: an evolved resource for rational engineering of plant immunity. Annu. Rev. Phytopathol. 56, 243–267. doi: 10.1146/annurev-phyto-080417-045817
Ngou, B. P. M., Ahn, H. K., Ding, P., and Jones, J. D. G. (2021). Mutual potentiation of plant immunity by cell-surface and intracellular receptors. Nature 592, 110–115. doi: 10.1038/s41586-021-03315-7
Padhi, E. M. T., Maharaj, N., Lin, S. Y., Mishchuk, D. O., Chin, E., Godfrey, K., et al. (2019). Metabolome and microbiome signatures in the roots of citrus affected by Huanglongbing. Phytopathology 109, 2022–2032. doi: 10.1094/PHYTO-03-19-0103-R
Peng, T., You, X. S., Guo, L., Zhong, B. L., Mi, L. F., Chen, J. M., et al. (2021). Transcriptome analysis of Chongyi wild mandarin, a wild species more cold-tolerant than Poncirus trifoliata, reveals key pathways in response to cold. Environ. Exp. Bot. 184:104371. doi: 10.1016/j.envexpbot.2020.104371
Peng, Z., Bredeson, J. V., Wu, G. A., Shu, S., Rawat, N., Du, D., et al. (2020). A chromosome-scale reference genome of trifoliate orange (Poncirus trifoliata) provides insights into disease resistance, cold tolerance and genome evolution in Citrus. Plant J. 104, 1215–1232. doi: 10.1111/tpj.14993
Pertea, M., Kim, D., Pertea, G. M., Leek, J. T., and Salzberg, S. L. (2016). Transcript-level expression analysis of RNA-seq experiments with HISAT, StringTie and Ballgown. Nat. Protoc. 11, 1650–1667. doi: 10.1038/nprot.2016.095
Pieterse, C. M., Leon-Reyes, A., Van der Ent, S., and Van Wees, S. C. (2009). Networking by small-molecule hormones in plant immunity. Nat. Chem. Biol. 5, 308–316. doi: 10.1038/nchembio.164
Pluskal, T., Castillo, S., Villar-Briones, A., and Orešič, M. (2010). MZmine 2: modular framework for processing, visualizing, and analyzing mass spectrometry-based molecular profile data. BMC Bioinformatics 11:395. doi: 10.1186/1471-2105-11-395
Qi, Y., Tsuda, K., Nguyen, L. V., Wang, X., Lin, J., Murphy, A. S., et al. (2011). Physical association of Arabidopsis hypersensitive induced reaction proteins (HIRs) with the immune receptor RPS2. J. Biol. Chem. 286, 31297–31307. doi: 10.1074/jbc.M110.211615
Rawat, N., Kumar, B., Albrecht, U., Du, D., Huang, M., Yu, Q., et al. (2017). Genome resequencing and transcriptome profiling reveal structural diversity and expression patterns of constitutive disease resistance genes in Huanglongbing-tolerant Poncirus trifoliata and its hybrids. Hortic Res. 4:17064. doi: 10.1038/hortres.2017.64
Reboul, R., Geserick, C., Pabst, M., Frey, B., Wittmann, D., Lütz-Meindl, U., et al. (2011). Down-regulation of UDP-glucuronic acid biosynthesis leads to swollen plant cell walls and severe developmental defects associated with changes in pectic polysaccharides. J. Biol. Chem. 286, 39982–39992. doi: 10.1074/jbc.M111.255695
Rösti, J., Barton, C. J., Albrecht, S., Dupree, P., Pauly, M., Findlay, K., et al. (2007). UDP-glucose 4-epimerase isoforms UGE2 and UGE4 cooperate in providing UDP-galactose for cell wall biosynthesis and growth of Arabidopsis thaliana. Plant Cell 19, 1565–1579. doi: 10.1105/tpc.106.049619
Rubinovich, L., and Weiss, D. (2010). The Arabidopsis cysteine-rich protein GASA4 promotes GA responses and exhibits redox activity in bacteria and in planta. Plant J. 64, 1018–1027. doi: 10.1111/j.1365-313X.2010.04390.x
Salleh, F. M., Evans, K., Goodall, B., Machin, H., Mowla, S. B., Mur, L. A., et al. (2012). A novel function for a redox-related LEA protein (SAG21/AtLEA5) in root development and biotic stress responses. Plant Cell Environ. 35, 418–429. doi: 10.1111/j.1365-3040.2011.02394.x
Tian, W., Hou, C., Ren, Z., Wang, C., Zhao, F., Dahlbeck, D., et al. (2019). A calmodulin-gated calcium channel links pathogen patterns to plant immunity. Nature 572, 131–135. doi: 10.1038/s41586-019-1413-y
Trujillo, M. (2021). Ubiquitin signalling: controlling the message of surface immune receptors. New Phytol. 231, 47–53. doi: 10.1111/nph.17360
Tsabary, G., Shani, Z., Roiz, L., Levy, I., Riov, J., and Shoseyov, O. (2003). Abnormal ‘wrinkled' cell walls and retarded development of transgenic Arabidopsis thaliana plants expressing endo-1,4-beta-glucanase (cell) antisense. Plant Mol. Biol. 51, 213–224. doi: 10.1023/A:1021162321527
Tsuda, K., Mine, A., Bethke, G., Igarashi, D., Botanga, C. J., Tsuda, Y., et al. (2013). Dual regulation of gene expression mediated by extended MAPK activation and salicylic acid contributes to robust innate immunity in Arabidopsis thaliana. PLoS Genet. 9:1004015. doi: 10.1371/journal.pgen.1004015
Üstün, S., Hafrén, A., Liu, Q., Marshall, R. S., Minina, E. A., Bozhkov, P. V., et al. (2018). Bacteria exploit autophagy for proteasome degradation and enhanced virulence in plants. Plant Cell 30, 668–685. doi: 10.1105/tpc.17.00815
Wan, W. L., Frohlich, K., Pruitt, R. N., Nurnberger, T., and Zhang, L. S. (2019). Plant cell surface immune receptor complex signaling. Curr. Opin. Plant Biol. 50, 18–28. doi: 10.1016/j.pbi.2019.02.001
Wang, N., and Trivedi, P. (2013). Citrus huanglongbing: a newly relevant disease presents unprecedented challenges. Phytopathology 103, 652–665. doi: 10.1094/PHYTO-12-12-0331-RVW
Wang, Y., Shang, L., Yu, H., Zeng, L., Hu, J., Ni, S., et al. (2020). A strigolactone biosynthesis gene contributed to the green revolution in rice. Mol. Plant 13, 923–932. doi: 10.1016/j.molp.2020.03.009
Wang, Y., Zhou, L., Yu, X., Stover, E., Luo, F., and Duan, Y. (2016). Transcriptome profiling of Huanglongbing (HLB) tolerant and susceptible Citrus plants reveals the role of basal resistance in HLB tolerance. Front. Plant Sci. 7:933. doi: 10.3389/fpls.2016.00933
Wu, H., Hu, Y., Fu, S., Zhou, C., and Wang, X. (2020). Coordination of multiple regulation pathways contributes to the tolerance ofa wild citrus species (Citrus ichangensis‘2586') against Huanglongbing. Physiol. Mol. Plant P. 109:101457. doi: 10.1016/j.pmpp.2019.101457
Xia, J., and Wishart, D. S. (2016). Using MetaboAnalyst 3.0 for comprehensive metabolomics data analysis. Curr. Protoc. Bioinformatics 55, 14.10.11–14.10.91. doi: 10.1002/cpbi.11
Xu, Q., Chen, L. L., Ruan, X., Chen, D., Zhu, A., Chen, C., et al. (2013). The draft genome of sweet orange (Citrus sinensis). Nat. Genet. 45, 59–66. doi: 10.1038/ng.2472
Yuan, M., Jiang, Z., Bi, G., Nomura, K., Liu, M., Wang, Y., et al. (2021). Pattern-recognition receptors are required for NLR-mediated plant immunity. Nature 592, 105–109. doi: 10.1038/s41586-021-03316-6
Zhao, W., Baldwin, E. A., Bai, J., Plotto, A., and Irey, M. (2019). Comparative analysis of the transcriptomes of the calyx abscission zone of sweet orange insights into the huanglongbing-associated fruit abscission. Hortic. Res. 6:71. doi: 10.1038/s41438-019-0152-4
Zhong, Y., Cheng, C. Z., Jiang, N. H., Jiang, B., Zhang, Y. Y., Wu, B., et al. (2015). Comparative transcriptome and iTRAQ proteome analyses of citrus root responses to Candidatus Liberibacter asiaticus infection. PLoS ONE 10:e0126973. doi: 10.1371/journal.pone.0126973
Keywords: Huanglongbing, wild citrus germplasm, RNA-seq, metabolome, tissue specificity, anatomical aberration
Citation: Peng T, Kang J-L, Xiong X-T, Cheng F-T, Zhou X-J, Dai W-S, Wang M, Li Z-Y, Su H-N and Zhong B-L (2021) Integrated Transcriptomics and Metabolomics Analyses Provide Insights Into the Response of Chongyi Wild Mandarin to Candidatus Liberibacter Asiaticus Infection. Front. Plant Sci. 12:748209. doi: 10.3389/fpls.2021.748209
Received: 27 July 2021; Accepted: 06 September 2021;
Published: 14 October 2021.
Edited by:
Wen-Ming Wang, Sichuan Agricultural University, ChinaReviewed by:
Xiuping Zou, Citrus Research Institute, Chinese Academy of Agricultural Sciences (CAAS), ChinaJing Fan, Sichuan Agricultural University, China
Yijing Cen, South China Agricultural University, China
Copyright © 2021 Peng, Kang, Xiong, Cheng, Zhou, Dai, Wang, Li, Su and Zhong. This is an open-access article distributed under the terms of the Creative Commons Attribution License (CC BY). The use, distribution or reproduction in other forums is permitted, provided the original author(s) and the copyright owner(s) are credited and that the original publication in this journal is cited, in accordance with accepted academic practice. No use, distribution or reproduction is permitted which does not comply with these terms.
*Correspondence: Ting Peng, aXZ5cGVuZzk2NkB5YWhvby5jb20= orcid.org/0000-0002-3084-6328; Ba-Lian Zhong, emhvbmdiYWxpYW5AZ25udS5lZHUuY24=
†These authors have contributed equally to this work