 Xin Liu
 Ping Wang1
 Qingping Zhou
 Pei Wang
- 1Sichuan Zoige Alpine Wetland Ecosystem National Observation and Research Station, Institute of Qinghai-Tibetan Plateau, Southwest Minzu University, Chengdu, China
- 2National Key Laboratory of Crop Genetic Improvement, Ministry of Agriculture Key Laboratory of Crop Ecophysiology and Farming System in the Middle Reaches of the Yangtze River, College of Plant Science and Technology, Huazhong Agricultural University, Wuhan, China
- 3Lanzhou Institute of Husbandry and Pharmaceutical Sciences, Chinese Academy of Agricultural Sciences, Lanzhou, China
Drought is the most serious adversity faced by agriculture and animal husbandry industries. One strategy that plants use to adapt to water deficits is modifying the root growth and architecture. Root endodermis has cell walls reinforced with apoplastic barriers formed by the Casparian strip (CS) and suberin lamellae (SL) deposits, regulates radial nutrient transport and protects the vascular cylinder from abiotic threats. Elymus sibiricus is an economically important meso-xerophytic forage grass, characterized by high nutritional quality and strong environmental adaptability. The purpose of this study was to evaluate the drought tolerance of E. sibiricus genotypes and investigate the root structural adaptation mechanism of drought-tolerant genotypes’ responding to drought. Specifically, a drought tolerant (DT) and drought sensitive (DS) genotype were screened out from 52 E. sibiricus genotypes. DT showed less apoplastic bypass flow of water and solutes than DS under control conditions, as determined with a hydraulic conductivity measurement system and an apoplastic fluorescent tracer, specifically PTS trisodium-8-hydroxy-1,3,6-pyrenetrisulphonic acid (PTS). In addition, DT accumulated less Na, Mg, Mn, and Zn and more Ni, Cu, and Al than DS, regardless of osmotic stress. Further study showed more suberin deposition in DT than in DS, which could be induced by osmotic stress in both. Accordingly, the CS and SL were deposited closer to the root tip in DT than in DS. However, osmotic stress induced their deposition closer to the root tips in DS, while likely increasing the thickness of the CS and SL in DT. The stronger and earlier formation of endodermal barriers may determine the radial transport pathways of water and solutes, and contribute to balance growth and drought response in E. sibiricus. These results could help us better understand how altered endodermal apoplastic barriers in roots regulate water and mineral nutrient transport in plants that have adapted to drought environments. Moreover, the current findings will aid in improving future breeding programs to develop drought-tolerant grass or crop cultivars.
Introduction
Drought is the most serious abiotic stress that restricts agriculture and animal husbandry development. Drought stress reduces turgor pressure, disrupts ion homeostasis, damages cell membrane systems, and inhibits photosynthesis, among other effects. Furthermore, it not only impedes plant growth and metabolism at different stages, but also affects crop yields and quality (Reddy et al., 2004; Passioura, 2007). Global losses in crop production due to drought have totaled ~US $30 billion over the past decade. With the rapid growth of the global population, high-yield plants that use water more efficiently than their modern counterparts are urgently required (Gupta et al., 2020). Elymus sibiricus (Siberian wild rye) is an economically important perennial allotetraploid, meso-xerophytic and high-yield forage grass, native to northern Asia. It is palatable, nutrient-rich, and easily digestible, which are conducive to the growth and reproduction of domestic animals. This grass is widely used in natural grasslands and cultivated pastures on the Qinghai-Tibet Plateau owing to good forage quality, adaptability and excellent cold and drought tolerance (Ma et al., 2012; Liu et al., 2016; Xie et al., 2017). However, little is known about drought resistance strategies in this species.
A water deficit is the main cause of drought stress. Therefore, maintaining sufficient water absorption and preventing water loss in water-deficient environments enhance the drought resistance of plants. Plant roots are the first organs that sense the soil water status, and manage water deficiencies (Steudle, 2000). Root systems determine the capacity of a plant to access soil water, and their morphology and architecture can influence adaptation to water-limited conditions (Singh et al., 2010). According to the composite transport model, water and solutes are transported rapidly from the rhizodermis to xylem vessels in the stele via cell-to-cell (symplastic and transcellular) and apoplastic pathways (Kreszies et al., 2018). The key factors of water movement through the cell-to-cell pathway and the underlying mechanism have been investigated. For example, aquaporins contribute to water flux, and hence, function in drought tolerance (Lian et al., 2006; Chaumont and Tyerman, 2014; Grondin et al., 2016). Although root apoplastic barriers are theoretically important for plant adaptation to environmental stresses such as drought, little is known about their function and regulation.
The root apoplastic barriers comprise the Casparian strip (CS) and suberin lamellae (SL) of the endodermis and periderm and provide the main resistance to radial water transport via transcellular and apoplastic pathways in roots, which likely plays a crucial role in drought tolerance (Steudle, 2000; Kreszies et al., 2019; de Silva et al., 2021). The CS is the localized impregnation of a primary cell that longitudinally encircles an endodermal cell and might prevent the free apoplastic bypass flow (apoplastic pathway) of solutes in the extracellular spaces between the cortex and inner vasculature (Enstone et al., 2002; Geldner, 2013). The SL is deposited on the entire inner face of the cell wall adjacent to the plasma membrane, and it might be instrumental in preventing the movement of water and solutes from apoplasts directly into the endodermal protoplasts (Schreiber et al., 1999; Ranathunge et al., 2005; Martinka et al., 2012). The SL is polymerized based on polyaliphatic and polyaromatic domains. The aliphatic monomers are mainly ω-hydroxy fatty acids (ω-OH acids) and α,ω-dicarboxylic fatty acids (α,ω-diacids), with some primary alcohols and unsubstituted fatty acids, whereas the aromatic components are mainly ferulic and coumaric acids (Bernards, 2002; Pollard et al., 2008; Vishwanath et al., 2015). The CS is comprised of lignin or a lignin-like polymer (Geldner, 2013). It can also include aliphatic suberin in some species (Zeier and Schreiber, 1997), although histochemical staining and chemical analysis have shown that the CS is comprised only of a lignin-like polymer without suberin in Arabidopsis (Naseer et al., 2012).
The deposition of CS and SL not only changes throughout plant development but can also be modulated by abiotic stresses, such as drought (Barberon, 2017; Doblas et al., 2017; Campilho et al., 2020; de Silva et al., 2021). The SL is enhanced by osmotic stress in the seminal roots of barley (Hordeum vulgare) (Kreszies et al., 2019). Moreover, suberin deposition is induced under water-deficit conditions in grapevine (Vitis riparia) fine roots (Zhang et al., 2020). The Arabidopsis esb1 (enhanced suberin 1) mutant has higher water-use efficiency and lower transpiration rates than the wild-type, and this is associated with enhanced suberin deposition and ectopic lignin in roots (Baxter et al., 2009). The SL acts as a powerful barrier that prevents the uncontrolled backflow of water and solutes from the root to the medium and is important for Arabidopsis growth under drought and salt conditions (Wang et al., 2020a; de Silva et al., 2021). Natural variation in root suberization is associated with the local environment, especially edaphic water conditions, and the chemical composition, rather than only the amount of suberin, also plays a role in plant responses to drought and long-term adaptation to arid environments (Feng et al., 2022). Studies have also shown the role of the CS functions in the selective uptake of mineral nutrients and salinity tolerance of rice (Oryza sativa) and maize (Zea mays) (Krishnamurthy et al., 2011; Wang et al., 2019; Wang et al., 2022a; Wang et al., 2022b). Whereas the role of the CS as a barrier for water is poorly supported by functional evidence. Changes in root apoplastic barriers would alter water relationship and modulate drought tolerance in plants.
The total content and composition of suberin varies substantially between Arabidopsis and gramineous species, such as rice and barley. Various cultivars and growth conditions also contain different amounts of total suberin (Kreszies et al., 2018). Therefore, the study of root apoplastic barriers in gramineous grasses is necessary to understand the unique strategies used by grass and forage plants to adapt to environmental stress.
Here, we evaluated the drought tolerance of 52 E. sibiricus genotypes in seedlings. We identified drought tolerant (DT) and sensitive (DS) genotypes and compared the physiological, morphological, and ultrastructural responses of E. sibiricus with these genotypes under osmotic stress to elucidate the effects of root apoplastic barriers on drought tolerance. We also discuss whether differences in apoplastic barrier formation contribute to natural variations in drought tolerance between the two genotypes.
Materials and methods
Plant materials, growth conditions and treatments
Seeds from 52 wild E. sibiricus genotypes collected at the Sichuan Zoige Alpine Wetland Ecosystem National Observation and Research Station (Supplementary Table 1) were vernalized for 3 days in the dark at 4°C, then germinated on wet filter paper. The germinated seedlings were transferred to pots containing peat soil (Pindstrup, Mosebrug, Denmark) and watered compound fertilizer (N: P: K = 1:1:1) every 2 days. Ten-day-old seedlings were continuously watered or not (control) with distilled water for 8 days to evaluate the drought tolerance of germplasm resources. Seedlings were also transferred to aerated plastic boxes containing half‐strength Hoagland solution (H353, Phyto TechLabs, Lenexa, KS, USA) for hydroculture. Thereafter, 28-day-old plants were placed in 0 (control) and 20% PEG 6000 (BioFroxx, Einhausen, Germany) with an osmotic potential of −1.38 MPa for 3 days, osmolality was determined using an OSMOMAT 3000-D osmometer (Gonotec GmbH., Berlin, Germany). Plants grown in PEG 6000 for 0, 3 and 24 h were assessed by real-time quantitative polymerase chain reaction (qRT-PCR). All plants were cultivated in a climatic chamber at day/night temperatures of 23°C/19°C under a light cycle of 16 h/8 h (light/dark), light intensity of 250 μmol m−2· s−1, and relative humidity of ~ 60%.
Physiological evaluation of drought tolerance
Leaves were washed with distilled water and gently wiped. Chlorophyll fluorescence indexes including the initial fluorescence (Fo), maximum fluorescence under light (Fm’), maximum fluorescence under dark adaptation (Fm), difference between maximum fluorescence under light and minimum fluorescence (Fv’), difference between maximum fluorescence under dark adaptation and initial fluorescence (Fv), maximum photochemical efficiency of photosystem II in the dark-adapted state (Fv/Fm), electron transport rate (ETR), photochemical quenching coefficient (qP), and non-photochemical quenching coefficient (NPQ) were measured as described (Bhusal et al., 2021) using an Li-6800 portable photosynthetic instrument (LI-COR Biosciences Inc., Lincoln, NE USA). Chlorophyll contents were measured in alcohol and acetone as described by Zhang et al. (2022) using a CARY60 UV spectrophotometer (Agilent Technologies Inc., Santa Clara, CA, USA). Relative electric conductivity (REC; a.k.a. electrolyte leakage) was measured as described by Wang et al. (2020a) and membrane lipid peroxidation was assessed as malondialdehyde (MDA) contents using the thiobarbituric acid reaction as described by Niu et al. (2016).
Measurement of root hydraulic conductivity
Plants grown in 20% PEG 6000 were transferred back to half-strength Hoagland nutrient solution at least 1 h before measurements, based upon which hydrostatic hydraulic conductivity (Lpr) was calculated as Lphy. The osmotic Lpr (Lpos) was measured by replacing the nutrient solution with 1/2 Hoagland solution containing 30 mM NaCl at least 1 h before measurements. Five independent biological replicates per experiment were evaluated.
The Lpr (including Lphy and Lpos) was measured using a high conductance flow meter (HFCM; Dynamax Inc., Houston, TX, USA) to determine the hydraulic conductance of the whole-plant water transport pathway. Samples were cut 4 cm above the basal root, and stumps were immediately connected to the HCFM that perfuses degassed water throughout the root system by applying pressure to a water-filled bladder within the unit. The flow rate of water through the root was determined using the HCFM in transient mode, with flow measured under increasing pressure delivered by a nitrogen gas cylinder. The applied pressure was gradually increased from 6 to ~ 500 kPa over the course of ~ 1 min, and the flow rate was logged every 2 s using Dynamax software. A transient curve was constructed, then the Lpr was calculated as:
where Qv is the volumetric flow rate (kg·s−1) and P is the applied pressure (MPa). The temperature was automatically recorded by the HCFM, and all conductance measurements were corrected to values at 25°C. Hydraulic conductance was calculated using a transient increase in pressure with simultaneous recording of volume flow and normalized by dividing conductance by the total surface areas of the root (Tsuda and Tyree, 2000; Rodríguez-Gamir et al., 2019).
Trisodium-8-hydroxy-1,3,6-pyrenetrisulphonic acid (PTS) analyses
Apoplastic bypass flow was analyzed using the water-soluble, fluorescent, and nontoxic tracer trisodium-8-hydroxy-1,3,6-pyrenetrisulphonic acid (PTS; Sigma-Aldrich Corp., St. Louis, MO, USA) that does not cross cell membranes or adhere to cell walls (Faiyue et al., 2010b; Krishnamurthy et al., 2011). Four-week-old plants were placed in 20% PEG 6000, 0.2 mM PTS (100 mg·L−1), and 0.2 mM PTS plus 20% PEG 6000 for 72 h, or normal half-strength Hoagland nutrient solution (control). Shoots were harvested and dried in an oven at 80°C for 72 h. Dry samples were immersed in 10 mL of distilled water for 2 h at 90°C. PTS florescence was analyzed at Λex = 380 nm and Λem = 510 nm using a Varioskan LUX microplate reader (Thermo Fisher Scientific Inc., Waltham, MA, USA).
Elemental analyses of shoots
Plants were removed from the osmotic environment, washed with distilled water to remove surface salts. Then the shoots were harvested and dried at 80°C for 72 h. Ground dried samples (~ 0.5 g) were mixed with the internal standard indium and digested in a muffle furnace with 5 mL of concentrated nitric acid at 170°C for 4 h. The digest was cooled to room temperature and the acid was evaporated almost to dryness then diluted to a final volume of 25 mL with 18 MΩ water to extract ions. The contents of B, Na, Mg, K, Al, Ca, Mn, Fe, Ni, Cu and Zn were determined using a Thermo X series II, inductively coupled plasma mass spectrometer (ICP-MS; Thermo Fisher Scientific Inc.), as described by the manufacturer.
Root morphology and architecture
The roots of treated hydroponic plants were analyzed using a 12000XL scanner (Seiko Epson Corp., Tokyo, Japan), then images were analyzed using WinRHIZO2017 software (Regent Instruments, Sainte Foy, PQ, Canada) to obtain root parameters, namely total length, seminal root length and average diameter, surface area, forks, and fractal dimensions.
Histochemical detection of CS and SL
Seminal root materials were fixed in FAA (50% ethanol, 5% glacial acetic acid and 5% formaldehyde) and dehydrated in a graded ethanol series. Cross-sections were cut at 12%, 24%, 36%, 48%, and 60% of the total seminal root length from the tip, along the entire seminal root, using a Cryotome-H-E cryostat microtome (Thermo Fisher), to detect development of the CS and SL over the root length. Development of the CS was detected by staining with 0.1% (w/v) berberine hemisulfate for 1 h and with 0.5% (w/v) aniline blue for 0.5 h (Brundrett et al., 1988). The SL was stained with 0.01% (w/v) lipophilic Fluorol Yellow 088 (FY088; Sigma-Aldrich Corp.) for 0.5 h and with 0.5% (w/v) aniline blue for 0.5 h (slightly modified from Lux et al., 2005). Stained cross‐sections were visualized using a DS-U3 epifluorescence microscope (Nikon Corp., Tokyo, Japan) with an ultraviolet filter set (excitation filter 361–389 nm, dichroic mirror 415 nm, barrier filter 430–490 nm) and photographed using a Nikon Eclipse camera at ISO 200 or 400 and 1–2 s exposure (Kreszies et al., 2018).
Chemical analysis of suberin in roots
Root tissues (~500 mg fresh weight per sample) were rinsed with deionized water and dried on paper towels. Suberin cannot be directly quantified due to being insoluble and having a complex structure. Samples were delipidated and depolymerized to release monomers, then derivatized using N,O Bis-trimethylsilyl-trifluoroacetamide as described by Jenkin and Molina (2015).
Suberin monomers were identified and quantified using an 8890-7000D gas chromatograph-mass spectrometer (GC-MS; Agilent Technologies) fitted with an HP-5MS capillary column (length, 30 m; i.d., 0.25 mm; film thickness, 0.25 μm). The injector was set at 250°C, the injected split ratio was 1:10 and helium was the carrier gas at a constant flow of 1.0 mL min−1. The oven was initially set at 80°C for 2 min, increased by 15°C min−1 increments to 260°C, held for 10 min, then increased by 5°C min−1 increments to 320°C, and held for 24 min (total run time, 60 min). The temperature of the MS detector was 325°C, and the MS was set to a scan mode > 40–600 amu (electron impact ionization). Four biological replicates per experiment were assessed.
qRT-PCR analysis
Total RNA was isolated using RNAiso Plus Mini Kits (Takara Bio Inc., Kusatsu, Japan). Complementary DNA was synthesized using RT OR-Easy TM II cDNA synthesis kits (Foregene, Chengdu, China). Supplementary Table 2 lists the primers that were designed using Primer Premier 6.0. Primer specificity was validated based on melting profiles. The qRT-PCR proceeded using a StepOne Plus RT-PCR System (Thermo Fisher Scientific Inc.) and SYBR Premix Ex Taq (Toyobo, Tokyo, Japan). Relative expression was normalized to that of the housekeeping gene DnaJ (encodes heat shock N-terminal domain-containing protein) based on the 2−ΔΔCt method because this is the most stable internal gene in E. sibiricus under osmotic stress in qRT-PCR analyses (Zhang et al., 2019). All experiments included three technical and three biological replicates.
Statistical analyses
All results for traits in the evaluation of drought tolerance were converted into relative values to reduce inherent differences among different germplasm resources as:
where Xs and Xc represent drought stress and control, respectively (Zhang et al., 2022). The coefficient of variation for drought (CVD) was calculated as:
where CVT and CVC respectively represent the coefficients of variation (CV) of all tested materials under drought stress and control conditions. Principal component analysis was carried out using SPSS 20.0 (IBM Corp., Armonk, NY, USA). Correlations among traits were determined using Pearson correlation coefficients (Adler and Parmryd, 2010). Drought resistance (D) values for the drought tolerance capacity of each genotype were calculated using subordinate function analysis as described by Yan et al. (2020).
All other data were statistically analyzed by one-way analysis of variance (ANOVA) using SPSS 20.0. Values are shown as means ± standard deviation (SD). Significant differences between means were determined using Duncan multiple range tests. Values with P< 0.05 were considered statistically significant. Histograms and linear graphs were generated using Origin 2019 (OriginLab Corp., Northampton, MA, USA).
Results
Comprehensive evaluation of drought tolerance of E. sibiricus genotypes
Eight days after drought stress, 13 physiological traits associated with photosynthetic pigment contents, relative plasma membrane permeability, and chlorophyll fluorescence parameters were comprehensively assessed in the 52 E. sibiricus genotypes. These traits changed to varying degrees among the genotypes, and the CVD of REC and Fv/Fm were > 1 (100%). This indicated that these two traits were the most representative and were highly sensitive in the drought tolerance evaluation. Except for Fo and Fm, the CVD of the other 11 traits were all > 0.10 (10%) (Supplementary Table 3).
We then calculated the variance contribution of 11 traits (excluding Fo and Fm) using principal component analysis (PCA). The Eigen values of the top two principal components were > 1, and the cumulative variance contribution rate was 66.04% (Table 1). The Eigen value of the first principal component was 5.63 with a variance contribution rate of 51.18% (Table 1). Chlorophyll fluorescence parameters, including ΦPS II, NPQ, qP, Fv’/Fm’, and Fv/Fm, as well as MDA, had the top six highest factor load capacities (Table 1). These six traits closely correlated (P< 0.01); MDA correlated positively with NPQ and negatively with the other four traits (Supplementary Figure 1). Chl a and Chl b had the top two highest factor load capacities in the second principal component (Table 1).
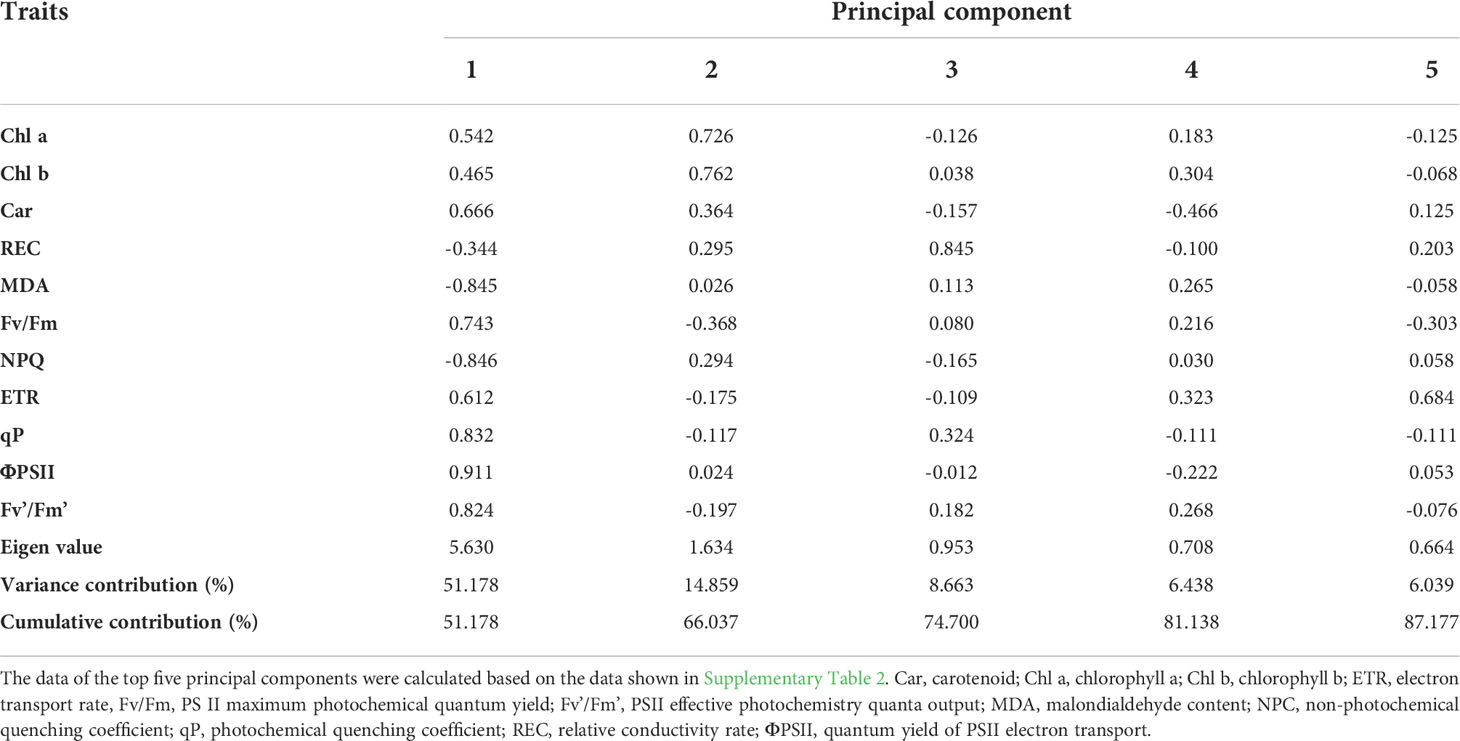
Table 1 Variance contribution of the top five principal components and factor load capacity.
The relative drought tolerance reflected by the D values of the other 11 traits for each genotype were calculated according to the trait relative value (Supplementary Table 4), and ranked by subordinate function (Table 2). Three genotypes, B-12-9-1, I-1-5-46, and I-1-5-63, with D values > 0.95, were the most drought tolerant genotypes. The other three genotypes, I-1-5-2, I-1-5-3, and I-1-5-53, with D values< 0.20, were the most drought-sensitive genotypes (Table 1). We then selected I-1-5-46 and I-1-5-2 as the DT and DS genotypes for further analysis.
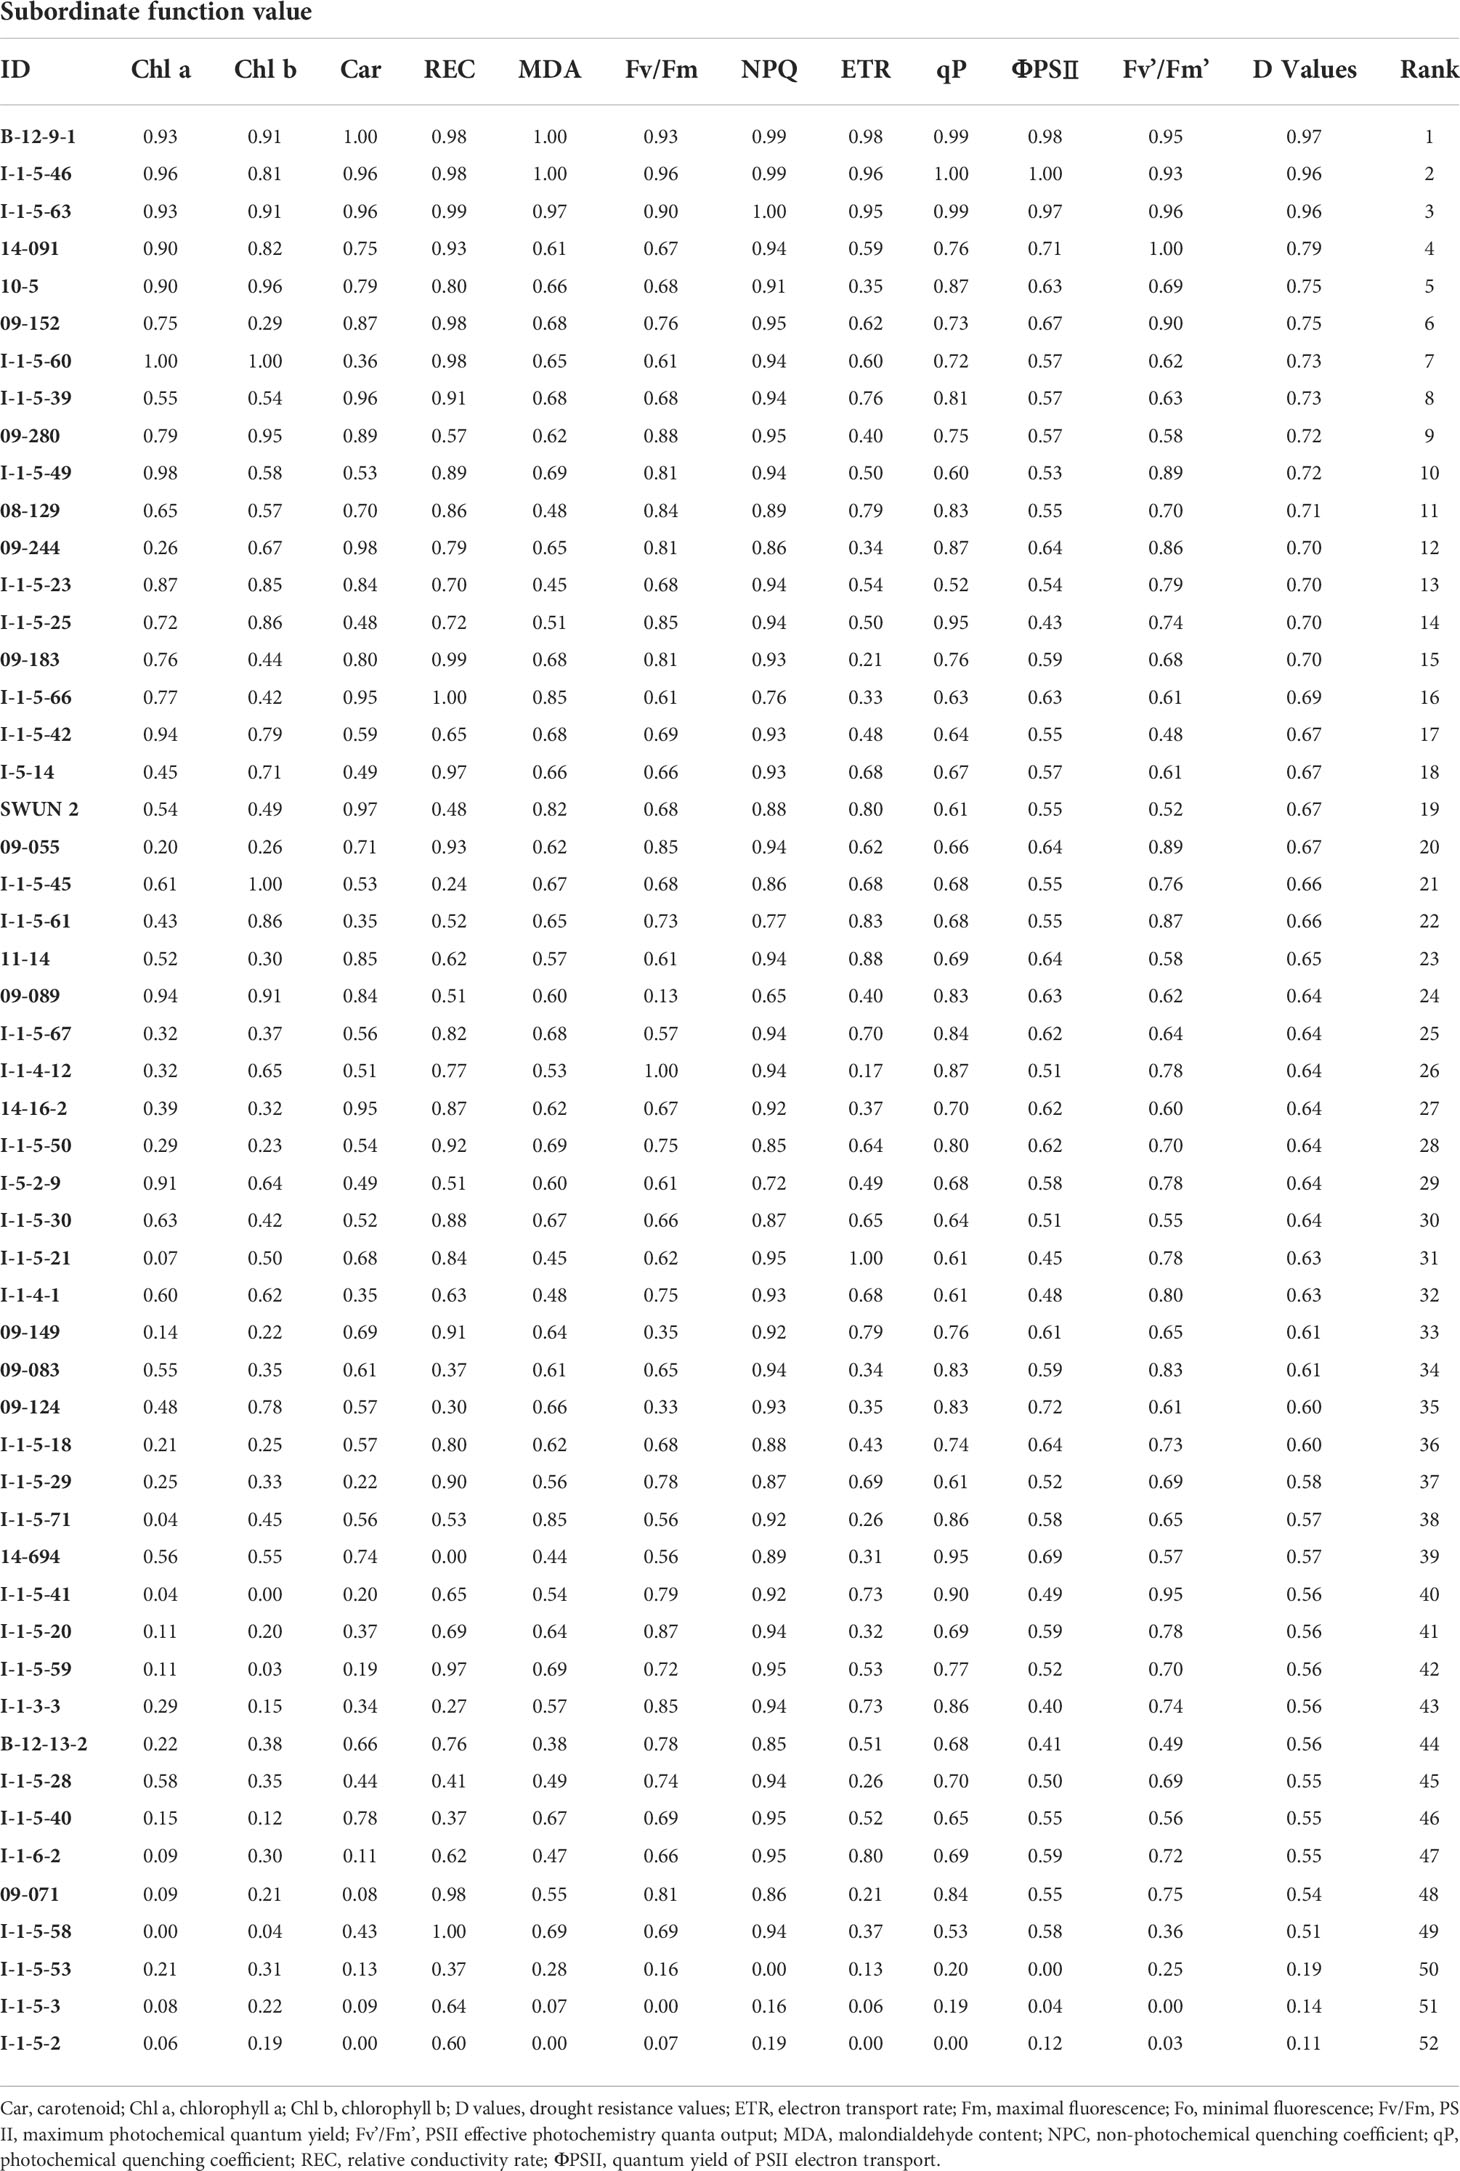
Table 2 Comprehensive evaluation through subordinate functions of 52 Elymus sibiricus genotypes.
Radial transport of water and nutrients in roots during water deficits
According to the composite transport model, radial water transport in plant roots can occur via apoplastic, symplastic and transcellular pathways (Kim et al., 2018; Kreszies et al., 2020). The radial water flow in plant roots is usually measured as hydraulic conductivity (Lpr in m s−1 MPa−1). The hydrostatic Lpr (Lphy) determines the water flow through both the apoplastic and cell-to-cell pathways, and the osmotic Lpr (Lpos) represents the water transport across the cell-to-cell pathway (Steudle, 2000; Kreszies et al., 2018). The ratios of Lphy to Lpos indicate which pathway contributes more to the overall water transport across the root (Steudle and Peterson, 1998; Kreszies et al., 2018). Here, Lphy was higher in DS than in DT, whereas the trend of Lpos was the opposite under non-stress conditions. Under osmotic stress, Lphy did not significantly differ between DS and DT, Lpos was higher in DS than in DT, and Lpos increased in DS but Lphy decreased in DT (Table 3). The ratio of Lphy to Lpos was higher in control DS, but osmotic stress significantly decreased it to< 1 (Table 3).
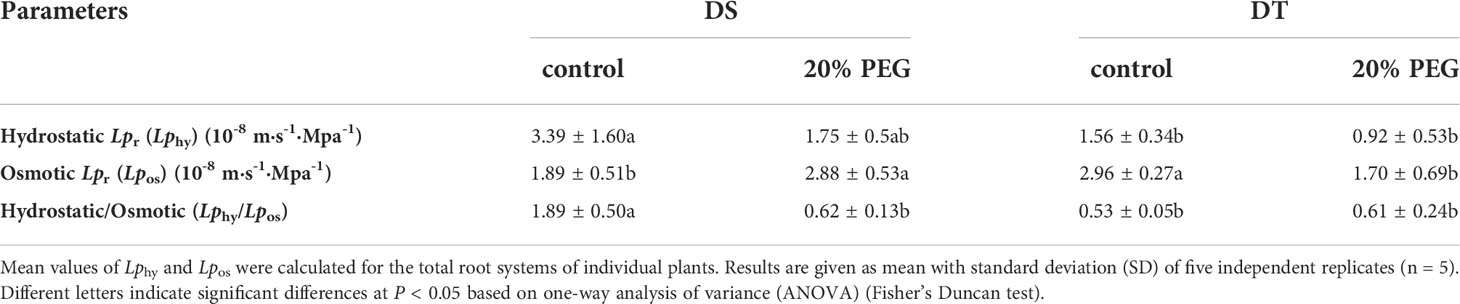
Table 3 Hydrostatic and osmotic hydraulic conductivity (Lpr) in drought-tolerant (DT) and drought-sensitive (DS) genotypes grown under control or osmotic stress conditions.
The fluorescent dye, PTS, is a tracer for the apoplastic pathway translocation of solutes as it does not cross cell membranes or adhere to cell walls (Yeo et al., 1987; Faiyue et al., 2010b; Wang et al., 2020a). Therefore, we investigated the apoplastic bypass flow of solutes in E. sibiricus using this dye. In the absence of osmotic stress, the shoot PTS concentration was significantly higher in DS than in DT, indicating that DS possessed more apoplastic pathway radial transport of solutes than DT, which was consistent with the apoplastic transport of water (Table 3). Osmotic stress abolished apoplastic solute influx in both DT and DS (Figure 1).
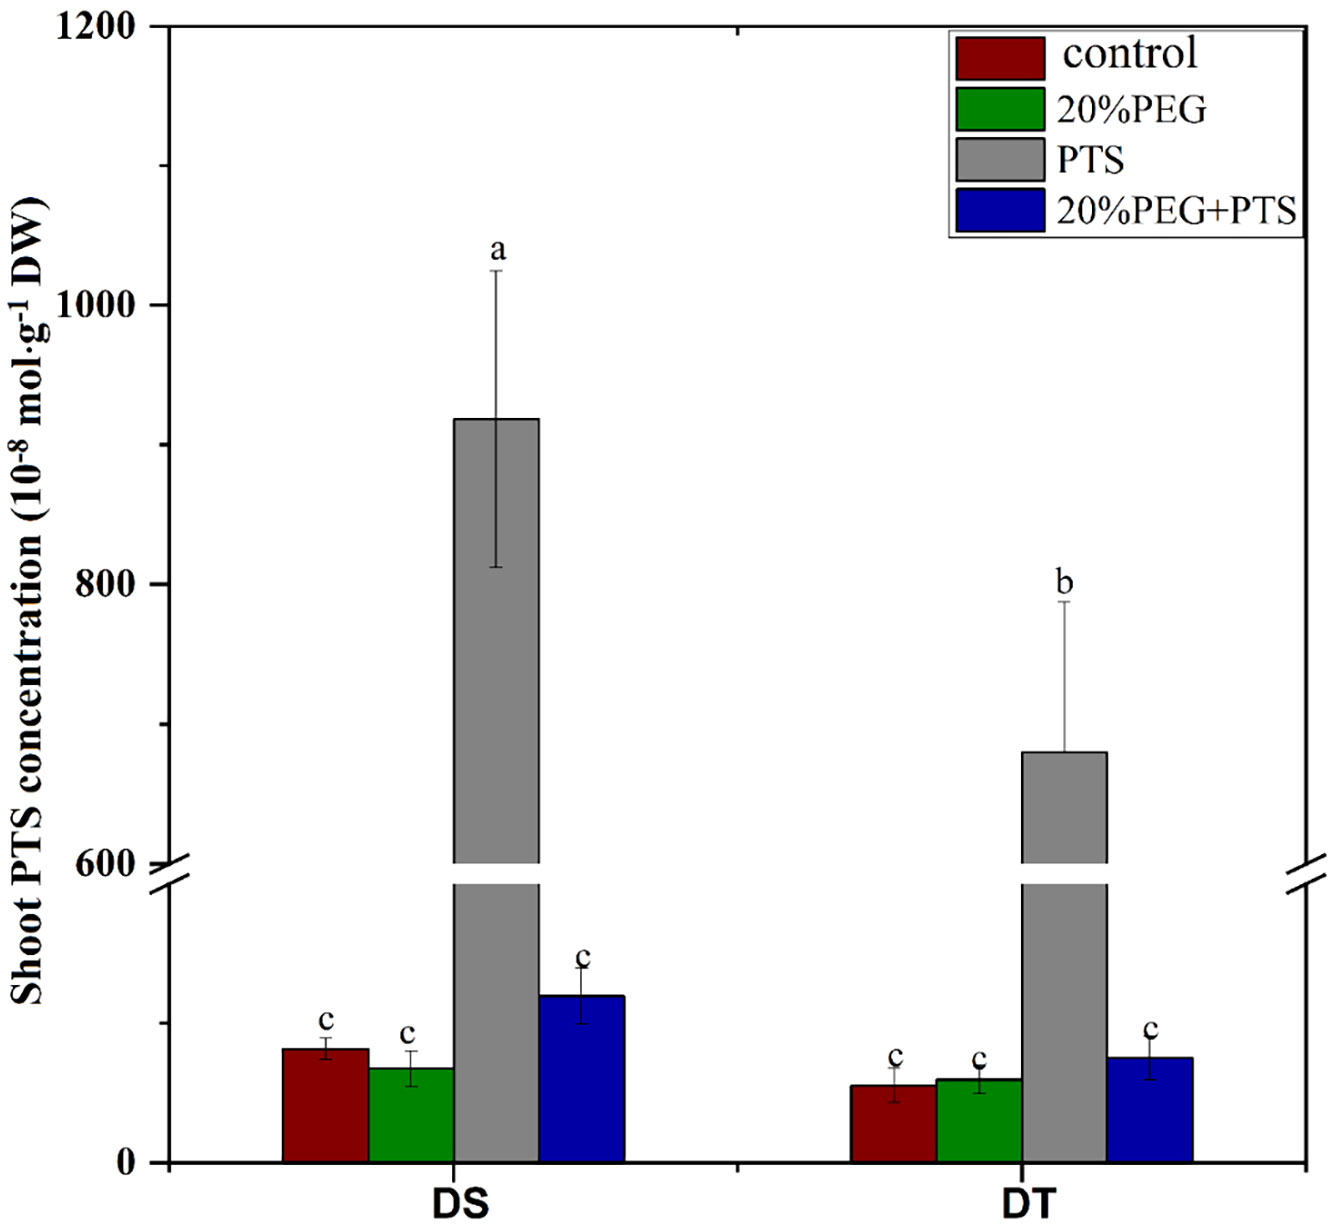
Figure 1 Trisodium-8-hydroxy-1,3,6-pyrenetrisulfonic acid (PTS) concentration in shoots of drought-tolerant (DT) and drought-sensitive (DS) genotypes grown under control or osmotic stress conditions. Plants were treated with 0.2 mM PTS or 0.2 mM PTS plus 20% (w/v) PEG 6000 for 72 h. Treatment without PTS was used as the negative control. Values are the mean ± standard deviation (SD) (n = 5). Different letters indicate significant differences at P < 0.05 based on one-way analysis of variance (ANOVA) (Fisher’s Duncan test). DW, dry weight.
We compared the mineral element profiles in shoots between DS and DT using ICP-MS. The concentrations of B, Na, Mg, K, Ca, Mn and Zn were significantly higher in DS than in DT under either control or osmotic stress conditions. However, the concentrations of Ni, Cu, and Al were lower in DS than in DT (Figure 2; Supplementary Table 5). Osmotic stress induced the accumulation of B, Mg, K, Ca, Mn, Fe, and Cu in shoots of DT and DS but increased the concentration of Ni and Al only in DT. Osmotic stress reduced Na accumulation in DT and Zn accumulation in DS (Figure 2; Supplementary Table 5).
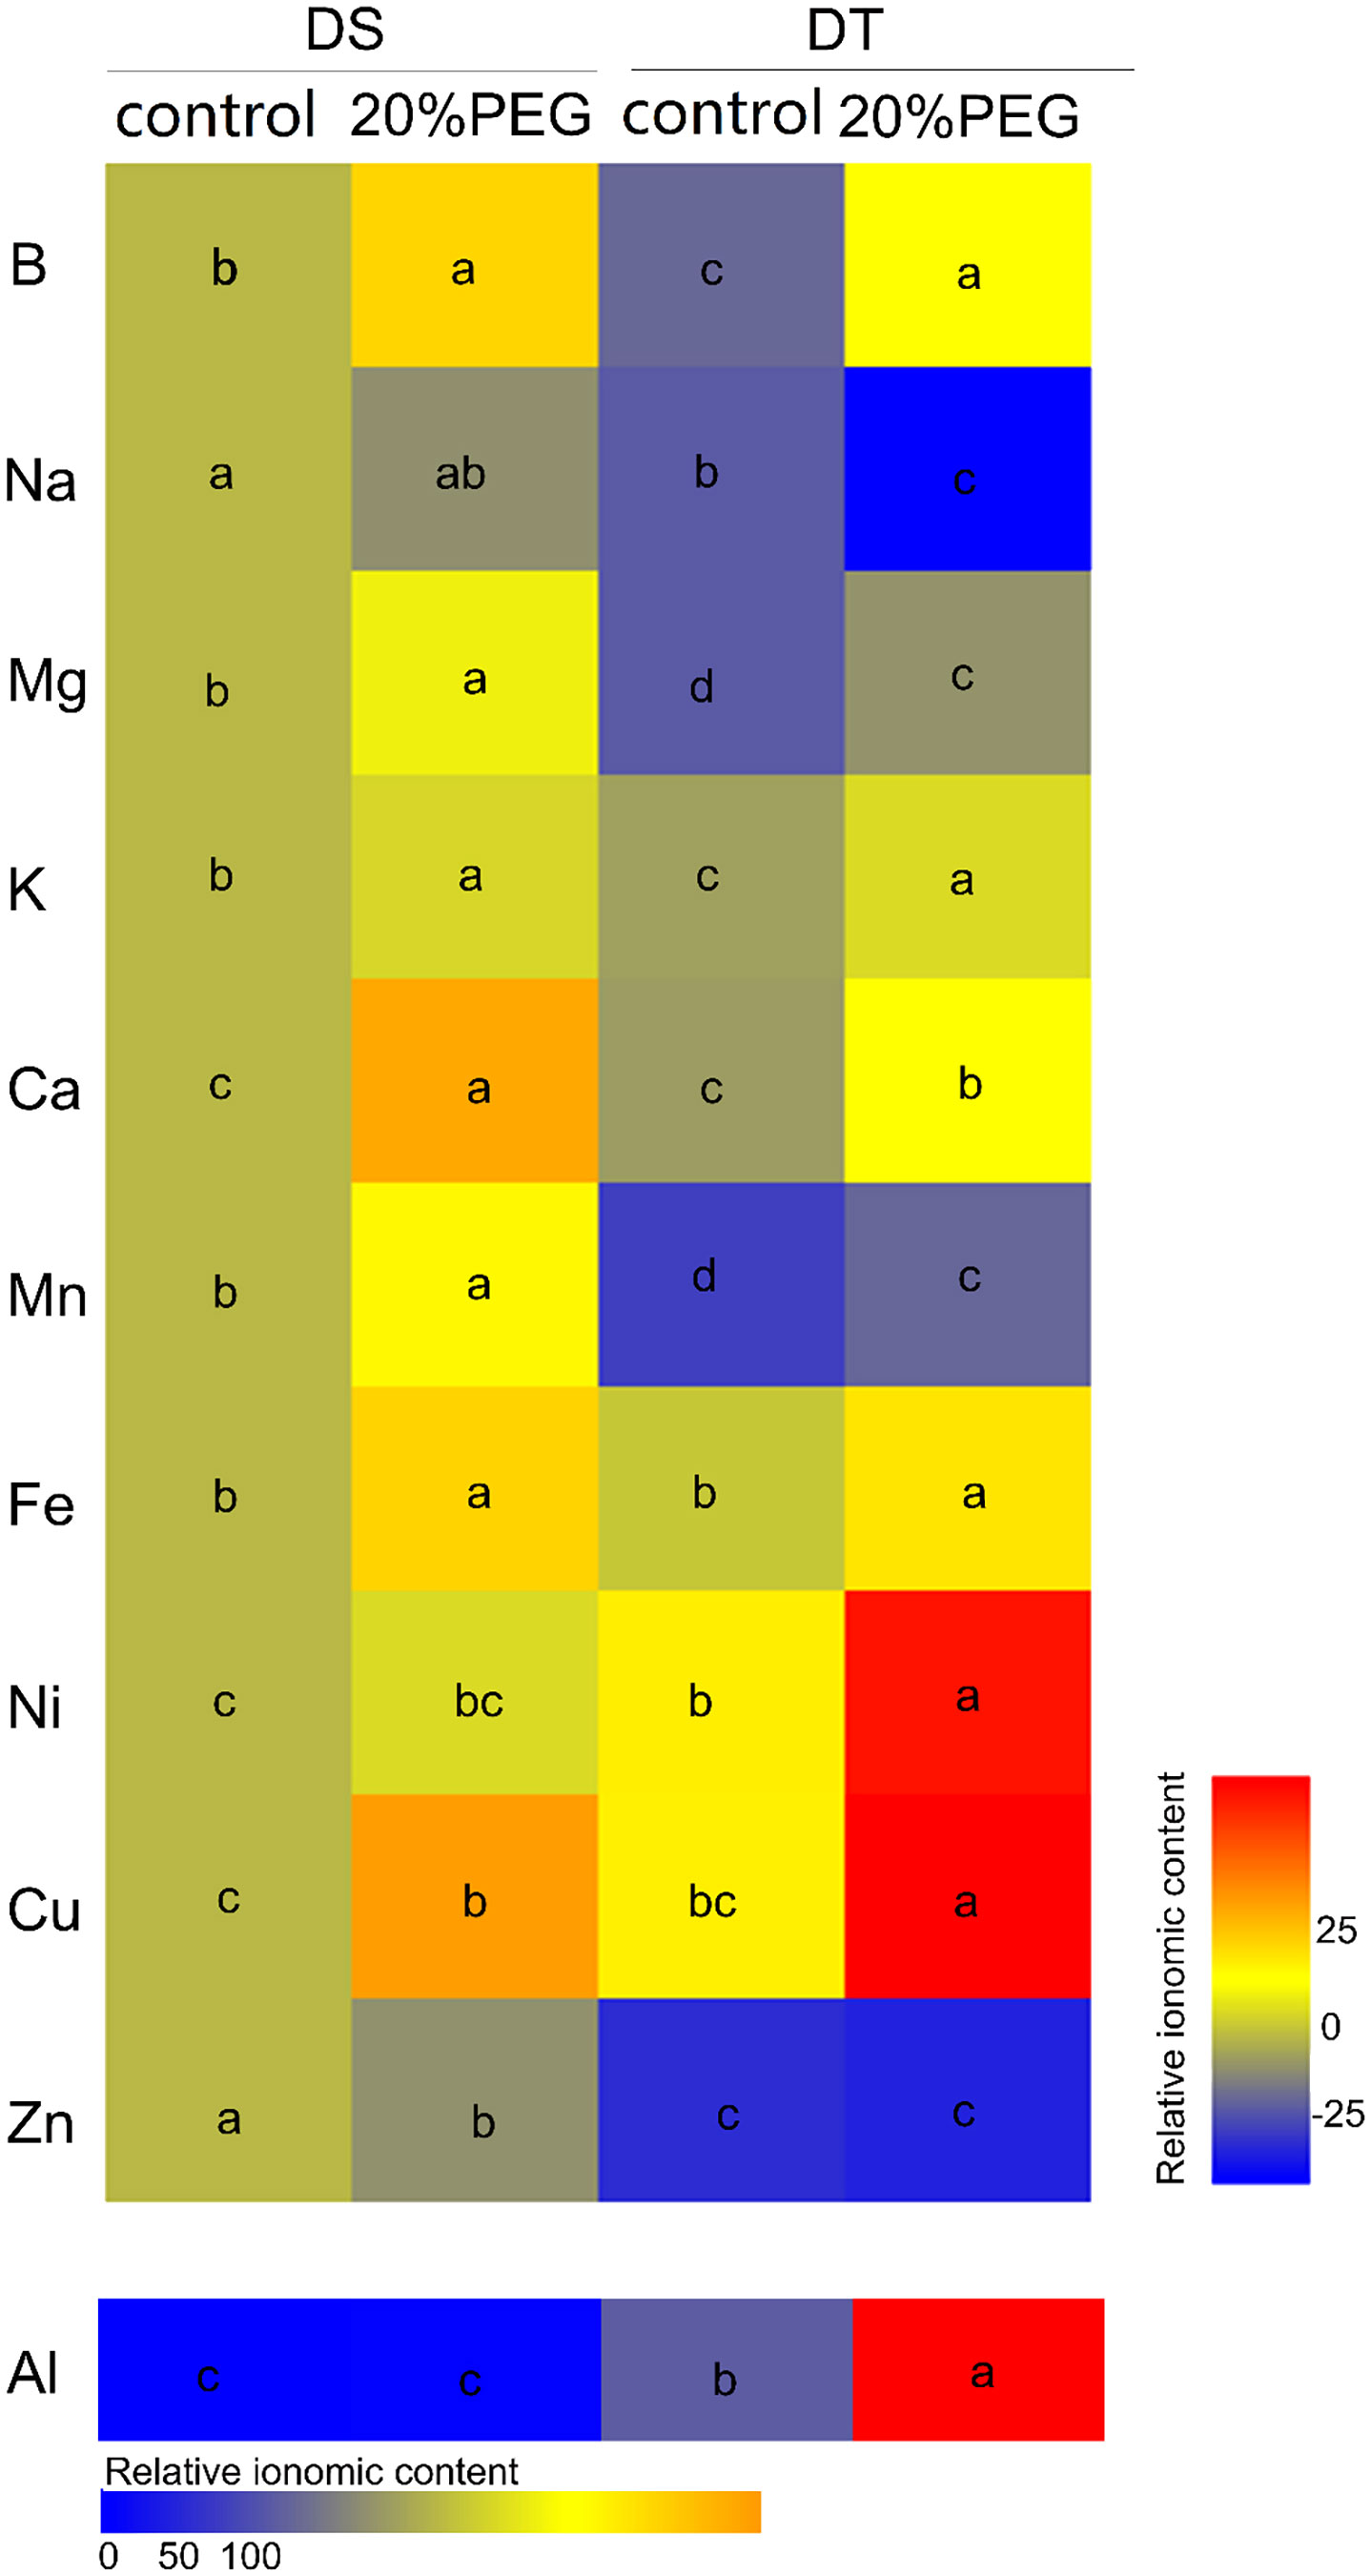
Figure 2 Mineral elemental accumulation in shoots of drought-tolerant (DT) and drought-sensitive (DS) genotypes grown under control or osmotic stress conditions. Mineral elemental concentrations were determined using inductively coupled plasma mass spectrometry (ICP-MS). Results are presented relative to the control DS values calculated from numeric values presented in Supplementary Table 5. Different letters indicate significant differences at P < 0.05 based on one-way analysis of variance (ANOVA) (Fisher’s Duncan test).
Root morphology and anatomy
We investigated the effects of PEG-induced osmotic stress on the root morphology and architecture of DT and DS to determine why root radial transport of water and mineral nutrients differed between the genotypes (Figures 3A–G). The results showed that DT had a larger root surface area, more root forks, and a higher root fractal dimension than DS under control conditions (Figures 3E–G). Osmotic stress reduced the seminal root length in DS but not in DT (Figure 3C), and decreased total root length and root forks in DT, but not in DS (Figure 3A, F). The average diameter of seminal roots and the root fractal dimension were significantly higher in DT than in DS under osmotic stress (Figures 3D, G).

Figure 3 Root morphology and architecture of drought-tolerant (DT) and drought-sensitive (DS) genotypes grown under control or osmotic stress conditions. (A) Root images. (B) Total root length. (C) Seminal root length. (D) Average diameter of seminal roots. (E) Root surface area. (F) Root forks. (G) Root fractal dimension. All values represent the roots of each plant and are shown as mean with standard deviation (SD) of five independent replicates (n = 5). Different letters indicate significant differences at P < 0.05 based on one-way analysis of variance (ANOVA) (Fisher’s Duncan test).
We assessed the development of CS and SL in roots by histochemical staining. Both the CS and SL were obvious in the endodermis, but not in the hypodermis, even at 60% of the total root length from the tip, under osmotic stress either in DT or DS (Supplementary Figure 2). Therefore, when grown hydroponically, seminal roots of E. sibiricus did not develop an exodermis, even under osmotic stress.
No CS was found at 12% of the root length in control and osmotic-stressed plants of both genotypes (Figure 4) and at 24% of the root length in the control DS. The first appearance of a weak “dot-like” CS signal in the control DS was found at 36% of the root length, and at 48%, a fully-formed CS appeared in many endodermal cells in the control DS (Figure 4A). Of note, a fully-formed CS continuously lines the entire radial wall of an endodermal cell, rather than having an initial dot-like structure (Kreszies et al., 2019; Li et al., 2020). The DS did not develop a complete CS even at 60% of the root length under control conditions (Figure 4A). The osmotically stressed DS developed a complete CS from 24% of the root length (Figure 4B). A fully-formed CS appeared in some endodermal cells at 24% of the root length in DT, and the CS was well-developed at 60% of the root length, with no obvious difference in DT between control and water-deficient conditions (Figures 4C, D).
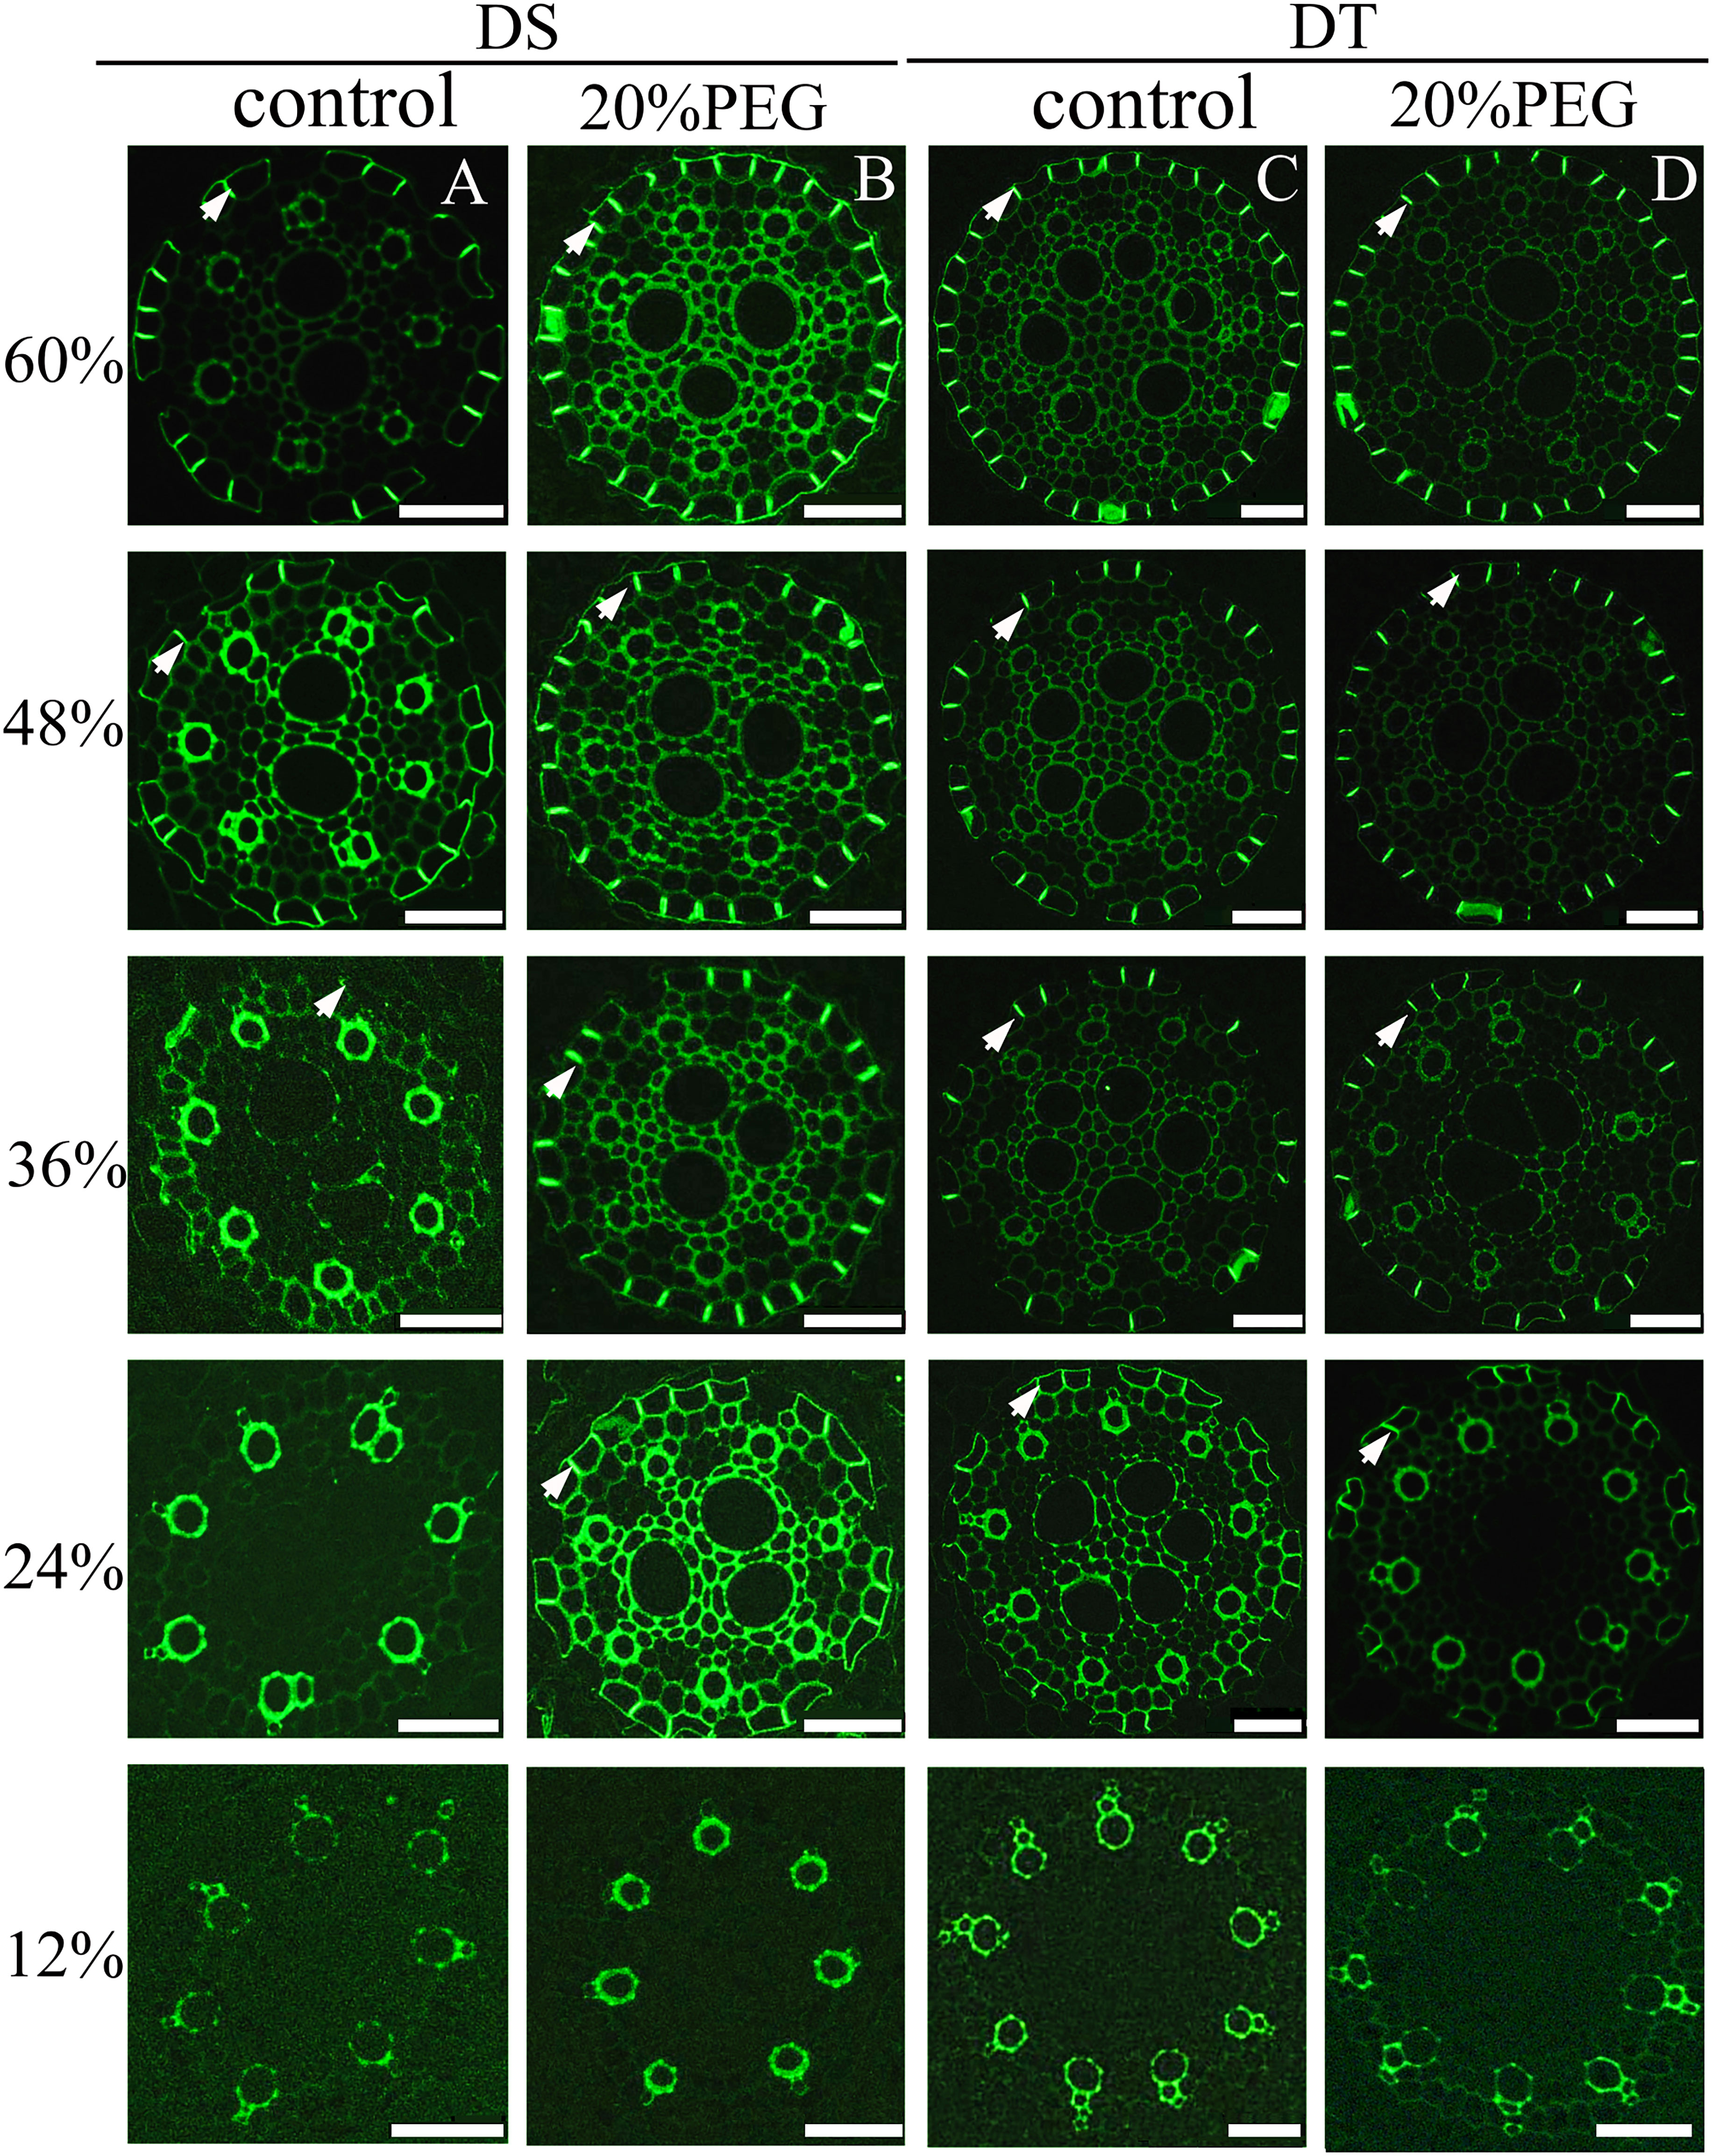
Figure 4 Fluorescence staining of Casparian strip (CS) in seminal roots of drought-tolerant (DT) and drought-sensitive (DS) genotypes grown under control or osmotic stress conditions. CS in seminal roots were stained with berberine hemisulfate for control DS (A), osmotic-stressed DS (B), control DT (C), and osmotic-stressed DT (D). Green fluorescent spots (white arrow) indicate the CS. Numbers on the vertical axis represent the distance from the tip as a percentage of the total root length (scale bars, 42.5 µm).
The developmental trend of the SL was very similar (Figure 5). The SL was not detectable at 12% of the root length in all plants. Patchy development of the SL was evident at 48% and 60% of the root length in the control DS (Figure 5A). The osmotically stressed DS had a patchy SL at 24% and 36%, and a well-developed SL at 48% and 60% of the root length. Very few endodermal cells without an SL were taken as passage cells (Figure 5B). A patchy SL was visible from 24%–48% along the main axis of the roots in control DT and detectable at 24%–36% of the root length in osmotically stressed DT. The SL was fully deposited at 48% and 60% of the root length in DT plants treated with PEG and was completely formed in control DT at 60% (Figures 5C, D).
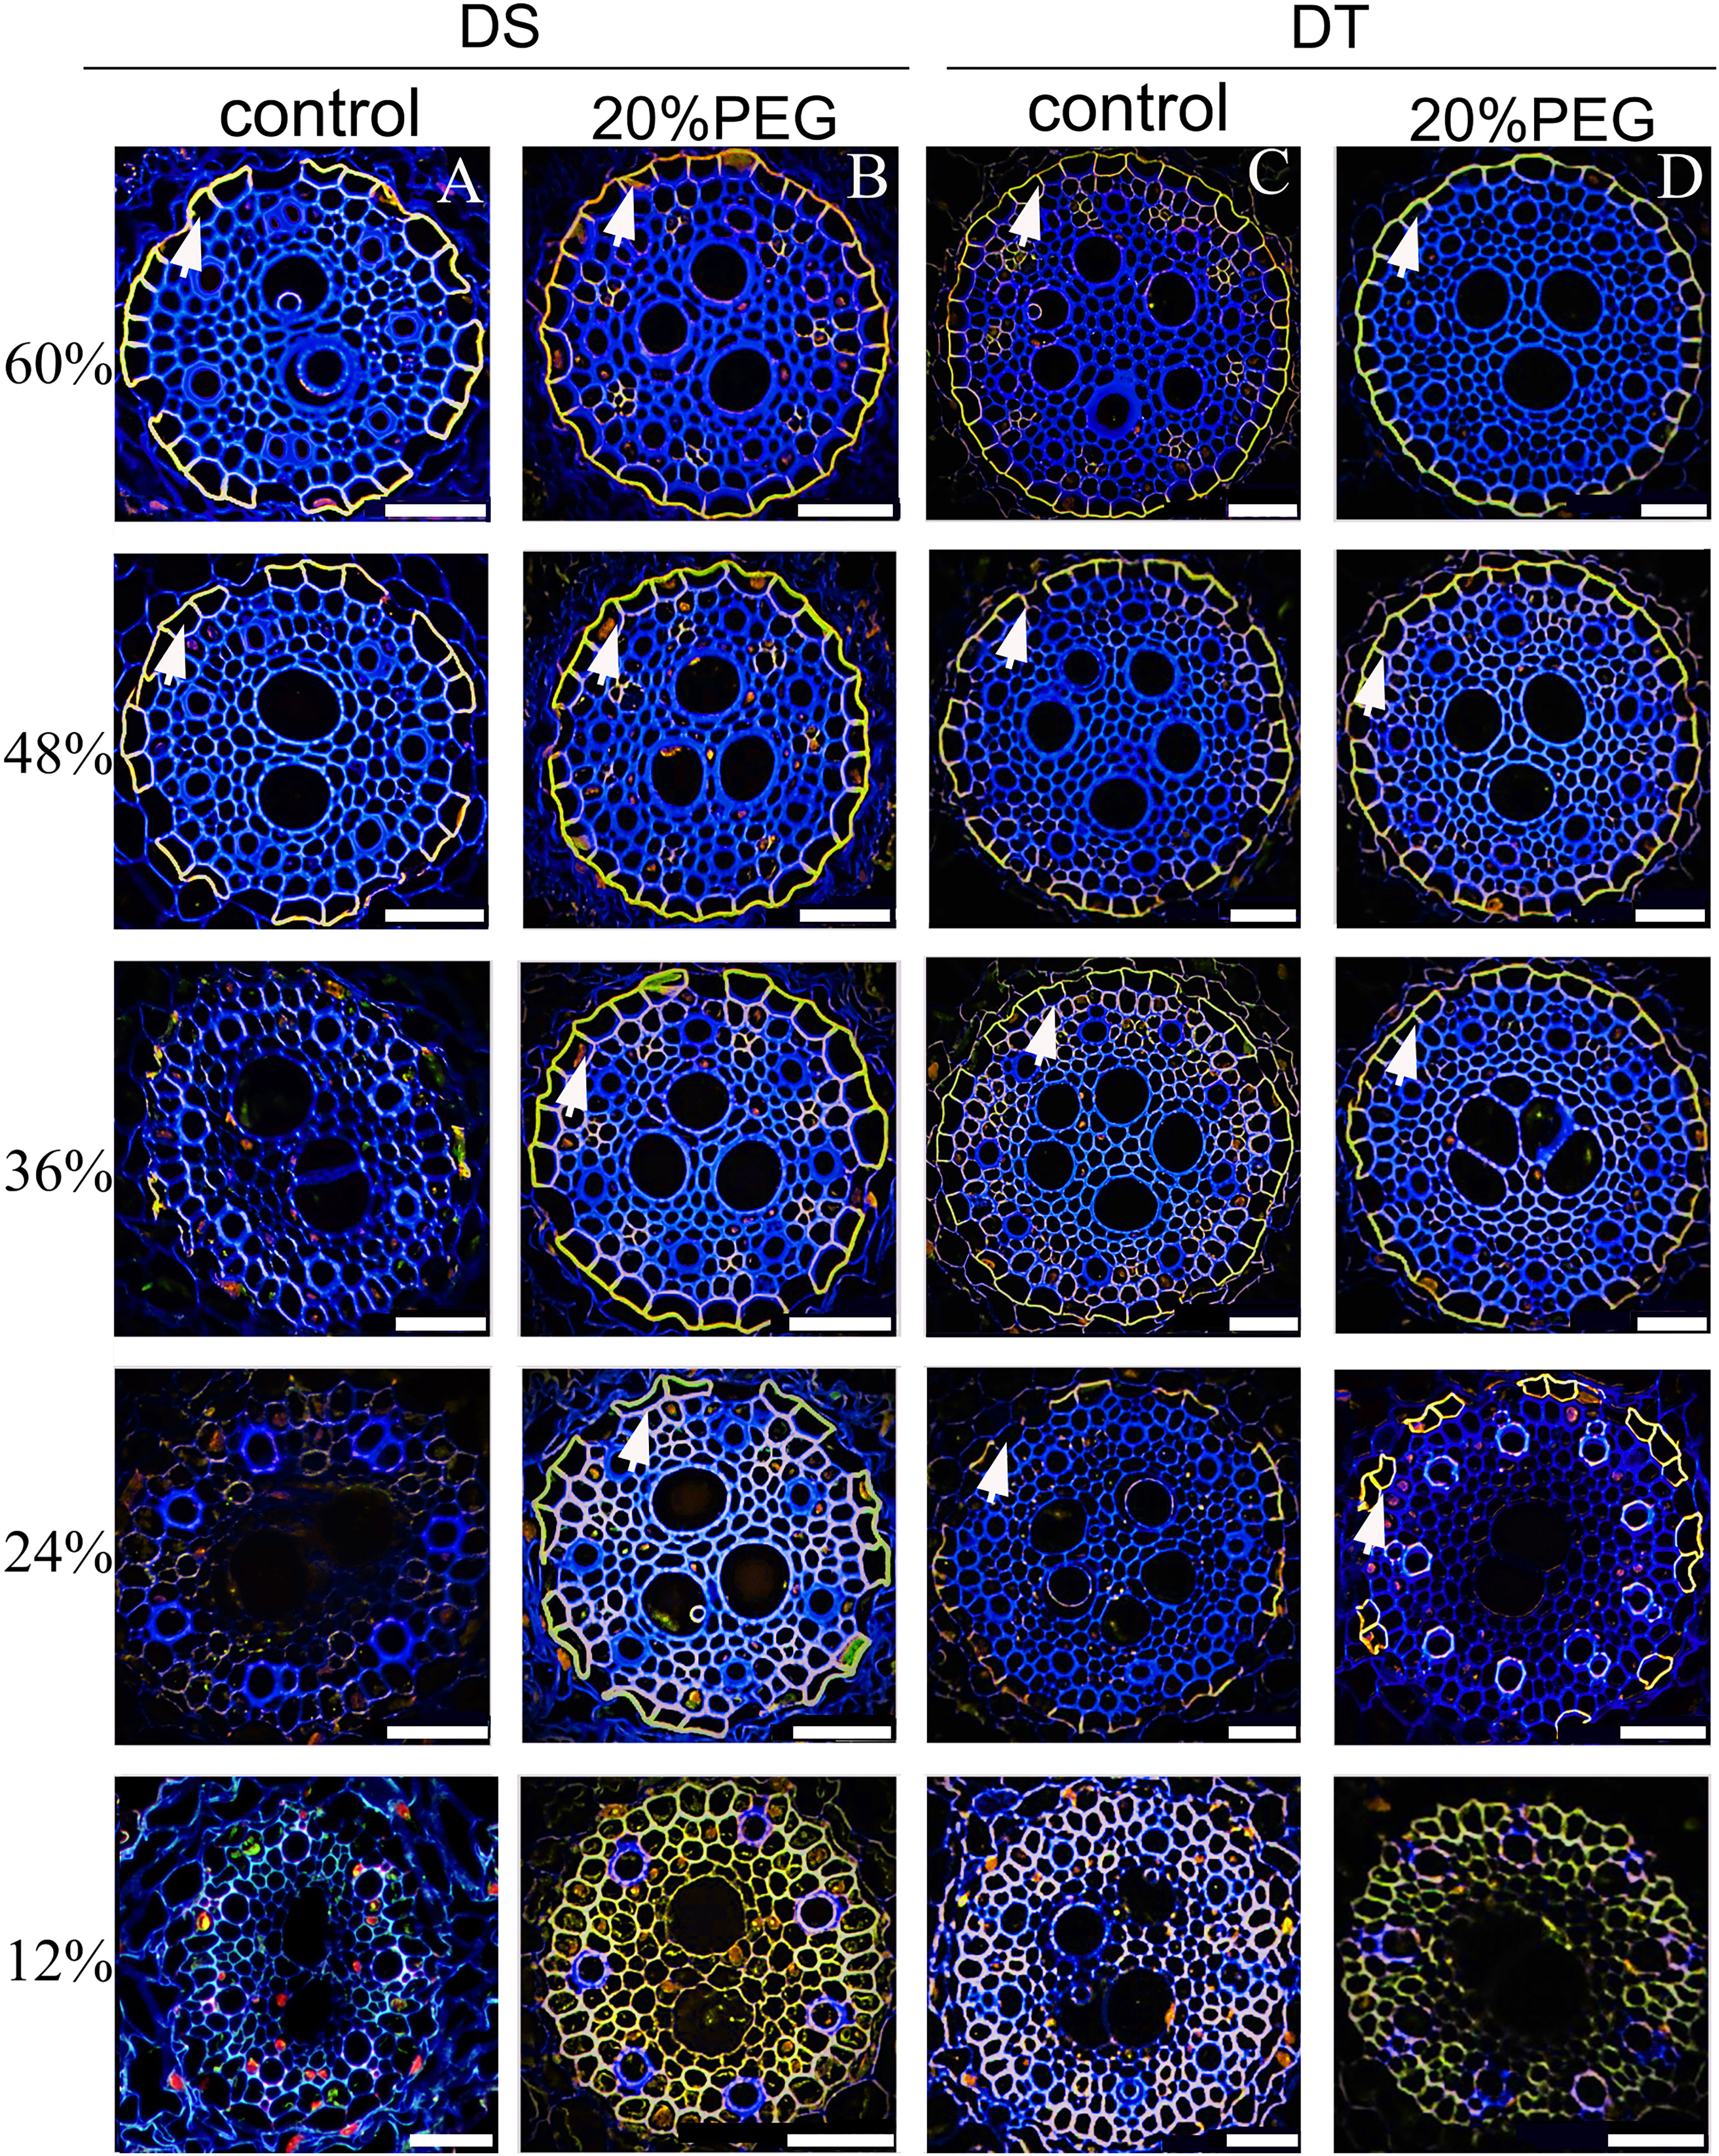
Figure 5 Fluorescence staining of suberin lamellae (SL) in seminal roots of drought-tolerant (DT) and drought-sensitive (DS) genotypes grown under control or osmotic stress conditions. The deposition of the SL in seminal roots was visualized by staining with Fluorol Yellow 088 for control DS (A), osmotic-stressed DS (B), control DS (C), and osmotic-stressed DT (D). The yellow fluorescent rings (white arrow) indicate the SL. Numbers on the vertical axis represent the distance from the tip as a percentage of the total root length (scale bars, 42.5 µm).
Chemical analysis of suberin of Elymus sibiricus in response to osmotic stress
Suberin monomer contents were analyzed to further determine differences between DT and DS in terms of root apoplastic barriers under control and osmotic stress conditions. The monomer classes in E. sibiricus aliphatic suberin comprised unsubstituted fatty acids (UFAs), α,ω-dicarboxylic acids (DCAs), and ω-OH acids. The most abundant aliphatic suberin monomers were UFAs and ω-OH acids. The chain lengths of the aliphatic suberin monomers varied from C16 to C24. The aromatic suberin monomer in E. sibiricus root comprised a series of different substance classes, namely vanillin (VA), salicylic (SAs), coumaric (CAs), and ferulic (FeAs) acids, of which FeAs and CAs were the most abundant aromatic components (Figure 6A). Aromatic suberin accounted for 76%–83% of the total suberin content (Figure 6A), which is consistent with that in other Gramineae species, such as rice and barley (Kreszies et al., 2018).
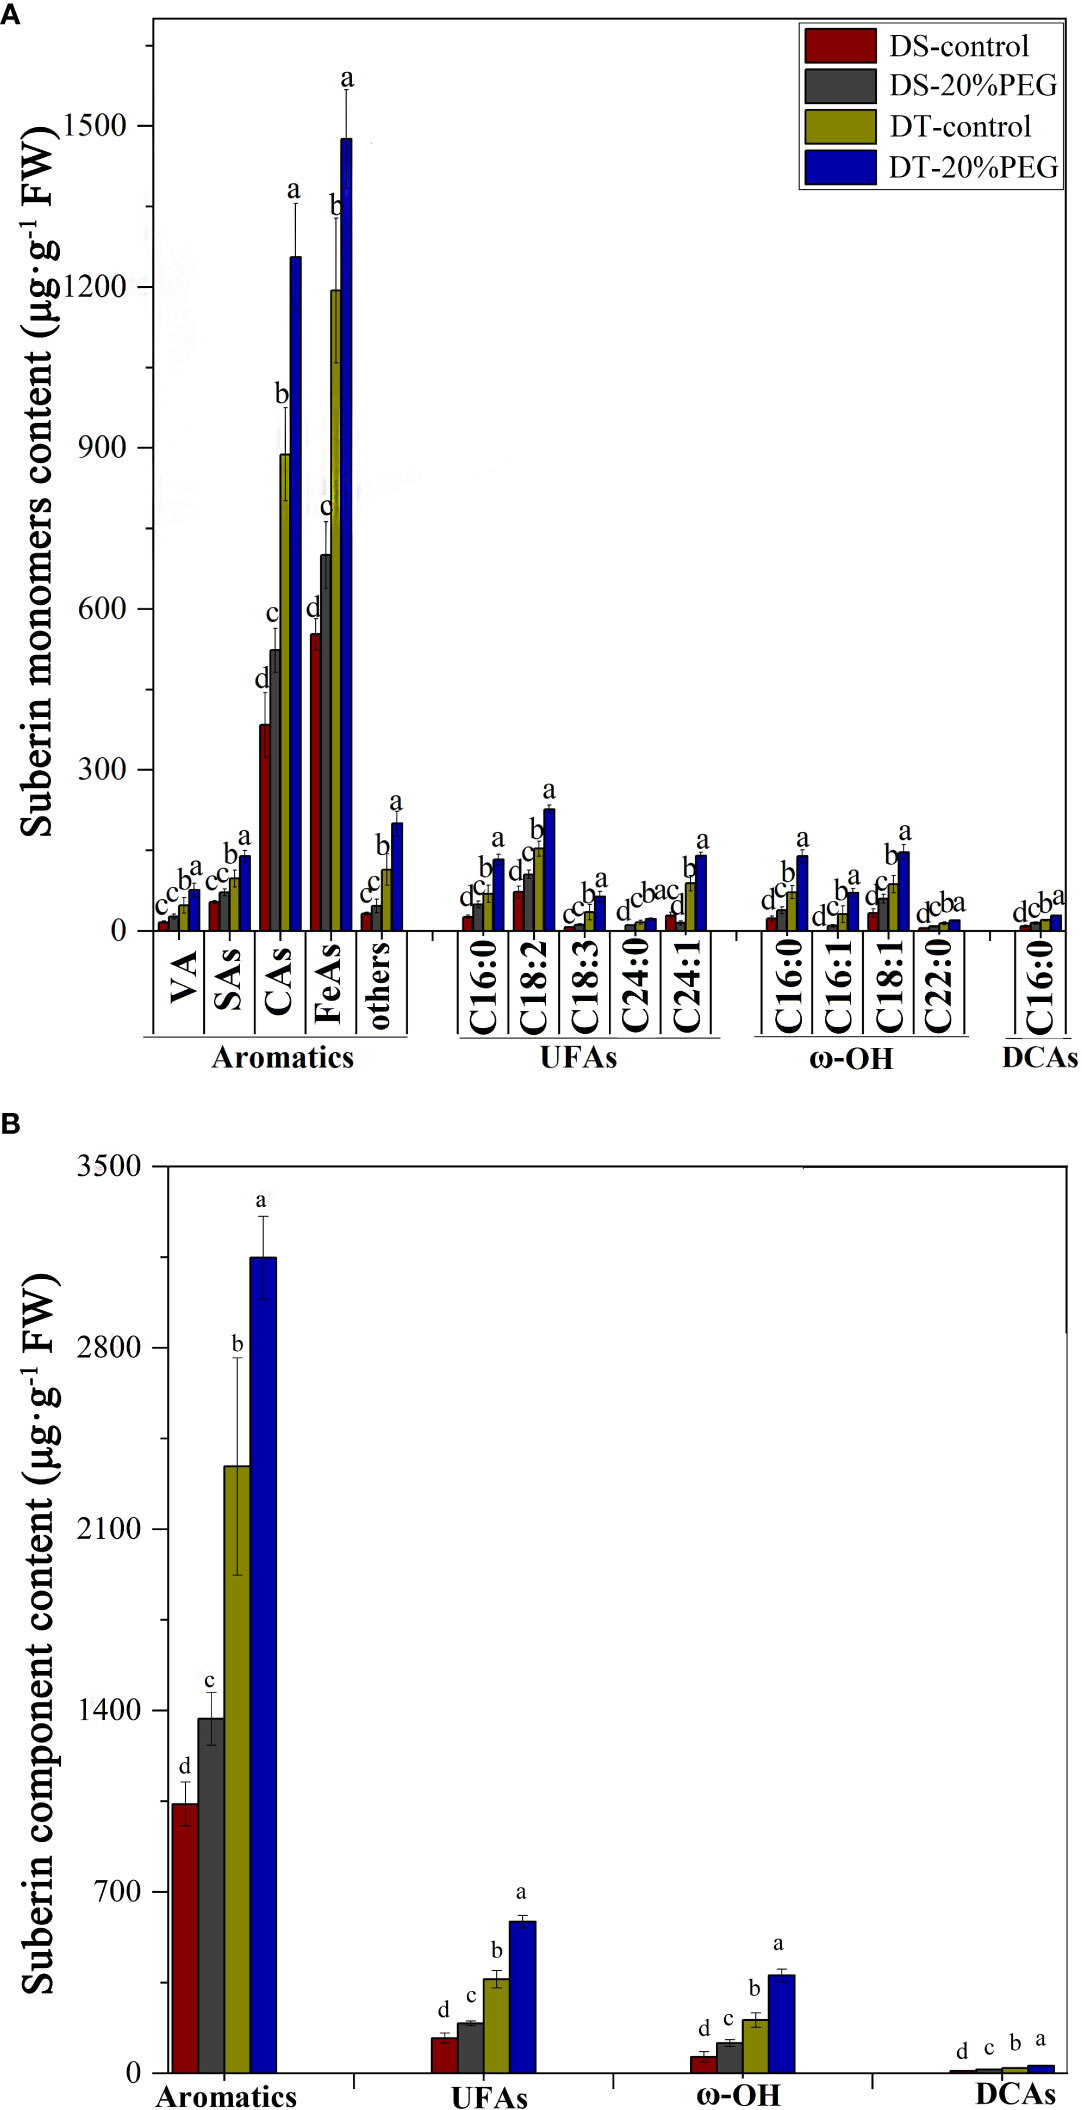
Figure 6 Amount of suberin in roots detected in drought-tolerant (DT) and drought-sensitive (DS) genotypes grown under control or osmotic stress conditions. (A) Amount of all detected monomers of suberin in roots. The substance classes of aromatic components include vanillin (VA), salicylic acids (SAs), coumaric acids (CAs), ferulic acids (FeAs), and others; the substance classes of aliphatic components included unsubstituted fatty acids (UFAs), ω-hydroxy acids (ω-OH), and α,ω-dicarboxylic acids (DCAs). (B) Amounts of major substance classes of suberin. Absolute amounts of suberin are shown as mean values in μg·g−1 fresh weight (FW) ± the standard deviation (SD) of four biological replicates (n = 4). Different letters indicate significant differences at P < 0.05 based on one-way analysis of variance (ANOVA) (Fisher’s Duncan test).
The abundance of all suberin monomers was significantly higher in DT than in DS (Figures 6A, B). The total suberin content was ~ 135% and 144% higher in DT than that in DS under control and osmotic stress conditions, respectively. Osmotic stress increased the suberin contents in DS and DT plants by ~ 35% and 41%, respectively, compared with controls (Figure 6C). Nevertheless, osmotic stress induction did not compensate for the lower suberin content in DS compared with DT (Figures 6A, B). Osmotic stress induced significant amounts of suberin, which closely corresponded with the histochemical staining results for SL in DS, but not in DT (Figure 5).
Expression of genes associated with apoplastic barriers
The relative expression of eight genes related to apoplastic barriers in roots were investigated by qRT-PCR. Among them, four each that were respectively associated with CS formation and suberin monomer synthesis comprised MYB36, SHR1 (also regulates root suberization), PER64, and CASP (Naseer et al., 2012; Hosmani et al., 2013; Kamiya et al., 2015; Wang et al., 2020b; Wang et al., 2022a; Xu et al., 2022), and MYB41, CYP86A1, KCS20, and FAR1 (Höfer et al., 2008; Lee et al., 2009; Domergue et al., 2010; Kosma et al., 2014; Shukla et al., 2021). Osmotic stress increased the expression of PER64 in DS (24 h), downregulated that of MYB36, SHR1, and CASP to varying degrees in DS, and only slightly affected that of the four genes related to CS formation in DT (Figures 7A–D). Osmotic stress for 24 increased the expression of KCS20 and FAR1 and decreased that of MYB41 in DS. Osmotic stress for 3 h downregulated transcription of the four genes associated with suberin synthesis in DS, whereas that for either 3 or 24 h induced their expression in DT (Figures 7E–H).
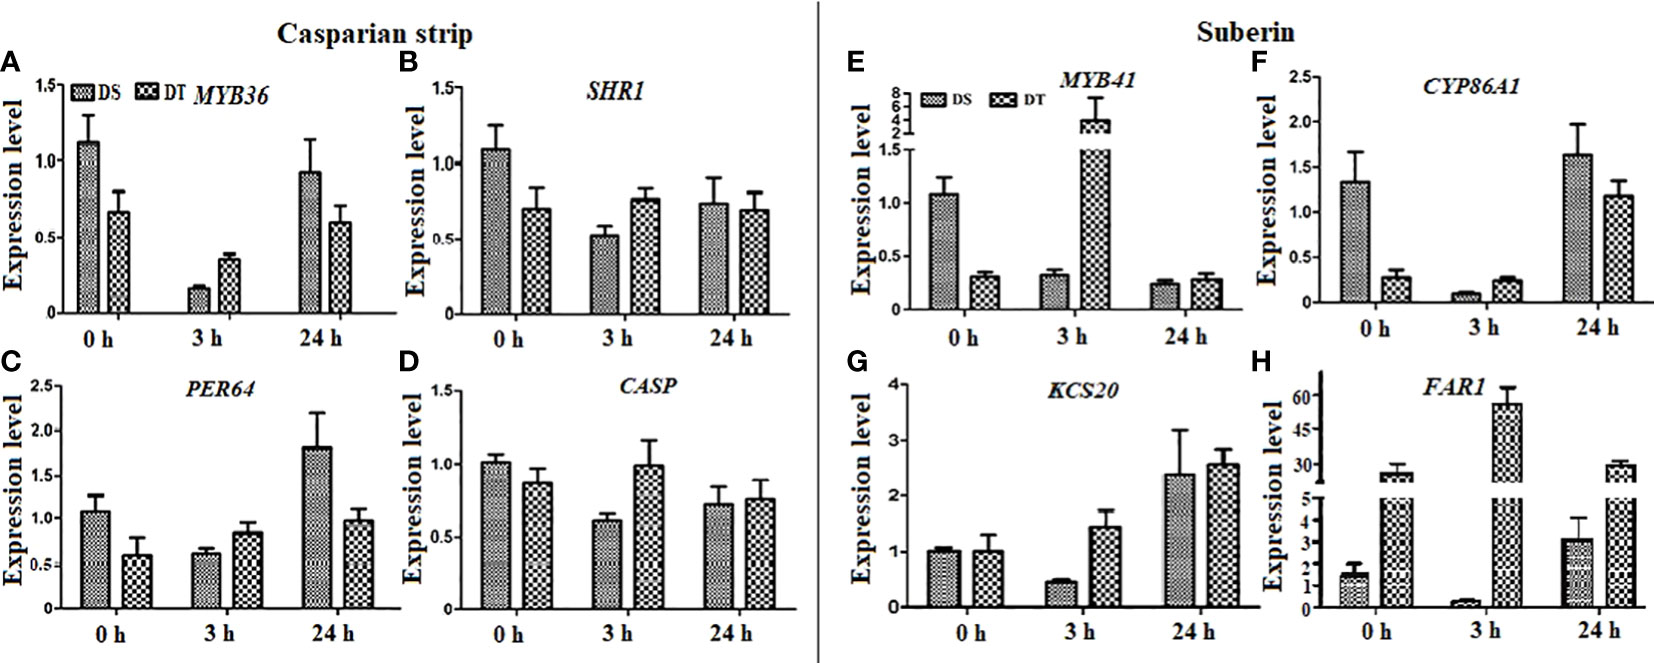
Figure 7 Expression levels of apoplastic barrier-related genes in drought-tolerant (DT) and drought-sensitive (DS) genotypes under osmotic stress conditions.Twenty-eight-day-old seedlings were subjected to 20% (w/v) PEG 6000 treatment for 0, 3, and 24 h. (A–D) Expression levels of Casparian strip-related genes. (E–H) Expression levels of suberin-related genes. DnaJ was used as a reference gene, and the relative expression levels of all genes were assessed using qRT-PCR. Values are mean ± standard deviation (SD) (n = 3).
Discussion
Roots absorb water from soil, sense water deficits in dry soil, and transduce signals during water deficits. Water flow in roots, which is usually measured as Lpr, varies according to growth conditions (Baxter et al., 2009; Wang et al., 2020a). Here, we selected drought-tolerant (I-1-5-46) and sensitive (I-1-5-2) E. sibiricus genotypes via a comprehensive evaluation and compared their differential root response mechanisms to drought. We found significantly lower overall water flow and lower apoplastic bypass flow of solutes, in DT, than in DS, in the absence of PEG 6000. Water and solutes were absorbed exclusively via the cell-to-cell pathway in response to osmotic stress (Table 3, Figure 1). The CS and SL are important barriers affecting apoplastic bypass flow of water and solutes in roots, and thus potentially play roles in abiotic stress tolerance, such as drought (Hose et al., 2001; Geldner, 2013; Wang et al., 2022a). In Arabidopsis, the cyp86a1/horst mutant, with a deficiency of aliphatic suberin, has increased Lphy, Lpos, and Lphy/Lpos, suggesting that aliphatic suberin plays a role in limiting water flow through the apoplastic and transcellular pathway (Ranathunge et al., 2011b). Most radial water uptake in barley occurs through weakly suberized younger roots (Ranathunge et al., 2017). Our histochemical, root hydraulic conductivity and PTS tracer findings precisely corresponded. The DT plants developed a CS and SL closer to the root tips and contained more abundant suberin monomer contents than DS in the absence of osmotic stress (Figures 4–6). The proportion of apoplastic bypass flow was higher in DS when endodermal barriers were not completely established. However, the deposition of barriers in the zone near the root tip largely blocked apoplastic water uptake, and the cell-to-cell pathway became the dominant transport route for root water uptake. A similar phenomenon has been found in barley (Kreszies et al., 2020). The Lpos notably increased in DS in response to osmotic stress, which might be a compensation strategy associated with enhanced aquaporin activity and might represent an adaptative mechanism of E. sibiricus to ensure sufficient water uptake under osmotic stress. Water uptake via the cell‐to‐cell pathway mainly depends on plasma membrane aquaporins (Grondin et al., 2016). The contribution of this pathway to water uptake can be reversibly regulated by rapidly modulating the activity of aquaporins in barley roots (Kaneko et al., 2015). The decrease in Lpos in osmotically stressed DT plants might be interpreted as thickened SL deposits blocking endodermal cell walls, thus reducing water uptake through transcellular pathways. Variations in suberin monomer arrangements and their microstructure in different cultivars might contribute to water movement in roots (Tao et al., 2017). More in-depth investigation into these aspects of cell physiology and ultrastructural observations are needed. Like water transport, the radial transport of solutes in roots under osmotic stress relied on the cell-to-cell pathway. This was compatible with previous findings that PEG reduces bypass flow in rice (Yeo et al., 1999; Faiyue, 2010a).
Suberized cell walls in the endodermis/exodermis of roots form transport barriers to water and solutes (Peterson and Cholewa, 1998). In fact, suberization of the endodermis/exodermis is characterized by CS and SL deposition. The endodermis is not distinguished from the cortex before differentiation, whereas the exodermis is formed via specialization of the hypodermis (Barberon et al., 2016; Doblas et al., 2017). We found here that E. sibiricus did not develop an exodermis under normal conditions and even under osmotic stress (Supplementary Figure 2). This is consistent with the findings in Arabidopsis and barley but differ from that in other gramineous plants, such as rice, maize, and sheepgrass (Leymus chinensis), which develop a strong exodermis in response to stress (Schreiber et al., 2005; Kreszies et al., 2018; Kreszies et al., 2019; Li et al., 2020). Elymus sibiricus is currently the only known species among forage grasses that does not develop an exodermis, which might make it a good model for investigating endodermal barriers without interference from the outer parts of roots. A fraction of seminal roots in one wild barley accession (Hordeum vulgare spp. spontaneum) is induced to form a lignified and suberized exodermis in response to osmotic stress (Kreszies et al., 2018). Moreover, the wetland barley species, Hordeum marinum, generally forms and reinforces an exodermis to prevent radial oxygen loss when grown under stagnant conditions (Kotula et al., 2017). Whether E. sibiricus could form an exodermis in response to other stresses, such as salt, waterlogging, or cold, remains unknown. However, these grass plants that can survive and grow in such harsh environments for long periods might have better adaptive potential than their cultivated relatives.
Osmotic stress enhances suberization but not lignification in barley (Kreszies et al., 2018). Chronic drought increases root suberin content but does not alter its lamellar structure in Arabidopsis (de Silva et al., 2021). The induction or strengthening of apoplastic barriers is also very pronounced when rice is exposed to salinity (Krishnamurthy et al., 2009) or stagnant deoxygenated conditions (Ranathunge et al., 2011a). Moreover, natural variations in salt tolerance (Krishnamurthy et al., 2009; Krishnamurthy et al., 2011) and Cd accumulation (Qi et al., 2020) between rice cultivars have been attributed to differences in root apoplastic barriers. Here, the responses of the CS and SL to osmotic stress differed between genotypes of E. sibiricus, which is the first such finding in forage grasses. The suberin contents were higher under non-stressed conditions in DT, than in DS induced by osmotic stress. We speculated that the development of a precocious endodermal barrier under non-stress conditions, to cope with possible adverse environmental factors, might be an important survival strategy of DT plants. We found that osmotic stress induced the CS and SL of DS to form closer to root tips, whereas their development in DT was not obviously changed by water deficits (Figures 4, 5). However, osmotic stress indeed increased suberin contents in DT. Therefore, the reinforcement of suberization induced by osmotic stress in DT was likely manifested by an increase in the thickness of the SL. However, this notion requires further verification by transmission electron microscopy. Such thickening of the CS has also been identified in response to salt stress in several plant species (Karahara et al., 2004; Prathumyot and Ehara, 2010; Al Kharusi et al., 2019; Cui et al., 2021; Wang et al., 2022b). The establishment of apoplastic barriers in lateral roots provides another explanation for the gap between observations based on the SL in seminal roots and the total root suberin contents in DT. An auxin-induced process requires the local breaking and resealing of endodermal apoplastic barriers during lateral root emergence in Arabidopsis (Ursache et al., 2021). However, our qRT-PCR data did not correspond to the structure and composition results (Figure 7). Considering that root apoplastic barriers are both involved in root development and induced by stress responses, the expression of related genes in different zones of the root was very different (Wang et al., 2019). Further detailed investigation is needed to address this.
Although the CS and SL in the root endodermis have been described as tight barriers blocking the non-selective apoplastic transport of solutes and water (Geldner, 2013; Nawrath et al., 2013), the CS or SL might participate in the selective uptake of mineral elements in Arabidopsis and rice (Baxter et al., 2009; Barberon et al., 2016; Wang et al., 2019; Cohen et al., 2020; Wang et al., 2022). Suberization also shows nutrient-induced plasticity, and regulated by hormones such as abscisic acid, ethylene, and auxin (Barberon et al., 2016; Ursache et al., 2021). Here, DT plants developed stronger apoplastic barriers and accumulated less Na, Mg, Mn, and Zn and more Ni, Cu, and Al than DS, regardless of osmotic stress (Figure 6). Whether this phenomenon is closely associated with the formation of the CS and SL remains unclear, but these results provide ideas for further investigation of the exact roles of apoplastic barriers in the selective uptake of mineral elements in grass plants. Furthermore, the present study found that except for Na and Zn, most of the mineral elements accumulated more in leaves under osmotic stress conditions in both DT and DS (Figure 6), suggesting a potential role for endodermal barriers in preventing mineral nutrient reflux to the soil under osmotic stress.
Root morphology and architecture play a pivotal role in plant drought responses (Bengough et al., 2011; Kreszies et al., 2019). Our results suggested that reduced lateral root formation, rather than total seminal root length, differentiates DT from DS when adapting to a water deficit (Figure 3). This result differs from the findings of a comparative study of barley and wild barley, which showed that wild barley always had longer seminal roots, regardless of osmotic stress (Kreszies et al., 2020). Furthermore, longer and thicker seminal roots, more lateral roots, and more complex root systems developed in DT than in DS plants. This suggested a genetically fixed developmental trend and a stronger drought response strategy in DT to uptake water in deeper and wider soil areas. Although our experiments proceeded under artificial hydroponic conditions.
Conclusions
We identified DT and DS E. sibiricus genotypes among 52 genotypes based on an evaluation of drought tolerance. The root apoplastic bypass flow of water and solutes, as well as mineral nutrient accumulation differed between DT and DS. In addition, E. sibiricus roots did not form an exodermis, endodermal barriers (CS and SL) were more developed, and more suberin monomers were deposited in DT than DS plants. Osmotic stress induced the formation of barriers closer to the root tip in DS, but possibly increased their thickness in DT. Our results suggested that the establishment of a complete apoplastic barrier in the endodermis facilitates drought tolerance of E. sibiricus. Apoplastic barriers might also contribute to natural variations in drought tolerance between the studied genotypes. The beneficial traits of DT (I-1-5-46) could be selected for future breeding programs to develop more drought tolerant crops and forage.
Data availability statement
The original contributions presented in the study are included in the article/Supplementary Material. Further inquiries can be directed to the corresponding author.
Author contributions
PeW conceived and designed the experiments. QZ and PeW provided experimental materials and chemical reagents. XL, PiW, YA, YH, and YZ implemented experiments and analyzed data. PeW and XL drafted the manuscript. C-MW and PeW reviewed and improved the manuscript. All authors have read and approved the published version of the manuscript.
Funding
This study was supported by grants from the National Natural Science Foundation of China (31802122) and the Fundamental Research Funds for the Central Universities (ZYN2022018).
Acknowledgments
We thank Wahap Isac (Servicebio) for technical assistance with the histochemical detection of Casparian strips and suberin lamellae. We thank Editage (www.editage.cn) for English language editing.
Conflict of interest
The authors declare that the research was conducted in the absence of any commercial or financial relationships that could be construed as a potential conflict of interest.
Publisher’s note
All claims expressed in this article are solely those of the authors and do not necessarily represent those of their affiliated organizations, or those of the publisher, the editors and the reviewers. Any product that may be evaluated in this article, or claim that may be made by its manufacturer, is not guaranteed or endorsed by the publisher.
Supplementary material
The Supplementary Material for this article can be found online at: https://www.frontiersin.org/articles/10.3389/fpls.2022.1007494/full#supplementary-material
References
Adler, J., Parmryd, I. (2010). Quantifying colocalization by correlation: the Pearson correlation coefficient is superior to the mander’s overlap coefficient. Cytom. Part A. 77, 733–742. doi: 10.1002/cyto.a.20896
Al Kharusi, L., Sunkar, R., Al-Yahyai, R., Yaish, M. W. (2019). Comparative water relations of two contrasting date palm genotypes under salinity. Int. J. Agron. 2019, 4262013. doi: 10.1155/2019/4262013
Barberon, M. (2017). The endodermis as a checkpoint for nutrients. New Phytol. 213 (4), 1604–1610. doi: 10.1111/nph.14140
Barberon, M., Vermeer, J. E. M., Bellis, D. D., Wang, P., Naseer, S., Andersen, T. G., et al. (2016). Adaptation of root function by nutrient-induced plasticity of endodermal differentiation. Cell. 164, 447–459. doi: 10.1016/j.cell.2015.12.021
Baxter, I., Hosmani, P. S., Rus, A., Lahner, B., Borevitz, J. O., Muthukumar, B., et al. (2009). Root suberin forms an extracellular barrier that affects water relations and mineral nutrition in arabidopsis. PloS Genet. 5, e1000492. doi: 10.1371/journal.pgen.1000492
Bengough, A. G., McKenzie, B. M., Hallett, P. D., Valentine, T. A. (2011). Root elongation, water stress, and mechanical impedance: a review of limiting stresses and beneficial root tip traits. J. Exp. Bot. 62, 59–68. doi: 10.1093/jxb/erq350
Bhusal, N., Lee, M., Lee, H., Adhikari, A., Han, A. R., Han, A., et al. (2021). Evaluation of morphological, physiological, and biochemical traits for assessing drought resistance in eleven tree species. Sci. Total Environ. 779, 146466. doi: 10.1016/j.scitotenv.2021.146466
Brundrett, M. C., Enstone, D. E., Peterson, C. A. (1988). A berberine-aniline blue fluorescent staining procedure for suberin, lignin, and callose in plant tissue. Protoplasma. 146, 133–142. doi: 10.1007/BF01405922
Campilho, A., Nieminen, K., Ragni, L. (2020). The development of the periderm: the final frontier between a plant and its environment. Curr. Opin. Plant Biol. 53, 10–14. doi: 10.1016/j.pbi.2019.08.008
Chaumont, F., Tyerman, S. D. (2014). Aquaporins: highly regulated channels controlling plant water relations. Plant Physiol. 164, 1600–1618. doi: 10.1104/pp.113.233791
Cohen, H., Fedyuk, V., Wang, C., Wu, S., Aharoni, A. (2020). Suberman regulates developmental suberization of the arabidopsis root endodermis. Plant J. 102, 431–447. doi: 10.1111/tpj.14711
Cui, B., Liu, R., Flowers, T. J., Song, J. (2021). Casparian bands and suberin lamellae: Key targets for breeding salt tolerant crops? Environ. Exp. Bot. 191, 104600. doi: 10.1016/j.envexpbot.2021.104600
de Silva, N., Murmu, J., Chabot, D., Hubbard, K., Ryser, P., Molina, I., et al. (2021). Root suberin plays important roles in reducing water loss and sodium uptake in Arabidopsis thaliana. Metabolites. 11, 735. doi: 10.3390/metabo11110735
Doblas, V. G., Geldner, N., Barberon, M. (2017). The endodermis, a tightly controlled barrier for nutrients. Curr. Opin. Plant Biol. 39, 136–143. doi: 10.1016/j.pbi.2017.06.010
Domergue, F., Vishwanath, S. J., Joubès, J., Ono, J., Lee, J. A., Bourdon, M., et al. (2010). Three arabidopsis fatty acyl-coenzyme a reductases, FAR1, FAR4, and FAR5, generate primary fatty alcohols associated with suberin deposition. Plant Physiol. 153 (4), 1539–1554. doi: 10.1104/pp.110.158238
Enstone, D. E., Peterson, C. A., Ma, F. (2002). Root endodermis and exodermis: structure, function, and responses to the environment. J. Plant Growth Regul. 21, 335–351. doi: 10.1007/s00344-003-0002-2
Faiyue, B., Al-Azzawi, M. J., Flowers, T. J. (2010b). The role of lateral roots in bypass flow in rice (Oryza sativa l.). Plant Cell Environ. 33 (5), 702–716. doi: 10.1111/j.1365-3040.2009.02078.x
Feng,, T., Wu, P., Gao, H., Kosma, D. K., Jenks, M. A., Lü, S., et al. (2022). Natural variation in root suberization is associated with local environment in Arabidopsis thaliana. New Phytol, in press. doi: 10.1111/nph.18341
Faiyue, B., Vijayalakshmi, C., Nawaz, S., Nagato, Y., Taketa, S., Ichii, M., et al. (2010a). Studies on sodium bypass flow in lateral rootless mutants lrt1 and lrt2, and crown rootless mutant crl1 of rice (Oryza sativa l.). Plant Cell Environ. 33 (5), 687–701. doi: 10.1111/j.1365-3040.2009.02077.x
Geldner, N. (2013). The endodermis. Annu. Rev. Plant Biol. 64, 531–558. doi: 10.1146/annurev-arplant-050312-120050
Grondin, A., Mauleon, R., Vadez, V., Henry, A. (2016). Root aquaporins contribute to whole plant water fluxes under drought stress in rice (Oryza sativa l.). Plant Cell Environ. 39 (2), 347–365. doi: 10.1111/pce.12616
Gupta, A., Rico-Medina, A., Caño-Delgado, A. I. (2020). The physiology of plant responses to drought. Science. 368, 266–269. doi: 10.1126/science.aaz7614
Höfer, R., Briesen, I., Beck, M., Pinot, F., Schreiber, L., Franke, R. (2008). The arabidopsis cytochrome P450 CYP86A1 encodes a fatty acid ω-hydroxylase involved in suberin monomer biosynthesis. J. Exp. Bot. 59 (9), 2347–2360. doi: 10.1093/jxb/ern101
Hose, E., Clarkson, D. T., Steudle, E., Schreiber, L., Hartung, W. (2001). The exodermis: a variable apoplastic barrier. J. Exp. Bot. 52, 2245–2264. doi: 10.1093/jexbot/52.365.2245
Hosmani, P. S., Kamiya, T., Danku, J., Naseer, S., Geldner, N., Guerinot, M. L., et al. (2013). Dirigent domain-containing protein is part of the machinery required for formation of the lignin-based casparian strip in the root. Proc. Natl. Acad. Sci. U.S.A. 110, 14498–14503. doi: 10.1073/pnas.1308412110
Jenkin, S., Molina, I. (2015). Isolation and compositional analysis of plant cuticle lipid polyester monomers. J. Vis. Exp. 105, e53386. doi: 10.3791/53386
Kamiya, T., Borghi, M., Wang, P., Danku, J. M., Kalmbach, L., Hosmani, P. S., et al. (2015). The MYB36 transcription factor orchestrates casparian strip formation. Proc. Natl. Acad. Sci. U.S.A. 112, 10533–10538. doi: 10.1073/pnas.1507691112
Kaneko, T., Horie, T., Nakahara, Y., Tsuji, N., Shibasaka, M., Katsuhara, M. (2015). Dynamic regulation of the root hydraulic conductivity of barley plants in response to salinity/osmotic stress. Plant Cell Physiol. 56, 875–882. doi: 10.1093/pcp/pcv013
Karahara, I., Ikeda, A., Kondo, T., Uetake, Y. (2004). Development of the casparian strip in primary roots of maize under salt stress. Planta. 219, 41–47. doi: 10.1007/s00425-004-1208-7
Kim, Y. X., Ranathunge, K., Lee, S., Lee, Y., Lee, D., Sung, J. (2018). Composite transport model and water and solute transport across plant roots: an update. Front. Plant Sci. 9. doi: 10.3389/fpls.2018.00193
Kosma, D. K., Murmu, J., Razeq, F. M., Santos, P., Bourgault, R., Molina, I., et al. (2014). AtMYB41 activates ectopic suberin synthesis and assembly in multiple plant species and cell types. Plant J. 80 (2), 216–229. doi: 10.1111/tpj.12624
Kotula, L., Schreiber, L., Colmer, T. D., Nakazono, M. (2017). Anatomical and biochemical characterisation of a barrier to radial O2 loss in adventitious roots of two contrasting Hordeum marinum accessions. Funct. Plant Biol. 44, 845–857. doi: 10.1071/FP16327
Kreszies, T., Eggels, S., Kreszies, V., Osthoff, A., Shellakkutti, N., Baldauf, J. A., et al. (2020). Seminal roots of wild and cultivated barley differentially respond to osmotic stress in gene expression, suberization, and hydraulic conductivity. Plant Cell Environ. 43 (2), 344–357. doi: 10.1111/pce.13675
Kreszies, T., Schreiber, L., Ranathunge, K. (2018). Suberized transport barriers in arabidopsis, barley and rice roots: from the model plant to crop species. J. Plant Physiol. 227, 75–83. doi: 10.1016/j.jplph.2018.02.002
Kreszies, T., Shellakkutti, N., Osthoff, A., Yu, P., Baldauf, J. A., Zeisler-Diehl, V. V., et al. (2019). Osmotic stress enhances suberization of apoplastic barriers in barley seminal roots: analysis of chemical, transcriptomic and physiological responses. New Phytol. 221 (1), 180–194. doi: 10.1111/nph.15351
Krishnamurthy, P., Ranathunge, K., Franke, R., Prakash, H. S., Schreiber, L., Mathew, M. K. (2009). The role of root apoplastic transport barriers in salt tolerance of rice (Oryza sativa l.). Planta. 230, 119–134. doi: 10.1007/s00425-009-0930-6
Krishnamurthy, P., Ranathunge, K., Nayak, S., Schreiber, L., Mathew, M. K. (2011). Root apoplastic barriers block na+ transport to shoots in rice (Oryza sativa l.). J. Exp. Bot. 62 (12), 4215–4228. doi: 10.1093/jxb/err135
Lee, S. B., Jung, S. J., Go, Y. S., Kim, H. U., Kim, J. K., Cho, H. J., et al. (2009). Two arabidopsis β-ketoacyl CoA synthase genes, KCS20 and KCS2/DAISY, are functionally redundant in cuticular wax and root suberin biosynthesis, but differentially controlled by osmotic stress. Plant J. 60 (3), 462–475. doi: 10.1111/j.1365-313X.2009.03973.x
Lian, H. L., Yu, X., Lane, D., Sun, W. N., Tang, Z. C., Su, W. A. (2006). Upland rice and lowland rice exhibited different PIP expression under water deficit and ABA treatment. Cell Res. 16, 651–660. doi: 10.1038/sj.cr.7310068
Li, L., Pan, S., Melzer, R., Fricke, W. (2020). Apoplastic barriers, aquaporin gene expression and root and cell hydraulic conductivity in phosphate-limited sheepgrass plants. Physiol. Plant 168 (1), 118–132. doi: 10.1111/ppl.12981
Liu, W., Zhang, Z., Chen, S., Ma, L., Wang, H., Dong, R., et al. (2016). Global transcriptome profiling analysis reveals insight into saliva-responsive genes in alfalfa. Plant Cell Rep. 35 (3), 561–571. doi: 10.1007/s00299-015-1903-9
Lux, A., Morita, S., Abe, J., Ito, K. (2005). An improved method for clearing and staining free-hand sections and whole-mount samples. Ann. Bot. 96, 989–996. doi: 10.1093/aob/mci266
Ma, X., Chen, S. Y., Zhang, X. Q., Bai, S. Q., Zhang, C. B. (2012). Assessment of worldwide genetic diversity of Siberian wildrye (Elymus sibiricus l.) germplasm based on gliadin analysis. Molecules. 17, 4424–4434. doi: 10.3390/molecules17044424
Martinka, M., Dolan, L., Pernas, M., Abe, J., Lux, A. (2012). Endodermal cell-cell contact is required for the spatial control of casparian band development in Arabidopsis thaliana. Ann. Bot. 110, 361–371. doi: 10.1093/aob/mcs110
Naseer, S., Lee, Y., Lapierre, C., Franke, R., Nawrath, C., Geldner, N. (2012). Casparian strip diffusion barrier in arabidopsis is made of a lignin polymer without suberin. Proc. Natl. Acad. Sci. U.S.A. 109, 10101–10106. doi: 10.1073/pnas.1205726109
Nawrath, C., Schreiber, L., Franke, R. B., Geldner, N., Reina-Pinto, J. J., Kunst, L. (2013). Apoplastic diffusion barriers in arabidopsis. Arabidopsis Book. 11, e0167. doi: 10.1199/tab.0167
Niu, S. Q., Li, H. R., Paul, W., Aziz, M., Wang, S. M., Shi, H., et al. (2016). Induced growth promotion and higher salt tolerance in the halophyte grass Puccinellia tenuiflora by beneficial rhizobacteria. Plant Soil. 407 (1-2), 1–14. doi: 10.1007/s11104-015-2767-z
Passioura, J. (2007). The drought environment: physical, biological and agricultural perspectives. J. Exp. Bot. 58 (2), 113–117. doi: 10.1093/jxb/erl212
Peterson, C. A., Cholewa, E. (1998). Structural modifications of the apoplast and their potential impact on ion uptake. (Proceeding of the German society of plant nutrition, Kiel, Germany). Z. Pflanzenernahrung und Bodenkunde. 161, 521–531. doi: 10.1093/insilicoplants/diab038
Pollard, M., Beisson, F., Li, Y., Ohlrogge, J. B. (2008). Building lipid barriers: biosynthesis of cutin and suberin. Trends Plant Sci. 13, 236–246. doi: 10.1016/j.tplants.2008.03.003
Prathumyot, W., Ehara, H. (2010). Identification of casparian strip in roots of Metroxylon sagu, a salt-resistant palm. J. Plant Physiol. 54, 91–97. doi: 10.11248/jsta.54.91
Qi, X., Tam, N. F., Li, W. C., Ye, Z. (2020). The role of root apoplastic barriers in cadmium translocation and accumulation in cultivars of rice (Oryza sativa l.) with different cd-accumulating characteristics. Environ. Pollut. 264, 114736. doi: 10.1016/j.envpol.2020.114736
Ranathunge, K., Kim, Y. X., Wassmann, F., Kreszies, T., Zeisler, V., Schreiber, L. (2017). The composite water and solute transport of barley (Hordeum vulgare) roots: effect of suberized barriers. Ann. Bot. 119, 629–643. doi: 10.1093/aob/mcw252
Ranathunge, K., Lin, J., Steudle, E., Schreiber, L. (2011a). Stagnant deoxygenated growth enhances root suberization and lignifications, but differentially affects water and NaCl permeabilities in rice (Oryza sativa l.) roots. Plant Cell Environ. 34, 1223–1240. doi: 10.1111/j.1365-3040.2011.02318.x
Ranathunge, K., Schreiber, L., Franke, R. (2011b). Suberin research in the genomics era–new interest for an old polymer. Plant Sci. 180, 399–413. doi: 10.1016/j.plantsci.2010.11.003
Ranathunge, K., Steudle, E., Lafitte, R. (2005). A new precipitation technique provides evidence for the permeability of casparian bands to ions in young roots of corn (Zea mays l.) and rice (Oryza sativa l.). Plant Cell Environ. 28 (11), 1450–1462. doi: 10.1111/j.1365-3040.2005.01391.x
Reddy, A. R., Chaitanya, K. V., Vivekanandan, M. (2004). Drought-induced responses of photosynthesis and antioxidant metabolism in higher plants. J. Plant Physiol. 161, 1189–1202. doi: 10.1016/j.jplph.2004.01.013
Rodríguez-Gamir, J., Xue, J., Clearwater, M. J., Meason, D. F., Clinton, P. W., Domec, J. C. (2019). Aquaporin regulation in roots controls plant hydraulic conductance, stomatal conductance, and leaf water potential in pinus radiata under water stress. Plant Cell Environ. 42 (2), 717–729. doi: 10.1111/pce.13460
Schreiber, L., Franke, R., Hartmann, K. D., Ranathunge, K., Steudle, E. (2005). The chemical composition of suberin in apoplastic barriers affects radial hydraulic conductivity differently in the roots of rice (Oryza sativa l. cv. IR64) and corn (Zea mays l. cv. helix). J. Exp. Bot. 56 (415), 1427–1436. doi: 10.1093/jxb/eri144
Schreiber, L., Hartmann, K., Skrabs, M., Zeier, J. (1999). Apoplastic barriers in roots: chemical composition of endodermal and hypodermal cell walls. J. Exp. Bot. 50 (337), 1267–1280. doi: 10.1093/jexbot/50.337.1267
Shukla, V., Han, J. P., Cléard, F., Lefebvre-Legendre, L., Gully, K., Flis, P., et al. (2021). Suberin plasticity to developmental and exogenous cues is regulated by a set of MYB transcription factors. P Natl. Acad. Sci. 118 (39), e210173011. doi: 10.1073/pnas.2101730118
Singh, V., Oosterom, E., Jordan, D., Messina, C., Cooper, M., Hammer, G. (2010). Morphological and architectural development of root systems in sorghum and maize. Plant Soil. 333 (1), 287–299. doi: 10.1007/s11104-010-0343-0
Steudle, E. (2000). Water uptake by roots: effects of water deficit. J. Exp. Bot. 51, 1531–1542. doi: 10.1093/jexbot/51.350.1531
Steudle, E., Peterson, C. A. (1998). How does water get through roots? J. Exp. Bot. 49, 775–788. doi: 10.1093/jexbot/49.322.775
Tao, Q., Jupa, R., Luo, J., Lux, A., Kováč, J., Wen, Y., et al. (2017). The apoplasmic pathway via the root apex and lateral roots contributes to cd hyperaccumulation in the hyperaccumulator Sedum alfredii. J. Exp. Bot. 68, 739–751. doi: 10.1093/jxb/erw453
Tsuda, M., Tyree, M. T. (2000). Plant hydraulic conductance measured by the high pressure flow meter in crop plants. J. Exp. Bot. 51, 823–828. doi: 10.1093/jexbot/51.345.823
Ursache, R., Teixeira, C. D. J. V., Tendon, V. D., Gully, K., De Bellis, D., Schmid-Siegert, E., et al. (2021). GDSL-domain proteins have key roles in suberin polymerization and degradation. Nat. Plants. 7, 353–364. doi: 10.1038/s41477-021-00862-9
Vishwanath, S. J., Delude, C., Domergue, F., Rowland, O. (2015). Suberin: biosynthesis, regulation, and polymer assembly of a protective extracellular barrier. Plant Cell Rep. 34 (4), 573–586. doi: 10.1007/s00299-014-1727-z
Wang, Y., Cao, Y., Liang, X., Zhuang, J., Wang, X., Qin, F., et al. (2022b). A dirigent family protein confers variation of casparian strip thickness and salt tolerance in maize. Nat. Commun. 13(1), 2222. doi: 10.1038/s41467-022-29809-0
Wang, P., Wang, C. M., Gao, L., Cui, Y. N., Yang, H. L., de Silva, N. D. G., et al. (2020a). Aliphatic suberin confers salt tolerance to arabidopsis by limiting na+ influx, k+ efflux and water backflow. Plant Soil 448, 603–620. doi: 10.1007/s11104-020-04464-w
Wang, C., Wang, H., Li, P., Li, H., Xu, C., Cohen, H., et al. (2020b). Developmental programs interact with abscisic acid to coordinate root suberization in arabidopsis. Plant J. 104 (1), 241–251. doi: 10.1111/tpj.14920
Wang, Z., Yamaji, N., Huang, S., Zhang, X., Shi, M., Fu, S., et al. (2019). OsCASP1 is required for casparian strip formation at endodermal cells of rice roots for selective uptake of mineral elements. Plant Cell. 31 (11), 2636–2648. doi: 10.1105/tpc.19.00296
Wang, Z., Zhang, B., Chen, Z., Wu, M., Chao, D., Wei, Q., et al. (2022a). Three OsMYB36 members redundantly regulate casparian strip formation at the root endodermis. Plant Cell 34(8):2948–2968. doi: 10.1093/plcell/koac140
Xie, W., Zhang, J., Zhao, X., Zhang, Z., Wang, Y. (2017). Transcriptome profiling of Elymus sibiricus, an important forage grass in qinghai-Tibet plateau, reveals novel insights into candidate genes that potentially connected to seed shattering. BMC Plant Biol. 17 (1), 1–15. doi: 10.1186/s12870-017-1026-2
Xu, H., Liu, P., Wang, C., Wu, S., Dong, C., Lin, Q., et al. (2022). Transcriptional networks regulating suberin and lignin in endodermis link development and ABA response. Plant Physiol. in press. doi: 10.1093/plphys/kiac298
Yan, C., Song, S., Wang, W., Wang, C., Li, H., Wang, F., et al. (2020). Screening diverse soybean genotypes for drought tolerance by membership function value based on multiple traits and drought-tolerant coefficient of yield. BMC Plant Biol. 20, 321. doi: 10.1186/s12870-020-02519-9
Yeo, A. R., Flowers, S. A., Rao, G., Welfare, K., Senanayake, N., Flowers, T. J. (1999). Silicon reduces sodium uptake in rice (Oryza sativa l.) in saline conditions and this is accounted for by a reduction in the transpirational bypass flow. Plant Cell Environ. 22, 559–565. doi: 10.1046/j.1365-3040.1999.00418.x
Yeo, A. R., Yeo, M. E., Flowers, T. J. (1987). The contribution of an apoplastic pathway to sodium uptake by rice roots in saline conditions. J. Exp. Bot. 38, 1141–1153. doi: 10.1093/jxb/38.7.1141
Zeier, J., Schreiber, L. (1997). Chemical composition of hypodermal and endodermal cell walls and xylem vessels isolated from Clivia miniata (identification of the biopolymers lignin and suberin). Plant Physiol. 113, 1223–1231. doi: 10.1104/pp.113.4.1223
Zhang, M. X., Bai, R., Nan, M., Ren, W., Wang, C. M., Shabala, S., et al. (2022). Evaluation of salt tolerance of oat cultivars and the mechanism of adaptation to salinity. J. Plant Physiol. 273, 153708. doi: 10.1016/j.jplph.2022.153708
Zhang, L., Merlin, I., Pascal, S., Bert, P. F., Domergue, F., Gambetta, G. A. (2020). Drought activates MYB41 orthologs and induces suberization of grapevine fine roots. Plant Direct. 4, e0027. doi: 10.1002/pld3.278
Keywords: casparian strip, drought tolerance, Elymus sibiricus, endodermis, suberin
Citation: Liu X, Wang P, An Y, Wang C-M, Hao Y, Zhou Y, Zhou Q and Wang P (2022) Endodermal apoplastic barriers are linked to osmotic tolerance in meso-xerophytic grass Elymus sibiricus. Front. Plant Sci. 13:1007494. doi: 10.3389/fpls.2022.1007494
Received: 30 July 2022; Accepted: 05 September 2022;
Published: 23 September 2022.
Edited by:
Jin-Lin Zhang, Lanzhou University, ChinaReviewed by:
Min Yu, Foshan University, ChinaMark A. Bernards, Western University, Canada
Yanjun Guo, Qingdao Agricultural University, China
Copyright © 2022 Liu, Wang, An, Wang, Hao, Zhou, Zhou and Wang. This is an open-access article distributed under the terms of the Creative Commons Attribution License (CC BY). The use, distribution or reproduction in other forums is permitted, provided the original author(s) and the copyright owner(s) are credited and that the original publication in this journal is cited, in accordance with accepted academic practice. No use, distribution or reproduction is permitted which does not comply with these terms.
*Correspondence: Pei Wang, d2FuZ3BlaUBzd3VuLmVkdS5jbg==