 Qi Chen
 Haisu Hu1
 Dequan Zhang
- 1College of Pharmacy, Dali University, Dali, China
- 2Institute of Materia Medica, Dali University, Dali, China
The Fritillaria is an extremely complicated genus in taxonomy and phylogeny, which contains numerous medicinal species in China. Both traditional characteristic-based taxonomy and universal DNA barcodes (ITS, trnH-psbA, and rbcL) are difficult to effectively identify the species. Here, we generated a large dataset of chloroplast genomes from multiple accessions per species of Fritillaria to evaluate their effectiveness in species discrimination. Moreover, phylogeny of species in China was explored based on the complete chloroplast genomes, and then divergence times of each node were estimated. The results showed that all 21 species in Fritillaria here (including two suspicious species) could be correctly discriminated using cpDNA genomes except F. cirrhosa, which suggested that DNA super-barcode could greatly enhance species discriminatory resolution for complicated genera. Furthermore, four regions (ycf1, matK-trnG-GCC, rpoC1, and matK) gained remarkably higher resolution than that of other plastid regions, but only matK might be suitable to identify Fritillaria species in consideration of its lengths. Phylogenomic analysis showed that the subgenus Fritillaria in China was divided into four major clades with obvious geographic structure. Among them, Clade I, mainly distributed in southwest China, was a young and complicated group. Moreover, according to the analysis, taxonomic treatments of the two suspicious species, namely “F. omeiensis” and “F. hupehensis” in Flora of China (2000) are questionable and might need further revision. Molecular dating revealed that both origin and divergence of subgenus Fritillaria, as well as its four major clades, were significantly associated with geological and climatic fluctuations during the Middle to Late Miocene. This study would enrich case studies of DNA super-barcode and provide new insights on speciation, lineage diversification, and biogeography of the Fritillaria in China.
Introduction
Accurate identification of a species is an essential condition for the sustainable utilization of biological resources. It could help relevant management departments to formulate corresponding protection and management measures for a certain group (Parveen et al., 2012; Sembiring et al., 2015; Liu et al., 2018). Traditional taxonomy is generally performed based on morphological characteristics, which depend upon taxonomists possessing rich knowledge on taxonomy and conducting careful analysis of specimens (Godfray, 2002; Li et al., 2011). However, in some cases, when the amounts of specimens (e.g., specimens of bees or fish) are very abundant in a study (Hou et al., 2018; Gueuning et al., 2019), the analysis of morphology tends to be lengthy and expensive, which could result in serious decreasing of the reliability of species identification. Moreover, if available specimens belong to a complicated genus or they are sub-optimal (e.g., sterile, juvenile, and/or poor), accurate identification in a way also might be ineffective or even impossible for the traditional method (Gonzalez et al., 2009; Yan et al., 2015; Liu et al., 2017, 2018).
As a supplementary tool for morphological taxonomy, DNA barcoding, using short and standardized DNA fragments, was proposed by Paul Hebert in 2003, and quickly became an efficient method for species identification and discovery (Hebert et al., 2003; Barrett and Hebert, 2005; Chase et al., 2005; Li et al., 2011; Schoch et al., 2012). The mitochondrial gene cytochrome oxidase 1 (COI) has been proven to be effective and reliable for species identification on animals as the unique core DNA barcode (Hebert et al., 2003; Barrett and Hebert, 2005; Hajibabaei et al., 2006; Costa et al., 2007; Kim et al., 2012). In land plants, there is no single barcode that could successfully identify most species; therefore, multiple regions, including three plastid regions (e.g., rbcL, matK, and trnH-psbA) and nrDNA ITS are widely regarded as universal DNA barcodes (Kress et al., 2005; CBOL Plant Working Group, 2009; Hollingsworth et al., 2010; Hollingsworth, 2011; Li et al., 2011; Coissac et al., 2016). However, for complicated groups in taxonomy, the barcodes might be futile, especially in recently diverged and rapidly radiated taxa (Hollingsworth, 2011; Li et al., 2011; Zhang et al., 2011; Liu et al., 2016). Therefore, there is an urgent need to develop new and robust approaches that could satisfy requirements of identifying the complicated ones. Luckily, rapid development of the next-generation DNA sequencing (NGS) technology provides the possibility for species discrimination at the genome level (Fu et al., 2019; Ji et al., 2019).
The chloroplast genome, namely plastome, is a perfect source for resolving the tree of life and delimiting species entity in angiosperms (Gitzendanner et al., 2017; Fu et al., 2019). Numerous studies showed that the chloroplast genome was a robust and appropriate tool that could provide much better ability than the universal regions on revealing phylogeny and evolutionary history of plants (Li et al., 2019; Nie et al., 2019). DNA super-barcode, using complete chloroplast genome sequence, exhibits a powerful ability to identify the closely related species, due to their abundant genetic variation in contrast with the four universal barcodes (Wu et al., 2010; Carbonell-caballero et al., 2015; Li et al., 2015; Chen et al., 2019; Fu et al., 2019; Jiao et al., 2019). Of course, there is no denying that DNA super-barcode is still faced with controversy and challenges in species identification, such as high sequencing cost, establishment of a rich cp-genome database, and difficulty in tracking species boundaries (Li et al., 2015). In recent years, along with quickly decreasing of the cost for the NGS sequencing and developing analysis methods for genomes, more and more cpDNA genomes are available in GenBank, thus a series of genera already have corresponding reference genomes for delivering species identification or phylogenomics (Li et al., 2015; Coissac et al., 2016; Gitzendanner et al., 2017; Fu et al., 2019; Ji et al., 2019). Similarly, some regions from the plastomes, selected as special barcodes are tested and used in the complicated taxa, such as accD and rrn16-rrn23 for yew species (Fu et al., 2019) and psbE-psbL and ndhA intron for Fagopyrum (Huang et al., 2019). Nevertheless, for most of the genera, it is still insufficient to construct a reliable database due to limited reference genomes or specific fragments.
Fritillaria L. (Liliaceae) is a popular genus close to Lilium L., and it mainly grows in the temperate regions of the northern hemisphere. The genus was first established by Carolus Linnaeus in 1753 and then systematically revised by Baker in 1874, as well as Bentham and Hooker in 1883, Turrill and Sealy in 1980, Yibo Luo in 1993, and Rix in 2001 (Rønsted et al., 2005). According to Rix’s classification system, Fritillaria could be divided into eight subgenera, which includes approximately 140 species of perennial herbaceous plants all over the world (Rønsted et al., 2005; Day, 2018). In China, there are 24 species that were divided into three subgenera (Fritillaria, Davidii, and Liliorhiza), and about 10 species and 2 varieties are listed as original species of five medicines in Chinese Pharmacopoeia Commission [CPC] (2020), namely the so-called “Beimu,” which mainly relieves cough and eliminates phlegm, such as F. cirrhosa D. Don, F. ussuriensis Maxim., F. walujewii Regel, F. thunbergii Miq, and so on (Chen and Helen, 2000; Xiao et al., 2007). However, some species in Fritillaria are extremely complicated in taxonomy, especially the so-called “Fritillaria cirrhosa D. Don complex,” namely F. cirrhosa and its related species in southwest China (Luo and Chen, 1996a,b). F. cirrhosa is a complicated species in morphology which possesses diverse floral characteristics (e.g., color and plaques of tepals, lengths of stigma lobes, number of bracts, etc.); meanwhile, transitional variation among the related species further results in difficulty on delimiting the ones. A series of studies revealed that universal barcodes (matK, rbcL, trnH-psbA, ITS) or plastid region (rpl16) could not afford efficient identification for such a complicated genus (Zhang et al., 2016; Huang et al., 2018; Chen et al., 2020). Until now, complete chloroplast genomes have been adopted to explore phylogeny of Fritillaria species, and showed unambiguous relationships with highly supportive values, especially for the related species (Park et al., 2017; Bi et al., 2018; Li et al., 2018; Chen et al., 2019; Wu et al., 2021; Zhang et al., 2021). But these studies generally only cover minority species with few samples, so they could not represent the species well. Moreover, recent research illuminated Fritillaria was evolved in the Early Miocene (17∼26 Mya) and the subgenera Fritillaria of China was divided into three subclades, whereas the divergence times of these subclades are still ambiguous (Huang et al., 2018). Hence, it is necessary to adopt more cpDNA genomes to better represent the species, to construct a more reliable and comprehensive database. Then, we could further evaluate the ability of species discrimination of DNA super-barcode for Fritillaria species and reconstruct a more reliable phylogenetic tree with better representativeness.
Here, a large dataset of complete chloroplast genomes, newly obtained from multiple individuals per species for the Fritillaria in China, was adopted to construct a comprehensive database for analysis on species discrimination and phylogeny. This study aims to address the following questions: (i) As DNA super-barcode, is a complete chloroplast genome suitable to discriminate species in Fritillaria? Or, are there any specific plastid regions that could provide better choices? (ii) Could cpDNA genomes effectively reveal complicated phylogeny within the genus, especially F. cirrhosa and its closely related species? (iii) If there is a clear phylogenetic relationship among these species, what are the main time nodes of the important lineages of Fritillaria in China? The present study would provide further insight on super-barcode and broaden the horizon for phylogeny, as well as evolution of the important genus.
Materials and Methods
Material Sampling
A total of 73 individuals, collected from 21 species (including two suspicious species, namely “Fritillaria omeiensis” and “F. hupehensis”) in Fritillaria almost representing most of the species in China, were mainly sampled from their wild habitats. Some species, such as F. pallidiflora, “F. hupehensis,” and F. thunbergii, were obtained from cultivation bases of their main distributions. Fresh leaves, used as molecular materials, were sampled from healthy and mature individuals in fieldwork, and then dried by allochroic silicagel. For each species, 2∼6 individuals from one or two populations were sampled to represent genetic variation within species. Meanwhile, 3∼5 individuals in flowering or fruiting stages were dug and preserved as vouchers; meanwhile, geographic information of sampling locations was measured by Global Position System (GPS, Garmin). All voucher specimens were identified by Professor Dequan Zhang on the basis of morphological evidence according to Flora of China (Chen and Helen, 2000; Table 1 and Supplementary Figure 1). Then, these specimens of Fritillaria species were deposited at the Herbarium of Medicinal Plants and Crude Drugs of the College of Pharmacy, Dali University. Besides the newly obtained chloroplast genomes, 9 cpDNA genomes in NCBI databases (Supplementary Table 1), from four species in Fritillaria, were also downloaded and used for resolving phylogeny and estimation on divergence times in this study.
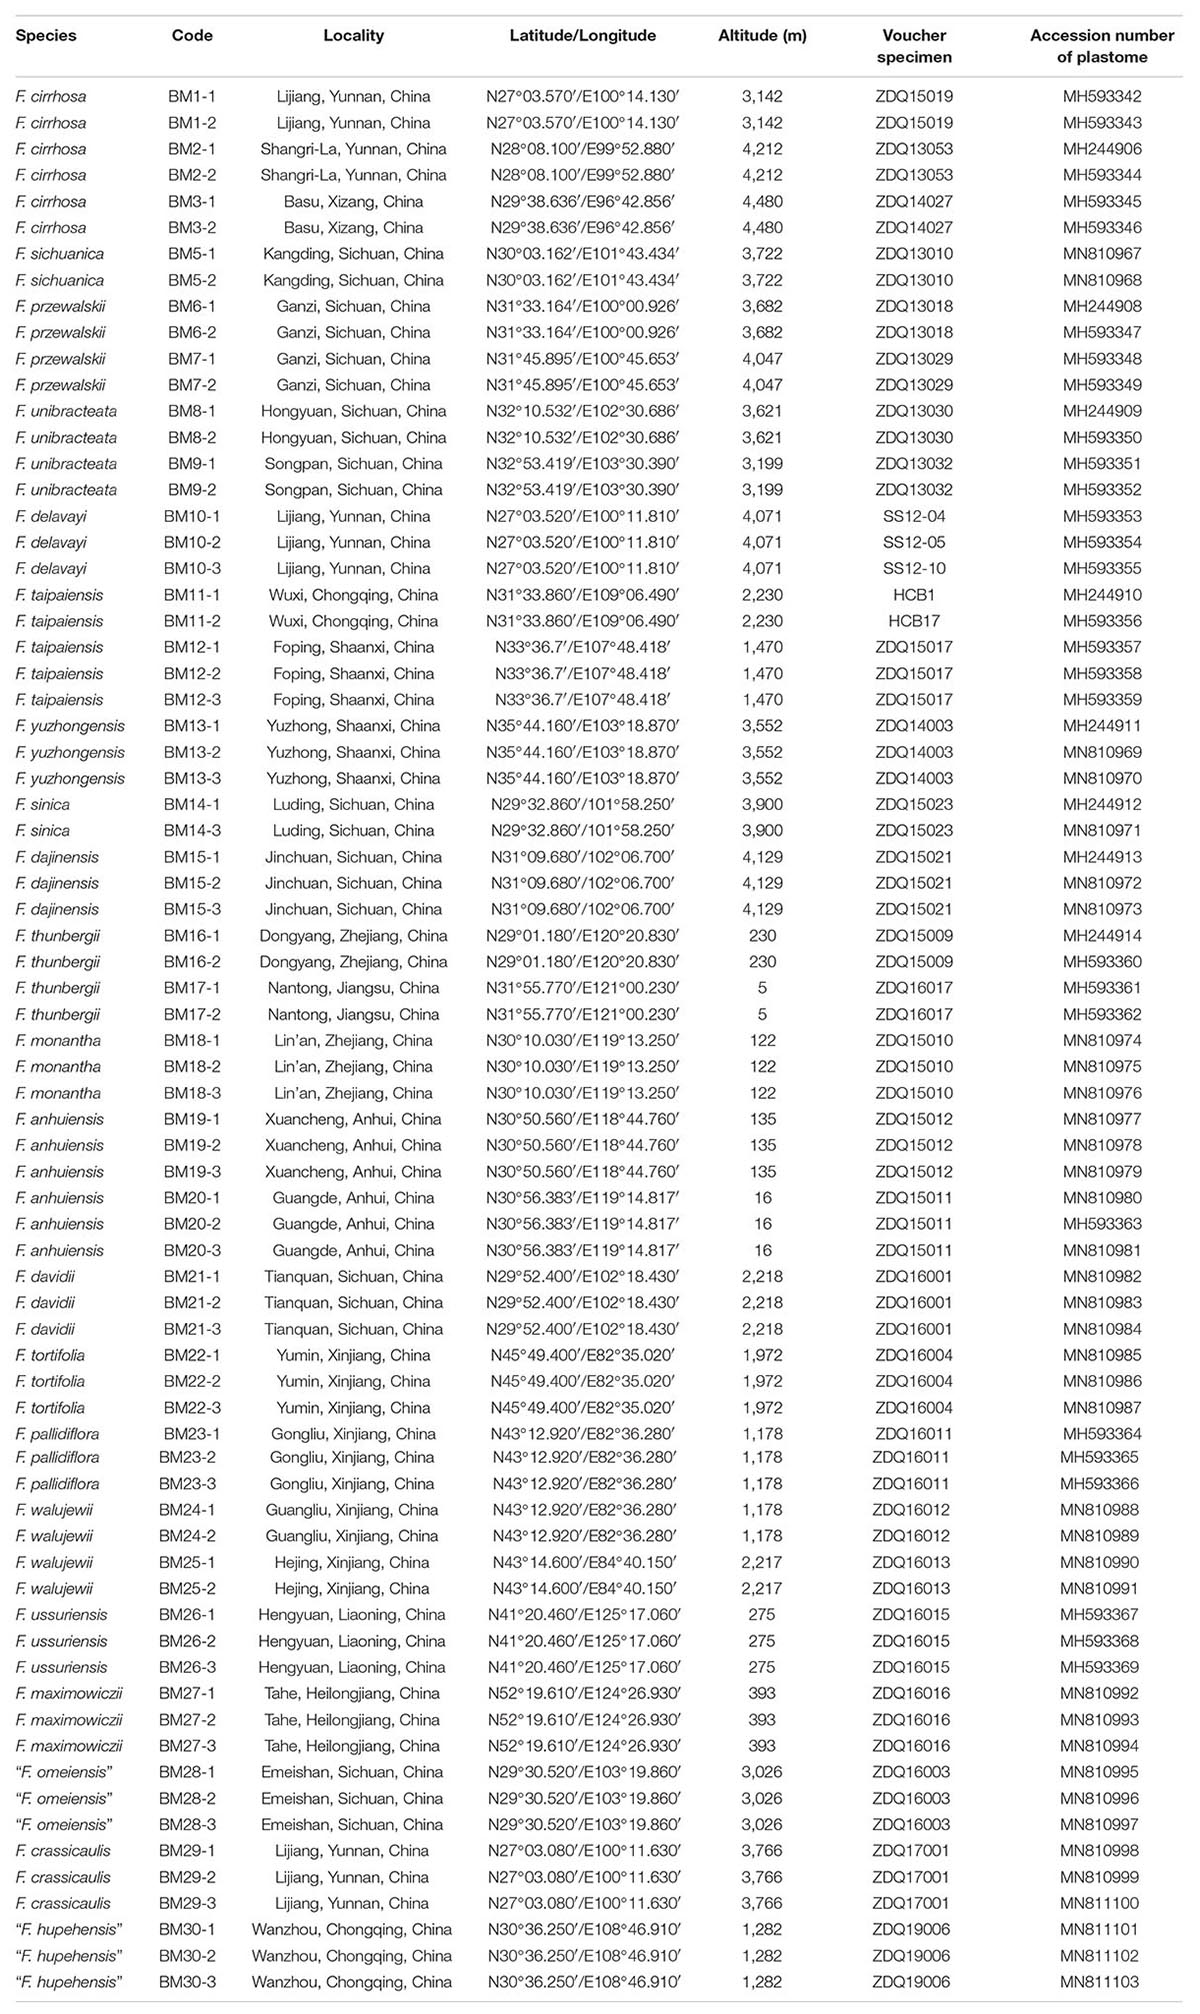
Table 1. Collecting information of the 21 species (including the suspicious species) in Fritillaria in China.
DNA Extraction, Sequencing, and Assembly
Total genomic DNA was extracted from about 100 mg of dried leaf material according to a modified CTAB method (Doyle, 1987; Yang et al., 2014). Quantification of DNA was checked by electrophoresis on 1.2% agarose gels, and its concentration was detected using a SmartSpec™ Plus Spectrophotometer (Bio-Rad, Hercules, CA, United States). The purified total DNA (about 5 ug) was sheared by the sonication into fragments with an average length of 500 bp for constructing a paired-end library. Illumina libraries were prepared according to the manufacturer’s protocol. Then, the Illumina HiSeq 2000 system was adopted to perform paired-end sequencing at Beijing Genomics Institute (BGI, Shenzhen, China).
Raw data was filtered using Trimmomatic v.0.32 (Bolger et al., 2014) with default settings. Then, paired-end reads of clean data were filtered and assembled into contigs using GetOrganelle.py (Jin et al., 2020) with reference (F. cirrhosa, accession number: KF769143), calling the bowtie2 v.2.3.4.3 (Langmead and Salzberg, 2012), Blastn v.2.8.0 (Camacho et al., 2009), and SPAdes v.3.10 (Bankevich et al., 2012). The de novo assembly graphs were visualized and edited using Bandage v.8.0 (Wick et al., 2015), then a complete chloroplast genome was generated.
Annotation and Sequence Submission
The plastomes were annotated by aligning to the reference sequence (KF769143) using MAFFT (Katoh and Standley, 2013) with default parameters, coupled with manual adjustment using Geneious v.11.1.4 (Kearse et al., 2012). Circular genome visualization was generated with OGDRAW v.1.3 (Lohse et al., 2013). Finally, the annotated chloroplast genomes of the 21 Fritillaria species were submitted to the NCBI database (Table 1).
Variable Site Analysis
After using MAFFT v.7.129 to align the chloroplast genome sequences, Geneious software was used to adjust the sequences manually (Kearse et al., 2012; Katoh and Standley, 2013). A sliding window analysis was conducted for nucleotide variability (Pi) of the whole chloroplast genome using DnaSP v.6.11. Step size was set to be 200 bp, with a 600 bp window length (Rozas et al., 2017). Moreover, the software was adopted to calculate insertions/deletions (indels) and nucleotide variability (Pi) of all aligned datasets. P-distance, GC content, variable sites, and parsimony information sites were analyzed by MEGA v.7.0.26 (Kumar et al., 2016).
Species Discrimination
Complete chloroplast genomes, used as DNA super-barcode, were adopted to be tested on species discrimination for the species in Fritillaria in China. In order to screen out suitable specific plastid regions, we further extracted three types of datasets, namely genes, intergenic spacers (IGSs), and high variable regions (HVRs) from the genomes manually to perform analysis of DNA barcoding. Three usual methods (Blast, Distance, and Tree-Building) were adopted to analyze the four datasets. For the Blast method, all sequences of these types of datasets were used as query sequences with an E-value < 1 × 10⁻⁵, and the BLAST program (Camacho et al., 2009) was used to query the reference database with each sample in turn to establish whether the closest hit was the conspecific species. Species identification was considered successful if all individuals of a species had a top matching hit of only the conspecific individuals (Ross et al., 2008). For the Distance method, all datasets were aligned by MAFFT v.7.129 (Katoh and Standley, 2013), and then used for calculating p-distances with MEGA v.7.0.26 (Kumar et al., 2016). Successful species discrimination indicated that the minimum uncorrected interspecific p-distance involving a species was larger than its maximum intraspecific distance (Li et al., 2011). For the Tree-Building method, all datasets were aligned by software MAFFT, and neighbor-joining (NJ) trees were constructed with p-distances in software MEGA. Plastomes of Lilium brownii (Accession: KY748296) and L. bakerianum (Accession: NC_035592) were used as outgroup for Tree-Building analysis. Species were regarded as a success if all individuals of one species formed a monophyletic group (Hollingsworth et al., 2010).
Phylogenomic Analysis
Phylogenomic analysis was performed with plastomes and 10 high variable regions using Maximum Likelihood (ML), Maximum Parsimony (MP), and Bayesian Inference (BI) methods based on 82 individuals representing 25 species of the genus Fritillaria, including both the new and downloaded genomes here (Table 1 and Supplementary Table 1). Two species from Lilium L., namely Lilium brownii (Accession: KY748296) and L. bakerianum (Accession: NC_035592) were used as outgroups in the analysis. PAUP v.4.0a166 was used for the MP analysis with 1000 bootstrap replicates (Swofford, 2002). For the BI and ML analysis, the best substitution model was tested based on Akaike information criterion (AIC) by jModelTest v.2.1.7 (Darriba et al., 2012). The best-fitting models in these analyses were listed in Supplementary Table 2. The ML analysis was performed with RAxML v.8.2.4 (Stamatakis, 2014). In addition, 1000 replications were adopted to calculate the local bootstrap probability of each branch. The BI analysis was conducted in MrBayes v.3.2.6 (Ronquist et al., 2012). The Markov Chain Monte Carlo (MCMC) algorithm was calculated for 1,000,000 generations with a sampling tree every 1,000 generations. The first 25% of generations was discarded as burn-in. Stationary was reached when the average standard deviation of split frequencies was <0.01 and a consensus tree was constructed using the remaining trees.
Divergence Time Estimation
Divergence times were estimated using a Bayesian method implemented in BEAST v.1.10.4 (Suchard et al., 2018). The ML tree was used as the starting tree and BEAUti (within BEAST) was used to set criteria for the analysis. GTR + G + I nucleotide-substitution model was adopted and an uncorrelated lognormal relaxed clock model with the Yule prior set was used to estimate divergence times. There are no well-documented fossils in Liliaceae currently. Therefore, four estimated calibration points were used to determine specific node priors based on the previous reports in Huang et al. (2018): (1) The crown node of Lilium was set to 16.84 Mya, using a normal prior distribution with standard deviation (SD) 2.93; (2) the crown node of Fritillaria was set to 18.12 Mya (normal prior distribution, SD 2.84); (3) the subgenus Davidii stem was constrained to 15.63 Mya (normal prior distribution, SD 2.73); (4) the subgenus Fritillaria B (basically Chinese species) crown node was included following a normal distribution with mean 8.28 Mya (SD 1.94). Two runs of 200 million generations of MCMC chains were produced for confirming convergence, sampling every 1000 generations, following a burn-in of the initial 10% of cycles. Samples were combined by LogCombiner v.1.10.4, and convergence of chains was checked in Tracer v1.7.1 (Rambaut et al., 2018) to confirm that the effective sample sizes (ESS) were greater than 200. Maximum clade credibility (MCC) trees were generated in TreeAnnotator v1.10.4 showing mean divergence time estimates with 95% HPD intervals and the MCC chronogram was visualized using software FigTree v1.4.31.
Results
Chloroplast Genome Features of Fritillaria
Illumina sequencing system generated 2,461,376 to 29,801,350 paired-end reads with an average read length of 150 bp for 73 individuals on behalf of 21 Fritillaria species (including the suspicious species) in China. The produced 73 complete chloroplast genomes consisted of circular double-stranded DNA, ranging from 151,012 bp in F. unibracteata (Accession number: MH593351) to 152,888 bp in F. davidii (Accession number: MH593366) and shared typical quadripartite structure which consisted of a pair of IRs (26,071–26,746 bp) separated by the LSC (80,988–82,453 bp) and SSC (17,038–17,565 bp) regions (Supplementary Table 3 and Supplementary Figure 2). Overall GC content of the complete plastid genomes was 36.9%–37.1% (Supplementary Table 3). They consistently contained 115 genes, with 78 protein-coding genes, 30 tRNA genes, and 4 ribosomal RNA genes as well as infA (translation initiation factor gene), hypothetical ORF ycf15 and ycf68 (Supplementary Tables 3, 4). In general, genome features of the 21 species were quite similar in terms of their gene content, gene order, introns, intergenic spacers, and GC content (Supplementary Figure 2). All genome sequences had been submitted and deposited in GenBank. All the accession numbers are listed in Table 1.
Sequence Variations
To explore suitable plastid regions with high-resolution on species identification for Fritillaria, four types of datasets including chloroplast genomes, genes, intergenic spacers (IGSs), and high variable regions (HVRs) were adopted to be further analyzed in this study. A sliding window analysis found all highly divergent fragments in SC regions whereas none was presented in the IR regions. Moreover, 10 HVRs (atpH-atpI, matK-trnG-GCC, ndhF-ndhD, psbA-matK, psbE-rpl20, rpl14-rps3, rpoB-psbD, rps4-trnL-UAA, ycf1, and ndhA-intron) were selected and extracted manually from complete chloroplast genomes (Figure 1). Accordingly, 114 genes and 108 IGSs were also extracted manually from the genomes for the following analysis.
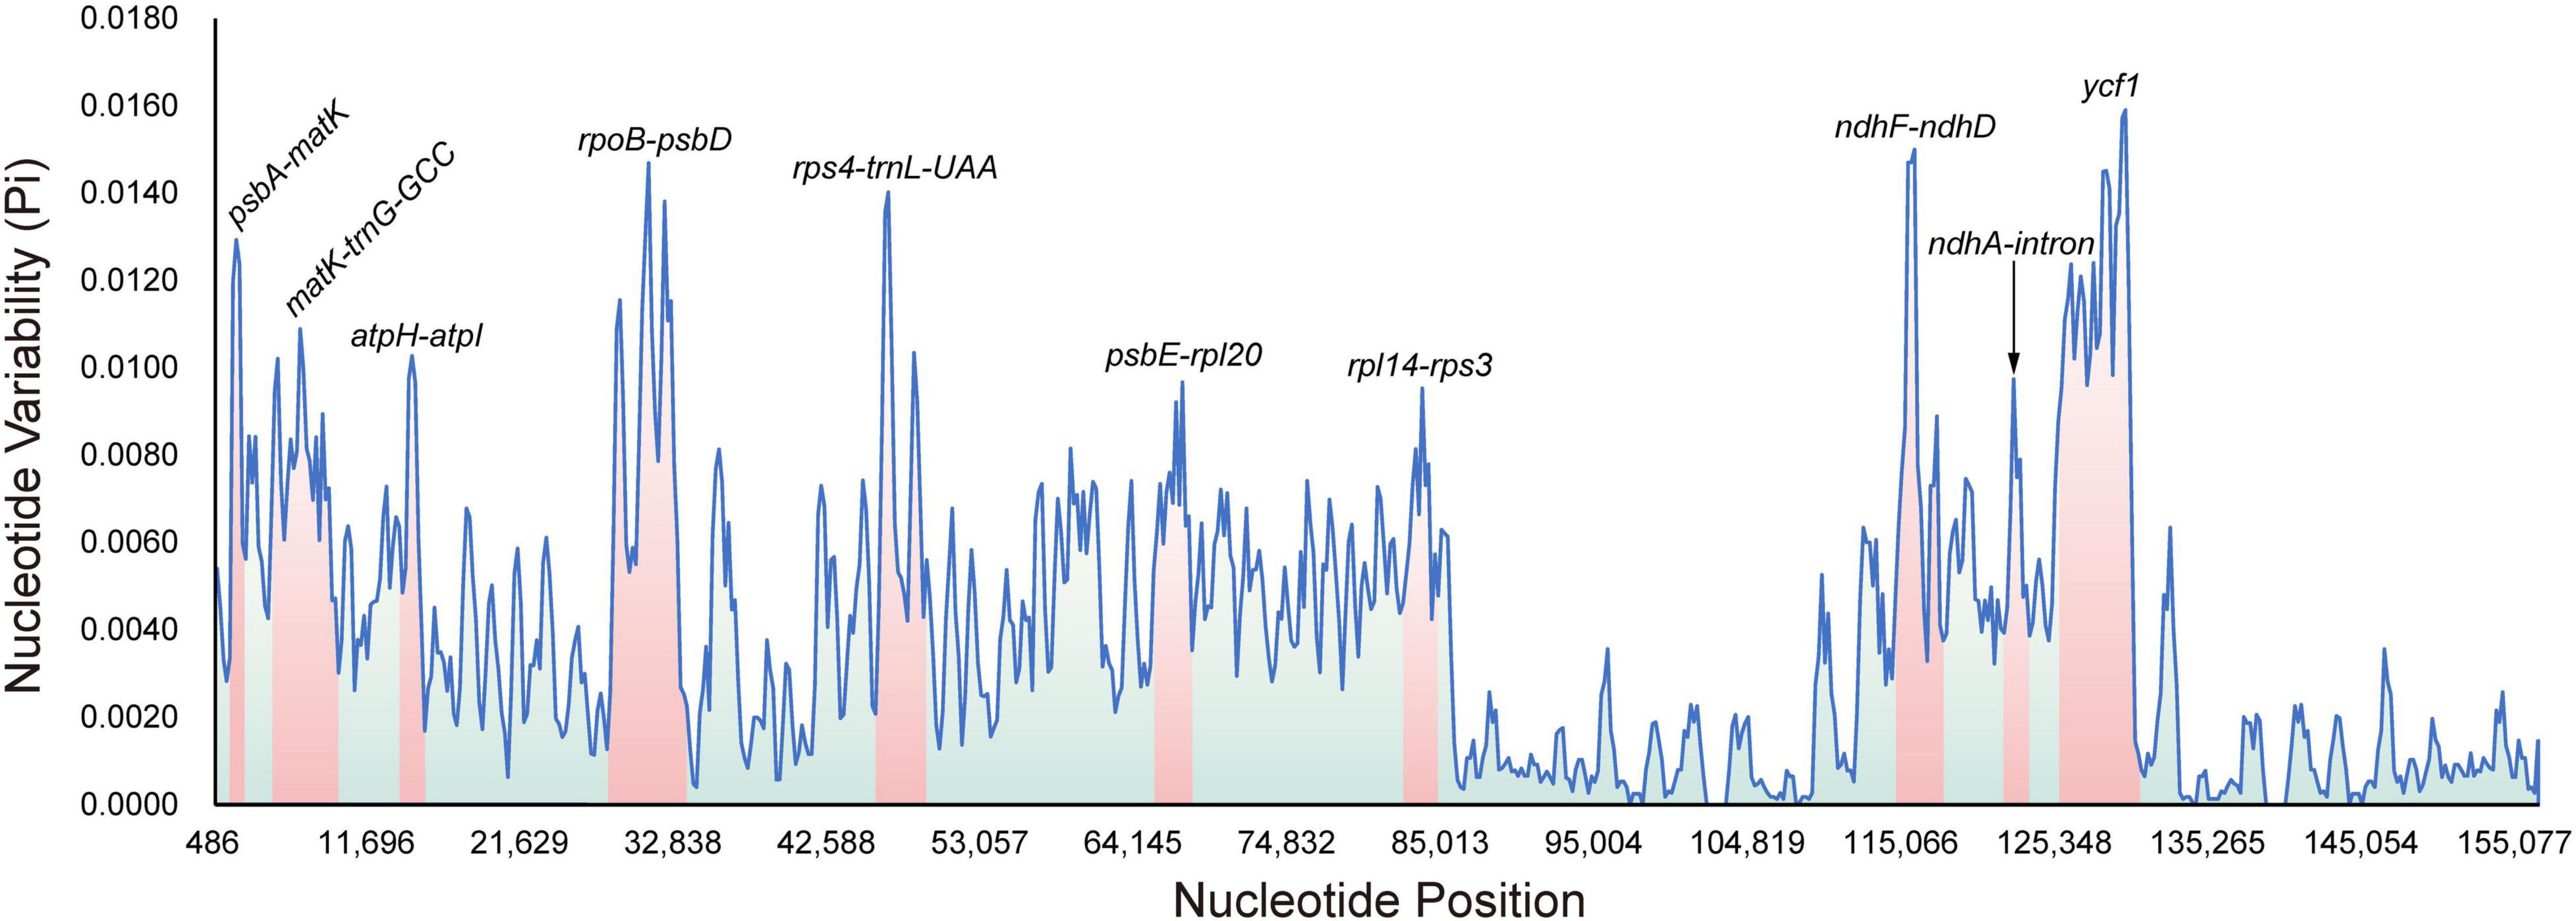
Figure 1. Sliding window analysis of the 73 complete plastomes in Fritillaria (window length: 600 bp, step size: 200 bp) to show high variable regions (HVRs). X-axis: position of the midpoint of a window; Y-axis: nucleotide diversity of each window. The size of these regions is highlighted with the obviously gradient colors.
In all these datasets, undoubtedly, chloroplast genomes had the highest number of variable sites (5,940), as well as parsimony information sites (4,850) (Table 2). For HVRs, the three tops of corresponding variants were rpoB-psbD (463 and 377), matK-trnG-GCC (390 and 296), and ycf1 (359 and 352), showing that they possessed extremely high mutations in the genome (Table 2). In genes or IGSs, there were no remarkable regions compared with HVRs; thereby, some usual fragments, such as trnK-UUU (150 and 149), rpoC2 (113 and 103), and ndhF (111 and 104) in the genes or trnT-UGU-trnL-UAA (97 and 96), rpl32-trnL-UAG (96 and 95), and psaJ-rpl33 (91 and 57) in the IGSs, exhibited fewer variation (Supplementary Table 5). Furthermore, among three datasets (HVRs, genes, and IGSs), the average intra- and inter-specific distances were positively correlated (Supplementary Figure 3). By comparative analysis of each dataset, we found that IGSs exhibited the highest interspecific variation, followed by HVRs and genes, whereas plastomes had a relatively lower variation (Supplementary Table 5 and Supplementary Figure 3).
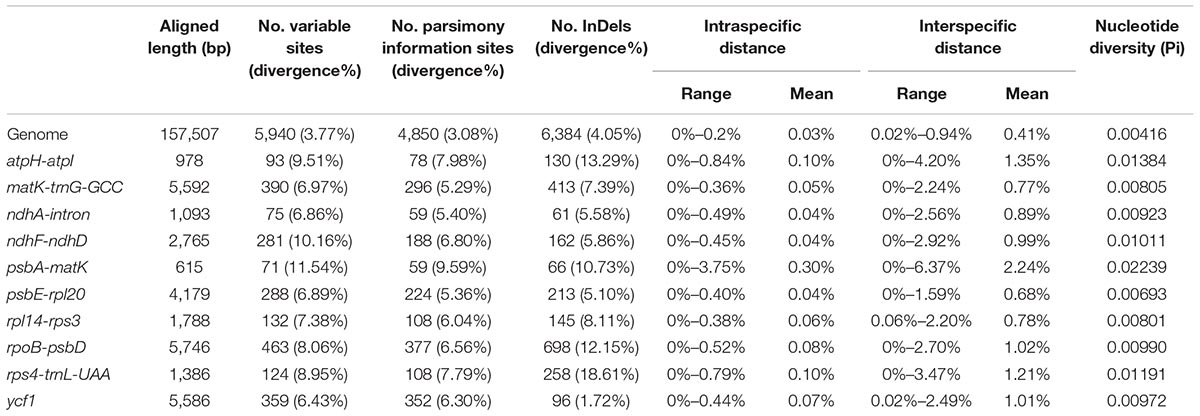
Table 2. Characteristics of the complete plastome and high variable regions in Fritillaria.
Species Discrimination of Fritillaria
The four datasets were adopted to perform analysis on species discrimination using three methods (Blast, Distance, and Tree-Building) in this study. Among the methods, Blast tended to provide the highest success rates for most of the regions (Figure 2 and Supplementary Table 5). Moreover, it was found that all fragments without a barcoding gap between inter- and intra-specific distances could identify species (Table 2 and Supplementary Table 5). To ensure comparability of results here, the Tree-Building method (NJ) was finally adopted for discussion on species discrimination.
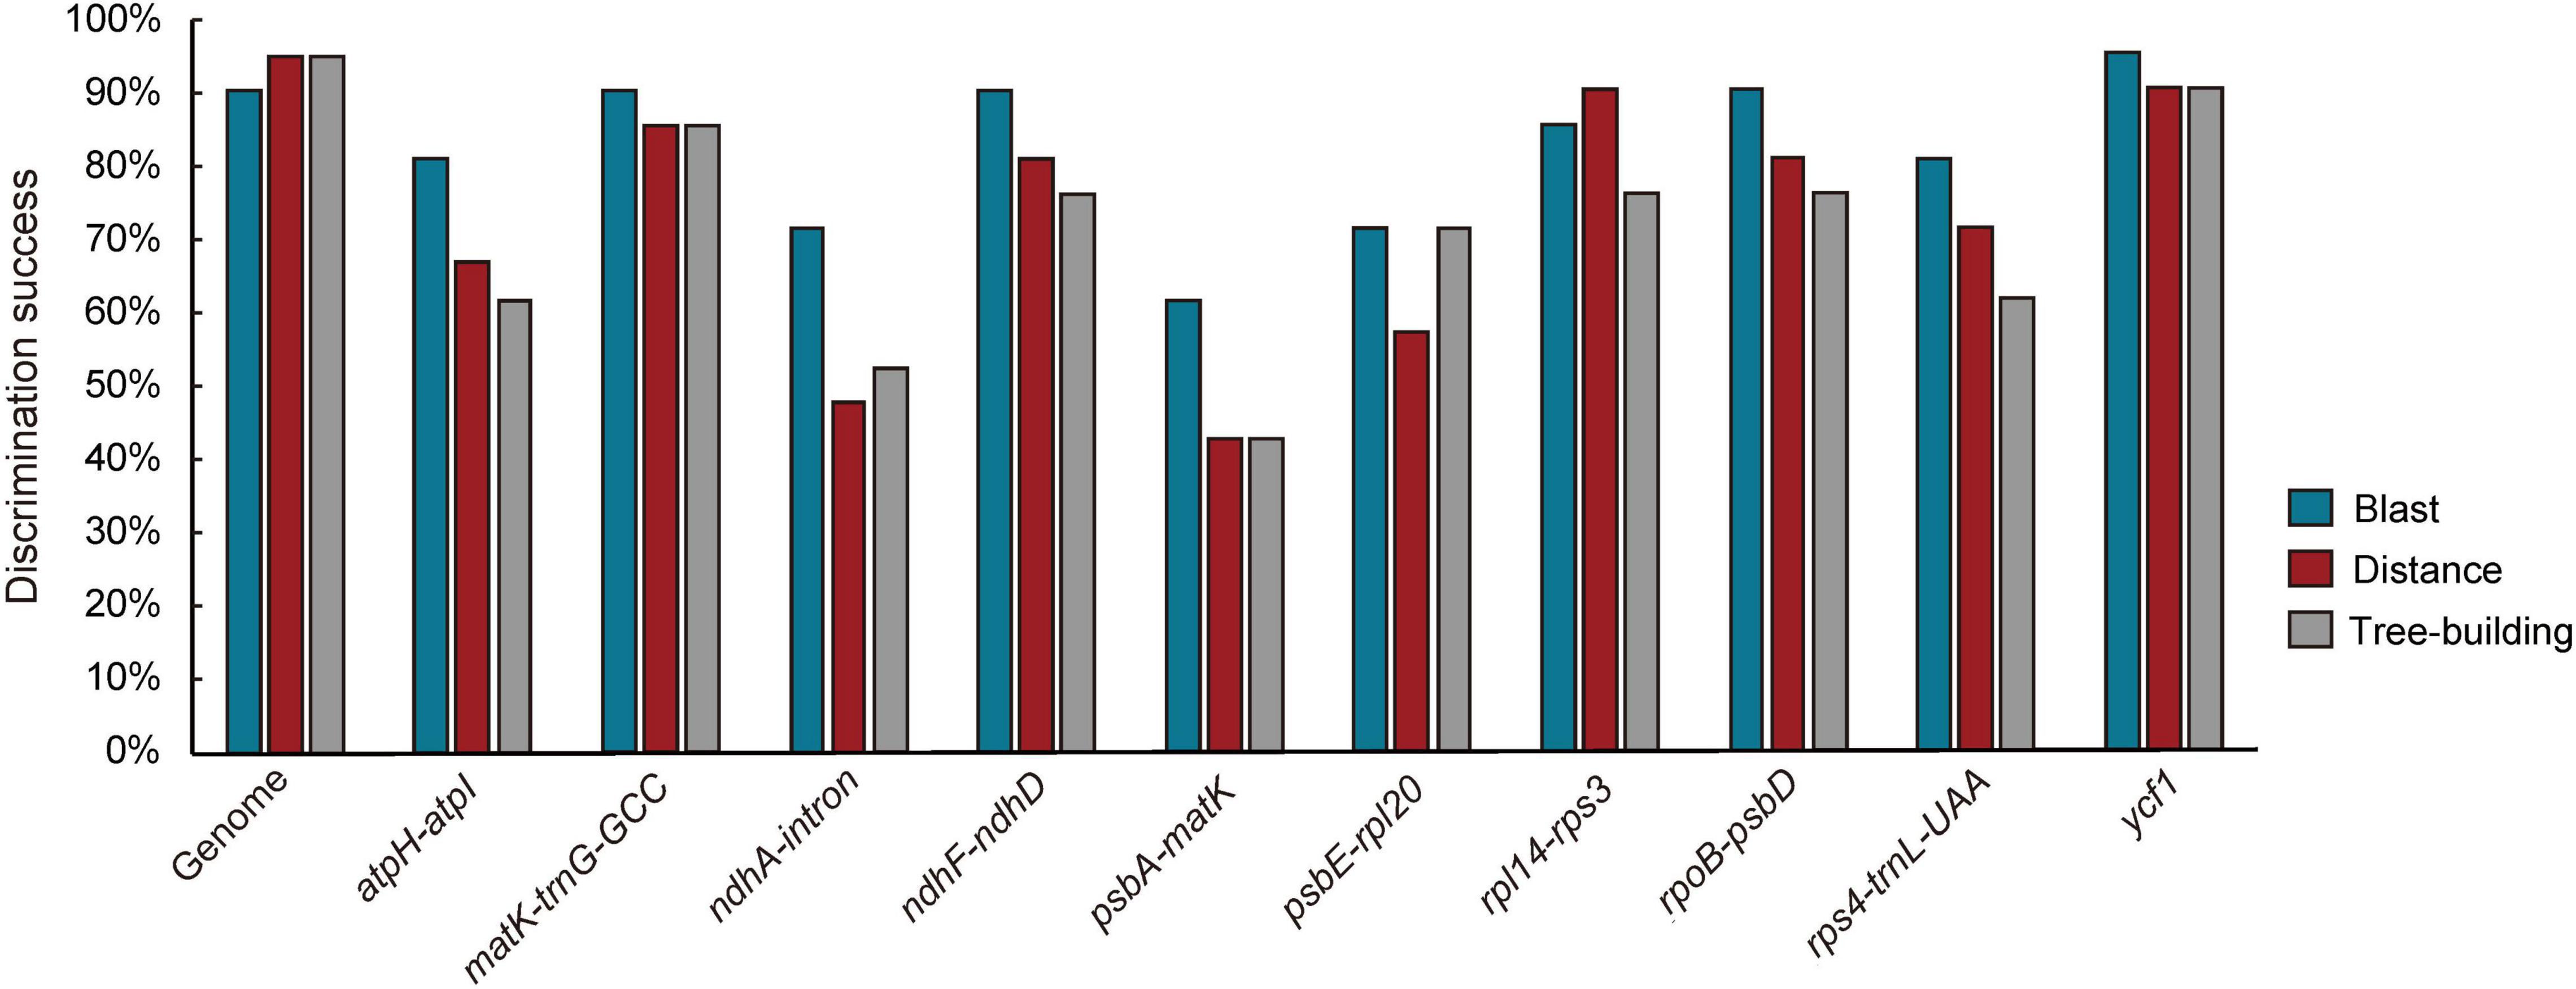
Figure 2. Species discrimination of the complete plastome and 10 high divergence regions (HVRs) for the 21 species in Fritillaria based on the three methods.
For complete chloroplast genome, alignment of the sequences, including two outgroups, representing 21 species in Fritillaria yielded a matrix containing 157,507 characters. An NJ tree was constructed based on this matrix (Figure 3A). Of note, 20 species in the genus formed a monophyletic clade with high branch supports (BS ≥ 99%). However, F. cirrhosa was grouped into two clades, one clade was closely related to F. omeiensis and the other was sister to F. przewalskii and F. sichuanica or F. sinica.
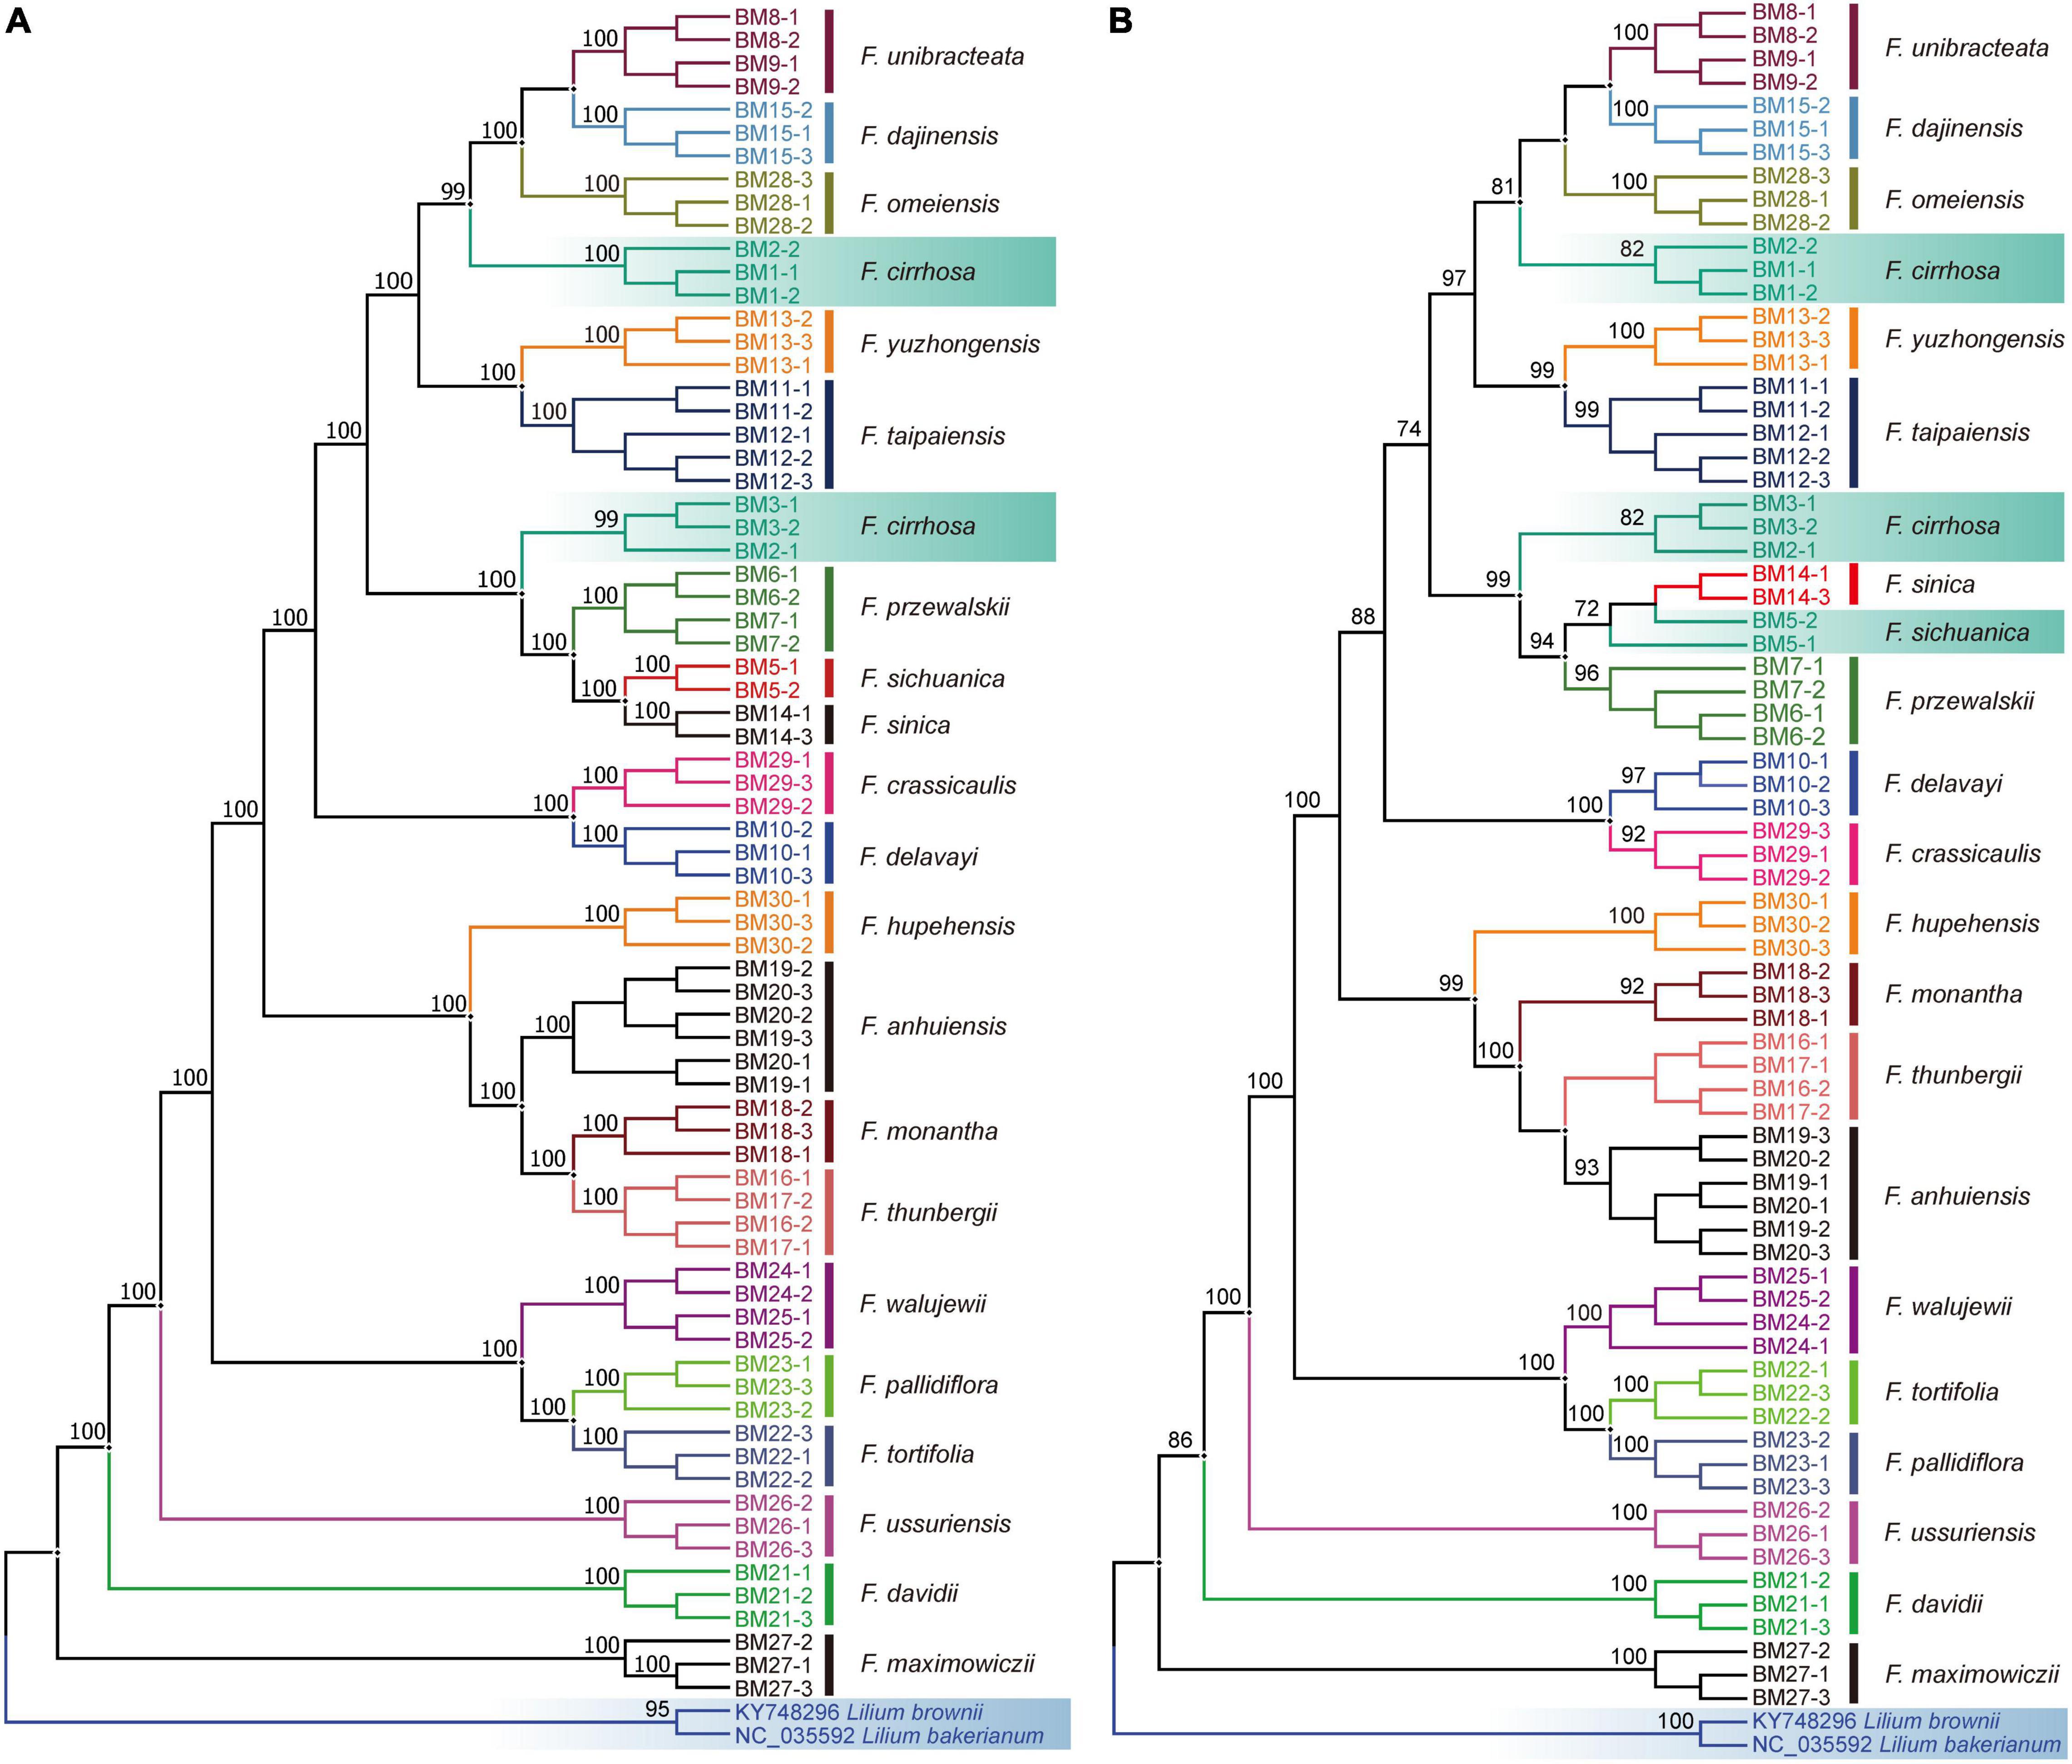
Figure 3. The NJ trees of the 73 Fritillaria samples based on the complete plastome (A) and ycf1 (B). Incorrect discrimination and outgroups are highlighted with the gradient colors. Bootstrap values are shown on the branches.
Compared to genes and IGSs, HVRs showed the highest success rate with good performance (Figure 2 and Supplementary Table 5). Among the plastid loci, ycf1 exhibited great discrimination ability with high branch supports (BS ≥ 92%) contrasted with other regions (Figure 3B and Supplementary Figure 4). Only two species could not be correctly discriminated, namely F. cirrhosa and F. sichuanica. Furthermore, the rpoC1 in these genes also showed excellent power which could identify 18 of 21 species except three closely related species, including F. cirrhosa, F. dajinensis, and F. omeiensis (Supplementary Figure 5). However, in the IGSs, there was no remarkable region that could significantly improve the species resolution, and the best region rpl20-rps12 could only discriminate 13/21 species in Fritillaria (Supplementary Figure 4).
Phylogenomic Analysis and Divergence Time Estimation
Phylogenomic analysis was performed using ML, MP, and BI methods on the basis of 84 individuals (including two outgroups). As a result, none of the HVRs possessed similar topological structures of the three trees with that of the plastome due to their poorer information sites in phylogeny (Figure 4, Supplementary Figure 5, and Supplementary Table 2), and the support values of their branch sites were weaker in contrast with that of the whole chloroplast genome. Herein, the phylogenetic trees reconstructed by plastomes were adopted to discuss the phylogenetic relationships of Fritillaria in China, and the ML tree was adopted to present phylogenetic relationships, with the addition of support values from MP and BI analyses (Figure 4). According to the trees, the 23 species of Fritillaria sect. Fritillaria, except F. davidii and F. maximowiczii, were obviously divided into four major clades (Clade I, II, III, and IV). Clade I contained 11 species with strong supports (BS = 100%, PP = 1.00). Within this clade, five original species of the herbs Fritillariae cirrhosae bulbus had closer relationships with each other. Besides, the species F. cirrhosa was grouped into two subclades with high support values, which was similar to the result of the NJ method. Within the second clade, four species, containing three widely cultivated herbs, exhibited a clear relationship in which the species F. monantha was sister to F. thunbergii with high support value (BS = 100%, PP = 1.00). For the third clade, five species, almost distributed in Xinjiang, showed an unambiguous relationship with 100% support. Among these species, F. tortifolia was sister to F. verticillate and then related to F. yuminensis, but the two original species of Fritillariae pallidiflorae bulbus were slightly far away from them. The last clade showed that F. ussuriensis was sister to F. meleagroides (BS = 100%, PP = 1.00).
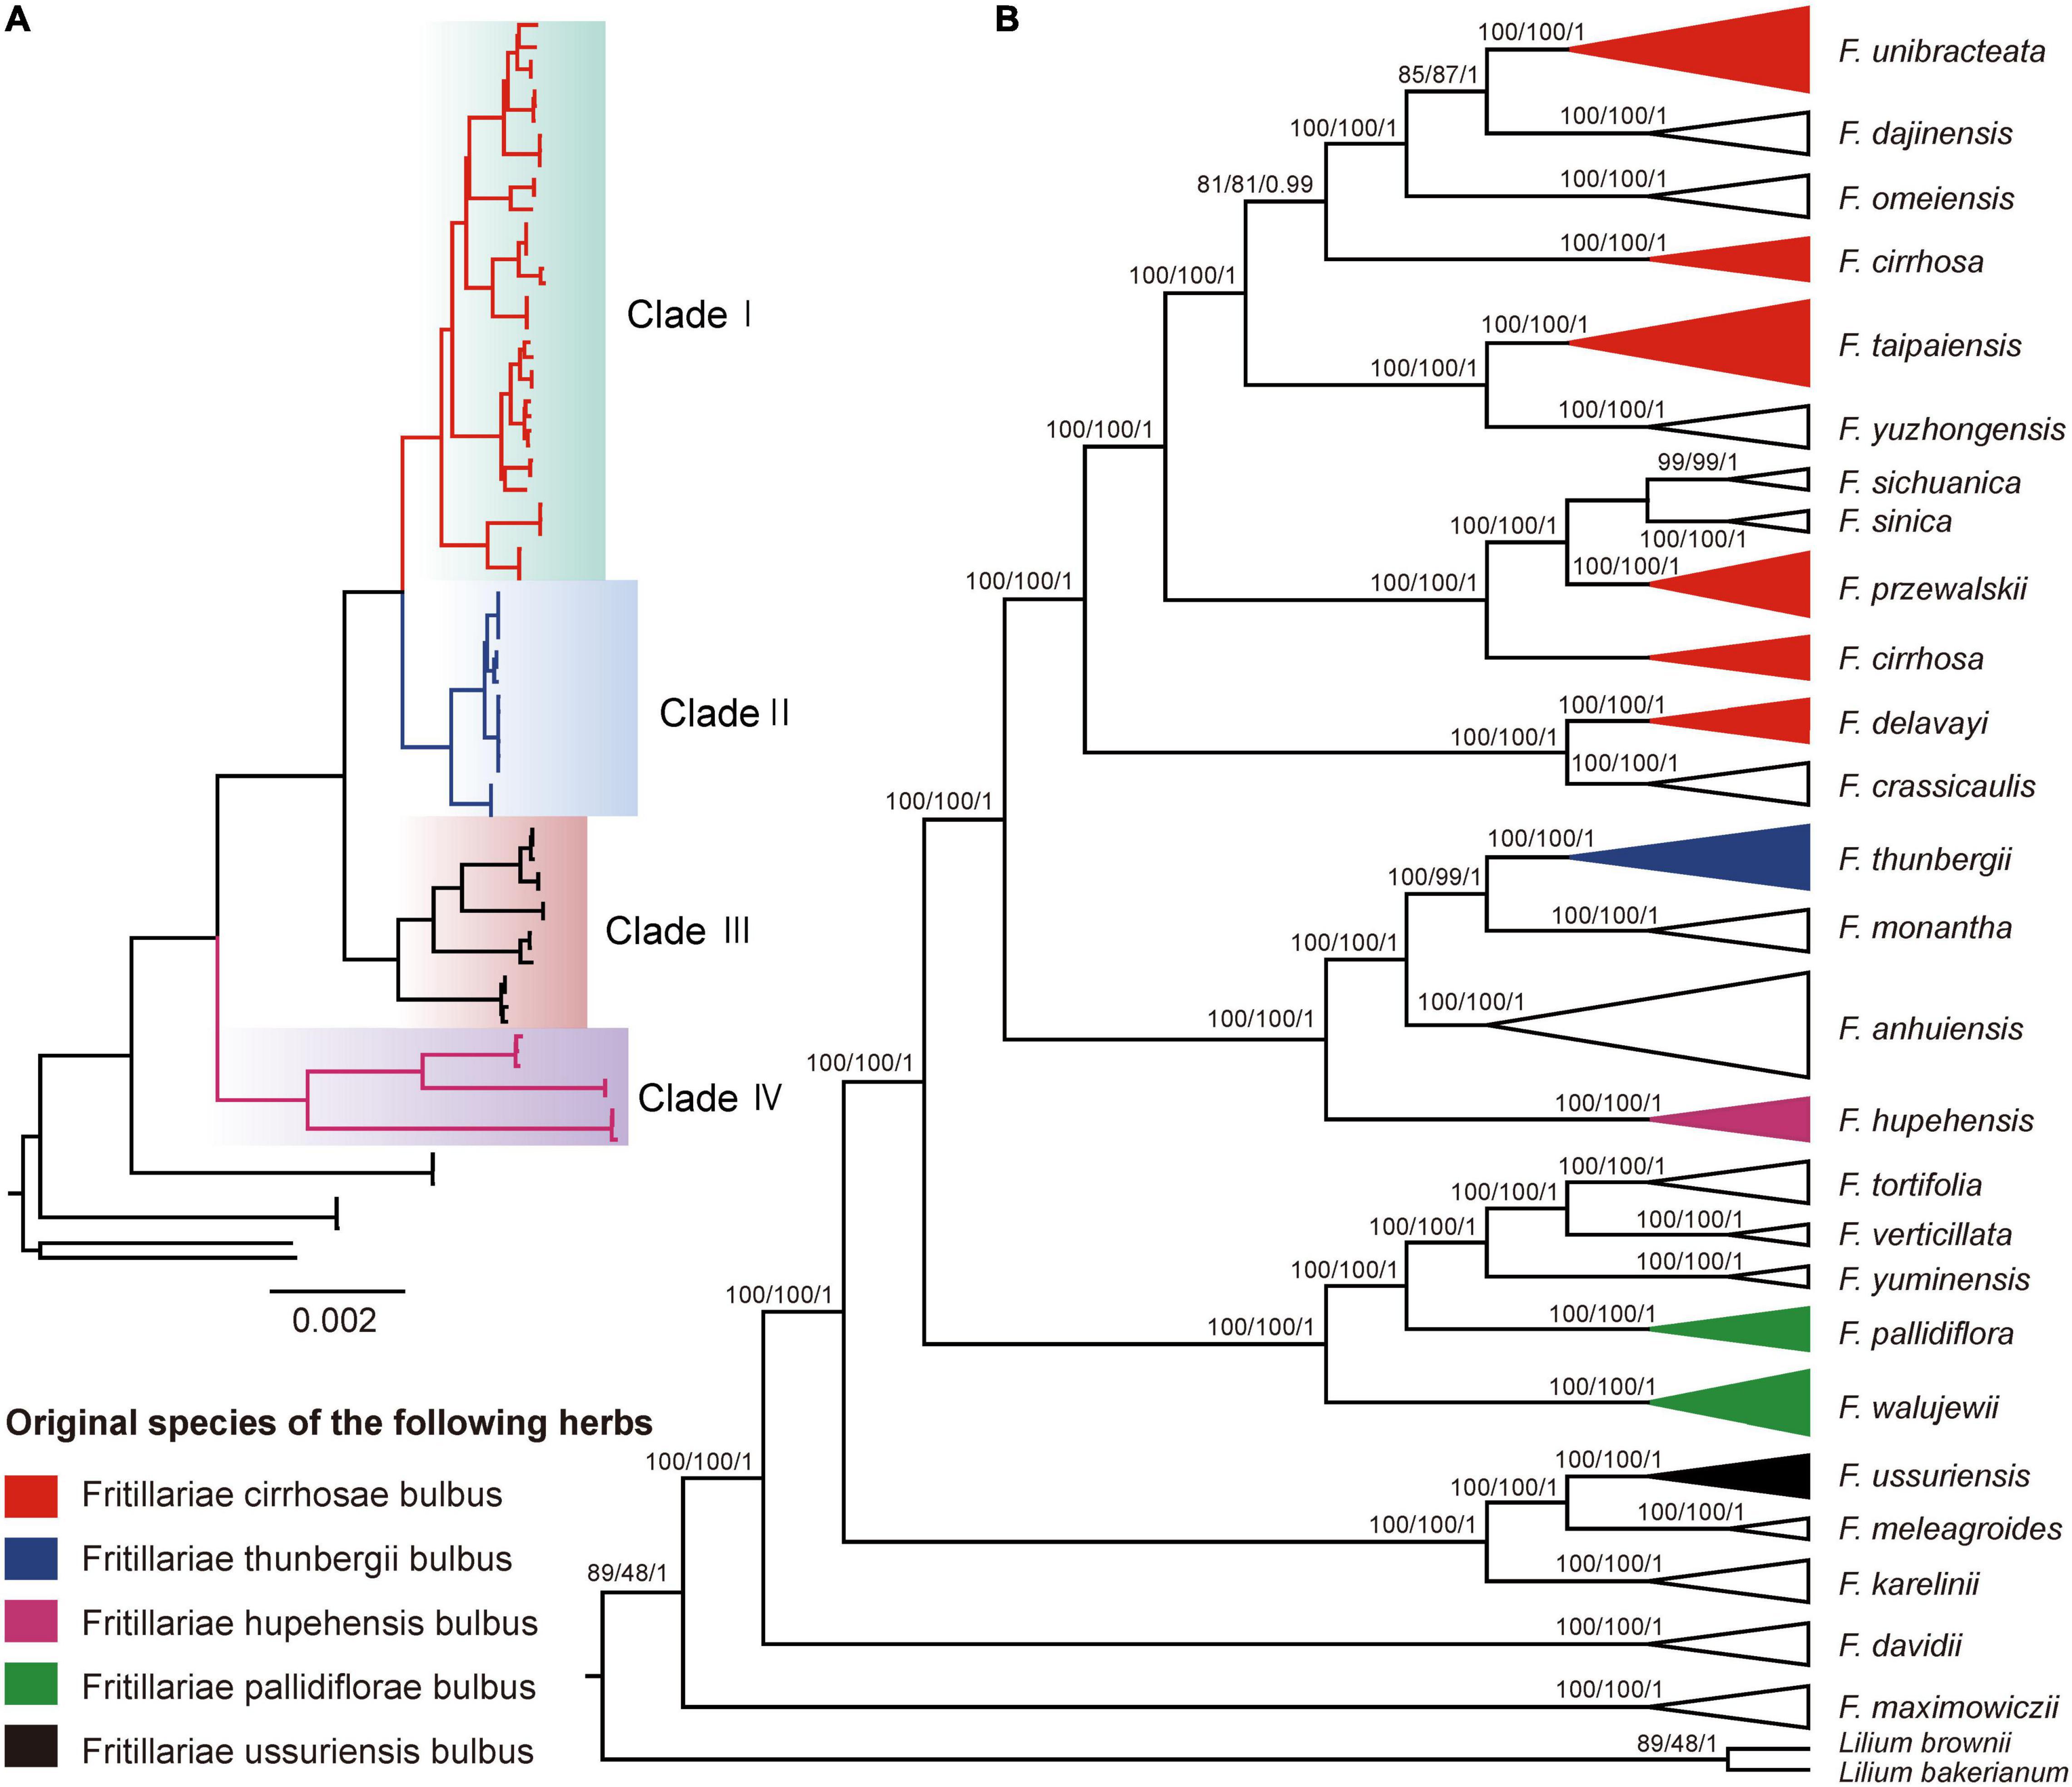
Figure 4. Phylogenetic analysis of 25 Fritillaria species inferred from maximum likelihood (ML), maximum parsimony (MP), and Bayesian analyses (BI) based on the complete chloroplast genomes. ML topological structure is shown on the left of the figure (A). For the topological structure on the right of the figure (B), the numbers above nodes are support values with ML bootstrap values on the left, MP bootstrap values in the middle, and Bayesian posterior probability (PP) values on the right. Colors represent the four major clades of the genus Fritillaria in China (A) and the original species of five Fritillariae bulbus of traditional Chinese medicine (B).
The divergence times of these three subgenera were inferred based on BEAST chronogram using 84 plastomes (Figure 5). All the nodes in the tree were highly supported with a posterior probability of more than 0.9. The subgenus Fritillaria was divided into four major clades. Clade I was estimated to be 7.49 Mya (95% HPD, 3.04∼11.65 Mya). The sister group Clade II was estimated at 5.74 (1.24∼10.40) Mya, while the remaining clade of Clade III and Clade IV split at 7.67 (4.15∼11.58) Mya and 7.83 (3.89∼11.50) Mya, respectively. The speciation events of this subgenus started from 11.71 (8.73∼14.79) Mya evolved in the Middle and Late Miocene. Furthermore, the subgenus Davidii and Liliorhiza including only one species in China were split at 14.15 (10.77∼17.77) Mya and 16.57 (13.04∼20.43) Mya, respectively, which also occurred in the Miocene.
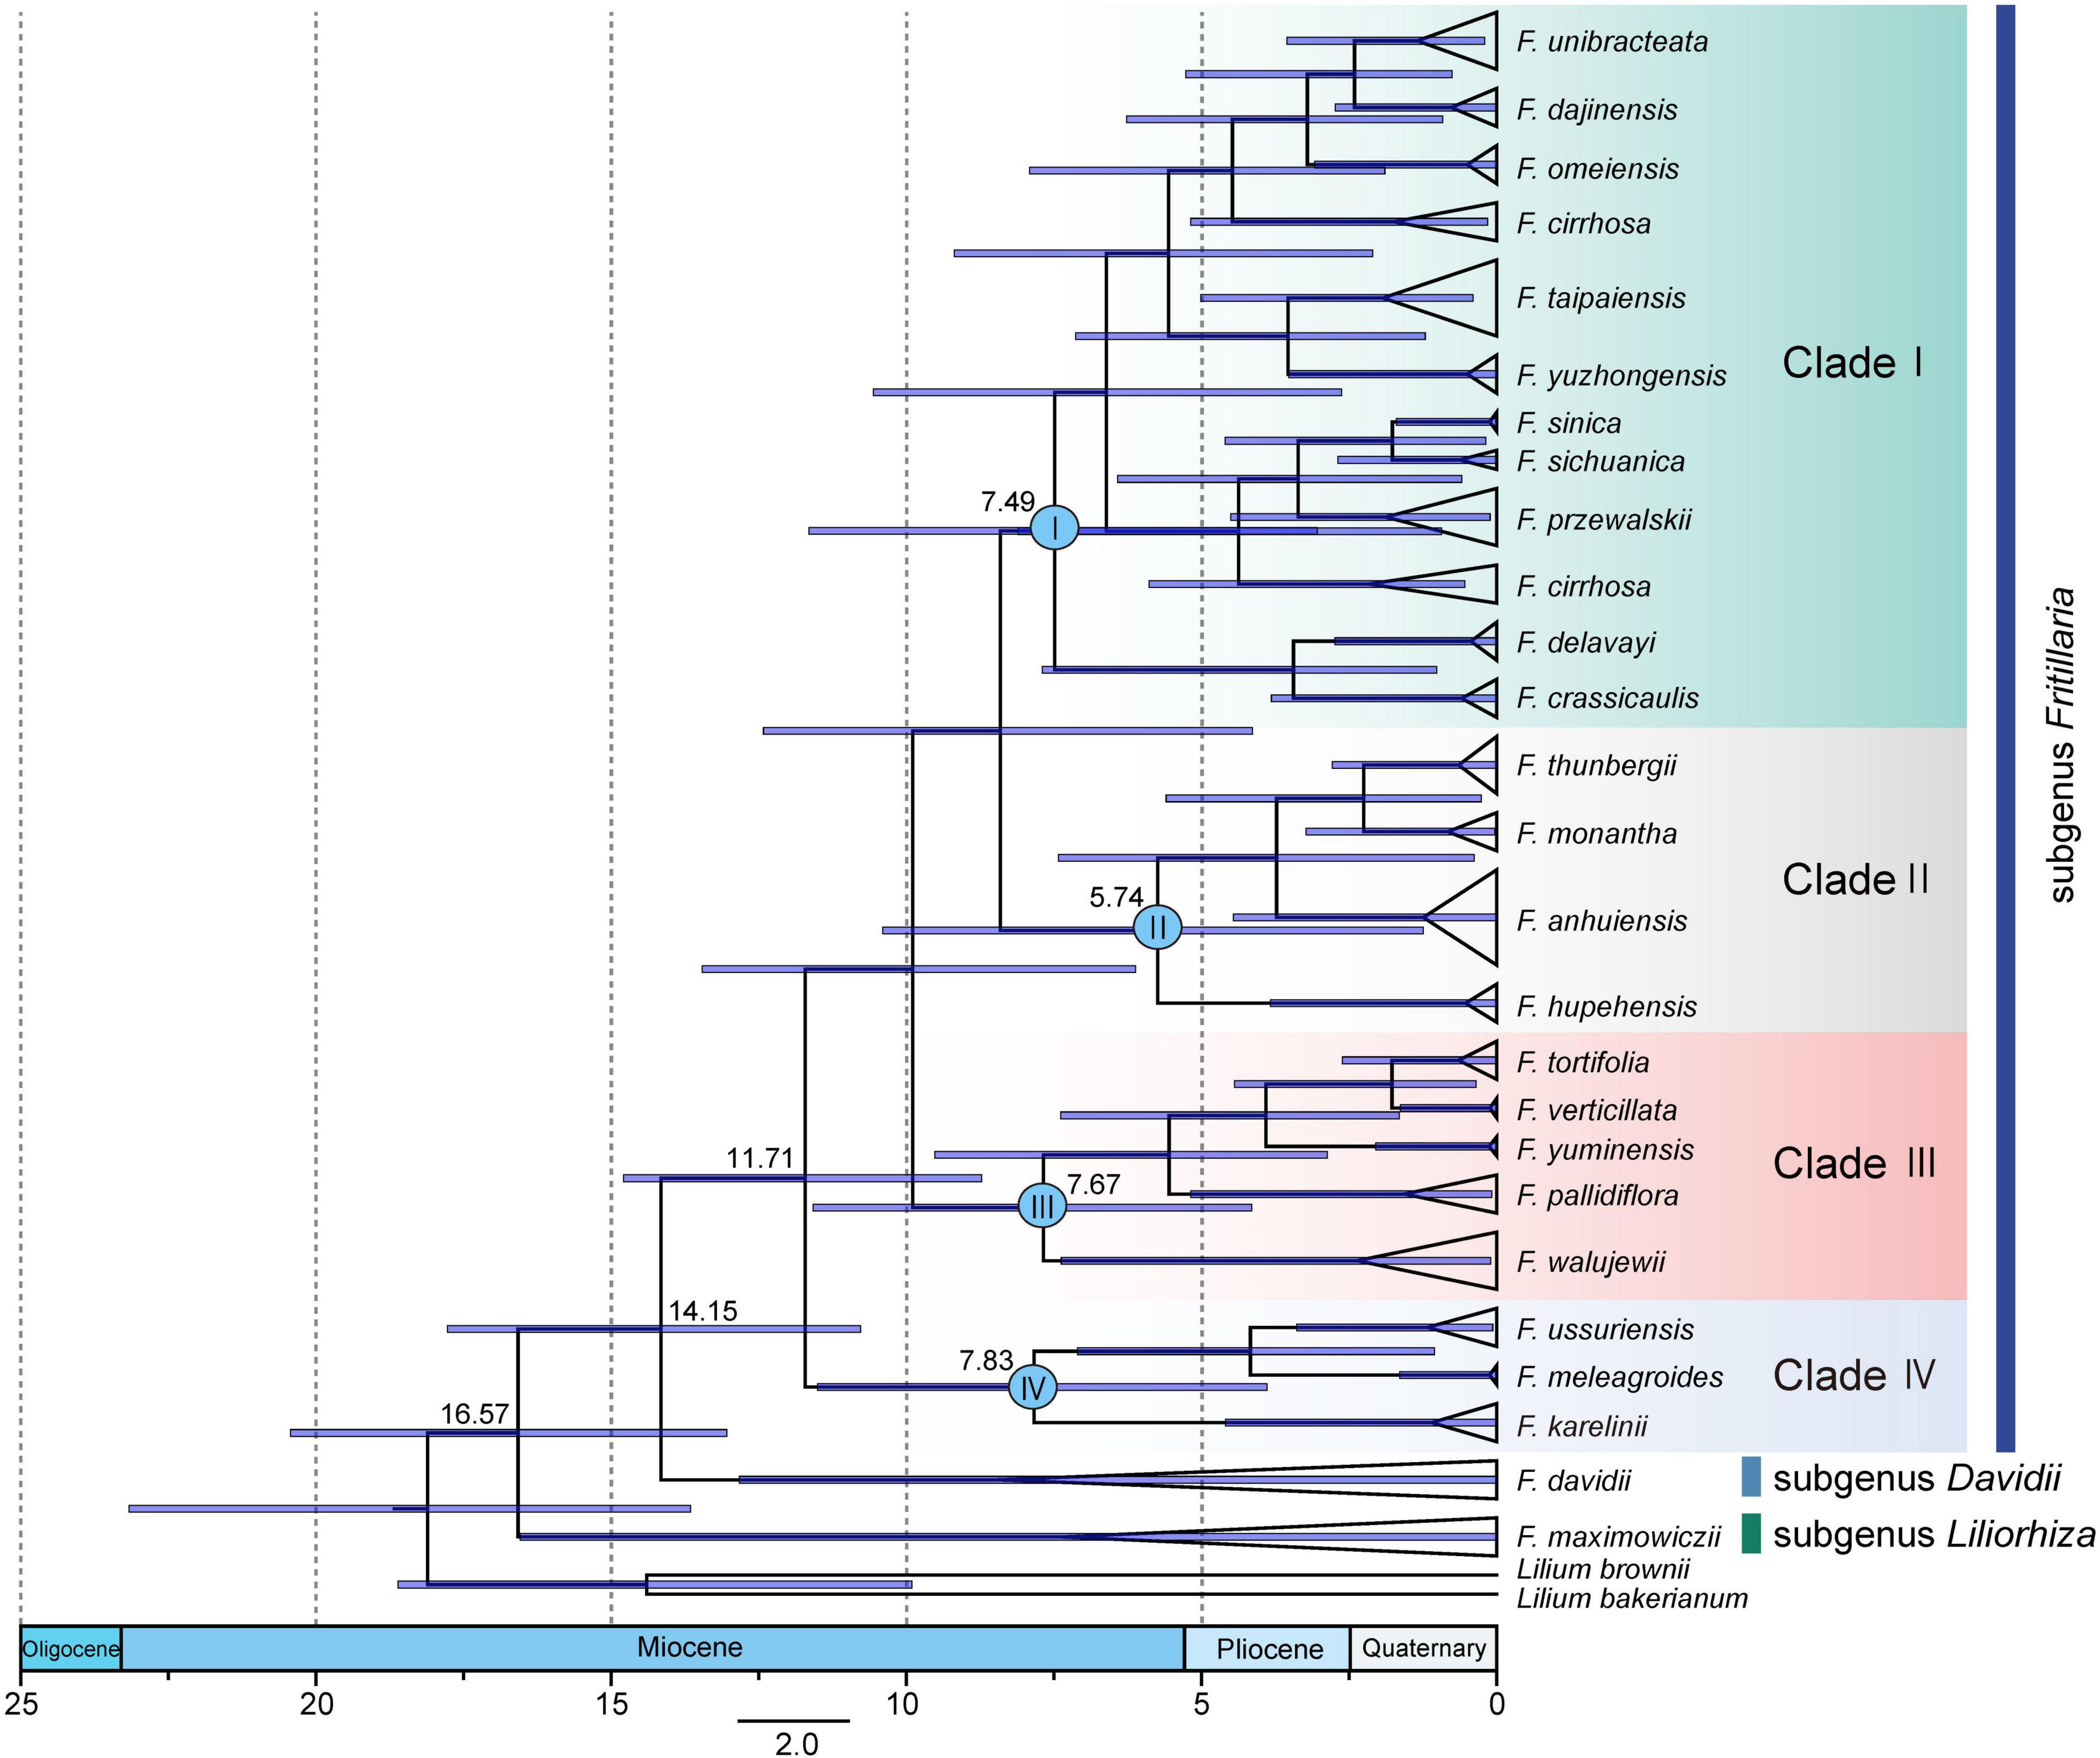
Figure 5. Maximum clade credibility (MCC) tree of the 25 Fritillaria species from BEAST analysis under the Yule tree prior and lognormal uncorrelated relaxed clock models on the basis of complete plastomes. Blue bars represent 95% credibility intervals for each node with posterior probability above 0.5.
Discussion
Species Discrimination in Fritillaria Based on DNA Super-Barcodes
The Fritillaria is an important genus with complicated phylogeny, especially the “Fritillaria cirrhosa complex” in southwest China. Our previous study revealed that eight species (F. cirrhosa, F. sichuanica, F. taipaiensis, F. yuzhongensis, F. unibracteata, F. przewalskii, F. sinica, and F. dajinensis) were closely related due to their confused morphology and close phylogenetic relationships (Chen et al., 2019; Wu et al., 2020). For such a complicated group, the standard DNA barcodes, using Sanger sequencing, had been proved to be ineffective (Zhang et al., 2016); whereas complete chloroplast genome, as a super-barcode, showed powerful ability on species discrimination (Chen et al., 2020). In this study, all the 21 Fritillaria species in China, except F. cirrhosa, could be well identified based on the 73 chloroplast genomes, including two suspicious species, namely “F. omeiensis” and “F. hupehensis” (Figure 3A). These results indicated that a complete chloroplast genome could effectively improve the resolution of species identification of DNA barcoding in Fritillaria, compared with the universal DNA barcodes. Therefore, super-barcode could be listed as universal or complementary DNA barcode in plants, especially complicated taxa in taxonomy and phylogeny.
Complete chloroplast genomes had been proposed as the candidates for the next-generation DNA barcodes in plants (Li et al., 2015; Hollingsworth et al., 2016; Tontifilippini et al., 2017; Ji et al., 2019). Performance of cpDNA genomes on species discrimination had been tested from a series of genera (Nock et al., 2011; Kane et al., 2012; Ruhsam et al., 2015; Krawczyk et al., 2018; Fu et al., 2019; Ji et al., 2019; Kreuzer et al., 2019; Yang et al., 2019). The genomes could perform well in complicated Taxus (Fu et al., 2019), but they were also faced with difficulty on identifying species in Panax, Araucaria, Notopterygium, and Berberis (Ruhsam et al., 2015; Ji et al., 2019; Kreuzer et al., 2019; Yang et al., 2019). Herein, “Fritillaria cirrhosa complex,” as a group of recent diversification and rapid evolution (Luo and Chen, 1996a; Xiao et al., 2007), possesses extremely complicated morphological variations (Supplementary Figure 1) and phylogenetic relationships (Chen et al., 2019, 2020; Wu et al., 2020), which results in difficulty and dispute in taxonomy. Thus, complete plastome provided rich genetic variants and strong ability on species discrimination here, but it could not effectively track the boundary of F. cirrhosa which was also emphasized in previous research (Hollingsworth, 2011; Li et al., 2015). Therefore, it should be noticed that super-barcode was still not omnipotent, DNA barcodes from different genetic systems are required (Ruhsam et al., 2015; Hollingsworth et al., 2016; Ji et al., 2019).
Screening Specific Regions for Discriminating Fritillaria Species
The goal of DNA barcoding in plants is to increase success rates of species identification in which unique results of species identifications could be achieved (CBOL Plant Working Group, 2009). It was reported that lineage-specific barcodes could enhance resolution of the discrimination within a particular group owing to richer genetic information than the universal barcodes (Li et al., 2015). In this study, the HVRs could gain higher discriminatory resolution than that of genes and IGSs (Figures 2, 6A and Supplementary Table 5), demonstrating that the HVRs were potential fragments that could obviously increase the resolution for identifying Fritillaria species, and a similar result was also reported in Pterocarpus (Jiao et al., 2019). Furthermore, it should be noted that some HVRs possessed much longer lengths, including one or more adjacent genes and IGSs (Figure 6B). Thus, development on longer length of DNA sequencing would be beneficial to adopt specific DNA barcodes in the complicated group.
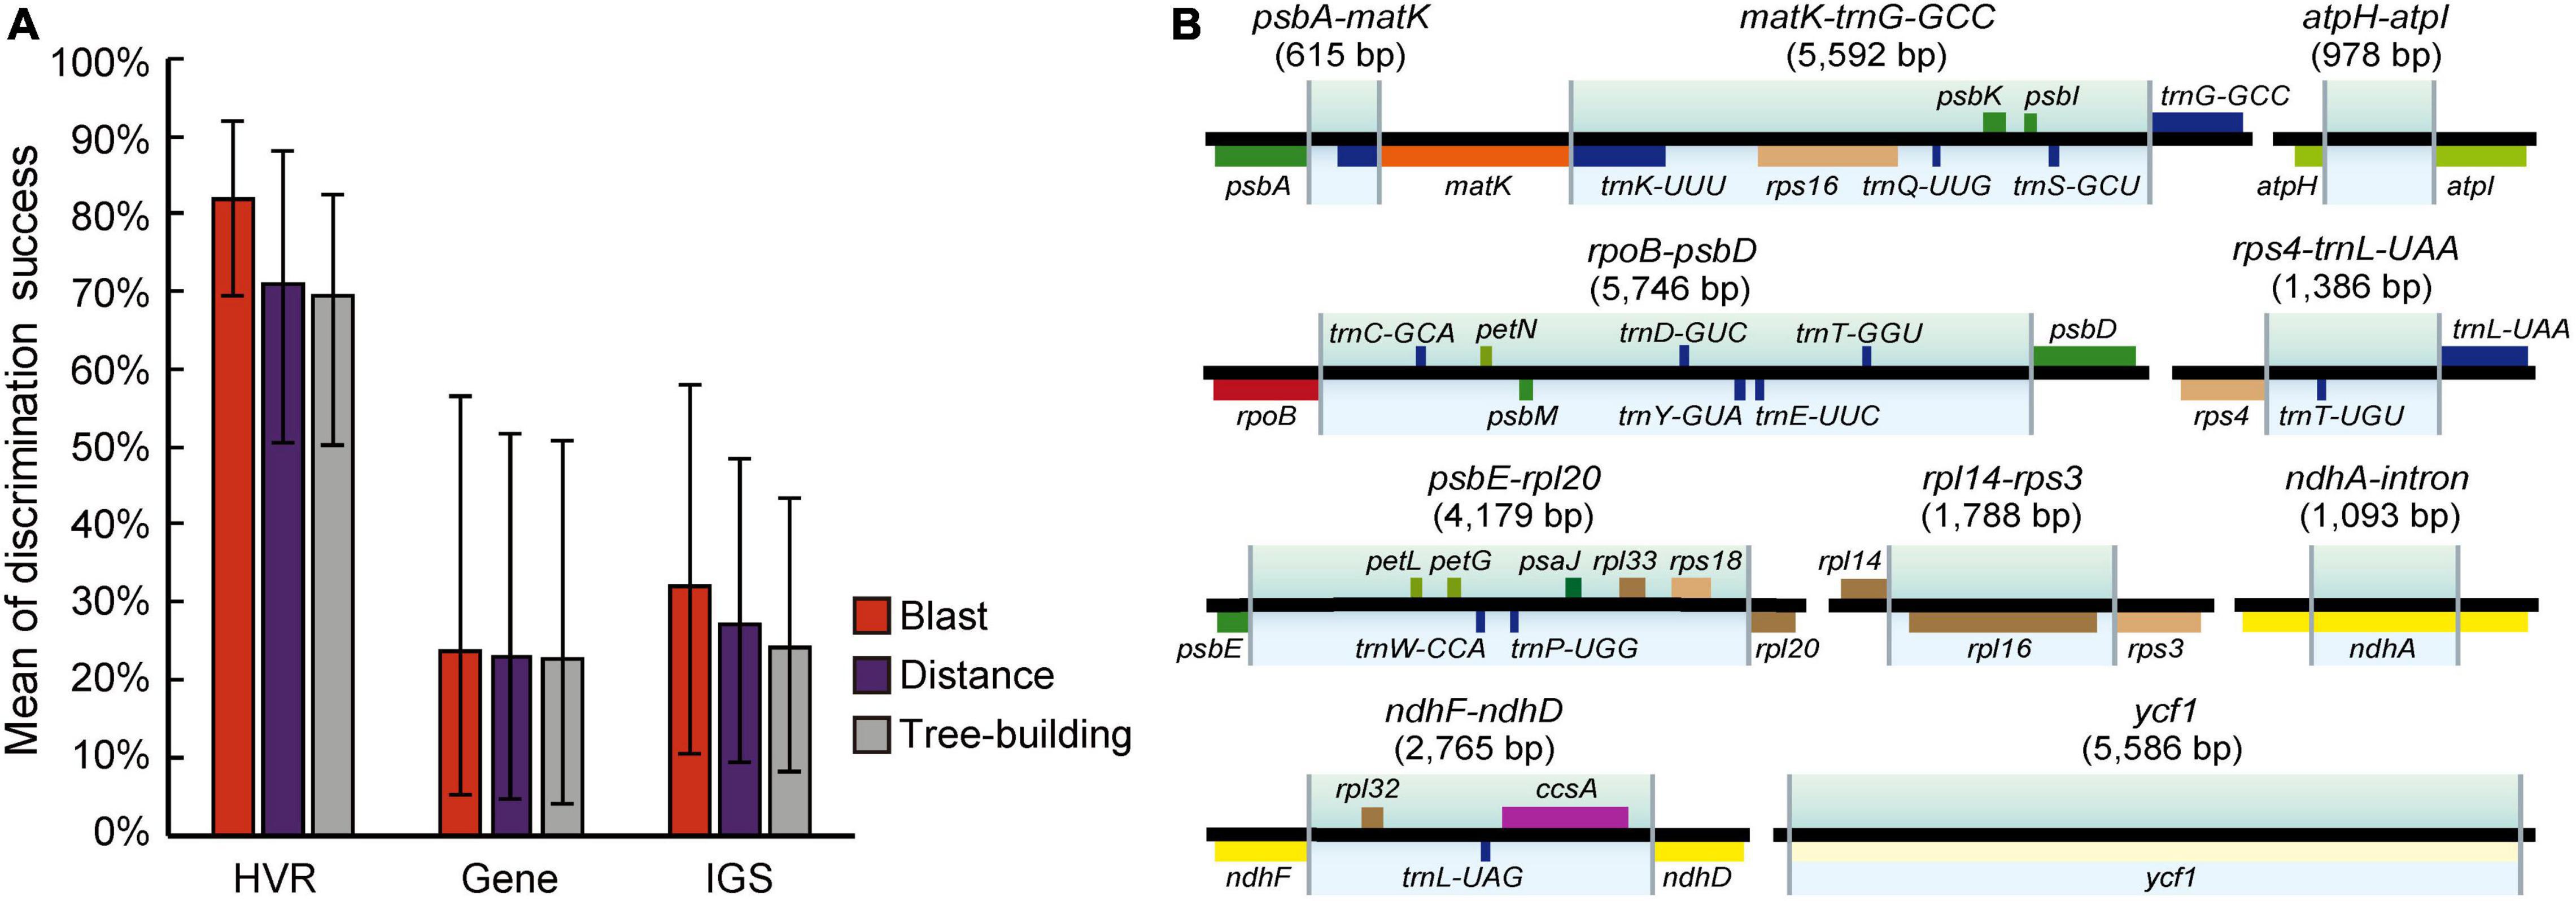
Figure 6. Average discriminatory power with error bars donated standard deviation (SD) of HVRs, genes, and IGSs based on three methods (A) and the aligned length of HVRs and genes/IGSs involved in them (B). The size of these regions is highlighted with the gradient colors. Genes above the line are transcribed clockwise, and genes shown over the line are counterclockwise. Rectangles in assorted colors represent the corresponding gene function. More details about these functions are shown in Supplementary Figure 2 and Supplementary Table 4.
A limited number of fragments selected from plastomes were tested and got a good performance in species identification in recent studies, such as ndhF-rpl32 or psbE-psbL/ndhA intron for Fagopyrum (Hu et al., 2016; Huang et al., 2019), rpl32-ccsA for Dioscorea (Scarcelli et al., 2011), and trnL-trnF or accD/rrn16-rrn23 for yew species (Liu et al., 2018; Fu et al., 2019). However, in Fritillaria, the presented study indicated that all these special loci could not afford higher discriminatory power than that of the universal DNA barcodes (matK + rbcL) (Supplementary Table 5). In contrast, three plastid loci (ycf1, matK-trnG-GCC, and rpoC1) showed better resolution for identifying the species in Fritillaria. Among these regions, ycf1 has been proposed as the most potential DNA barcode from chloroplast genome for land plants (Dong et al., 2015), but rpoC1 provided low resolution in many groups due to short DNA sequences (CBOL Plant Working Group, 2009; Wyler and Naciri, 2016; Xie et al., 2019). Moreover, matK-trnG-GCC included more variable sites (Table 2). Consequently, these three loci were suitable and could be proposed as the specific DNA barcodes from cpDNA genome for identifying Fritillaria species. Nevertheless, according to the selection criteria of DNA barcodes (Pečnikar and Buzan, 2013), the candidate loci can be excluded for specific DNA barcodes due to their length because this case might increase difficulty in designing primers, amplification, and sequencing. For the remaining loci, only the matK can provide high discriminatory success in Fritillaria species (Supplementary Table 5), which was also supported by our previous reports (Chen et al., 2020). Therefore, the universal barcode could also be regarded as the special DNA barcode in Fritillaria to some extent.
Phylogenetic Relationships and Divergence Time of Fritillaria Species in China
Recently, the complete chloroplast genome has been verified as a useful tool that could enhance phylogenetic resolution for complicated genera in angiosperm on account of its abundant informative sites (Wu et al., 2010; Xue et al., 2012; Bayly et al., 2013; Carbonell-caballero et al., 2015; Gitzendanner et al., 2017). In this study, 25 species in Fritillaria, including 23 species recorded by Flora of China (2000), as well as two suspicious species, were adopted to explore the phylogeny, which almost represented most of the recognized species in China (Table 1 and Supplementary Table 1). Phylogenomic analysis supported the monophyly of the subgenus Fritillaria. More importantly, 23 species in the subgenus could be divided into four major clades (Clade I, II, III, and IV) with high support values (Figure 4), in accordance with the previous findings based on chloroplast regions and ITS (Day et al., 2014; Huang et al., 2018; Zhang et al., 2021). The four clades possessed obvious geographic structure except the last one (Figures 4, 7). Among them, the first clade, distributed in southwest China, was undoubtedly the most complicated group probably due to its recent diversification. This work provided a comprehensive topological structure for the Fritillaria in China although the previous studies have revealed similar results based on limited samples and DNA markers (Park et al., 2017; Bi et al., 2018; Huang et al., 2018; Li et al., 2018; Zhang et al., 2021). Moreover, it is worth noting that of the suspicious species, “F. omeiensis” was not clustered into the same clade with F. crassicaulis, which was treated as a synonym for the latter in Flora of China (2000); similarly, “F. hupehensis” was also far from the F. monantha (Figure 4). Therefore, taxonomic status of the two suspicious species in Flora of China (2000) might be questionable, which needs further verification according to morphological and molecular evidence.
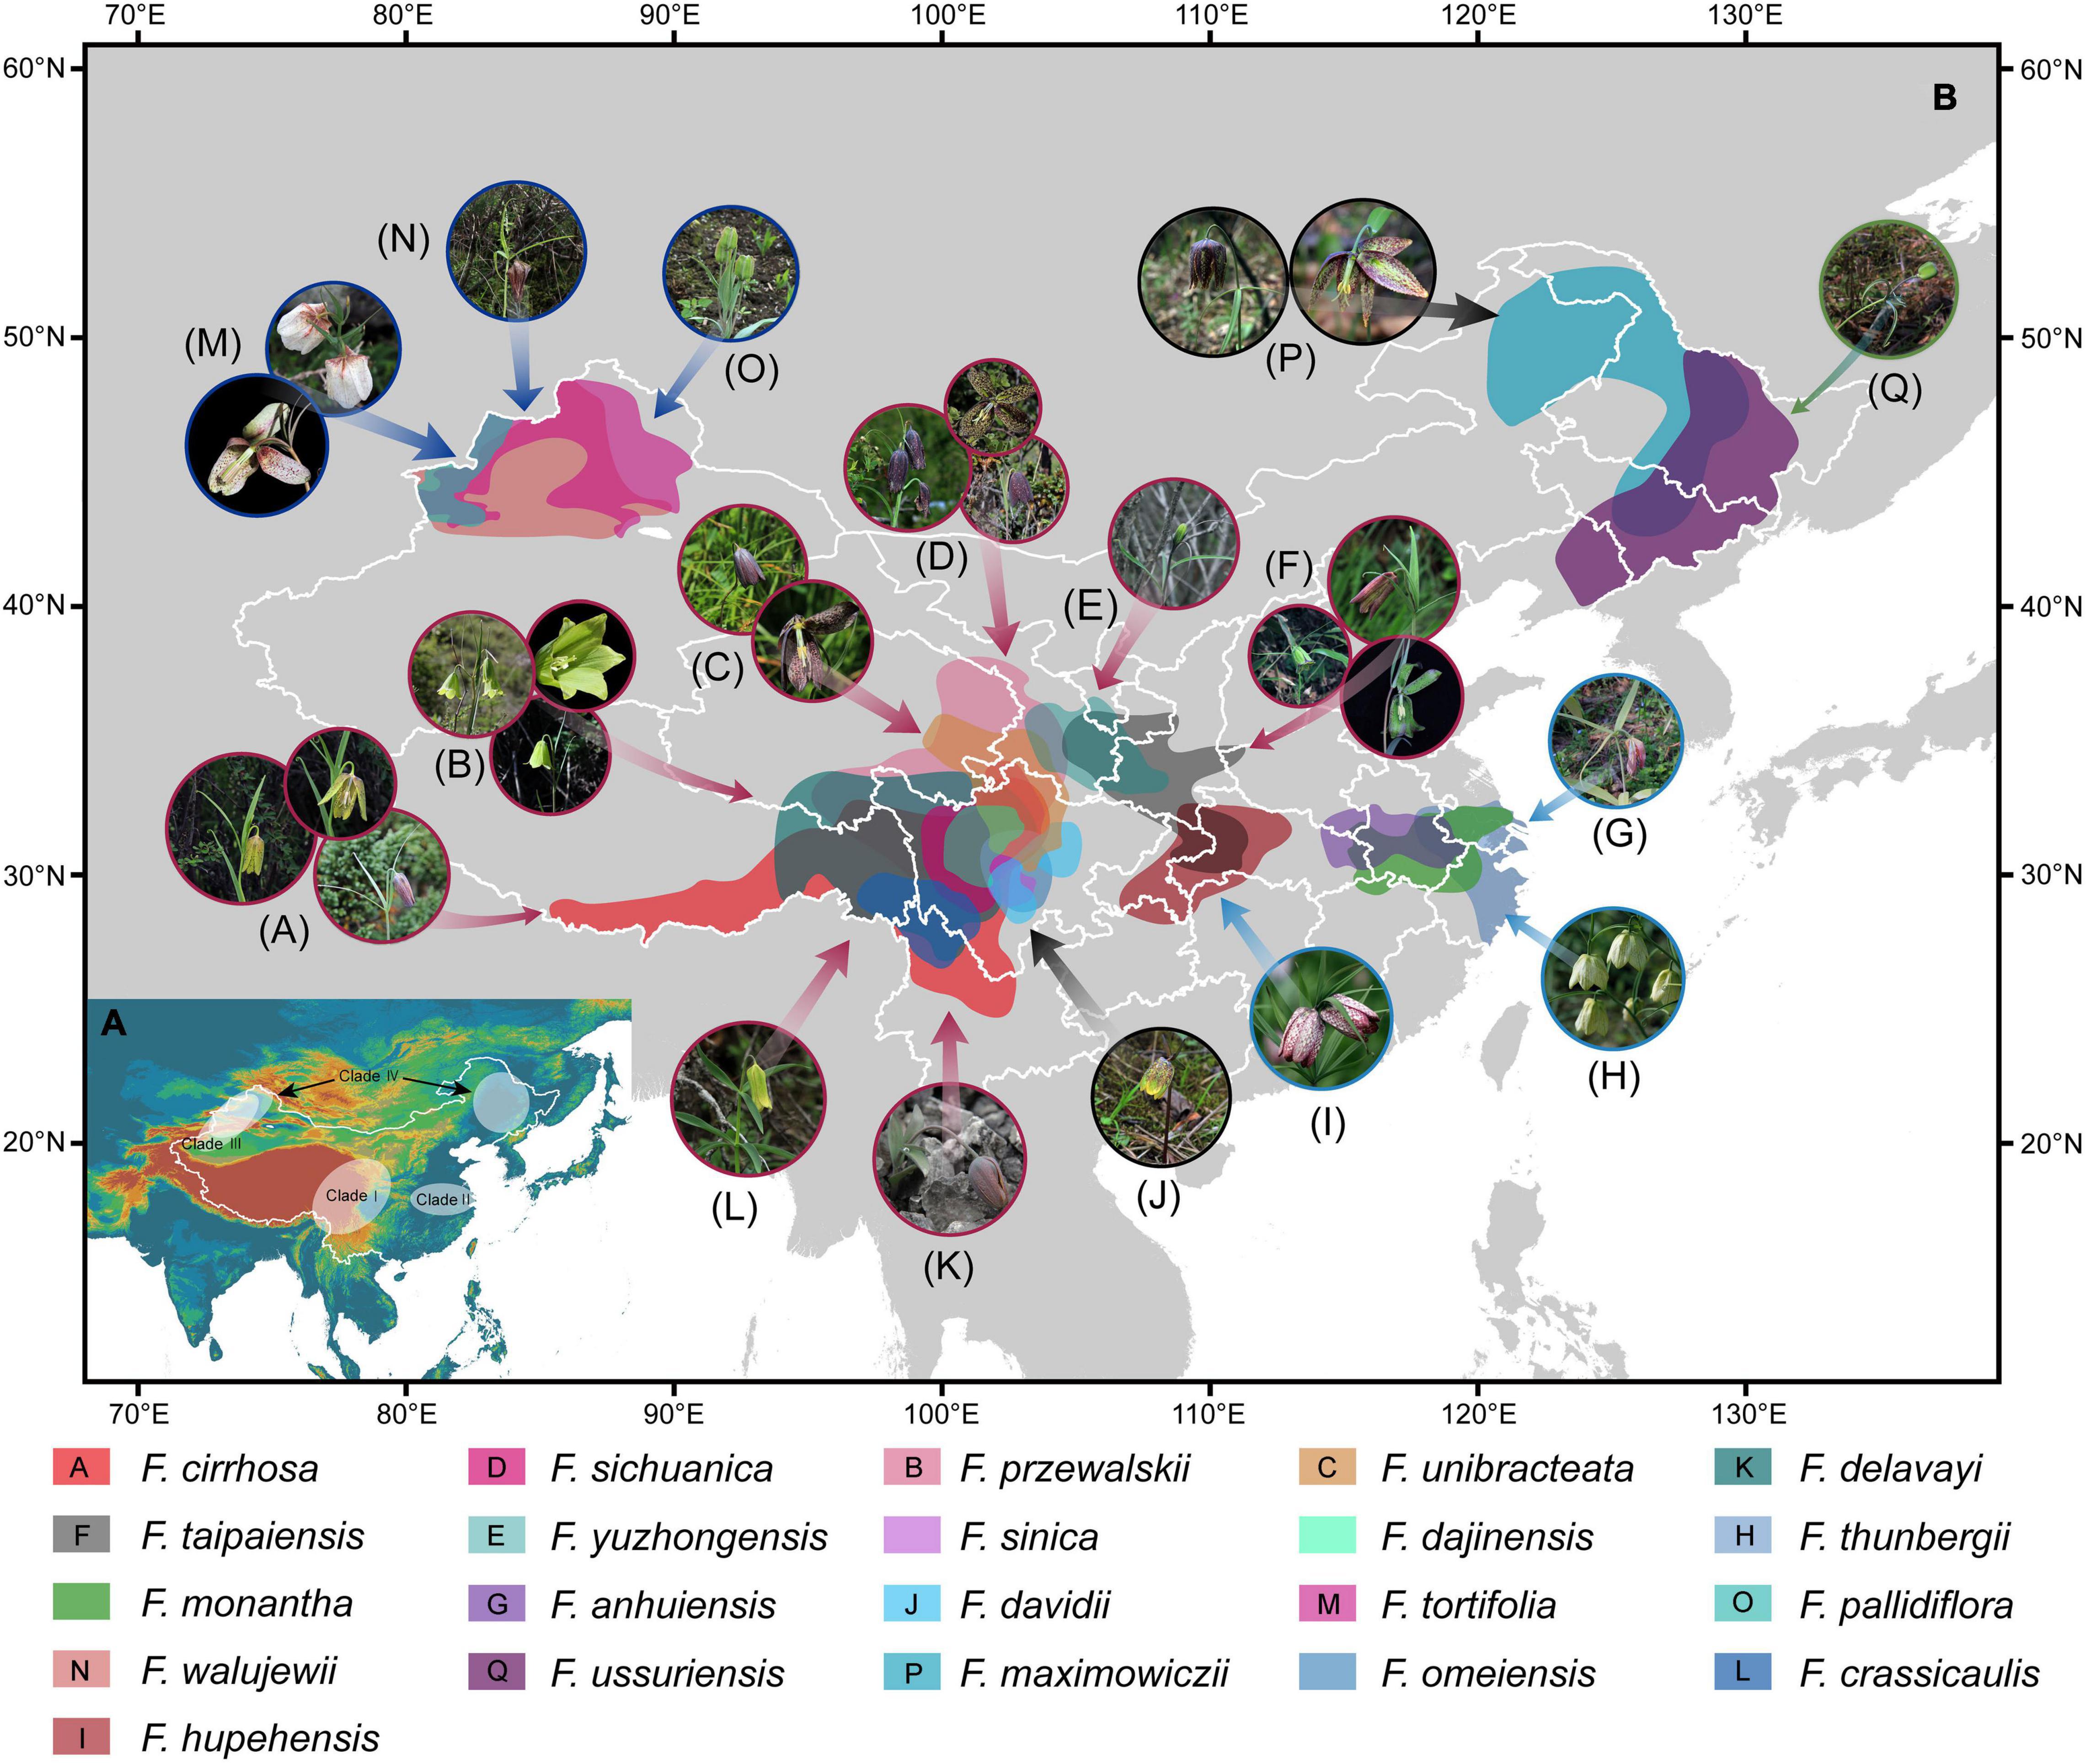
Figure 7. Four major clades of the subgenus Fritillaria in geography (A) and the potential geographical distributions of the 21 Fritillaria species predicted using the MaxEnt model with all records of existing vouchers of corresponding species (http://www.cvh.ac.cn/ and http://www.papc.cn/) (B). Photos represent living plants of Fritillaria species as follows: (A) F. cirrhosa, (B) F. przewalskii, (C) F. unibracteata, (D) F. sichuanica, (E) F. yuzhongensis, (F) F. taipaiensis, (G) F. anhuiensis, (H) F. thunbergii, (I) “F. hupehensis,” (J) F. davidii, (K) F. delavayi, (L) F. crassicaulis, (M) F. tortifolia, (N) F. walujewii, (O) F. pallidiflora, (P) F. maximowiczii, and (Q) F. ussuriensis.
The F. cirrhosa complex is an extremely complicated group distributed in the southwest of China, which might constitute more than the four species defined by professor Yibo Luo (Luo and Chen, 1996a; Xiao et al., 2007; Chen et al., 2019). In this region, distributions of the closely related species are almost adjacent or intersected with each in geographic structure (Figure 7), which may be an important reason that causes the complex relationships and similar morphological traits among the species. A previous study suggested that all species of the F. cirrhosa complex could be used as the sources supplying Fritillariae cirrhosae bulbus due to their similar chemical compounds in bulbs and morphological characteristics in plants (Xiao et al., 2007). Indeed, our investigation in field work also revealed that bulbs of most of the Fritillaria species in this region were generally used as Fritillariae cirrhosae bulbus by aboriginals for many years. Moreover, there were very close relationships among the five original species of Fritillariae cirrhosae bulbus, as well as the remaining species (Figure 4), and they were closely adjacent in geographical distribution (Figure 7). Therefore, it is feasible to broaden the original species of the medicine-based phylogeny and medicinal history, but it needs further verifications from the pharmacy and other disciplines.
Mountain barriers may have played vital roles in speciation and diversification because topographic complexity could lead to ecological stratification and environmental heterogeneity (Fjeldså et al., 2012). In this study, our results showed that the divergence time of subgenus Fritillaria in China dated to 11.71 Mya (8.73∼14.79 Mya, 95% HPD) in the Middle to Late Miocene period (Figure 5). The four major clades were estimated at 5∼8 Mya evolved in the Late Miocene within this subgenus. However, due to the limited representative species and outgroups in our analysis, molecular dating might not designate an exact origin time, so that these times are relatively earlier than previously published estimations (Huang et al., 2018). Furthermore, geological data and many biogeographical studies confirmed that the Qinghai-Tibetan Plateau (QTP) uplift occurred from the Miocene to the mid-Pliocene until the start of the Quaternary (Li et al., 1979; Zhou et al., 2006; Royden et al., 2008). Therefore, we speculated that the origin and divergence of Fritillaria species in China could be closely associated with uplift of the QTP. With continued orogeny of the Himalayas in that period, the QTP alongside was subjected to various uplift events that led to climate cooling in these regions (Jin et al., 2003). When temperatures fell, plants adapted to cold habitats might have expanded their range outside the QTP to other newly available temperate areas (Zhang et al., 2014). Thus, these dispersal events might be the important reason for the early diversification of Fritillaria species into its major extant Chinese clades in geographical distribution (Figure 7).
Conclusion
In the present study, we tried to evaluate resolution of the complete plastomes in species discrimination, phylogenetic reconstruction, and divergence time estimation of major clades in Fritillaria. The results indicated that the whole plastomes could improve resolution in species discrimination but could not fully match the species boundaries in Fritillaria. Based on the comparative analysis of many fragments, we found that four regions (ycf1, matK-trnG-GCC, rpoC1, and matK) could gain high discriminatory power but three of them were not suitable loci in length as special DNA barcodes for identification of Fritillaria species except the plastid gene matK. Moreover, the present phylogenomic analysis was by far the most comprehensive study to reveal relationships of the Fritillaria species in China, which showed that the subgenus Fritillaria was divided into four major clades and the taxonomic delimitation of two suspicious species (“F. omeiensis” and “F. hupehensis”) by Flora of China (2000) might be questionable and need to be further revised. The original times of the section Fritillaria species were estimated, and the results illustrated that both the subgenus Fritillaria and its four main clades were evolved in the Middle to Late Miocene. In conclusion, the newly developed plastomes resources and comparative analysis along with the existing plastomes of Fritillaria would be beneficial to promoting the rational utilization of medicinal species in the important genus.
Data Availability Statement
The datasets presented in this study can be found in online repositories. The names of the repository/repositories and accession number(s) can be found in the article/Supplementary Material.
Author Contributions
DZ designed the study and collected molecular materials. QC and HH generated molecular data and performed data analysis. QC wrote an initial draft of the manuscript. DZ revised this manuscript finally and submitted it. All authors contributed to the article and approved the submitted version.
Funding
This study was co-supported by National Natural Science Foundation of China (32060091 and 31660081), Reserve Talents Project for Young and Middle-Aged Academic and Technical Leaders of Yunnan Province (202105AC160063), and Yunnan Provincial Science and Technology Department (2016FB144).
Conflict of Interest
The authors declare that the research was conducted in the absence of any commercial or financial relationships that could be construed as a potential conflict of interest.
Publisher’s Note
All claims expressed in this article are solely those of the authors and do not necessarily represent those of their affiliated organizations, or those of the publisher, the editors and the reviewers. Any product that may be evaluated in this article, or claim that may be made by its manufacturer, is not guaranteed or endorsed by the publisher.
Acknowledgments
We thank Junbo Yang, Zhirong Zhang, Rong Zhang, Tingshuang Yi, and Shudong Zhang in the Kunming Institute of Botany, Chinese Academy of Sciences (CAS) for their help in the molecular experiment and data analysis. Meanwhile, we also thank Lizhen Duan, Xiaobo Wu, and Jie Zhang in Dali University for their help in field work on collecting specimen and molecular materials of Fritillaria species.
Supplementary Material
The Supplementary Material for this article can be found online at: https://www.frontiersin.org/articles/10.3389/fpls.2022.764255/full#supplementary-material
Supplementary Figure 1 | Plant morphology of the Fritillaria species in this study.
Supplementary Figure 2 | Gene map of chloroplast genomes of Fritillaria. Genes outside the circle are transcribed clockwise, and genes shown on the inside of the circle are counterclockwise. Genes belonging to the functional group are color-coded. The darker gray in the inner corresponds to GC content, and the lighter gray corresponds to AT content.
Supplementary Figure 3 | Positive correlation between intra- and inter-specific p-distances of (A) high divergence regions (HVRs), (B) genes, and (C) intergenic spacer (IGS) in the 21 Fritillaria species.
Supplementary Figure 4 | Performances of other HVRs for identifying the Fritillaria species using NJ trees.
Supplementary Figure 5 | Phylogenetic relationship of the 25 Fritillaria species inferred from maximum likelihood (ML), maximum parsimony (MP), and Bayesian analyses (BI) based on the 10 high divergence regions (HVRs). If three trees possessed similar topological structures, the ML tree was declared to present phylogenetic relationships with the addition of support values from MP and BI analyses. Or else, just put them on their own, respectively. Bootstrap values or Bayesian posterior probability (PP) values less than 60 (or 0.6) are not exhibited in the phylogenetic trees.
Footnote
References
Bankevich, A., Nurk, S., Antipov, D., Gurevich, A. A., Dvorkin, M., Kulikov, A. S., et al. (2012). SPAdes: a new genome assembly algorithm and its applications to single-cell sequencing. J. Comput. Biol. 19, 455–477. doi: 10.1089/cmb.2012.0021
Barrett, R. D. H., and Hebert, P. D. N. (2005). Identifying spiders through DNA barcodes. Can. J. Zool. 83, 481–491. doi: 10.1139/z05-024
Bayly, M. J., Rigault, P., Spokevicius, A., Ladiges, P. Y., Ades, P. K., Anderson, C., et al. (2013). Chloroplast genome analysis of Australian eucalypts - Eucalyptus, Corymbia, Angophora, Allosyncarpia and Stockwellia (Myrtaceae). Mol. Phylogenet. Evol. 69, 704–716. doi: 10.1016/j.ympev.2013.07.006
Bi, Y., Zhang, M. F., Xue, J., Dong, R., Du, Y. P., and Zhang, X. H. (2018). Chloroplast genomic resources for phylogeny and DNA barcoding: a case study on Fritillaria. Sci. Rep. 8:1184. doi: 10.1038/s41598-018-19591-9
Bolger, A. M., Lohse, M., and Usadel, B. (2014). Trimmomatic: a flexible trimmer for Illumina sequence data. Bioinformatics 30, 2114–2120. doi: 10.1093/bioinformatics/btu170
Camacho, C., Coulouris, G., Avagyan, V., Ma, N., Papadopoulos, J., Bealer, K., et al. (2009). BLAST+: architecture and applications. BMC Bioinform. 10:421. doi: 10.1186/1471-2105-10-421
Carbonell-caballero, J., Alonso, R., Ibañez, V., Terol, J., Talon, M., and Dopazo, J. (2015). A phylogenetic analysis of 34 chloroplast genomes elucidates the relationships between wild and domestic species within the genus Citrus. Mol. Biol. Evol. 32, 2015–2035. doi: 10.1093/molbev/msv082
CBOL Plant Working Group (2009). A DNA barcode for land plants. Proc. Natl. Acad. Sci. U.S.A. 106, 12794–12797. doi: 10.1073/pnas.0905845106
Chase, M. W., Salamin, N., Wilkinson, M., Dunwell, J. M., Rao, P. K., Haidar, N., et al. (2005). Land plants and DNA barcodes: short-term and long-term goals. Proc. Royal Soc. B. 360, 1889–1895. doi: 10.1098/rstb.2005.1720
Chen, Q., Wu, X. B., and Zhang, D. Q. (2019). Phylogenetic analysis of Fritillaria cirrhosa D. Don and its closely related species based on complete chloroplast genomes. Peerj 7:e7480. doi: 10.7717/peerj.7480
Chen, Q., Wu, X. B., and Zhang, D. Q. (2020). Comparison of the abilities of universal, super, and specific DNA barcdes to discriminate among the original species of Fritillariae cirrhosae bulbus and its adulterants. PLoS One 15:e0229181. doi: 10.1371/journal.pone.0229181
Chen, S. C., and Helen, V. M. (2000). “Fritillaria L,” in Flora of China, 24th Edn, eds Z. Y. Wu and P. H. Raven (Beijing: Science Press).
Chinese Pharmacopoeia Commission [CPC] (2020). Chinese Pharmacopoeia, 1st Edn. Beijing: Chinese Medical Science and Technology Press.
Coissac, E., Hollingsworth, P. M., Lavergne, S., and Taberlet, P. (2016). From barcodes to genomes: extending the concept of DNA barcoding. Mol. Ecol. 25, 1423–1428. doi: 10.1111/mec.13549
Costa, F. O., Dewaard, J. R., Boutillier, J., Ratnasingham, S., Dooh, R. T., Hajibabaei, M., et al. (2007). Biological identifications through DNA barcodes: the case of the Crustacea. Can. J. Fish. Aouat. Sci. 64, 272–295. doi: 10.1139/f07-008
Darriba, D., Taboada, G. L., Doallo, R., and Posada, D. (2012). jModelTest 2: more models, new heuristics and high-performance computing. Nat. Methods 9:772. doi: 10.1038/nmeth.2109
Day, P. D. (2018). Studies in the Genus Fritillaria L. (Liliaceae). London: Queen Mary University of London.
Day, P. D., Madeleine, B., Laurence, H., Fay, M. F., Leitch, A. R., Leitch, I. J., et al. (2014). Evolutionary relationships in the medicinally important genus Fritillaria L. (Liliaceae). Mol. Phylogenet. Evol. 80, 11–19. doi: 10.1016/j.ympev.2014.07.024
Dong, W. P., Xu, C., Li, C. H., Sun, J. H., Zuo, Y. J., Shi, S., et al. (2015). ycf1, the most promising plastid DNA barcode of land plants. Sci. Rep. 5:8348. doi: 10.1038/srep08348
Doyle, J. (1987). A rapid DNA isolation procedure for small quantities of fresh leaf tissue. Phytochem. Bull. 19, 11–15.
Fjeldså, J., Bowie, R. C. K., and Rahbek, C. (2012). The role of mountain ranges in the diversification of birds. Annu. Rev. Ecol. Evol. Syst. 43, 249–265. doi: 10.1146/annurev-ecolsys-102710-145113
Fu, C. N., Wu, C. L., Mo, Z. Q., Liu, J., Chang, C. C., Li, D. Z., et al. (2019). Prevalence of isomeric plastomes and effectiveness of plastome super-barcodes in yews (Taxus) worldwide. Sci. Rep. 9:2773. doi: 10.1038/s41598-019-39161-x
Gitzendanner, M. A., Soltis, P. S., Yi, T. S., Li, D. Z., and Soltis, D. E. (2017). Plastome phylogenetics: 30 years of inferences into plant evolution. Adv. Bot. Res. 85, 293–313. doi: 10.1016/bs.abr.2017.11.016
Gonzalez, M. A., Baraloto, C., Engel, J., Mori, S. A., Pétronelli, P., Riéra, B., et al. (2009). Identification of amazonian trees with DNA barcodes. PLoS One 4:e7483. doi: 10.1371/journal.pone.0007483
Gueuning, M., Ganser, D., Blaser, S., Albrecht, M., Knop, E., Praz, C., et al. (2019). Evaluating next-generation sequencing (NGS) methods for routine monitoring of wild bees: metabarcoding, mitogenomics or NGS barcoding. Mol. Ecol. Resour. 19, 847–862. doi: 10.1111/1755-0998.13013
Hajibabaei, M., Janzen, D. H., Burns, J. M., Hallwachs, W., and Hebert, P. D. N. (2006). DNA barcodes distinguish species of tropical Lepidoptera. Proc. Natl. Acad. Sci. U. S. A. 103, 968–971. doi: 10.1073/pnas.0510466103
Hebert, P. D., Ratnasingham, S., and Dewaard, J. R. (2003). Barcoding animal life: cytochrome c oxidase subunit 1 divergences among closely related species. Proc. Royal Soc. B. 270, S96–S99. doi: 10.1098/rsbl.2003.0025
Hollingsworth, M. L., Andra, C. A., Forrest, L. L., Richardson, J., Pennington, R. T., Long, D. G., et al. (2010). Selecting barcoding loci for plants: evaluation of seven candidate loci with species-level sampling in three divergent groups of land plants. Mol. Ecol. Resour. 9, 439–457. doi: 10.1111/j.1755-0998.2008.02439.x
Hollingsworth, P. M. (2011). Refining the DNA barcode for land plants. Proc. Natl. Acad. Sci. U.S.A. 108, 19451–19452. doi: 10.1073/pnas.1116812108
Hollingsworth, P. M., Li, D. Z., Michelle, V. D. B., and Twyford, A. D. (2016). Telling plant species apart with DNA: from barcodes to genomes. Philos. Trans. R. Soc. Lond., B, Biol. Sci. 371:20150338. doi: 10.1098/rstb.2015.0338
Hou, G., Chen, W. T., Lu, H. S., Cheng, F., and Xie, S. G. (2018). Developing a DNA barcode library for perciform fishes in the South China Sea: species identification, accuracy, and cryptic diversity. Mol. Ecol. Resour. 18, 137–146. doi: 10.1111/1755-0998.12718
Hu, Y. N., Zhang, Z. W., Wu, B., Gao, J., and Li, Y. Q. (2016). Genetic relationships of buckwheat species based on the sequence analysis of ITS and ndhF-rpl32. Bio. Sci. 24, 296–303. doi: 10.17520/biods.2015259
Huang, J., Yang, L. Q., Yu, Y., Liu, Y. M., Xie, D. F., Li, J., et al. (2018). Molecular phylogenetics and historical biogeography of the tribe Lilieae (Liliaceae): bi-directional dispersal between biodiversity hotspots in Eurasia. Ann. Bot. 122, 1–18. doi: 10.1093/aob/mcy138
Huang, Y., Li, Z. Q., Wang, C. L., Zou, C. Y., Wen, W., Shao, J. R., et al. (2019). psbE-psbL and ndhA intron, the promising plastid DNA barcode of Fagopyrum. Int. J. Mol. Sci. 20:3455. doi: 10.3390/ijms20143455
Ji, Y. H., Liu, C. K., Yang, Z. Y., Yang, L. F., He, Z. S., Wang, H. C., et al. (2019). Testing and using complete plastomes and ribosomal DNA sequences as the next generation DNA barcodes in Panax (Araliaceae). Mol. Ecol. Resour. 19, 1333–1345. doi: 10.1111/1755-0998.13050
Jiao, L. C., Lu, Y., He, T., Li, J. N., and Yin, Y. F. (2019). A strategy for developing high-resolution DNA barcodes for species discrimination of wood specimens using the complete chloroplast genome of three Pterocarpus species. Planta 250:95. doi: 10.1007/s00425-019-03150-1
Jin, J. H., Liao, W. B., Wang, B. S., and Peng, S. L. (2003). Global change in Cenozoic and evolution of flora in China. Guihaia 3, 217–225.
Jin, J. J., Yu, W. B., Yang, J. B., Song, Y., DePamphilis, C. W., Yi, T. S., et al. (2020). GetOrganelle: a fast and versatile toolkit for accurate de novo assembly of organelle genomes. Genome Biol. 21, 1–31. doi: 10.1186/s13059-020-02154-5
Kane, N., Sveinsson, S., Dempewolf, H., Yang, J. Y., Zhang, D., Engels, J. M., et al. (2012). Ultra-barcoding in cacao (Theobroma spp.; Malvaceae) using whole chloroplast genomes and nuclear ribosomal DNA. Am. J. Bot. 99, 320–329. doi: 10.3732/ajb.1100570
Katoh, K., and Standley, D. (2013). MAFFT multiple sequence alignment software version improvements in performance and usability. Mol. Biol. Evol. 30, 772–780. doi: 10.1093/molbev/mst010
Kearse, M., Moir, R., Wilson, A., Stoneshavas, S., Cheung, M., Sturrock, S., et al. (2012). Geneious Basic: an integrated and extendable desktop software platform for the organization and analysis of sequence data. Bioinformatics 28, 1647–1649. doi: 10.1093/bioinformatics/bts199
Kim, D. W., Yoo, W. G., Park, H. C., Yoo, H. S., and Lim, J. (2012). DNA barcoding of fish, insects, and shellfish in Korea. Genomics Inform. 10, 206–211. doi: 10.5808/GI.2012.10.3.206
Krawczyk, K., Nobis, M., Myszczyński, K., Klichowska, E., and Sawicki, J. (2018). Plastid super-barcodes as a tool for species discrimination in feather grasses (Poaceae: stipa). Sci. Rep. 8:1924. doi: 10.1038/s41598-018-20399-w
Kress, W. J., Wurdack, K. J., Zimmer, E. A., Weigt, L. A., and Janzen, D. H. (2005). Use of DNA barcodes to identify flowering plants. Proc. Natl. Acad. Sci. U.S.A. 102, 8369–8374. doi: 10.1073/pnas.0503123102
Kreuzer, M., Howard, C., Adhikari, B., Pendry, C. A., and Hawkins, J. A. (2019). Phylogenomic approaches to DNA barcoding of herbal medicines: developing clade-specific diagnostic characters for Berberis. Front. Plant Sci. 10:586. doi: 10.3389/fpls.2019.00586
Kumar, S., Stecher, G., and Tamura, K. (2016). MEGA7: molecular evolutionary genetics analysis version 7.0 for bigger datasets. Mol. Biol. Evol. 33, 1870–1874. doi: 10.1093/molbev/msw054
Langmead, B., and Salzberg, S. L. (2012). Fast gapped-read alignment with Bowtie 2. Nat. Methods 9, 357–360. doi: 10.1038/nmeth.1923
Li, D. Z., Gao, L. M., Li, H. T., Wang, H., Ge, X. J., Liu, J. Q., et al. (2011). Comparative analysis of a large dataset indicates that internal transcribed spacer (ITS) should be incorporated into the core barcode for seed plants. Proc. Natl. Acad. Sci. U.S.A. 108, 19641–19646. doi: 10.1073/pnas.1104551108
Li, H. T., Yi, T. S., Gao, L. M., Ma, P. F., Zhang, T., Yang, J. B., et al. (2019). Origin of angiosperms and the puzzle of the Jurassic gap. Nat. Plants 5, 461–470. doi: 10.1038/s41477-019-0421-0
Li, J. J., Wen, S. X., Zhang, Q. S., Wang, F. B., Zhang, B. X., and Li, B. Y. (1979). A discussion on the period, amplitude and type of the uplift of the Qinghai-Xizang Plateau. Sci. China Ser. A 22, 1314–1328.
Li, X. W., Yang, Y., Henry, R. J., Rossetto, M., Wang, Y. T., and Chen, S. L. (2015). Plant DNA barcoding: from gene to genome. Biol. Rev. Cambridge Philos. Soc. 90, 157–166. doi: 10.1111/brv.12104
Li, Y., Zhang, Z. R., Yang, J. B., and Lv, G. H. (2018). Complete chloroplast genome of seven Fritillaria species, variable DNA markers identification and phylogenetic relationships within the genus. PLoS One 13:e0194613. doi: 10.1371/journal.pone.0194613
Liu, J., Milne, R. I., MÖller, M., Zhu, G. F., Ye, L. J., Luo, Y. H., et al. (2018). Integrating a comprehensive DNA barcode reference library with a global map of yews (Taxus L.) for forensic identification. Mol. Ecol. Resour. 18, 1115–1131. doi: 10.1111/1755-0998.12903
Liu, J., Yan, H. F., and Ge, X. J. (2016). The use of DNA barcoding on recently diverged species in the genus Gentiana (Gentianaceae) in China. PLoS One 11:e0153008. doi: 10.1371/journal.pone.0153008
Liu, Z. F., Ci, X. Q., Li, L., Li, H. W., Conran, J. G., and Li, J. (2017). DNA barcoding evaluation and implications for phylogenetic relationships in Lauraceae from China. PLoS One 12:e0175788. doi: 10.1371/journal.pone.0175788
Lohse, M., Drechsel, O., Kahlau, S., and Bock, R. (2013). OrganellarGenomeDRAW-a suite of tools for generating physical maps of plastid and mitochondrial genomes and visualizing expression data sets. Nucleic Acids Res. 41, W575–W581. doi: 10.1093/nar/gkt289
Luo, Y. B., and Chen, S. C. (1996a). A revision of Fritillaria L. (Liliaceae) in the hengduan mountains and adjacent regions, China (1)-A study of Fritillaria cirrhosa D. Don and its related spcies. Acta Phytotaxona Sin. 34, 304–312.
Luo, Y. B., and Chen, S. C. (1996b). A revision of Fritillaria L. (Liliaceae) in the hengduan mountains and adjacent regions, China (2). Acta Phytotaxona Sin. 34, 547–553.
Nie, Y., Foster, C. S. P., Zhu, T. Q., Yao, R., Duchêne, D. A., Ho, S. Y. W., et al. (2019). Accounting for uncertainty in the evolutionary timescale of green plants through clock-partitioning and fossil calibration strategies. Syst. Biol. 69, 1–16. doi: 10.1093/sysbio/syz032
Nock, C. J., Waters, D. L., Edwards, M. A., Bowen, S. G., Rice, N., Cordeiro, G. M., et al. (2011). Chloroplast genome sequences from total DNA for plant identification. Plant. Biotechnol. J. 9, 328–333. doi: 10.1111/j.1467-7652.2010.00558.x
Park, I., Kim, W. J., Yeo, S. M., Choi, G., Kang, Y. M., Piao, R. Z., et al. (2017). The complete chloroplast genome sequences of Fritillaria ussuriensis Maxim. and Fritillaria cirrhosa D. Don, and comparative analysis with other Fritillaria species. Molecules 22:982. doi: 10.3390/molecules22060982
Parveen, I., Singh, H. K., Raghuvanshi, S., Pradhan, U. C., and Babbar, S. B. (2012). DNA barcoding of endangered Indian Paphiopedilum species. Mol. Ecol. Resour. 12, 82–90. doi: 10.1111/j.1755-0998.2011.03071.x
Pečnikar, Z. F., and Buzan, E. V. (2013). 20 years since the introduction of DNA barcoding: from theory to application. J. Appl. Genet. 55, 43–52. doi: 10.1007/s13353-013-0180-y
Rambaut, A., Drummond, A. J., Xie, D., Baele, G., and Suchard, M. A. (2018). Posterior summarisation in Bayesian phylogenetics using Tracer 1.7. Syst. Biol. 67, 901–904. doi: 10.1093/sysbio/syy032
Ronquist, F., Teslenko, M., Van, D. M. P., Ayres, D. L., Darling, A., Höhna, S., et al. (2012). MrBayes 3.2: efficient Bayesian phylogenetic inference and model choice across a large model space. Syst. Biol. 61, 539–542. doi: 10.1093/sysbio/sys029
Rønsted, N., Law, S., Thornton, H., Fay, M. F., and Chase, M. W. (2005). Molecular phylogenetic evidence for the monophyly of Fritillaria and Lilium (Liliaceae; Liliales) and the infrageneric classification of Fritillaria. Mol. Phylog. Evol. 35, 509–527. doi: 10.1016/j.ympev.2004.12.023
Ross, H. A., Murugan, S., and Li, W. L. (2008). Testing the reliability of genetic methods of species identification via simulation. Syst. Biol. 57, 216–230. doi: 10.1080/10635150802032990
Royden, L. H., Burchfiel, B. C., and Van der Hilst, R. D. (2008). The geological evolution of the Tibetan Plateau. Science 321, 1054–1058. doi: 10.1126/science.1155371
Rozas, J., Ferrermata, A., Sánchezdelbarrio, J. C., Guiraorico, S., Librado, P., Ramosonsins, S. E., et al. (2017). DnaSP 6: DNA sequence polymorphism analysis of large data sets. Mol. Biol. Evol. 34, 3299–3302. doi: 10.1093/molbev/msx248
Ruhsam, M., Rai, H. S., Mathews, S., Ross, T. G., Graham, S. W., Raubeson, L. A., et al. (2015). Does complete plastid genome sequencing improve species discrimination and phylogenetic resolution in Araucaria? Mol. Ecol. Resour. 15, 1067–1078. doi: 10.1111/1755-0998.12375
Scarcelli, N., Barnaud, A., Eiserhardt, W., Treier, U. A., Seveno, M., D’Anfray, A., et al. (2011). A set of 100 chloroplast DNA primer pairs to study population genetics and phylogeny in Monocotyledons. PLoS One 6:e19954. doi: 10.1371/journal.pone.0019954
Schoch, C. L., Seifert, K. A., Huhndorf, S., Robert, V., and Spouge, J. L. (2012). Nuclear ribosomal internal transcribed spacer (ITS) region as a universal DNA barcode marker for Fungi. Proc. Natl. Acad. Sci. U.S.A. 109, 6241–6246. doi: 10.1073/pnas.1117018109
Sembiring, A., Pertiwi, N. P. D., Mahardini, A., Wulandari, R., and Mahardika, G. N. (2015). DNA Barcoding reveals targeted fisheries for endangered sharks in Indonesia. Fish. Res. 164, 130–134. doi: 10.1016/j.fishres.2014.11.003
Stamatakis, A. (2014). RAxML version 8: a tool for phylogenetic analysis and post-analysis of large phylogenies. Bioinformatics 30, 1312–1313. doi: 10.1093/bioinformatics/btu033
Suchard, M. A., Lemey, P., Baele, G., Ayres, D. L., Drummond, A. J., and Rambaut, A. (2018). Bayesian phylogenetic and phylodynamic data integration using BEAST 1.10. Virus Evol. 4:vey016. doi: 10.1093/ve/vey016
Swofford, D. L. (2002). PAUP*: Phylogenetic Analysis Using Parsimony (and other methods), version 4.0. Sunderland, MA: Sinauer Associates.
Tontifilippini, J., Nevill, P. G., Dixon, K., and Small, I. (2017). What can we do with 1000 plastid genomes? Plant J. 90, 808–818. doi: 10.1111/tpj.13491
Wick, R. R., Schultz, M. B., Zobel, J., and Holt, K. E. (2015). Bandage: interactive visualization of de novo genome assemblies. Bioinformatics 31, 3350–3352. doi: 10.1093/bioinformatics/btv383
Wu, F. H., Chan, M. T., Liao, D. C., Hsu, C. T., Lee, Y. W., Daniell, H., et al. (2010). Complete chloroplast genome of Oncidium Gower Ramsey and evaluation of molecular markers for identification and breeding in Oncidiinae. BMC Plant Biol. 10:68. doi: 10.1186/1471-2229-10-68
Wu, L., Wu, M. L., Cui, N., Xiang, L., Li, Y., Li, X. W., et al. (2021). Plant super-barcode: a case study on genome-based identification for closely related species of Fritillaria. Chin. Med. 16:52. doi: 10.1186/s13020-021-00460-z
Wu, X. B., Duan, L. Z., Chen, Q., and Zhang, D. Q. (2020). Genetic diversity, population structure, and evolutionary relationships within a taxonomically complex group revealed by AFLP markers: a case study on Fritillaria cirrhosa D. Don and closely related species. Glob. Ecol. Conserv. 24:e01323. doi: 10.1016/j.gecco.2020.e01323
Wyler, S. C., and Naciri, Y. (2016). Evolutionary histories determine DNA barcoding success in vascular plants: seven case studies using intraspecific broad sampling of closely related species. BMC Evol. Biol. 16:103. doi: 10.1186/s12862-016-0678-0
Xiao, P. G., Jiang, Y., Li, P., Luo, Y. B., and Liu, Y. (2007). The botanical origin and pharmacophylogenetic treatment of Chinese materia medica Beimu. Acta Phytotaxon. Sin. 45, 473–487. doi: 10.1360/aps06113
Xie, Q. L., Zhang, H. B., Yan, F., Yan, C. X., Wei, S. G., Lai, J. H., et al. (2019). Morphology and molecular identification of twelve commercial varieties of Kiwifruit. Molecules 24:888. doi: 10.3390/molecules24050888
Xue, J. H., Dong, W. P., Cheng, T., and Zhou, S. L. (2012). Nelumbonaceae: systematic position and species diversification revealed by the complete chloroplast genome. J. Syst. Evol. 50, 477–487. doi: 10.1111/j.1759-6831.2012.00224.x
Yan, L. J., Liu, J., Möller, M., Zhang, L., Zhang, X. M., Li, D. Z., et al. (2015). DNA barcoding of Rhododendron (Ericaceae), the largest Chinese plant genus in biodiversity hotspots of the Himalaya-Hengduan Mountains. Mol. Ecol. Resour. 15, 932–944. doi: 10.1111/1755-0998.12353
Yang, J., Feng, L., Yue, M., He, Y. L., Zhao, G. F., and Li, Z. H. (2019). Species delimitation and interspecific relationships of the endangered herb genus Notopterygium inferred from multilocus variations. Mol. Phylogenet. Evol. 133, 142–151. doi: 10.1016/j.ympev.2019.01.002
Yang, J. B., Li, D. Z., and Li, H. T. (2014). Highly effective sequencing whole chloroplast genomes of angiosperms by nine novel universal primer pairs. Mol. Ecol. Resour. 14, 1024–1031. doi: 10.1111/1755-0998.12251
Zhang, C. Y., Wang, F. Y., Yan, H. F., Hao, G., Hu, C. M., and Ge, X. J. (2011). Testing DNA barcoding in closely related groups of Lysimachia L. (Myrsinaceae). Mol. Ecol. Resour. 12, 98–108. doi: 10.1111/j.1755-0998.2011.03076.x
Zhang, D. Q., Mo, X. C., Xiang, J. Y., and Zhou, N. (2016). Molecular identification of original plants of Fritillariae cirrhosae bulbus, a tradtional chinese medicine (TCM) using plant dna barcoding. Afr. J. Traditional Complement. Alternat. Med. AJTCAM 13, 74–82. doi: 10.21010/ajtcam.v13i6.12
Zhang, J. Q., Meng, S. Y., Allen, G. A., Wen, J., and Rao, G. Y. (2014). Rapid radiation and dispersal out of the Qinghai-Tibetan Plateau of an alpine plant lineage Rhodiola (Crassulaceae). Mol. Phylogenet. Evol. 77, 147–158. doi: 10.1016/j.ympev.2014.04.013
Zhang, T., Huang, S. P., Song, S. M., Meng, Z., Yang, T. C., Wang, W. W., et al. (2021). Identification of evolutionary relationships and DNA markers in the medicinally important genus Fritillaria based on chloroplast genomics. PeerJ 9:e12612. doi: 10.7717/peerj.12612
Keywords: Fritillaria, chloroplast genomes, DNA barcoding, species discrimination, phylogenomic analysis, molecular dating
Citation: Chen Q, Hu H and Zhang D (2022) DNA Barcoding and Phylogenomic Analysis of the Genus Fritillaria in China Based on Complete Chloroplast Genomes. Front. Plant Sci. 13:764255. doi: 10.3389/fpls.2022.764255
Received: 25 August 2021; Accepted: 21 January 2022;
Published: 25 February 2022.
Edited by:
SeonJoo Park, Yeungnam University, South KoreaReviewed by:
Sang-Tae Kim, Catholic University of Korea, South KoreaChun-Lei Xiang, Kunming Institute of Botany (CAS), China
Copyright © 2022 Chen, Hu and Zhang. This is an open-access article distributed under the terms of the Creative Commons Attribution License (CC BY). The use, distribution or reproduction in other forums is permitted, provided the original author(s) and the copyright owner(s) are credited and that the original publication in this journal is cited, in accordance with accepted academic practice. No use, distribution or reproduction is permitted which does not comply with these terms.
*Correspondence: Dequan Zhang, emhhbmdkZXEyMDA4QDEyNi5jb20=