 Duong T. Nguyen
 Julie E. Hayes
 John Harris2,3†
 Tim Sutton
- 1School of Agriculture and Environment and Institute of Agriculture, The University of Western Australia, Crawley, WA, Australia
- 2South Australian Research and Development Institute, Adelaide, SA, Australia
- 3School of Agriculture, Food and Wine, University of Adelaide, Urrbrae, SA, Australia
Plant vigor is a complex trait for which the underlying molecular control mechanisms remain unclear. Vigorous plants tend to derive from larger seeds and have greater early canopy cover, often with bigger leaves. In this study, we delimited the size of a major vigor quantitative trait locus (QTL) on chickpea chromosome 4–104.4 kb, using recombinant association analysis in 15 different heterogeneous inbred families, derived from a Rupali/Genesis836 recombinant inbred line population. The phenotypic and molecular genetic analysis provided evidence for a role of the gene Ca4_TIFY4B, in determining leaf and seed size in chickpea. A non-synonymous single-nucleotide polymorphism (SNP) in the high-vigor parent was located inside the core motif TIFYCG, resulting in a residue change T[I/S]FYCG. Complexes formed by orthologs of Ca4_TIFY4B (PEAPOD in Arabidopsis), Novel Interactor of JAZ (CaNINJA), and other protein partners are reported to act as repressors regulating the transcription of downstream genes that control plant organ size. When tested in a yeast 2-hybrid (Y2H) assay, this residue change suppressed the interaction between Ca4_TIFY4B and CaNINJA. This is the first report of a naturally occurring variant of the TIFY family in plants. A robust gene-derived molecular marker is available for selection in chickpea for seed and plant organ size, i.e., key component traits of vigor.
Highlights
The transcriptional regulator Ca4_TIFY4B, which is found at the Ca4_Vqtl region in chickpea, is associated with the control of vigor-related traits including leaf and seed size.
Introduction
Chickpea is currently ranked as the second largest pulse produced worldwide after dry beans (FAOSTAT, 2019). Although widely recognized as a major grain legume, chickpea is still mainly cultivated in marginal areas that often experience a range of biotic and abiotic stresses including disease and weed competition, heat, drought, low temperatures, and salt contamination. Increasing pressure has been put on breeders to develop high-yielding varieties that are not only resistant/tolerant to stress but also resilient in the face of climate change. In cool, short-season environments, increasing vigor is a key priority of breeding programs to improve competitive ability during crop establishment and yield. Genetic studies in many different crops have mapped vigor-related loci and assessed their impact under a range of growing conditions including irrigated, drought, salt, and disease pressure (Collins et al., 1999; Graham et al., 2011; Platten et al., 2013; Sivasakthi et al., 2018; Taylor et al., 2019; Atieno et al., 2021; Nguyen et al., 2021). In chickpea, vigor has been reported to contribute either positively (Subbarao et al., 1995; Turner et al., 2001) or negatively (Zaman-Allah et al., 2011) to yield. This suggests that to maximize productivity, genetic tools are needed to enable the selection of a specific vigor profile that is matched to a target environment.
Recently, quantitative trait locus (QTL) mapping and association studies across multiple environments identified major genetic regions for vigor-related traits on chromosomes (Ca) 1, 3, and 4 in chickpea (Nguyen et al., 2021). The vigor QTL on Ca4 (Ca4_Vqtl) overlapped with a “hotspot” region of QTL previously reported for drought tolerance (Varshney et al., 2014; Jaganathan et al., 2015; Kale et al., 2015; Singh et al., 2016) and vigor (Sivasakthi et al., 2018). The overlapping QTL region also colocated with a region for seed size in both the ICC4958/ICC1882 (Varshney et al., 2014; Sivasakthi et al., 2018) and Rupali/Genesis836 recombinant inbred line (RIL) mapping populations (Atieno et al., 2021; Nguyen et al., 2021). A positive impact of seed size on vigor has been reported in both cereal and legume species, including wheat (Triticum aestivum L.) (Sloane, 1999; Zhao et al., 2019), rice (Oryza sativa L.) (Roy et al., 1996), maize (Zea mays L.) (Yusuf et al., 2014), barley (Hordeum vulgare L.) (Massimi, 2018), birdsfoot trefoil (Lotus corniculatus L.) and alfalfa (Medicago sativa L.) (Carleton and Cooper, 1972), chickpea (Cicer arietinum L.), lupin (Lupinus angustifolius L.) and pea (Pisum sativum L.) (Kamboozia, 1994), and soybean (Glycine max (L.) Merr.) (Fatichin et al., 2013). It is therefore plausible that Ca4_Vqtl contains a single causative factor with a pleiotropic effect on both vigor and seed size.
The Ca4_Vqtl region is estimated between 12.65 and 13.06 Mb of chromosome 4 (CDC Frontier Ref V2.6.3; Edwards, 2016; Ruperao, 2016) and contains 39 genes (Nguyen et al., 2021), making it difficult to prioritize candidates for further investigation and functional confirmation. Further fine mapping was necessary to prioritize candidates with roles in plant vigor. The objective of this study was to improve the resolution of the Ca4_Vqtl genomic region and identify candidate genes for vigor-related traits in chickpea. This was achieved using heterogeneous inbred families (HIFs) derived from selfed F4 RILs of Rupali/Genesis836, confirmed as heterozygous across the Ca4_Vqtl interval. High-depth sequence capture (Nguyen et al., 2021) was used to identify sequence variation. We identified a variant of the gene Ca4_TIFY4B in the high-vigor Rupali RIL parent, proposed to alter the regulation of seed size and other plant organs including leaves and roots and contribute to differences in plant vigor.
Materials and Methods
Fine Mapping Analysis of Ca4_Vqtl
Development of Heterogeneous Inbred Families for Fine Mapping
Three F4-derived RILs (RIL15, RIL50, and RIL89) from a Rupali/Genesis836 biparental mapping population (Atieno et al., 2021; Nguyen et al., 2021) were identified as heterozygous across the vigor QTL region Ca4_Vqtl (12.65–13.06 Mb, CDC Frontier Ref V2.6.3). These were selfed to develop fine-mapping families. Sixteen heterozygous F5 plants were bulked for seed and are hereafter referred to as F1 of the fine-mapping population. F2 fine-mapping population seedlings (3,363 individuals) were genotyped with two flanking markers (Ca4_12652558 and Ca4_13068179) to identify recombinants within the Ca4_Vqtl interval. Of these, 39 F2 recombinants were genotyped with further markers to delineate the recombination breakpoints, and were grown to matuity. Fifteen recombinants, each with at least 50 seeds, were selected as F2 HIFs. HIF progenies were genotyped and homozygotes were phenotyped to identify trait-marker associations for each family and to reduce the physical size of the Ca4_Vqtl interval.
Phenotyping
To investigate the impact of the Ca4_Vqtl on vigor-related traits and identify robust component traits for fine mapping, pairs of near-isogenic lines (NILs) contrasting across the Ca4_Vqtl region were developed from RIL15, RIL50, RIL89 (F5), and RIL161 (F4). Single plants (n = 6–14) for each NIL were grown in 25-cm diameter pots containing BioGro potting medium1 under natural light shade house conditions. At both 6 and 10 weeks after emergence, various measurements were made on each plant. These included Fractional Green Canopy Cover (FGCC) using the Canopeo application (Oklahoma State University, Stillwater, OK, United States),2 canopy height, main shoot length, branch length, total stem length, branching index (branch length/main stem length), number of branches, average branch length, leaf number, and internode length. At 13 weeks, FGCC and canopy height measures were again taken, as well as leaf size and petiole length. For leaf size, the fourth, fifth, and sixth youngest fully emerged leaves were excised from the main stem and laid flat on white paper. Images taken with a smartphone were analyzed for green leaf area using the Easy Leaf Area application and a 2 cm × 2 cm red-colored square placed on the same horizontal plane for calibration (Easlon and Bloom, 2014). Days to flowering (DTF) was recorded when observing the first opened flower. At maturity, total biomass (TBM), seed weight (SW), seed number, 100 SW (100SDW), and seed size for each plant were recorded. Seed size was measured as the two-dimensional (2D) area of 20 seeds photographed for each NIL, using the SeedCounter application (Komyshev et al., 2017).
For fine mapping, progenies of 15 HIFs were grown as single plants in pots (19.5 cm height × 14.9 cm diameter) during winter in 2020 (13 HIFs) and 2021 (2 HIFs) in a greenhouse at 20°C with natural lighting. The phenotypic data were collected for leaf size (using fourth, fifth, and sixth youngest fully emerged leaves) at 13 weeks, seed size, 100SDW, and seed number.
An additional phenotyping experiment was conducted in the greenhouse using four HIF-derived NIL pairs. Four plants were grown per pot (17.5 cm height × 19 cm diameter, filled with 3 kg BioGro potting medium), with 3 or 4 replicate pots per genotype. Measures of leaf size (using second and third youngest fully emerged leaves), FGCC, root dry weight, and shoot dry weight were collected at 4 weeks after sowing.
Genotyping
Single-nucleotide polymorphisms (SNPs) between Rupali and Genesis836 inside the region of 12.65–13.06 Mb were detected from the sequence capture data that were previously described by Nguyen et al. (2021). SNPs were used to design Kompetitive Allele-Specific PCR (KASP) genotyping assays using the SNPline PCR Genotyping System (LGC, Middlesex, United Kingdom). All materials were additionally genotyped with KASP markers linked to flowering loci on Ca5 (CaELF3a; Ridge et al., 2017) and Ca3, and a vigor QTL on Ca3, to ensure these were fixed within each HIF. These loci are described by Atieno et al. (2021) and Nguyen et al. (2021). Primer sequences are detailed in Supplementary File 1.
Statistical Analysis
The probability of association between traits and markers for each HIF or NIL pair was investigated using Student’s t-tests (P < 0.05) (Kalpić et al., 2014). The correlation analysis was performed in Excel.
Yeast 2-Hybrid Assay
Cloning was conducted using Gateway® Technology (Thermo Fisher Scientific, Waltham, MA, United States). The full-length coding sequences of Ca4_TIFY4B (TIFY 4B-like isoform X1) and CaNINJA (Novel Interactor of JAZ) were PCR-amplified (for primers, refer to Supplementary File 1) using cDNA isolated from the whole shoot sampled at 2 weeks of Rupali and Genesis836. PCR products were directionally cloned into the entry vector pENTR™/D-TOPO® using One Shot® TOP10 competent Escherichia coli. Inserts were confirmed by the sequencing of extracted plasmid DNA from multiple independent clones.
The yeast 2-hybrid (Y2H) analysis using the GAL4-ProQuest™ Two-Hybrid System was performed as described (Myhrstad, 2011; Cuéllar et al., 2013; Erffelinck et al., 2018). Entry vectors carrying the Rupali allele of Ca4_TIFY4B (TIFY4B_R), the Genesis836 allele of Ca4_TIFY4B (TIFY4B_G), and CaNINJA were site-specifically recombined with two different destination vectors to generate both bait (pDEST32™, containing DNA-binding domain GAL4-DBD) and prey (pDEST22™, containing activation domain GAL4-AD) constructs for each insert. The Saccharomyces cerevisiae MaV203 yeast strain, containing GAL4-inducible reporter genes URA3, HIS3, and lacZ, was cotransformed with bait and prey constructs using a polyethylene glycol (PEG)/lithium acetate/single-stranded carrier DNA method (Gietz and Schiestl, 2007). Transformants were selected on synthetic complete (SC) medium lacking leucine (-Leu) and tryptophan (-Trp).
Transformants with bait Ca4_TIFY4B and prey CaNINJA, as well as with bait CaNINJA and prey Ca4_TIFY4B, were characterized separately to examine two-hybrid interaction between the two proteins in both directions. The experimental and control interactions are listed in Supplementary Table 1. Colonies were initially patched onto an SC-Leu-Trp master plate before replica-plating onto phenotyping plates: (1) SC-Leu-Trp-Ura to test URA3 activation; (2) SC-Leu-Trp-His + 3-amino-1,2,4-triazole (3-AT) to test HIS3 activation; and (3) YPAD containing a filter for X-gal assay to test lacZ reporter activation.
An initial experiment to determine the appropriate concentration of the HIS3-inhibitor 3-AT used for the characterization of the activation of HIS3 was performed by testing bait self-activation on SC-Leu-Trp-His supplemented with 0–100 mM 3-AT.
Gene Expression Analysis
Gene expression analyses were conducted for Ca4_TIFY4B and selected putative downstream-regulated genes: Ca11004 (GRF-Interacting Factor1; CaGIF1), Ca27602 (GRF-Interacting Factor1-like; CaGIF1L), Ca04724 (Growth Regulating Factor4; CaGRF4), and Ca16785 (Growth Regulating Factor5-like; CaGRF5L). Whole roots and shoots at 9 days after sowing (days after sowing (DAS), n = 4) and youngest fully emerged leaves at 7 weeks (n = 3) were harvested for a Rupali/Genesis836 RIL50-derived pair of NILs (50.7) and snap-frozen in liquid nitrogen. The immature seed was sampled from an additional NIL pair derived from HIF 50.4.172 (n = 4). Frozen tissues were ground to a powder, and RNA was extracted from each sample using a Spectrum™ Plant Total RNA Kit (Sigma–Aldrich) with On-Column DNase I digestion. RNA quality and quantity were assessed using a NanoDrop spectrophotometer (NanoDrop Technologies Inc., Santa Clara, CA, United States). A 1 μg of each extracted RNA sample was used for cDNA synthesis using SuperScript III Reverse Transcriptase (Invitrogen, Carlsbad, CA, United States).
Quantitative real-time PCR (qRT-PCR) was performed in a Bio-Rad CFX Real-Time PCR System following the SsoAdvanced™ Universal SYBR® Green Supermix protocol.3 Three technical replicates of each biological replicate were included. The transcript levels of each gene were normalized against three internal control genes, namely, Ca31016 (Elongation factor 1-alpha; EF1-a), Ca19204 (Glyceraldehyde 3-phosphate dehydrogenase, cytosolic-like; GAPDH), and Ca31038 (Glucose-6-phosphate 1-dehydrogenase; G6PD) (Reddy et al., 2016; Amalraj, 2019; for primers, refer to Supplementary File 1). An absolute quantification method was employed to calculate the copy number using a standard curve derived from a set of standards containing 102–107 copies of the template. Raw data were analyzed using CFX Maestro Software version 2.2 (a suite of tools from CFX Real-Time PCR Systems).
Identification and Structural Analysis of the Chickpea TIFY Gene Family
Fourteen sequences annotated as TIFY genes in chickpea (CDC Frontier Ref V2.6.3) and 31 other sequences (including isoforms) of the chickpea TIFY family (CDC Frontier Ref V1.0; Varshney et al., 2013) extracted from protein family PF06200 of the Pfam database (Mistry et al., 2021) were blasted against the CDC Frontier Ref V2.6.3 assembly using the TBLASTN algorithm (E-value < 0.001) and protein-specific parameter BLOcks SUbstitution Matrix (BLOSUM62, Tong, 2013). All obtained protein sequences were subsequently searched for non-redundant hits and were individually scanned for the presence of constitutional motifs of the TIFY gene family using Pfam (Mistry et al., 2021) and HMMER (Potter et al., 2018). The identified chickpea TIFY genes were named according to their homology with Arabidopsis.
Phylogenetic trees were created via the Constraint-based Multiple Alignment Tool (COBALT; Papadopoulos and Agarwala, 2007) by adapting neighbor-joining (Saitou and Nei, 1987) and using full-length amino acid sequences (Supplementary File 2) of Ca4_TIFY4B and its homologs among various species. Multiple Expectation maximization for Motif Elicitation (MEME; Bailey et al., 2009) was used to create a block diagram of motifs for the orthologs of Ca4_TIFY4B. A search on the MEME suite was executed to identify distinctive motifs with the following parameters: (1) width of optimum motif ≥6 and ≤50; (2) maximum number of most significant motifs to identify = 3.
Results
Fine Mapping of Ca4_Vqtl
To identify robust component traits for fine mapping, a phenotypic profiling experiment for a range of vigor-related traits was performed using six Ca4_Vqtl Rupali/Genesis836 RIL-derived NIL pairs grown under shade house conditions (Supplementary File 3). Among the studied traits, leaf size, seed number, seed size, and 100SDW showed complete statistically significant segregation across all NIL pairs. Other traits, including subjective and objective (FGCC) measures of whole plant vigor, did not show clear differences between genotypes (Supplementary File 3). Leaf size, seed number, seed size, and 100SDW traits were selected for the fine-mapping analysis of 15 HIFs under glasshouse conditions: 11 HIFs segregated significantly for each trait (Supplementary Table 2). Leaf size, seed size, and 100SDW were significantly positively correlated with each other (r = 0.66 to 0.87, P < 0.01) but were negatively correlated with seed number (r = −0.42 to −0.75, P < 0.01).
To further investigate component traits associated with Ca4_Vqtl, four HIF-derived NIL pairs were grown under greenhouse conditions and harvested after 4 weeks of growth. Significant differences for FGCC, leaf size, and root and above-ground biomass at harvest were observed in all NIL pairs contrasting for Ca4_Vqtl (Figure 1). The observation that FGCC was significantly different between contrasting NIL pairs in this experiment but not in shade house conditions suggests that the expression of some vigor-related traits is influenced by the growing environment. Plants carrying the Rupali Ca4_Vqtl allele had more canopy cover (22.15% increase in FGCC), larger leaves (24.57% increase), and greater root and shoot dry weights (increases of 29.12 and 25.65%, respectively) compared to plants carrying the Genesis836 allele (Supplementary File 4). Representative images of plant organ size differences observed across the NIL phenotyping experiments are illustrated in Figure 2.
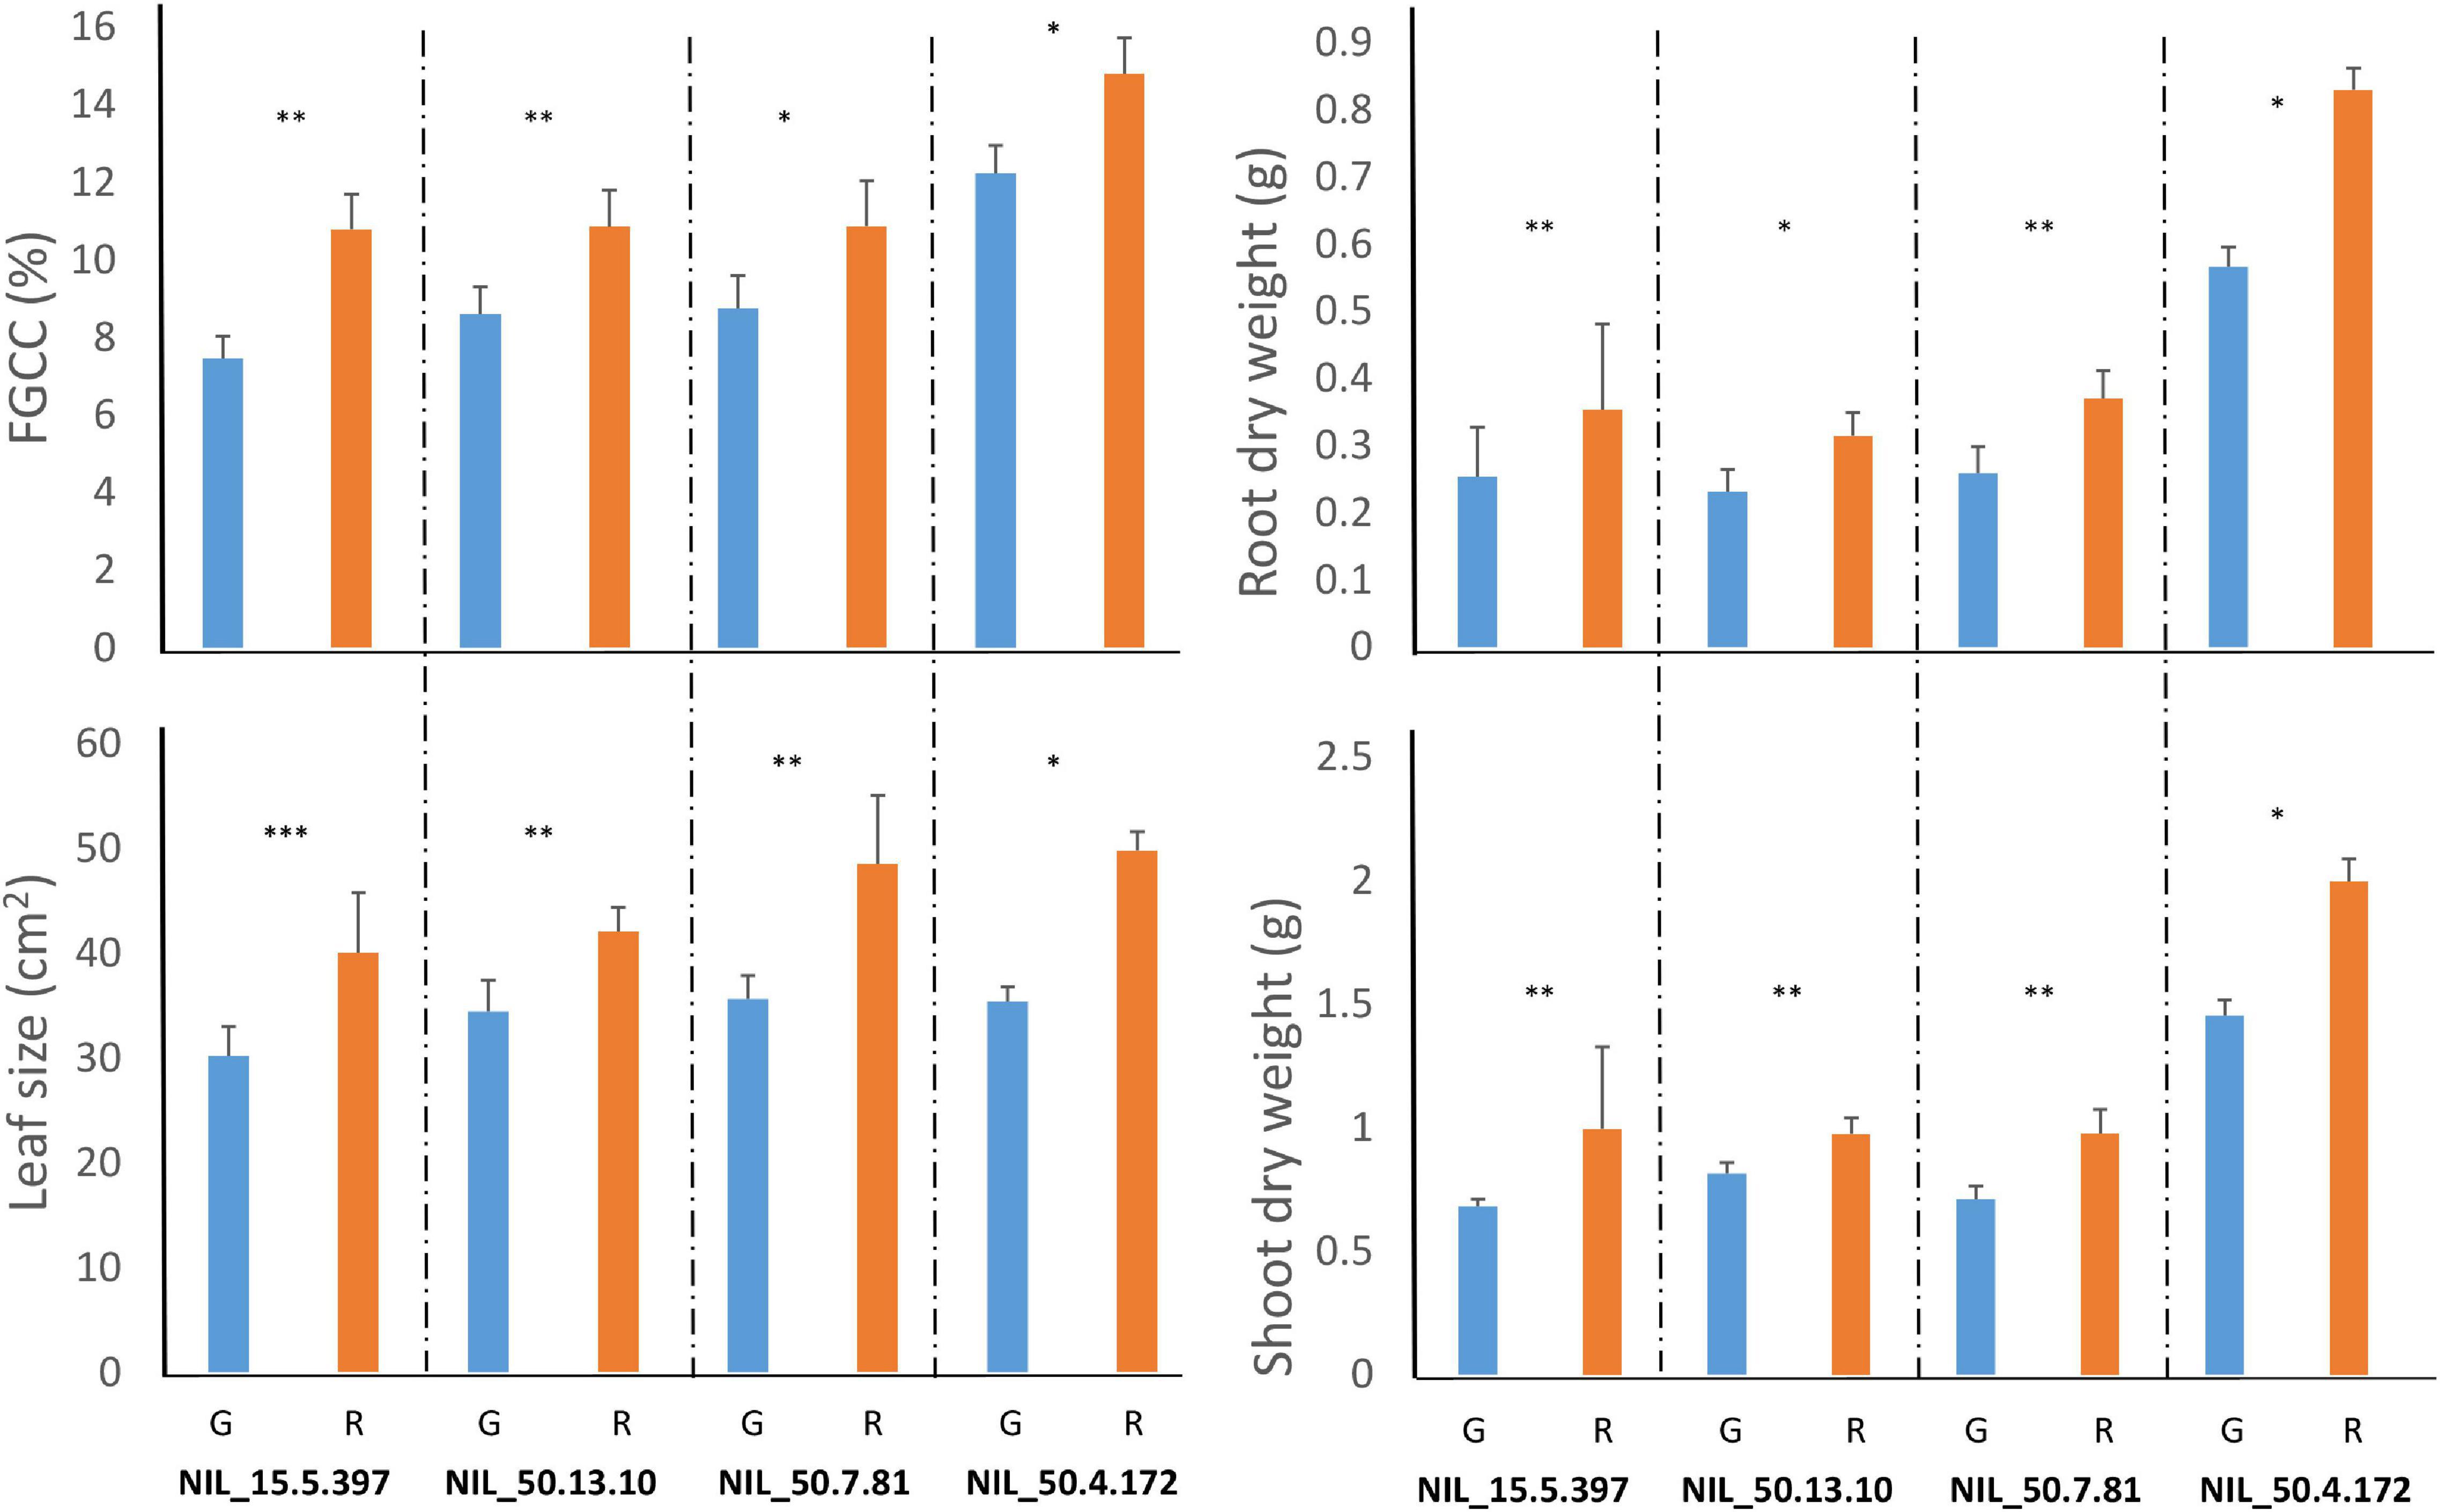
Figure 1. Phenotypic analysis in four heterogeneous inbred family (HIF)-derived near-isogenic line (NIL) pairs harvested after 4 weeks of growth in a greenhouse. G, Genesis836 allele and R, Rupali allele at Ca4_Vqtl. FGCC, Fractional Green Canopy Cover (%) using imaging analysis with the Canopeo application (Oklahoma State University, Stillwater, OK, United States; https://canopeoapp.com/). Student’s t-test was used to identify significant differences between lines from each NIL pair (n = 4). Student’s t-test significance codes: *P < 0.05, **P < 0.01, and ***P < 0.001.
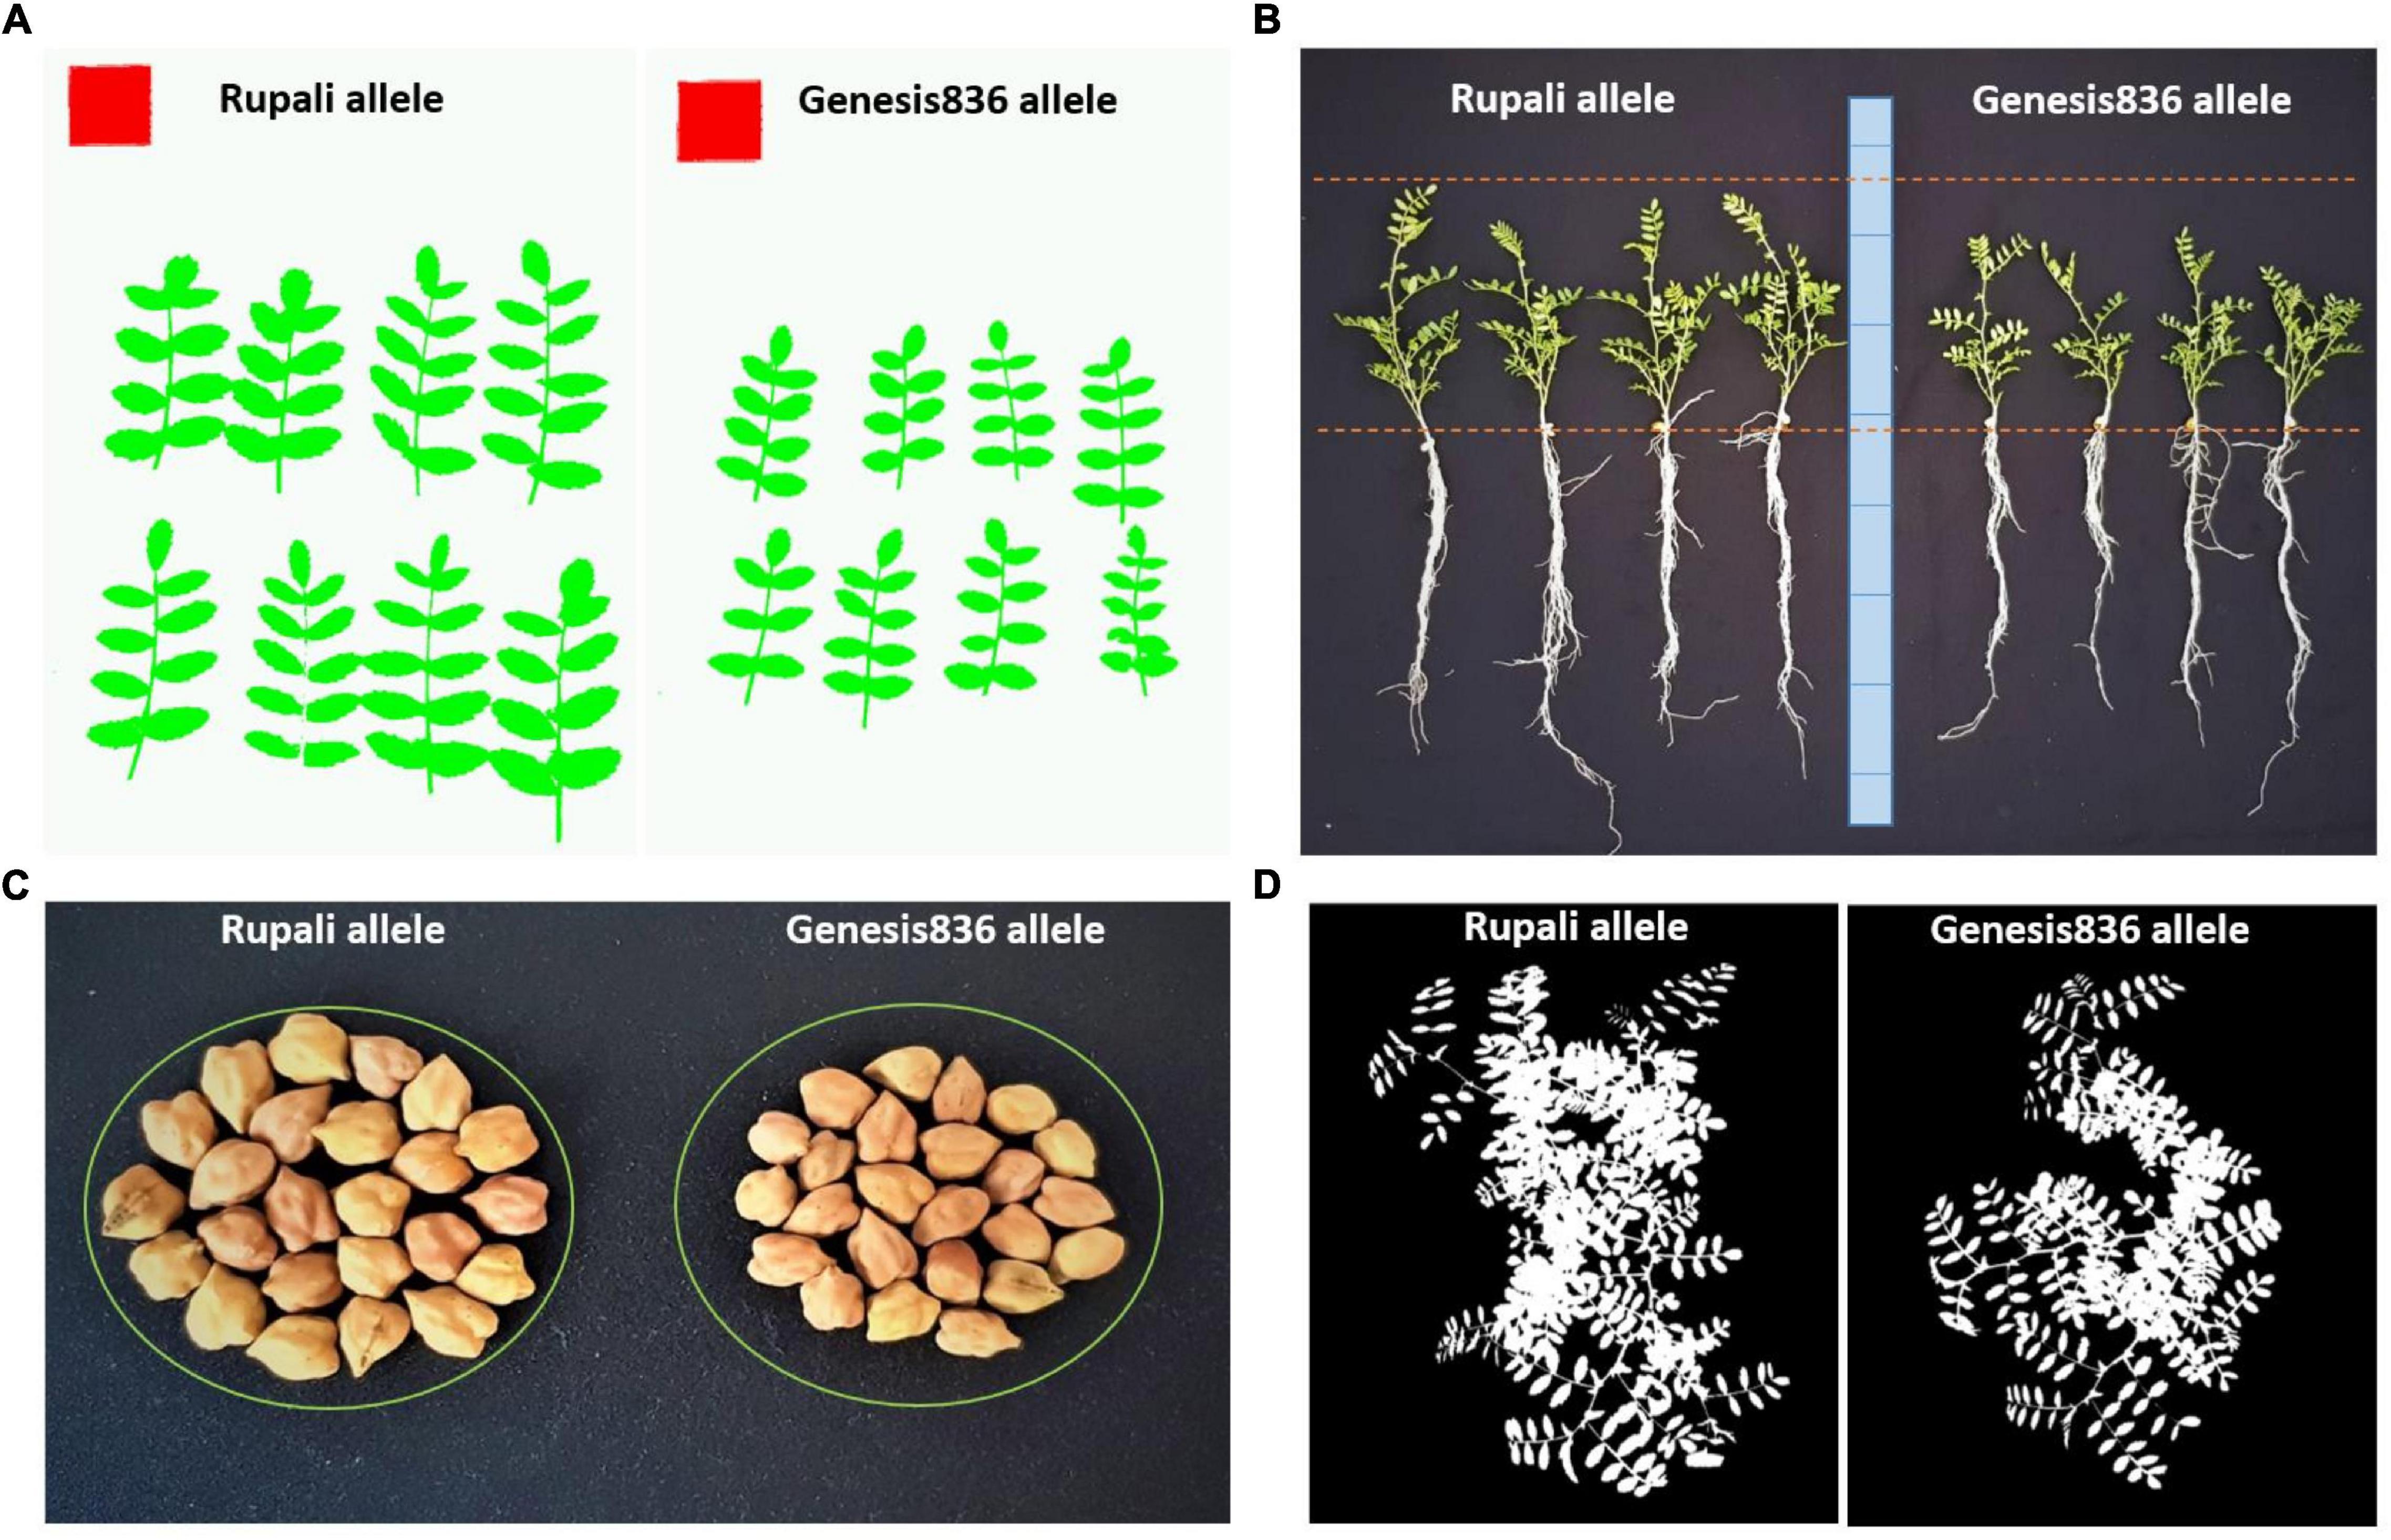
Figure 2. Representative images showing differences in panel (A) leaf size, (B) biomass, (C) seed size, and (D) canopy size for plants carrying the Rupali or Genesis836 Ca4_Vqtl allele (NIL_50.7.81). Leaf images were taken using the Easy Leaf Area app (Easlon and Bloom, 2014), and canopy images were taken using the Canopeo application (Oklahoma State University, Stillwater, OK, United States; https://canopeoapp.com/).
Recombination events across the Ca4_Vqtl (12.65–13.06 Mb) were identified using 10 KASP markers specific to SNPs identified between Rupali and Genesis836 across the region (Figure 3). Association analysis using HIF phenotypic and genotypic data demonstrated that the genomic interval between KASP markers Ca4_12874428 and Ca4_12978829 was consistently linked to phenotype (Figure 3). This interval spans 104.4 kb and contains 10 annotated genes according to CDC Frontier Ref V2.6.3 (Supplementary Table 3). These 10 genes were examined for putative association with vigor and component traits. To investigate if the difference in vigor contributed by the region was related to transcript dosage levels, the differential expression between the second youngest fully expanded leaves of 20-day-old plants of Genesis836 and Rupali was examined using previously acquired data (Khan, 2016; NCBI Accession PRJNA798198; Supplementary Figure 1). No significant difference in expression for the 10 genes located within the critical 104.4 kb Ca4_Vqtl region was observed.
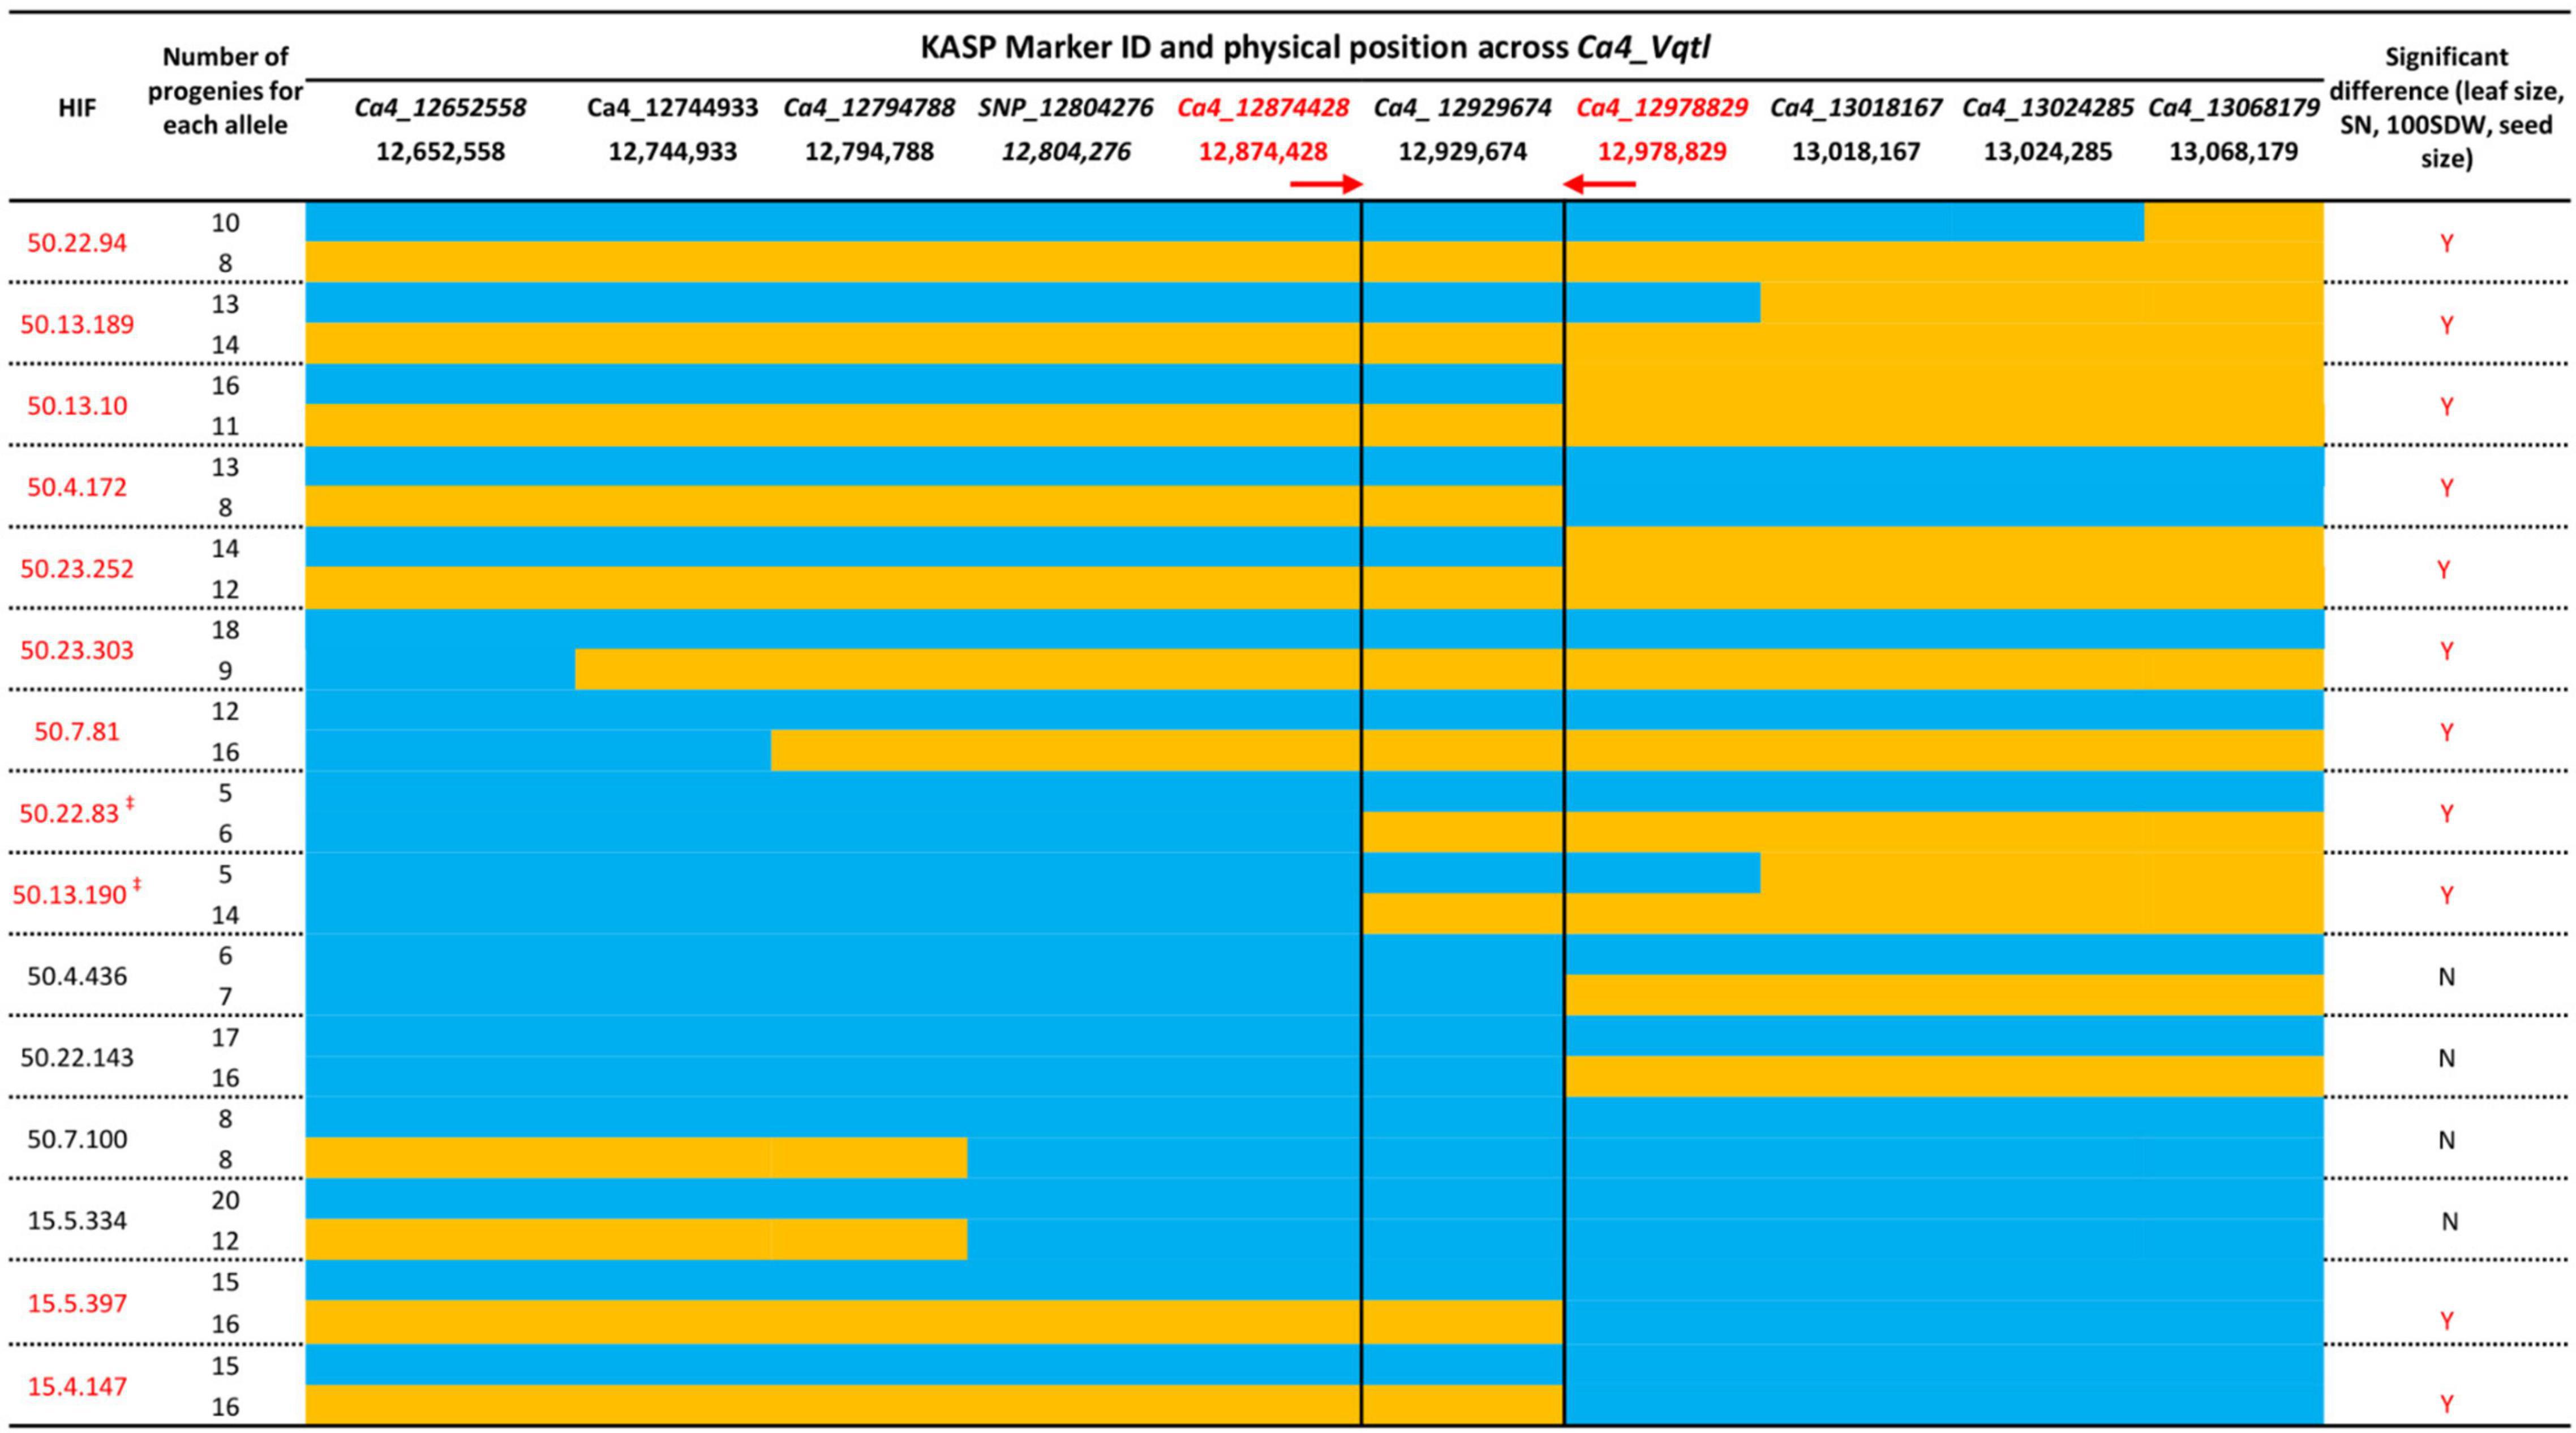
Figure 3. Fine-mapping analysis of Ca4_Vqtl in Rupali/Genesis836 recombinant families. Fifteen HIFs with recombination within Ca4_Vqtl were phenotyped in greenhouse conditions in 2020 and 2021. Ten Kompetitive Allele-Specific PCR (KASP)-single-nucleotide polymorphism (SNP) markers were used to genotype and identify recombinant breakpoints. Orange color indicates Rupali (R) allele, while blue color indicates Genesis836 (G) allele. Red text highlights HIFs where significant differences were observed between allelic classes for leaf size, seed number (SN), average weight of 100 seed weight (100SDW), and seed size by Student’s t-test (P < 0.05). Red arrows show the reduced interval between markers (in red) Ca4_12874428 and Ca4_12978829 (104.4 kb). (‡) Indicate lines phenotyped in 2021 under similar growing condition to 2020. The phenotyping data used for fine mapping is presented in Supplementary Table 2.
To determine whether the vigor effect at the Ca4_Vqtl locus is the result of sequence difference, we interrogated previously acquired sequence capture data for the RIL parents Rupali and Genesis836, which spanned genomic sequence at an average read depth of 100× across the broader Ca4_Vqtl region (Nguyen et al., 2021). SNPs associated with four genes were identified: SNP_12881281 in the intron of Ca11857 (Aldo/keto reductase family oxidoreductase); SNP_12903671 in the promoter of Ca11871 (Heat shock transcription factor A3); SNP_12922166 in the intron of Ca11865 (1,2-dihydroxy-3-keto-5-methylthiopentene dioxygenase); and SNP_12929674 in the exon of Ca11869 (TIFY4B-like isoform X1; Ca4_TIFY4B). SNP_12929674 was the only exonic SNP identified in coding sequences.
The exonic SNP_12929674 was previously used to validate the presence of Ca4_Vqtl in three different chickpea diversity panels (Nguyen et al., 2021), where it was significantly associated with both vigor and seed size across the panels (P < 0.001). Further investigation of SNP_12929674 in Ca4_TIFY4B showed that it is non-synonymous and results in a non-conservative amino acid substitution between isoleucine (I) and serine (S) (Pechmann and Frydman, 2014). Ca4_TIFY4B belongs to a family of transcription factors known as TIFY, and it is orthologous to PEAPOD (PPD1/PPD2) in Arabidopsis thaliana (White, 2006, 2017; Liu et al., 2020) and Big Seed 1 (BS1) in Medicago truncatula (Ge et al., 2016), which control organ size and shape. Based on the accumulated evidence, Ca4_TIFY4B was a strong candidate at the delineated Ca4_Vqtl.
TIFY Gene Family in Chickpea
To identify any other paralogs of Ca4_TIFY4B and further explore the TIFY gene family in chickpea, protein BLASTs of the chickpea genome assembly (CDC Frontier Ref V2.6.3) and HMM searches identified eighteen CaTIFY genes (Table 1). The TIFY genes were named according to their similarity with Arabidopsis sequences, and their protein sequences are provided in Supplementary File 2. The TIFY gene family contains the core motif TIF[F/Y]XG and can be classified into four subfamilies, namely, TIFY, JAZ, ZML, and PPD, depending on whether they contain additional domains/motifs (Vanholme et al., 2007; Bai et al., 2011). Proteins with only the TIFY (PF06200) domain are classified as the TIFY subfamily (Vanholme et al., 2007); proteins with both the TIFY and jasmonate ZIM domains (Jas, PF09425) are classified as the JAZ subfamily (Staswick, 2008); proteins containing TIFY, PPD domains, and a truncated Jas domain are classified as the PPD subfamily (White, 2006); and proteins containing the TIFY domain and the CCT (PF06203) and/or ZML/GATA (PF00320) domain are classified as the ZML subfamily. Among the 18 CaTIFY genes, 10 belong to the JAZ subfamily (Table 1). Of these, nine JAZ were previously reported by Singh et al. (2015). Two CaTIFY genes, namely, Ca20678 and Ca07271, belong to the TIFY subfamily. Five other CaTIFY genes, namely, Ca05650, Ca21020, Ca21022, Ca02171, and Ca29422, are grouped into the ZML subfamily. Ca4_TIFY4B (Ca11869; Table 1), which carries PPD, TIFY, and Jas domains, is the only CaTIFY gene encoding for a PPD protein in chickpea.
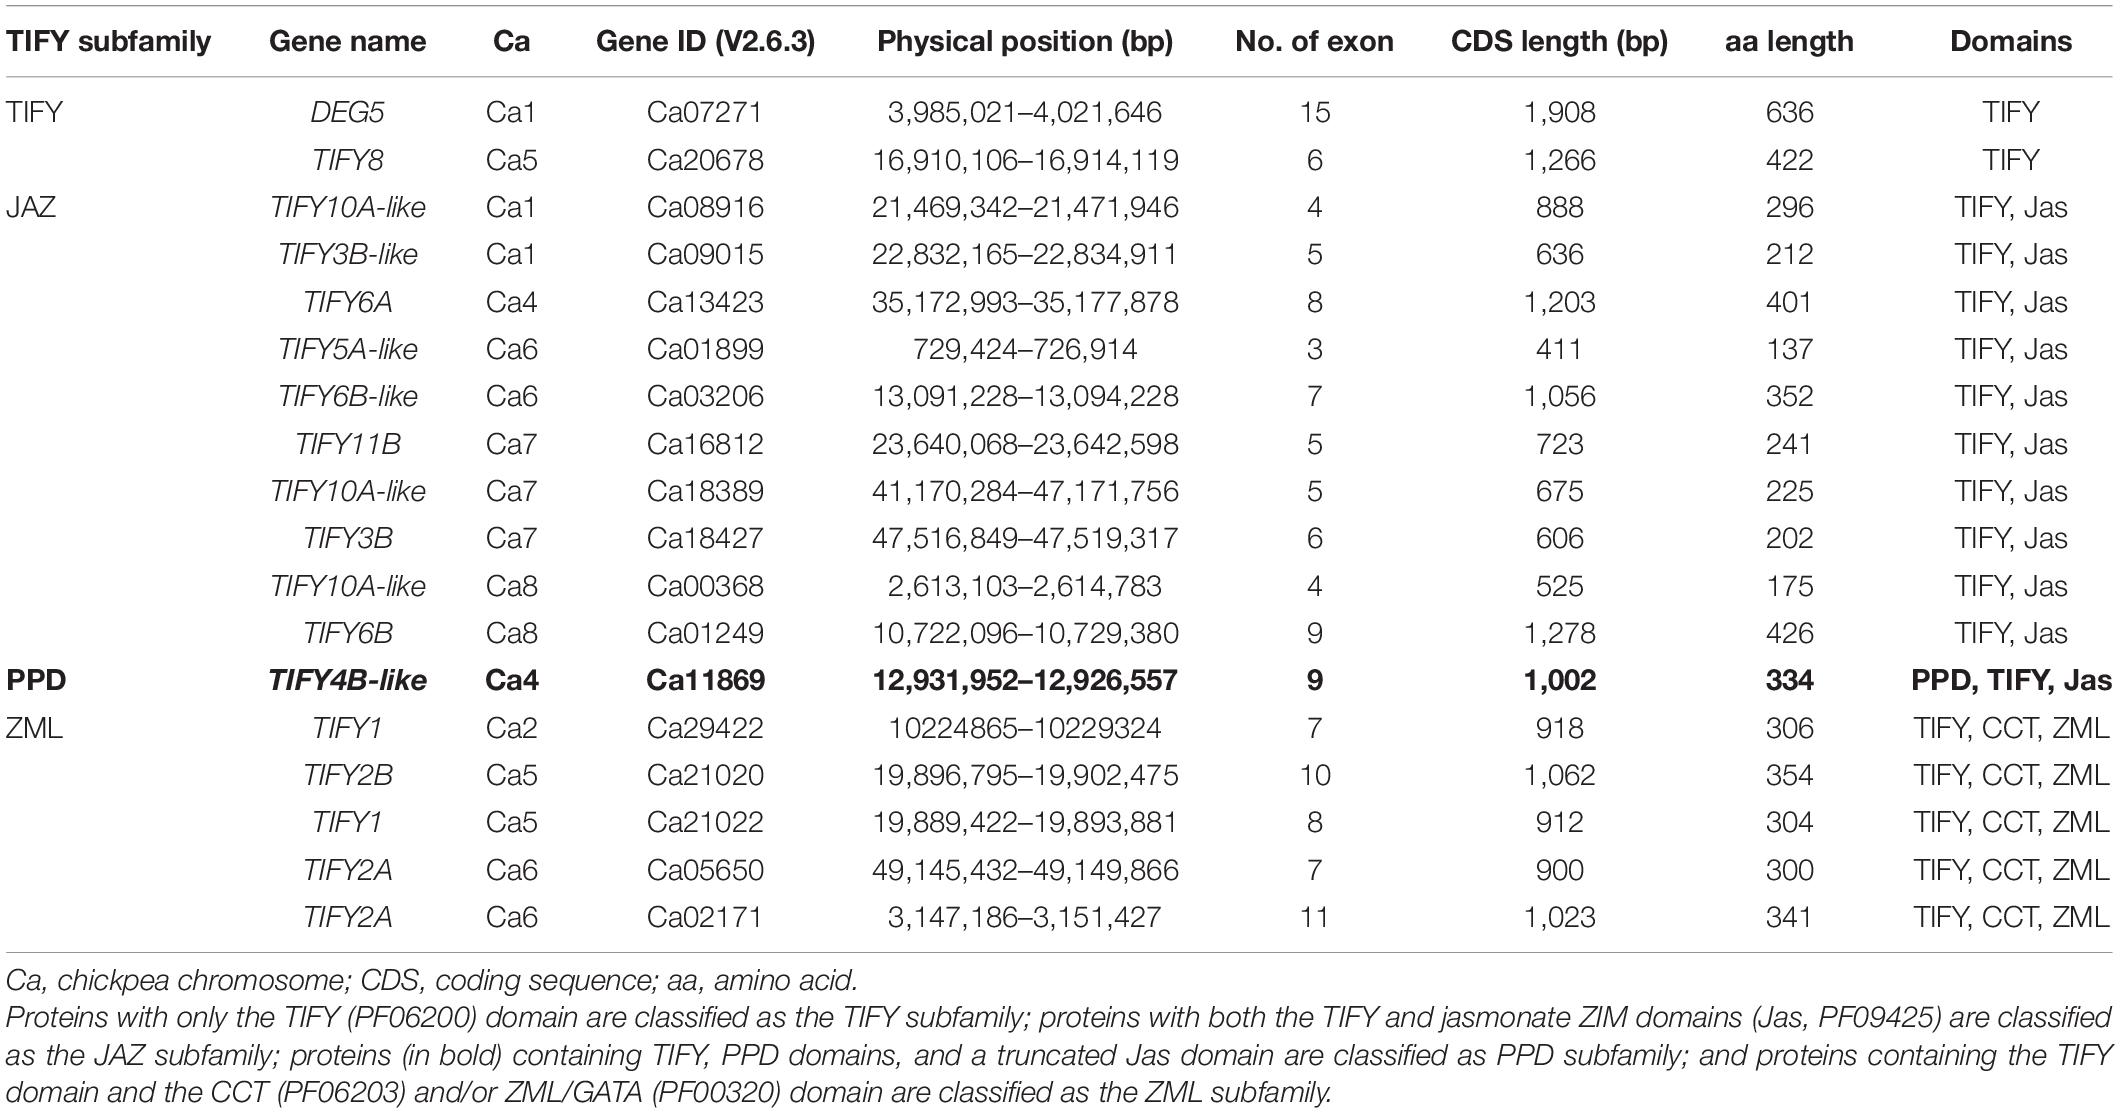
Table 1. Structural and coding details of chickpea CaTIFY genes.
Ca4_TIFY4B Encodes a PEAPOD Protein and Interacts With CaNINJA
Ca4_TIFY4B has nine exons and encodes a TIFY family transcription factor (334 amino acids), with high overall sequence similarity (Figure 4A) and major PPD, TIFY, and Jas domains (Figures 4B–C) characteristic of dicot PPD genes (TIFY sub-family). The amino acid substitution (I/S) found in the Rupali Ca4_TIFY4B protein is located inside the core TIFYCG motif of the TIFY domain (Figure 4D), whereas Genesis836 carries a version similar to the TIFY domain of other characterized PPD proteins. Previously, Ca4_TIFY4B orthologs were reported to interact with other protein partners including NINJA to form a complex regulating expression of transcription factors and/or downstream genes in Arabidopsis and Medicago (Ge et al., 2016; Baekelandt et al., 2018). It was shown that the core motif “TIFYAG” is the key region of the TIFY domain that interacts with AtNINJA in Arabidopsis (Pauwels et al., 2010).
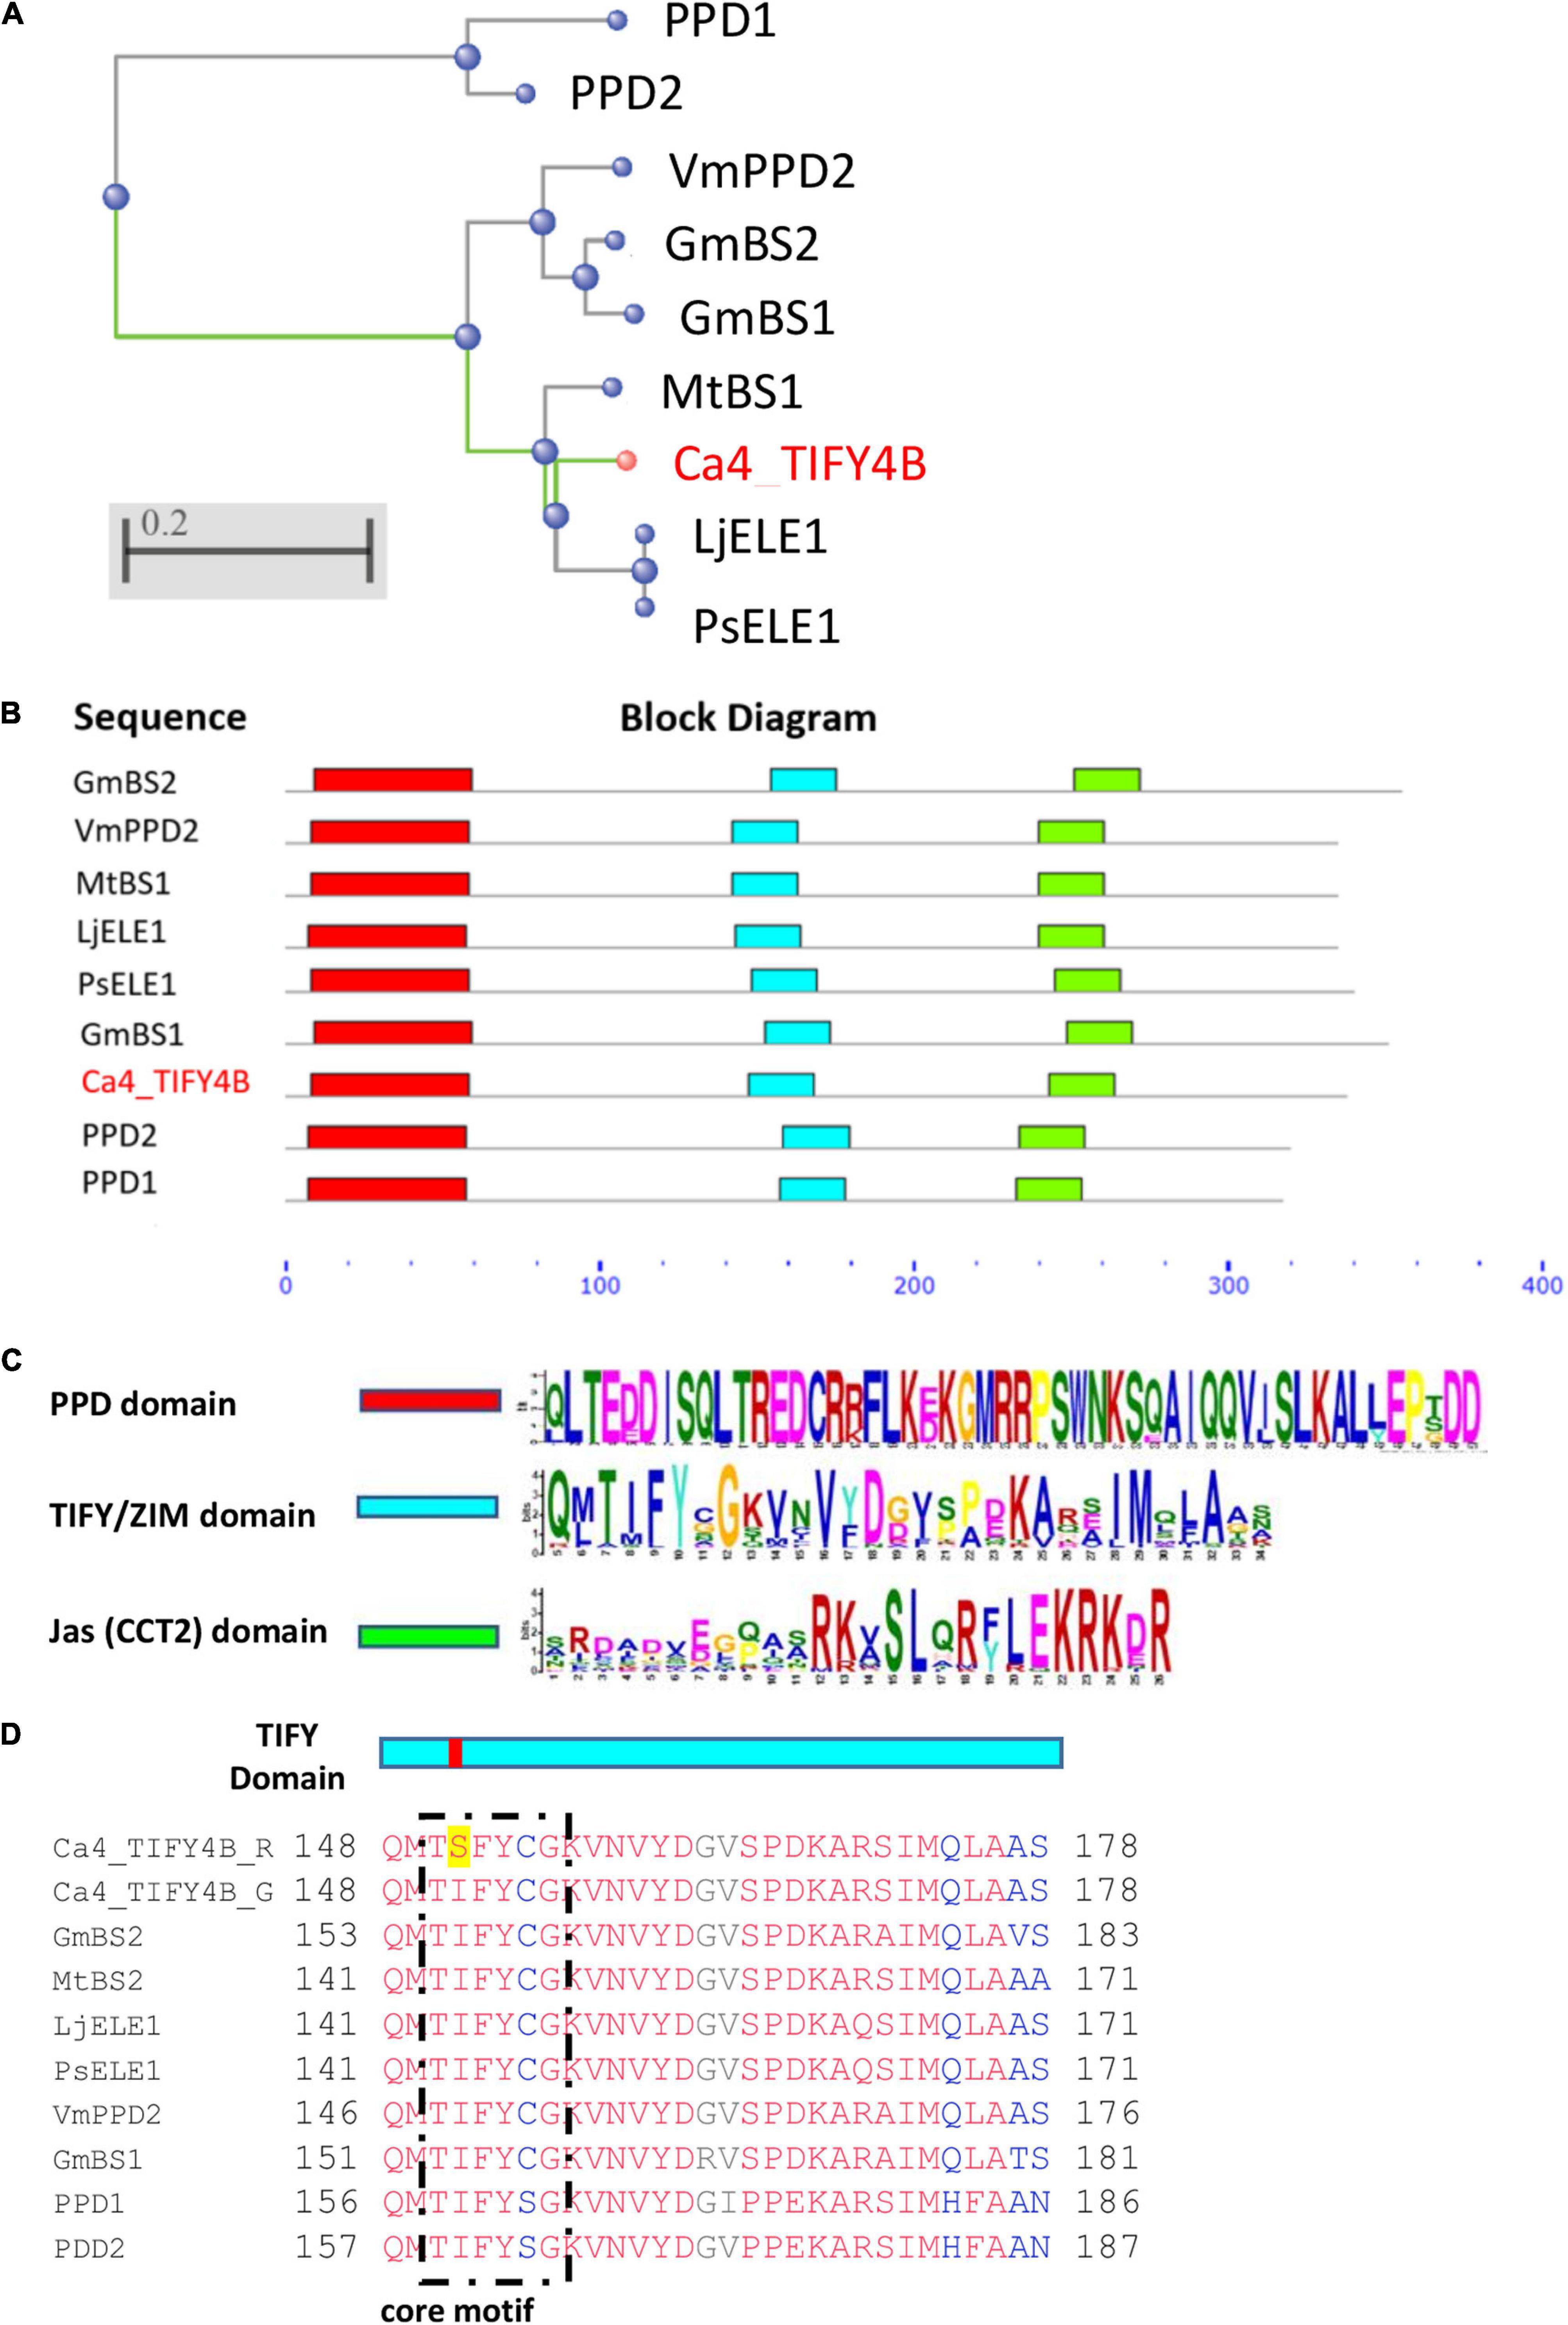
Figure 4. (A) Phylogenetic relationship of Ca4_TIFY4B protein sequence with orthologs from other plant species: G. max, BS1, BS2, V. mungo, VmPPD; M. truncatula, BS1; P. sativum, ELE1; Lotus japonicus, ELE1; A. thaliana, PPD1 and PPD2. Data were analyzed via Constraint-based Multiple Alignment Tool [COBALT, Papadopoulos and Agarwala (2007)]. The tree was created using a neighbor-joining method (Saitou and Nei, 1987). Cluster distance scale is shown on the gray bar (0.2) (B) Putative conserved domain structure in the CaTIFY4B protein and its homologs in other species, assessed using the Multiple Expectation maximization for Motif Elicitation (MEME) web server (https://meme-suite.org/meme/). The blue scale indicates amino acid sequence length; the color blocks represent the positions of domains. (C) The consensus sequences of conserved domains for TIFY, Jas (CCT2), and PPD from TIFY family proteins were created using MEME. (D) Sequence alignment across the TIFY domain. The isoleucine/serine (I/S) substitution in Ca4_TIFY4B_R is highlighted.
To test the impact on protein dimerization of the Rupali SNP variant inside the TIFY motif, Y2H interaction experiments for Ca4_TIFY4B and CaNINJA (Ca01446) were implemented in two ways using entire coding sequences: (1) CaNINJA as bait and TIFY4B_R/TIFY4B_G as preys (Figure 5) and (2) TIFY4B_R/TIFY4B_G as baits and CaNINJA as prey (Supplementary Figure 2). The CaNINJA sequences from Rupali and Genesis836 were identical (Supplementary File 5). Strong interaction between NINJA and TIFY4B_G was observed across the phenotyping plates when NINJA was used as bait (Figure 5), while weaker interaction between the two was observed only on the HIS3 reporter gene activation plate, when TIFY4B_G was used as bait (Supplementary Figure 2). No interaction was found between NINJA and TIFY4B_R when these tests were performed in either direction (Figure 5 and Supplementary Figure 2).
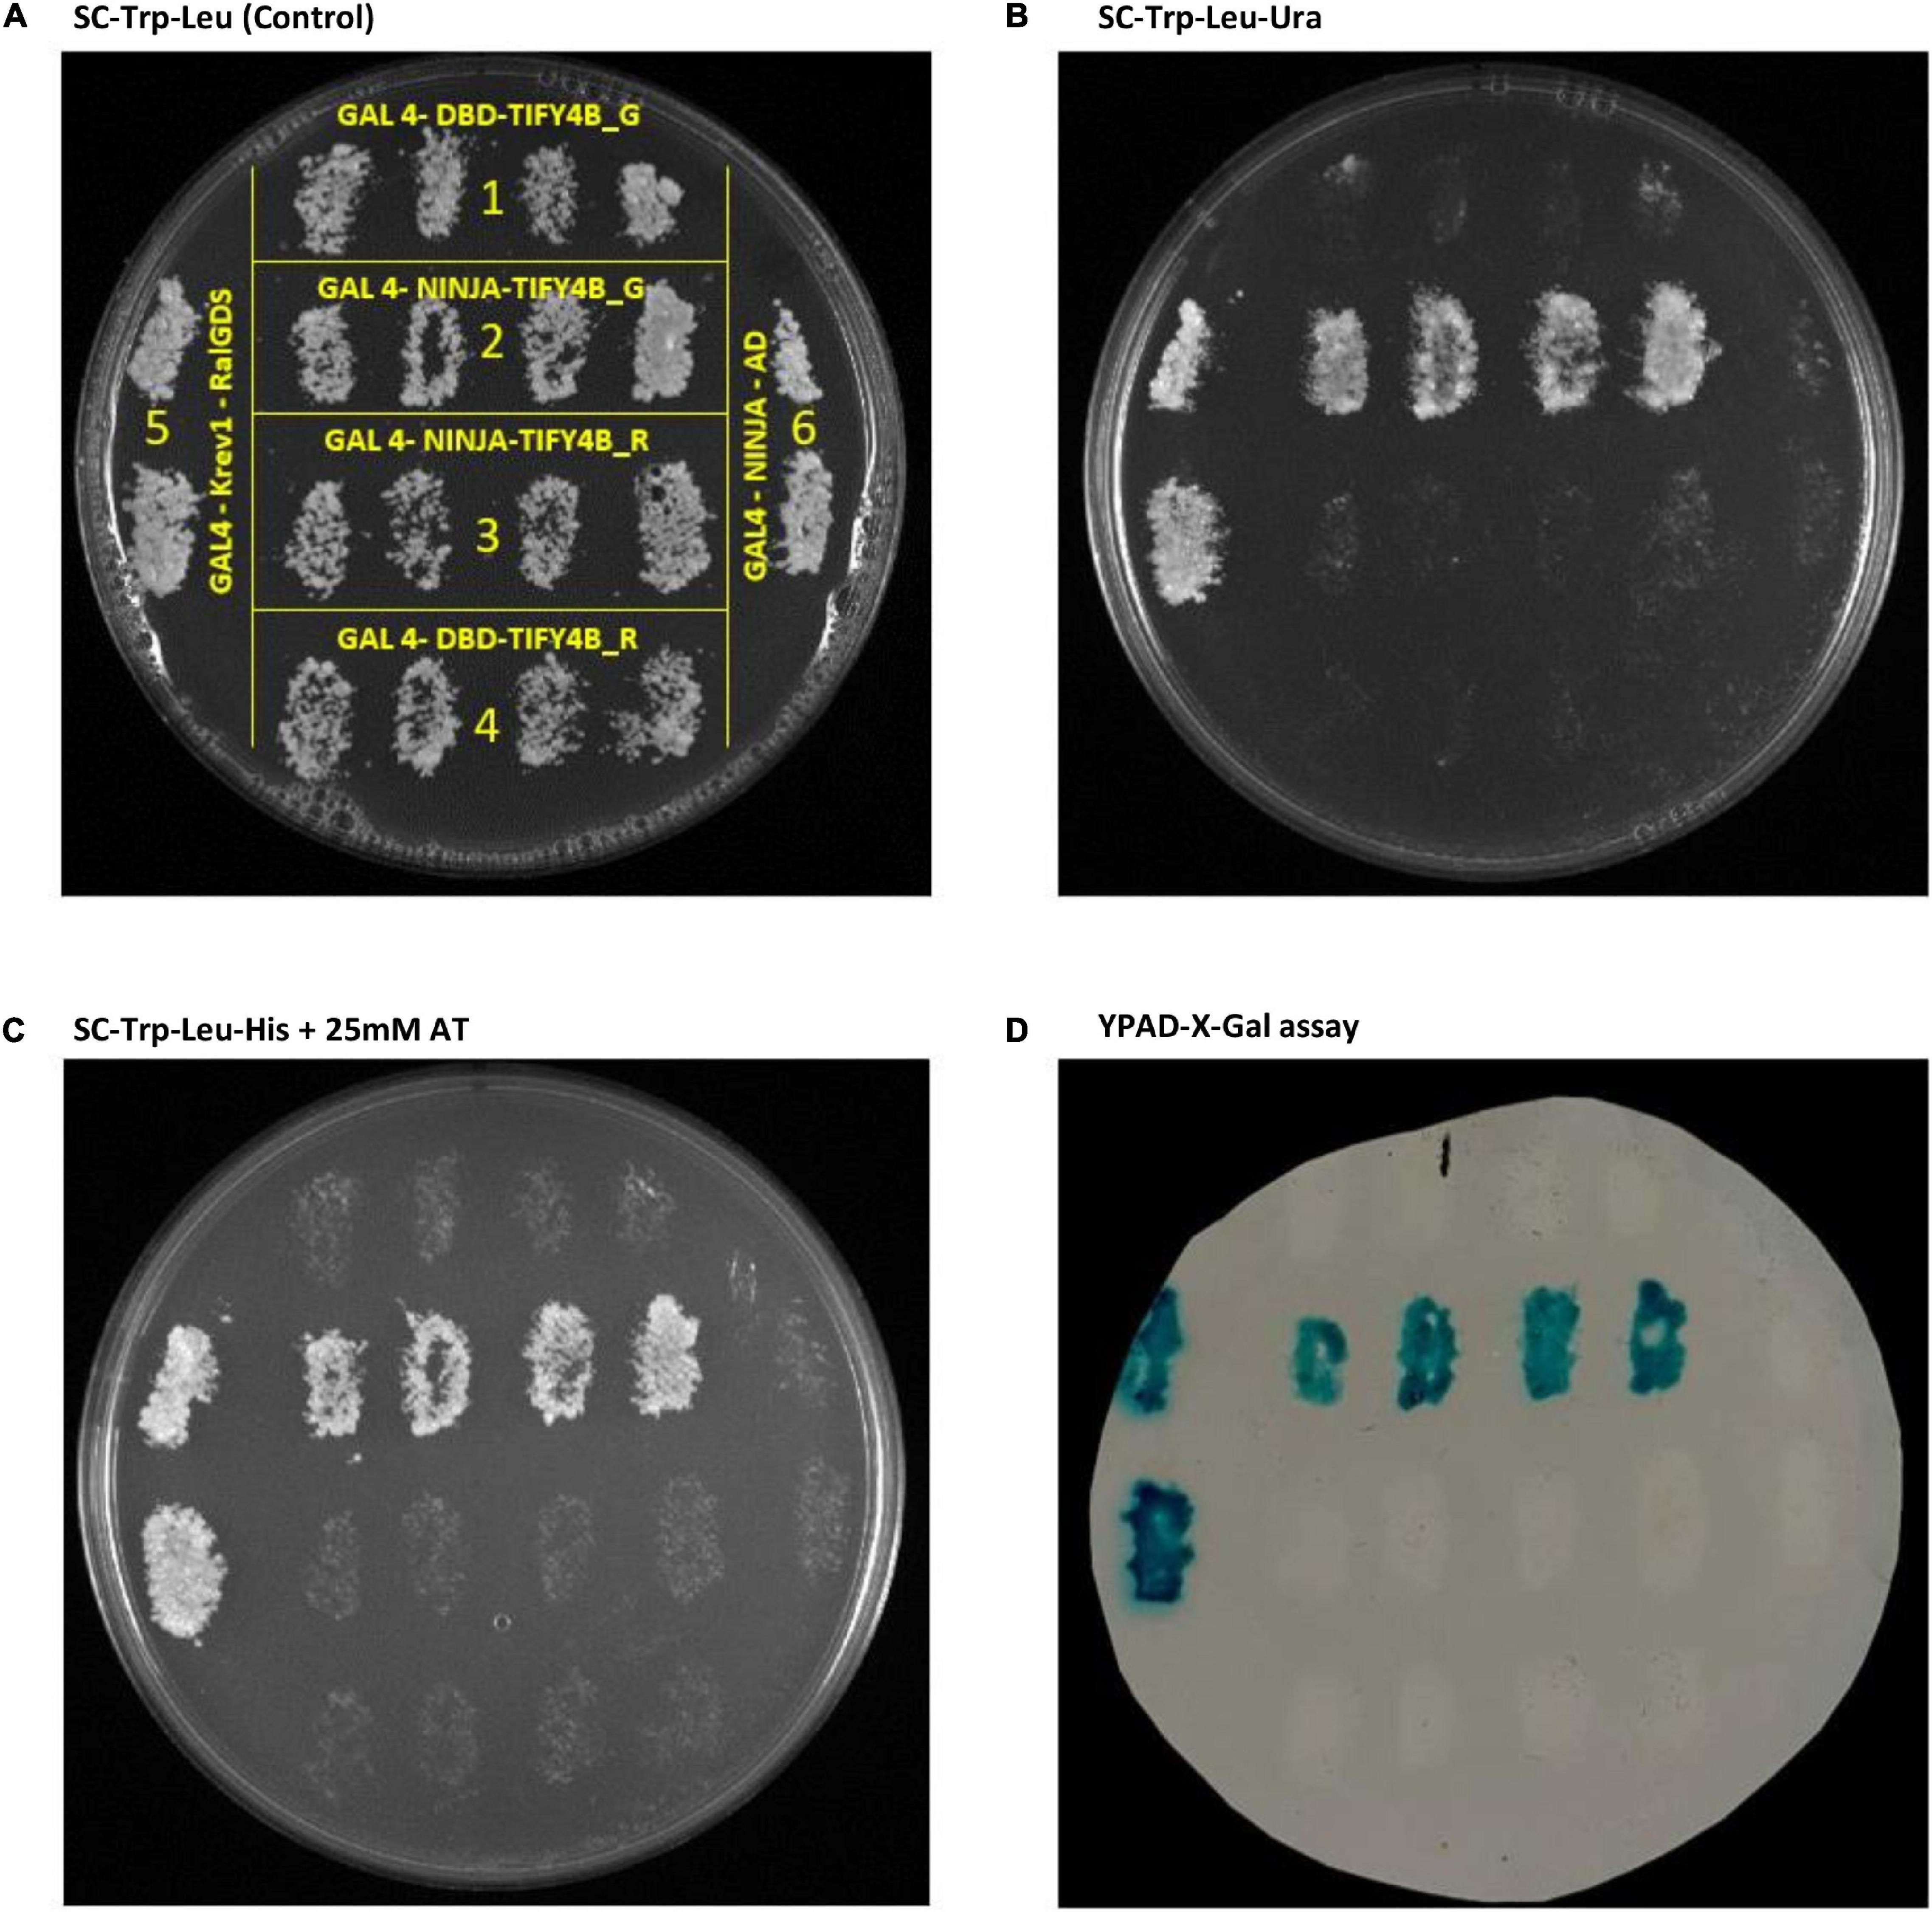
Figure 5. Saccharomyces cerevisiae Y2H analysis of protein-protein interactions between CaNINJA and Rupali or Genesis836 alleles of CaTIFY4B. (A) Control plate. (B) Test for URA3 reporter gene activation. (C) Test for HIS3 reporter gene activation. (D) Test for lacZ reporter gene activation. Plates in panels (B–D) were replica plated from plate (A); growth on these plates indicates a positive protein-protein interaction. Each patch is derived from a single transformed colony; patches for 1, 4, and 6 are negative controls while 5 (GAL4-Krev1-RalGD) is a strong positive control. Details for each of the construct interactions are provided in Supplementary Table 1.
Expression of Potential Downstream Target Genes of Ca4_TIFY4B
The residue change identified in the TIFY domain of the Rupali Ca4_TIFY4B variant abolished interaction with CaNINJA in a Y2H assay. To determine the impact on the expression of potential target genes of the transcriptional complex, candidates were chosen based on proposed target genes for the Ca4_TIFY4B ortholog MtBS1 in Medicago (Ge et al., 2016) and PPD1/PPD2 in Arabidopsis (Horiguchi et al., 2005; Lee et al., 2009; Kawade et al., 2013). We examined expression in four tissue types, namely, young shoot and root (harvested at nine DAS), youngest fully emerged leaf, and developing seed, for Ca4_TIFY4B, and four downstream target genes of the Ca4_TIFY4B-CaNINJA complex, namely, CaGIF1, CaGIF1L, CaGRF4, and CaGRF5L. All genes showed differential tissue-specific expression patterns. Ca4_TIFY4B was most highly expressed in developing seed. In contrast, the four candidate downstream genes were more highly expressed in young shoot and root than in youngest fully emerged leaves or developing seed (Figure 6). Neither Ca4_TIFY4B nor the selected downstream target genes were significantly differentially expressed in the contrasting NILs chosen for analysis (Figure 6). This outcome contradicted the hypothesis that the Ca4_TIFY4B_R variant contributes to increased vigor through the inability to interact with the CaNINJA partner to upregulate the expression of the genes known to regulate organ growth (Ge et al., 2016).
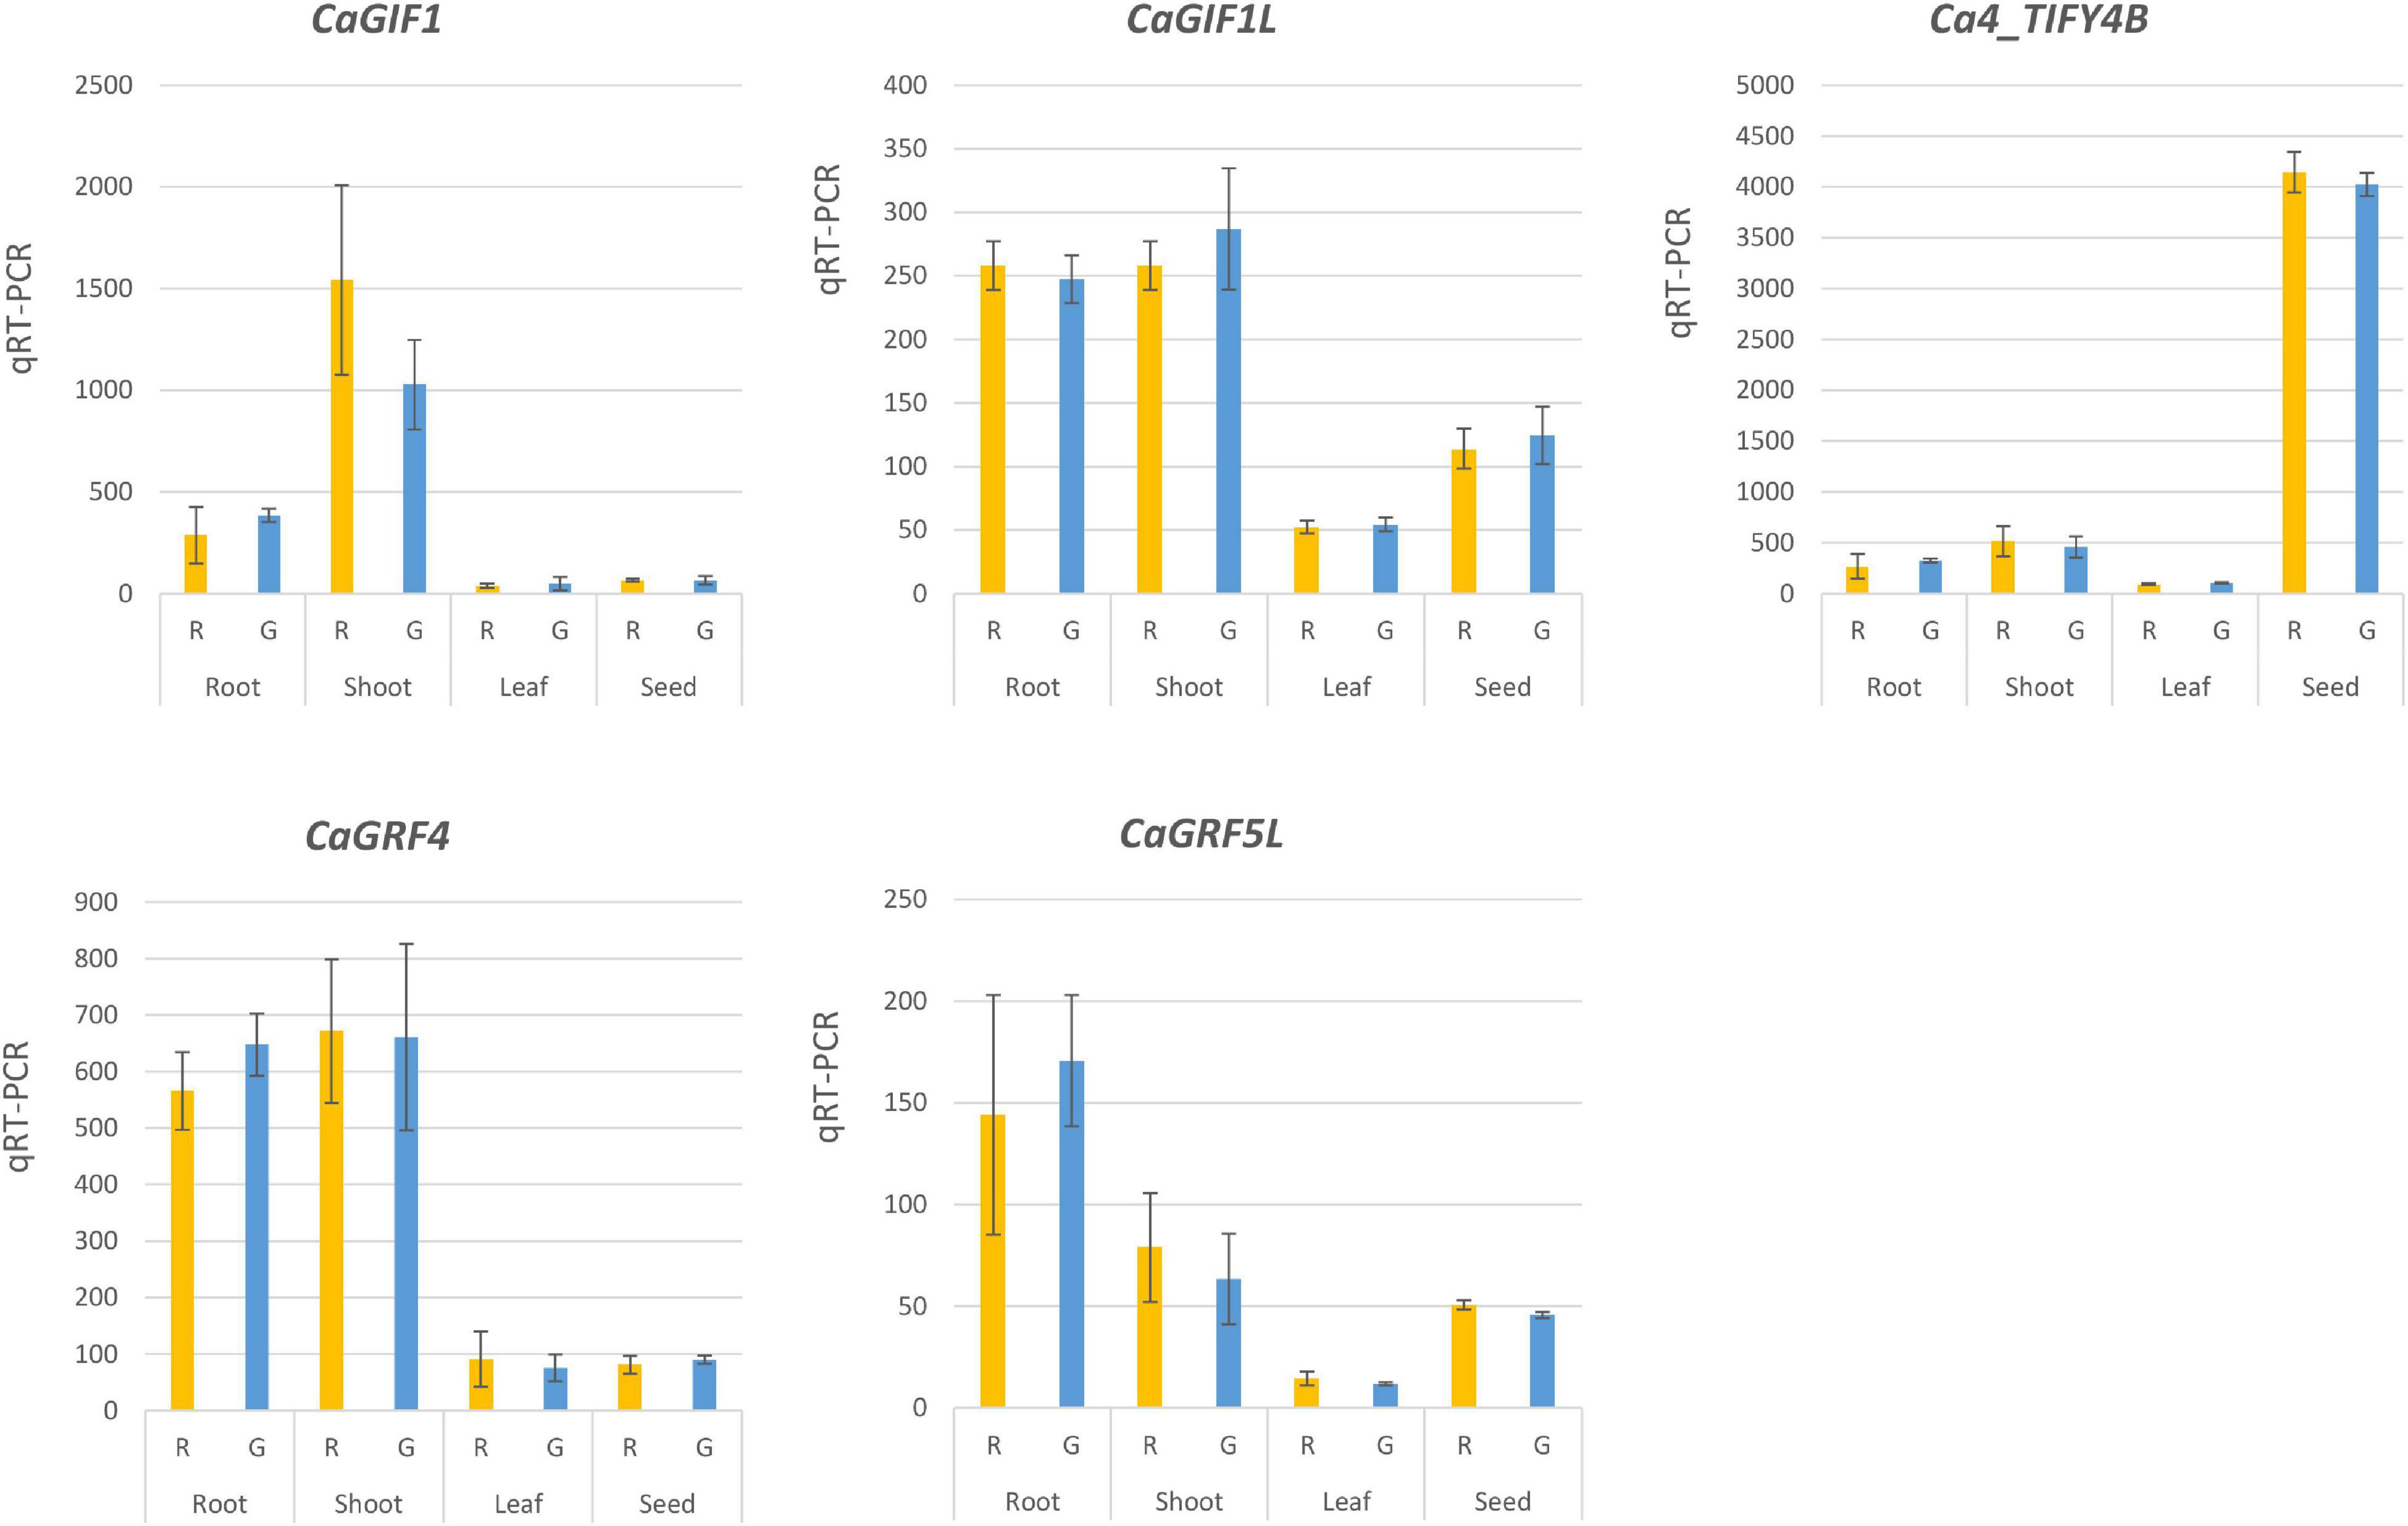
Figure 6. Absolute quantitative real-time PCR (qRT-PCR) analysis of expression of chickpea GIF1, GIF1L, GRF4, GRF5L, and Ca4_TIFY4B in NILs carrying contrasting Ca4_TIFY4B alleles, Rupali (R) or Genesis836 (G). NILs were derived from RIL50, heterozygous across the vigor region Ca4_Vqtl. Gene expression was analyzed for whole shoot and root harvested at 9 days after sowing, youngest fully emerged leaves sampled at 7 weeks after sowing, and developing seed. Means ± SD are shown for n = 3 or 4. There were no significant differences in expression for any of the tested genes in these tissues (P > 0.05).
Discussion
Vigor has been identified as a high-priority target in pulse crop breeding programs. An understanding of the genetics of vigor and the development of robust genetic markers for the trait would allow breeders to select early stage breeding materials. In this study, we fine-mapped a vigor QTL, Ca4_Vqtl, which colocates with a region for seed size in a population of Rupali/Genesis836 chickpea RILs (Nguyen et al., 2021). The QTL spans 12.65–13.06 Mb (CDC Frontier Ref V2.6.3) and overlaps a “hotspot” QTL region identified independently for a biparental population that was linked to drought tolerance, vigor, and seed size traits (Varshney et al., 2014; Jaganathan et al., 2015; Kale et al., 2015; Singh et al., 2016; Sivasakthi et al., 2018). The analysis of key recombinant families in this study has allowed us to narrow the interval to 104.4 kb and revealed the regulatory gene Ca4_TIFY4B as a strong candidate at Ca4_Vqtl for vigor through the regulation of organ size. In our study, the measurement of leaf and seed size together with 100SDW and seed number were effectively used as robust measurements for trait/marker associations as they segregate with genotype at Ca4_Vqtl in both glasshouse and shade house conditions (Supplementary File 3 and Supplementary Table 2). In glasshouse conditions, we also observed segregation for root dry weight at 4 weeks in the NIL pairs (Figure 1). This supports previous findings that the “QTL hotspot” controls root-based traits (Varshney et al., 2014; Kale et al., 2015). Our study supports the hypothesis of a pleiotropic effect of the Ca4_Vqtl region in controlling organ size, including that of leaves, roots, and seeds.
Of the four SNPs reinvestigated within the refined Ca4_Vqtl interval, only one was found within a coding region and likely to have a major impact on gene function. Of the 10 genes located inside Ca4_Vqtl, Ca4_TIFY4B contains a non-synonymous SNP inside the fourth exon which leads to a non-conservative amino acid substitution (I/S) in the core TIFYCG motif sequence of its TIFY domain (Vanholme et al., 2007). Ca4_TIFY4B is the single TIFY ortholog of the PPD subfamily found in chickpea and is orthologous to PPD1/PPD2 in A. thaliana and BS1 in M. truncatula, which both control organ size and shape (White, 2006; Gonzalez et al., 2015; Ge et al., 2016). ppd1-2 ppd2-cr and ppd1-cr ppd2-1 double mutants generated in Arabidopsis had greater individual SWs (Liu et al., 2020), whereas the overexpression of PPD1 or PPD2 (Δppd-deletion complementation) resulted in a reduction of SW (White, 2017). Ge et al. (2016) reported that deletion and downregulation of PPD orthologs in Medicago (MtBS1) and soybean (GmBS1), respectively, led to significant increases in leaf and seed size. In black gram [Vigna mungo (L.) Hepper], a loss-of-function mutation (8-bp deletion in the sixth exon) in VmPPD (mog mutant), led to dramatic increases in leaf size, biomass, and seed size (Naito et al., 2017). In pea (P. sativum), PsELE1 mutants displayed contrasting phenotypes to the wild type, with enlarged seeds, leaves, symmetrical lateral, and ventral petals (Li et al., 2019). These functional studies of Ca4_TIFY4B orthologs reveal a conserved function and suggest a similar role for Ca4_TIFY4B in controlling tissue organ size, i.e., component traits of vigor in chickpea.
Previously, TIFY domains of PPD proteins were reported to mediate homo- and heterodimerization between different TIFY proteins and with other protein partners, including NINJA (Chini et al., 2009; Chung and Howea, 2009; Pauwels et al., 2010; Gonzalez et al., 2015). In Arabidopsis, it was shown using Y2H and an AtJAZ1 deletion series that AtNINJA was only capable of binding JAZ1 fragments containing a TIFY motif, specifically the “TIFYAG” sequence (Pauwels et al., 2010). The SNP we identified in the TIFY domain of Ca_TIFY4B results in a change from the conserved TIFY domain of TIFYCG to TSFYCG (Figure 4D). As the TIFY domain is known to mediate interactions with NINJA proteins, we tested the interaction of the two versions, Ca4_TIFY4B from Genesis836 (Ca4_TIFY4B_G; smaller leaf and seed) and Rupali (Ca4_TIFY4B_R; bigger leaf and seed), with CaNINJA. We found that CaNINJA interacted strongly with the Ca4_TIFY4B_G version, enabling yeast growth, whereas Ca4_TIFY4B_R assays resulted in no observable growth under our conditions (Figure 5). This is likely attributed to the non-conservative amino acid substitution (I/S) in the core TIFYCG motif (Figure 4).
The complexes formed by orthologs of Ca4_TIFY4B, CaNINJA, and other PPD partners are proposed to suppress the expression of organ size regulatory genes in plants (Schneider et al., 2021). In Medicago MtBS1 loss-of-function mutants, several proposed target genes involved in primary cell proliferation (MtGIF1, MtGIF2, MtGRF1, and MtGRF5) were found to be upregulated, suggesting that the native functional complex suppresses their expression (Ge et al., 2016). In this study, we initially hypothesized that the inability of Ca4_TIFY4B_R to interact with CaNINJA, which is caused by the variant SNP in the TIFY domain, would disrupt the function of the whole PPD complex and result in the increased expression of CaGIF1, CaGIF1L, CaGRF4, and CaGRF5L. However, we observed no differences in transcript expression in young shoots and roots, youngest fully emerged leaves, or developing seed of selected pairs of NILs (Figure 6). Even though the findings from our expression study contradict the Medicago study, they are similar to findings in Arabidopsis where PPD1/PPD2 knockdown lines showed a size-increase phenotype yet the expression of AtGIF1 and AtGRF5 were not altered (Gonzalez et al., 2015). Even where PPD1/PPD2 were dramatically downregulated to 13 and 40% of the wild-type gene expression levels, respectively (Gonzalez et al., 2010), the regulating function of the PPD complex was partly retained, and hence, the expression of downstream genes was not observably affected in Arabidopsis (Gonzalez et al., 2015). Based on these results, we propose that this could also be the case with the natural mutation found in Ca4_TIFY4B. In the native chickpea background, the SNP in Ca4_TIFY4B might result in a decrease in the binding affinity between Ca4_TIFY4B and CaNINJA, rather than a complete loss of function as observed in the Y2H experiment. In planta, the functional impairment of the Ca4_TIFY4B_R/NINJA/protein partner complex rather than a complete abrogation of its regulatory function would not be expected to impact the regulation of these potential downstream genes as strongly as observed in dramatically truncated PPD mutants generated in other species (Ge et al., 2016; Liu et al., 2020). This is also reflected in the less pronounced increase in organ size of our plants carrying the natural Ca4_TIFY4B_R variant compared with other reports of plants carrying PPD knockout complete loss-of-function alleles. We only observed increases in leaf and seed size by 39 and 24%, respectively, in Ca4_TIFY4B_R genotypes, compared to the increases of 100 and 70% in black gram mog lines (Naito et al., 2017), 225 and 49% in the Medicago mtbs1-1 lines (Ge et al., 2016), and 53% (for seed size) in Arabidopsis ΔPPD (Liu et al., 2020).
The significant increases in the shoot, biomass, leaf, fruit, and seed size in eudicots, including legume plants, upon natural mutation or genetic engineering of PPD proteins and their partners imply great potential for breeding from a biotechnological point of view (Gonzalez et al., 2015; Ge et al., 2016; Naito et al., 2017; Kanazashi et al., 2018; Li et al., 2019; Liu et al., 2020; Swinnen et al., 2020). However, targeting genes that act in multiple plant organs or at distinct developmental stages, as demonstrated for the PPD, may have undesirable pleiotropic effects. In this study, we showed that the natural SNP variant in Ca4_TIFY4B could lead to increases in leaf size, seed size, and 100SDW by 39, 24, and 35%, respectively, but also resulted in a decrease of seed number per plant by approximately 39% (Supplementary File 4). A similar trade-off between these traits was reported in black gram and soybean (Naito et al., 2017; Kanazashi et al., 2018). Nevertheless, the screening of GmBS1 and GmBS2 knockdown transgenic lines in soybean found the presence of transgenic plants with increased seed size and maintenance of seed number; this suggests a potential for regulating GmBS1 and GmBS2 expression levels to reduce the seed size/number trade-off and to enhance total SW (Naito et al., 2017). While our findings from pot-grown plants of Ca4_Vqtl NILs suggested that a reduction in total SW is associated with the increase in vigor and seed size (Supplementary File 3), Bharadwaj et al. (2021) reported that introgression of the QTL hotspot/Ca4_Vqtl (including Ca4_TIFY4B_R from the high vigor/big seed parent ICC4958) into three chickpea elite cultivars enhanced yield by 16% under rainfed conditions in India. The Ca4_TIFY4B_R variant (SNP_12929674) was recently found to be significantly strongly associated with both vigor and seed size in three chickpea diversity panels, including Australian varieties and breeding lines (Nguyen et al., 2021). However, the Ca4_TIFY4B_G variant is almost three times more prevalent than the Ca4_TIFY4B_R variant in Australian commercial chickpea varieties (Supplementary File 6). This suggests that the Ca4_TIFY4B_G variant might have been passively selected to mitigate the potential impact of a seed size/number trade-off for the improvements of yield under Australian growing conditions. Further studies using Ca4_Vqtl NIL pairs in various Australian environments are needed to confirm this. However, while the manipulation of this PPD gene might not necessarily achieve consistently higher yields, the larger seed size could attract a price premium, offset a yield disadvantage (relative to other crops), and improve the commercial value of leguminous crops in the farming system.
This study has revealed the gene Ca4_TIFY4B as the strongest candidate inside the narrowed Ca4_Vqtl interval that controls vigor-related traits in chickpea. We have identified a novel, natural variant of a plant PPD gene that results in moderate increases in seed size, leaf size, and other plant organs. We described a robust gene-derived molecular marker to be used for selection for seed and organ size in chickpea. This will assist chickpea breeders in developing effective strategies to significantly increase plant vigor and also manipulate seed size and yield.
Data Availability Statement
The original contributions presented in the study are included in the article/Supplementary Material, further inquiries can be directed to the corresponding author.
Author Contributions
DN, JEH, JH, and TS designed and conceived the study. JEH and DN conducted phenotyping and Y2H assays. JH and DN conducted the qPCR assays. DN collected data and drafted the manuscript. All authors provided feedback on the manuscript and read and approved the final manuscript.
Funding
DN was funded by an Australian Research Training Program (RTP) scholarship, UWA International Fee Scholarship, and an Underwood Ph.D. completion scholarship from the University of Western Australia. This study was part-funded by the Australian Research Council Industrial Transformation Research Hub for Legumes for Sustainable Agriculture (IH140100013) and the Australia-India Strategic Research Fund, the Australian Government Department of Industry, the Innovation and Science (project AISRF48538).
Conflict of Interest
The authors declare that the research was conducted in the absence of any commercial or financial relationships that could be construed as a potential conflict of interest.
Publisher’s Note
All claims expressed in this article are solely those of the authors and do not necessarily represent those of their affiliated organizations, or those of the publisher, the editors and the reviewers. Any product that may be evaluated in this article, or claim that may be made by its manufacturer, is not guaranteed or endorsed by the publisher.
Acknowledgments
The authors acknowledge Tim Colmer for reading the final draft of the manuscript and Ute Bauman for bioinformatics support. The authors are grateful to Judith Atieno for providing seeds of F4-derived Rupali/Genesis836 RILs (RIL15, RIL50, and RIL89) to generate fine-mapping material and Hammad Khan for the RNAseq data used to examine the expression of candidate genes for Ca4_Vqtl. Daniel Menadue provided technical support in phenotyping of NIL material.
Supplementary Material
The Supplementary Material for this article can be found online at: https://www.frontiersin.org/articles/10.3389/fpls.2022.829566/full#supplementary-material
Supplementary File 1 | Primer sequences.
Supplementary File 2 | FASTA of protein sequences from this study.
Supplementary File 3 | Recombinant inbred line (RIL)-derived near-isogenic lines (NILs) phenotyping.
Supplementary File 4 | Heterogeneous inbred families (HIFs) and HIF-derived near-isogenic lines (NILs) phenotyping variation.
Supplementary File 5 | Rupali and Genesis836 Ca4_TIFY4B and CaNINJA sequences.
Supplementary File 6 | Distribution of Ca4_TIFY4B allele in Australian varieties.
Footnotes
References
Amalraj, A. (2019). Molecular Genetics and Genomics Approaches to Improve Phytophthora Root Rot Resistance in Chickpea. Ph.D. thesis. Adelaide: University of Adelaide.
Atieno, J., Colmer, T. D., Taylor, J., Li, Y., Quealy, J., Kotula, L., et al. (2021). Novel salinity tolerance loci in chickpea identified in glasshouse and field environments. Front. Plant. Sci. 12:667910. doi: 10.3389/fpls.2021.667910
Baekelandt, A., Pauwels, L., Wang, Z., Li, N., Milde, L. D., Natran, A., et al. (2018). Arabidopsis leaf flatness is regulated by PPD2 and NINJA through repression of CYCLIN D3 genes. Plant Physiol. 178, 217–232. doi: 10.1104/pp.18.00327
Bai, Y., Meng, Y., Huang, D., Qi, Y., and Chen, M. (2011). Origin and evolutionary analysis of the plant-specific TIFY transcription factor family. Genomics 98, 128–136. doi: 10.1016/j.ygeno.2011.05.002
Bailey, T. L., Boden, M., Buske, F. A., Frith, M., Grant, C. E., Clementi, L., et al. (2009). MEME SUITE, tools for motif discovery and searching. Nucleic Acids Res. 37, W202–W208. doi: 10.1093/nar/gkp335
Bharadwaj, C., Tripathi, S., Soren, K. R., Thudi, M., Singh, R. K., Sheoran, S., et al. (2021). Introgression of ‘QTL-hotspot’ region enhances drought tolerance and grain yield in three elite chickpea cultivars. Plant Genome 14:e20076. doi: 10.1002/tpg2.20076
Carleton, A., and Cooper, C. (1972). Seed size effects upon seedling vigor of three forage legumes. Crop Sci. 12, 183–186. doi: 10.2135/cropsci1972.0011183X001200020008x
Chini, A., Fonseca, S., Chico, J. M., Fernández-Calvo, P., and Solano, R. (2009). The ZIM domain mediates homo- and heteromeric interactions between Arabidopsis JAZ proteins. Plant J. 59, 77–87. doi: 10.1111/j.1365-313X.2009.03852.x
Chung, H. S., and Howea, G. A. (2009). A critical role for the TIFY motif in repression of jasmonate signaling by a stabilized splice variant of the JASMONATE ZIM-Domain Protein JAZ10 in Arabidopsis. Plant Cell 21, 131–145. doi: 10.1105/tpc.108.064097
Collins, A., Milbourne, D., Ramsay, L., Meyer, R., Chatot-Balandras, C., Oberhagemann, P., et al. (1999). QTL for field resistance to late blight in potato are strongly correlated with maturity and vigour. Mol. Breed. 5, 387–398.
Cuéllar, A. P., Pauwels, L., Clercq, R. D., and Goossens, A. (2013). Yeast two-hybrid analysis of jasmonate signaling proteins. Methods Mol. Biol. 1011, 173–185. doi: 10.1007/978-1-62703-414-2_14
Easlon, H. M., and Bloom, A. J. (2014). Easy Leaf Area: automated digital image analysis for rapid and accurate measurement of leaf area. Appl. Plant Sci. 2:1400033. doi: 10.3732/apps.1400033
Edwards, D. (2016). Improved Kabuli Reference Genome. CyVerse Data Commons. Dataset. Available online at: https://datacommons.cyverse.org/browse/iplant/home/shared/commons_repo/curated/Edwards_KabuliGenome_Jun2016 (accessed December, 2018).
Erffelinck, M. L., Ribeiro, B., Perassolo, M., Pauwels, L., Pollier, J., Storme, V., et al. (2018). A user-friendly platform for yeast two-hybrid library screening using next generation sequencing. PLoS One 13:e0201270. doi: 10.1371/journal.pone.0201270
FAOSTAT (2019). FAO Statistics Division. Available online at: https://www.fao.org/faostat/en/#compare (accessed August, 2020).
Fatichin, Zheng, S. H., and Arima, S. (2013). Varietal difference in early vegetative growth during seedling stage in soybean. Plant Prod. Sci. 16, 77–83. doi: 10.1626/pps.16.77
Ge, L., Yu, J., Wang, H., Luth, D., Bai, G., Wang, K., et al. (2016). Increasing seed size and quality by manipulating BIG SEEDS1 in legume species. Proc. Natl. Acad. Sci. U.S.A. 113, 12414–12419. doi: 10.1073/pnas.1611763113
Gietz, R. D., and Schiestl, R. H. (2007). High-efficiency yeast transformation using the LiAc/SS carrier DNA/PEG method. Nat. Protoc. 2, 31–34. doi: 10.1038/nprot.2007.13
Gonzalez, N., Bodt, S. D., Sulpice, R., Jikumaru, Y., Chae, E., Dhondt, S., et al. (2010). Increased leaf size: Different means to an end. Plant Physiol. 153, 1261–1279. doi: 10.1104/pp.110.156018
Gonzalez, N., Pauwels, L., Baekelandt, A., Milde, L. D., Leene, J. V., Besbrugge, N., et al. (2015). A repressor protein complex regulates leaf growth in arabidopsis. Plant Cell 27, 2273–2287. doi: 10.1105/tpc.15.00006
Graham, J., Hackett, C. A., Smith, K., Woodhead, M., MacKenzie, K., Tierney, I., et al. (2011). Towards an understanding of the nature of resistance to Phytophthora root rot in red raspberry. Theor. Appl. Genet. 123, 585–601. doi: 10.1007/s00122-011-1609-5
Horiguchi, G., Kim, G. T., and Tsukaya, H. (2005). The transcription factor AtGRF5 and the transcription coactivator AN3 regulate cell proliferation in leaf primordia of Arabidopsis thaliana. Plant J. 43, 68–78. doi: 10.1111/j.1365-313X.2005.02429.x
Jaganathan, D., Thudi, M., Kale, S., Azam, S., Roorkiwal, M., Gaur, P. M., et al. (2015). Genotyping-by-sequencing based intra-specific genetic map refines a ‘QTL-hotspot’ region for drought tolerance in chickpea. Mol. Genet. Genom. 290, 559–571. doi: 10.1007/s00438-014-0932-3
Kale, S. M., Jaganathan, D., Ruperao, P., Chen, C., Punna, R., Kudapa, H., et al. (2015). Prioritization of candidate genes in ‘QTL-hotspot’ region for drought tolerance in chickpea (Cicer arietinum L.). Sci. Rep. 5:e15926. doi: 10.1038/srep15296
Kalpić, D., Hlupić, N., and Lovrić, M. (2014). “Student’s t-tests,” in Mathematics and Statistics Reference Module Computer Science and Engineering, ed. L. Miodrag (Berlin: Springer), doi: 10.1007/978-3-642-04898-2
Kamboozia, J. (1994). Seedling Vigour in Winter Grain Legumes. Ph.D. thesis. Adelaide: University of Adelaide.
Kanazashi, Y., Hirose, A., Takahashi, I., Mikami, M., Endo, M., Hirose, S., et al. (2018). Simultaneous site-directed mutagenesis of duplicated loci in soybean using a single guide RNA. Plant Cell Rep. 37, 553–563. doi: 10.1007/s00299-018-2251-3
Kawade, K., Horiguchi, G., Usami, T., Hirai, M. Y., and Tsukaya, H. (2013). ANGUSTIFOLIA3 signalling coordinates proliferation between clonally distinct cells in leaves. Curr. Biol. 23, 788–792. doi: 10.1016/j.cub.2013.03.044
Khan, H. A. (2016). Mechanisms of Salt to Tolerance in Chickpea. Ph.D. thesis. Perth: The University of Western Australia.
Komyshev, E., Genaev, M., and Afonnikov, D. (2017). Evaluation of the SeedCounter, a mobile application for grain phenotyping. Front. Plant Sci. 7:1990. doi: 10.3389/fpls.2016.01990
Lee, B. H., Ko, J. H., Lee, S., Lee, Y., Pak, J. H., and Kim, J. H. (2009). The Arabidopsis GRF-INTERACTING FACTOR gene family performs an overlapping function in determining organ size as well as multiple developmental properties. Plant Physiol. 151, 655–668. doi: 10.1104/pp.109.141838
Li, X., Liu, W., Zhuang, L., Zhu, Y., Wang, F., Chen, T., et al. (2019). BIGGER ORGANS and ELEPHANT EAR-LIKE LEAF1 control organ size and floral organ internal asymmetry in pea. J. Exp. Bot. 70, 179–191. doi: 10.1093/jxb/ery352
Liu, Z., Li, N., Zhang, Y., and Li, Y. (2020). Transcriptional repression of GIF1 by the KIX-PPD-MYC repressor complex controls seed size in Arabidopsis. Nat. Commun. 11:1846. doi: 10.1038/s41467-020-15603-3
Massimi, M. (2018). Impact of seed size on seeds viability, vigor and storability of Hordeum vulgare (L.). Agric. Sci. Digest. 38, 62–64. doi: 10.18805/ag.A-293
Mistry, J., Chuguransky, S., Williams, L., Qureshi, M., Salazar, G. A., Sonnhammer, E. L., et al. (2021). Pfam: The protein families database in 2021. Nucleic Acids Res. 49, D412–D419. doi: 10.1093/nar/gkaa913
Myhrstad, L. T. (2011). The Use of the Yeast Two Hybrid System to Detect CKS2 Dimerization and Interactions with CDK1 and CDK2. Master’s thesis. Oslo: University of Oslo.
Naito, K., Takahashi, Y., Chaitieng, B., Hirano, K., Kaga, A., Takagi, K., et al. (2017). Multiple organ gigantism caused by mutation in VmPPD gene in blackgram (Vigna mungo). Breed. Sci. 67, 151–158. doi: 10.1270/jsbbs.16184
Nguyen, D. T., Hayes, J. E., Atieno, J., Li, Y., Baumann, U., Pattison, A., et al. (2021). The genetics of vigour-related traits in chickpea (Cicer arietinum L.): insights from genomic data. Theor. Appl. Genet. 135, 107–124. doi: 10.1007/s00122-021-03954-4
Papadopoulos, J. S., and Agarwala, R. (2007). COBALT: constraint-based alignment tool for multiple protein sequences. Bioinformatics 23, 1073–1079. doi: 10.1093/bioinformatics/btm076
Pauwels, L., Barbero, G. F., Geerinck, J., Tilleman, S., Grunewald, W., Pérez, A. C., et al. (2010). NINJA connects the co-repressor TOPLESS to jasmonate signalling. Nature 464, 788–791. doi: 10.1038/nature08854
Pechmann, S., and Frydman, J. (2014). Interplay between chaperones and protein disorder promotes the evolution of protein networks. PLoS Comput. Biol. 10:e1003674. doi: 10.1371/journal.pcbi.1003674
Platten, J., Egdane, J., and Ismail, A. (2013). Salinity tolerance, Na+ exclusion and allele mining of HKT1;5 in Oryza sativa and O. glaberrima: many sources, many genes, one mechanism. BMC Plant Biol. 13:32. doi: 10.1186/1471-2229-13-32
Potter, S. C., Luciani, A., Eddy, S. R., Park, Y., Lopez, R., and Finn, R. D. (2018). HMMER web server: 2018 update. Nucleic Acids Res. 46, W200–W204. doi: 10.1093/nar/gky448
Reddy, D. S., Bhatnagar-Mathur, P., Reddy, P. S., Cindhuri, K. S., Ganesh, A. S., and Sharma, K. K. (2016). Identification and validation of reference genes and their impact on normalized gene expression studies across cultivated and wild Cicer species. PLoS One 11:e0148451. doi: 10.1371/journal.pone.0148451
Ridge, S., Deokar, A., Lee, R., Daba, K., Macknight, R. C., Weller, J. L., et al. (2017). The chickpea Early Flowering 1 (Efl1) locus is an ortholog of Arabidopsis ELF3. Plant Physiol. 175, 802–815. doi: 10.1104/pp.17.00082
Roy, S. K. S., Hamid, A., Miah, M. G., and Hashem, A. (1996). Seed size variation and its effects on germination and seedling vigour in rice. J. Agron. Crop. Sci. 176, 79–82. doi: 10.1111/j.1439-037X.1996.tb00449.x
Ruperao, P. (2016). Analysis of the Chickpea Genome Using Next Generation Sequencing Data. Ph.D. thesis. Queensland: University of Queensland.
Saitou, N., and Nei, M. (1987). The neighbor-joining method, a new method for reconstructing phylogenetic trees. Mol. Biol. Evol. 4, 406–425. doi: 10.1093/oxfordjournals.molbev.a040454
Schneider, M., Gonzalez, N., Pauwels, L., Inzé, D., and Baekelandt, A. (2021). The PEAPOD pathway and its potential to improve crop yield. Trends Plant Sci. 26, 220–236. doi: 10.1016/j.tplants.2020.10.012
Singh, A. P., Pandey, B. K., Deveshwar, P., Narnoliya, L., Parida, S. K., and Giri, J. (2015). JAZ repressors, potential involvement in nutrients deficiency response in rice and chickpea. Front. Plant Sci. 6:975. doi: 10.3389/fpls.2015.00975
Singh, V. K., Khan, A. W., Jaganathan, D., Thudi, M., Roorkiwal, M., Takagi, H., et al. (2016). QTL-seq for rapid identification of candidate genes for 100-seed weight and root/total plant dry weight ratio under rainfed conditions in chickpea. Plant Biotechnol. J. 14, 2110–2119. doi: 10.1111/pbi.12567
Sivasakthi, K., Thudi, M., Tharanya, M., Kale, S. M., Kholová, J., Halime, M. H., et al. (2018). Plant vigour QTLs co-map with an earlier reported QTL hotspot for drought tolerance while water saving QTLs map in other regions of the chickpea genome. BMC Plant Biol. 18:29. doi: 10.1186/s12870-018-1245-1
Sloane, D. (1999). Early Vigour - Its Role in Enhancing the Productivity of Wheat Grown. Ph.D. thesis. Adelaide: University of Adelaide.
Staswick, P. E. (2008). JAZing up jasmonate signaling. Trends Plant Sci. 13, 66–71. doi: 10.1016/j.tplants.2007.11.011
Subbarao, G. V., Johansen, C., Slinkard, A. E., Rao, R. C., Saxena, N. P., Chauhan, Y. S., et al. (1995). Strategies for improving drought resistance in grain legumes. Crit. Rev. Plant Sci. 14, 469–523. doi: 10.1080/713608125
Swinnen, G., Baekelandt, A., Clercq, R. D., Doorsselaere, J. V., Gonzalez, N., Inzé, D., et al. (2020). KIX8 and KIX9 are conserved repressors of organ size in the asterid species tomato. bioRxiv [Preprint]. doi: 10.1101/2020.02.07.938977
Taylor, A., Teakle, G. R., Walley, P. G., Finch-Savage, W. E., Jackson, A. C., Jones, J. E., et al. (2019). Assembly and characterisation of a unique onion diversity set identifies resistance to Fusarium basal rot and improved seedling vigour. Theor. Appl. Genet. 132, 3245–3264. doi: 10.1007/s00122-019-03422-0
Tong, J. (2013). “BLOcks SUbstitution matrix (BLOSUM),” in Encyclopedia of Systems Biology, eds W. Dubitzky, O. Wolkenhauer, K. H. Cho, and H. Yokota (New York, NY: Springer), doi: 10.1007/978-1-4419-9863-7_942
Turner, N. C., Wright, G. C., and Siddique, K. (2001). Adaptation of grain legumes (pulses) to water-limited environments. Adv. Agron. 71, 193–231. doi: 10.1016/s0065-2113(01)71015-2
Vanholme, B., Grunewald, W., Bateman, A., Kohchi, T., and Gheysen, G. (2007). The tify family previously known as ZIM. Trends Plant Sci. 12, 239–244. doi: 10.1016/j.tplants.2007.04.004
Varshney, R. K., Song, C., Saxena, R. K., Azam, S., Yu, S., Sharpe, A. G., et al. (2013). Draft genome sequence of chickpea (Cicer arietinum) provides a resource for trait improvement. Nat. Biotechnol. 31, 240–246. doi: 10.1038/nbt.2491
Varshney, R. K., Thudi, M., Nayak, S. N., Gaur, P. M., Kashiwagi, J., Krishnamurthy, L., et al. (2014). Genetic dissection of drought tolerance in chickpea (Cicer arietinum L.). Theor. Appl. Genet. 127, 445–462. doi: 10.1007/s00122-013-2230-6
White, D. W. R. (2006). PEAPOD regulates lamina size and curvature in Arabidopsis. Proc. Natl. Acad. Sci. U.S.A. 103, 13238–13243. doi: 10.1073/pnas.0604349103
White, D. W. R. (2017). PEAPOD limits developmental plasticity in Arabidopsis. bioRxiv [Preprint]. doi: 10.1101/102707
Yusuf, C., Makate, N., and Jacob, R. (2014). Effect of seed size on germination and early growth of maize (Zea mays). Intern. J. Sci. Res. Public. 4, 1–3.
Zaman-Allah, M., Jenkinson, D. M., and Vadez, V. (2011). Chickpea genotypes contrasting for seed yield under terminal drought stress in the field differ for traits related to the control of water use. Funct. Plant Biol. 38, 270–281. doi: 10.1071/FP10244
Keywords: chickpea (Cicer arietinum L.), Ca4_TIFY4B, fine mapping, leaf size, seed size regulation, plant vigor, PEAPOD (PPD1/PPD2)
Citation: Nguyen DT, Hayes JE, Harris J and Sutton T (2022) Fine Mapping of a Vigor QTL in Chickpea (Cicer arietinum L.) Reveals a Potential Role for Ca4_TIFY4B in Regulating Leaf and Seed Size. Front. Plant Sci. 13:829566. doi: 10.3389/fpls.2022.829566
Received: 06 December 2021; Accepted: 13 January 2022;
Published: 24 February 2022.
Edited by:
Laurent Gentzbittel, Skolkovo Institute of Science and Technology, RussiaReviewed by:
Eric Von Wettberg, University of Vermont, United StatesCheng-Ruei Lee, National Taiwan University, Taiwan
Copyright © 2022 Nguyen, Hayes, Harris and Sutton. This is an open-access article distributed under the terms of the Creative Commons Attribution License (CC BY). The use, distribution or reproduction in other forums is permitted, provided the original author(s) and the copyright owner(s) are credited and that the original publication in this journal is cited, in accordance with accepted academic practice. No use, distribution or reproduction is permitted which does not comply with these terms.
*Correspondence: Julie E. Hayes, anVsaWUuaGF5ZXNAYWRlbGFpZGUuZWR1LmF1
†ORCID: Duong T. Nguyen, orcid.org/0000-0002-1252-5328; Julie E. Hayes, orcid.org/0000-0001-8716-5024; John Harris, orcid.org/0000-0003-4279-6126; Tim Sutton, orcid.org/0000-0002-9059-0774