 Yuanzuo Lv1,2
 Peng Gao1,2
 Shi Liu1,2
 Xufeng Fang1,2Taifeng Zhang1,2Tai Liu1,2
 Sikandar Amanullah1,2Xinying Wang1,2
 Feishi Luan1,2*
- 1Key Laboratory of Biology and Genetic Improvement of Horticulture Crops (Northeast Region), Ministry of Agriculture and Rural Affairs, Northeast Agricultural University, Harbin, China
- 2College of Horticulture and Landscape Architecture, Northeast Agricultural University, Harbin, China
Melon is an important Cucurbitaceae crop. Field observations had shown that the green stigmas of melon are more attractive to pollinators than yellow stigmas. In this study, F2 and F2:3 populations obtained by crossing MR-1 (green stigma) and M4-7 (yellow stigma) were used for genetic analysis and mapping. A genetic map of 1,802.49 cm was constructed with 116 cleaved amplified polymorphism sequence (CAPS) markers. Two stable quantitative trait loci (QTLs) linked to the trait of stigma color were identified on chromosomes 2 (SC2.1) and 8 (SC8.1), respectively. An expanded F2 population was used to narrow down the confidence regions of SC2.1 and SC8.1. As a result, SC2.1 was further mapped to a 3.6 cm region between CAPS markers S2M3 and S2B1-3, explaining 9.40% phenotypic variation. SC8.1 was mapped to a 3.7-cm region between CAPS markers S8E7 and S8H-1, explaining 25.92% phenotypic variation. This study broadens our understanding of the mechanisms of stigma color regulation and will be of benefit to the breeding of melon.
Introduction
The economic benefits of pollination are the primary determinants for fruits, vegetables, and seed production, which influence at least 87 leading food crops around the world (Kevan and Viana, 2003; Klein et al., 2007). Pollination is crucial for reproduction in flowering plants whereby the male gamete (pollen grains) from the anther comes into contact with the female gamete (stigma). Likewise, successful reproduction is highly dependent on efficient pollinators (Blacquiere, 2010).
The trichromatic vision of bees is known to effectively handle different photoreceptor classes (blue, green, and UV ranges) (Peitsch et al., 1992). The floral pattern at the center of a flower can guide pollinators in finding the nectar (Lunau et al., 1996; Dafni and Giurfa, 1999; Lunau, 2005; Davies et al., 2012). Therefore, the center of a flower is easily recognizable by bees (Biesmeijer et al., 2005; Davies et al., 2012).
There is an important feature of distinct stigma color in each female flower, which directly provides a great support in plant reproduction. However, stigma color is a neglected trait in many cultivars of different fruit crops but it significantly possesses enormous benefits for desired crop production using different molecular breeding approaches. It has been reported that the level of carotenoid biosynthetic genes is associated with the accumulation of carotenoids and the resultant stigma color in Crocus sativus (Ahrazem et al., 2019). Similarly, during the transition from yellow undeveloped to red fully developed stigmas, the accumulation of zeaxanthin occurred due to the expressions of CsPSY and CsLcyb (Castillo et al., 2005). In a stable inherited yellow stigma tomato mutant (ys) that was obtained using ethyl methane sulfonate, a single recessive gene was found to regulate the yellowing of stigma due to the accumulation of naringenin chalcone in ys (Zhao et al., 2017). In rice, two genes controlling the purple stigma were mapped on chromosomes 1 and 6 using 1,300 F2 populations that are derived from XQZ (purple stigma and red lemma tip) and Kitaake (white stigma and colorless lemma tip) (Wang, 2016).
Melon (Cucumis melo L., 2n = 24) is an attractive fruit crop due to the extreme divergences in phenotypic diversity with a reported production of more than 42 million tons globally in 2020 (FAOSTAT; http://faostat.fao.org). Melon flowers bear yellow petals and yellow to green stigmas, which are mostly pollinated by bees under the natural field conditions (Rodrigo Gomez et al., 2016). Therefore, the green stigma can be favorable over the yellow stigma for the production of desired fruits and seeds, aimed at different breeding purposes, respectively.
Compared to the traditional breeding approaches, the marker-assisted selection (MAS) system has been proved as a more effective strategy that is used for genetic mapping of different crop traits. Until now, not all the genetic components of melon cultivars have been dissected, and there is a dire need to investigate the genetic patterns and molecular mechanisms associated with desirable traits, which should be an important part of breeding programs, aimed at genetic improvement of crops. Therefore, this study was aimed at identifying the stable quantitative trait loci (QTLs) regulating the stigma color, using the respective mapping population of F2 and F2:3 families that are derived from the crossing of MR-1 (green stigma) and M4-7 (yellow stigma) melon lines, respectively. The present novel outcomes would be beneficial to provide the fundamental basis for the genetic understanding of melon stigma color trait.
Plant Materials
Two different parent lines of melon MR-1 (P1, female with green stigma) and M4-7 (P2, male with yellow stigma) were selected as experimental material (Figure 1) and crossed to produce their F1 progeny. The field experiments were performed in the plastic greenhouse at Xiang Yang Experiment Agricultural Station, Northeast Agricultural University, Harbin, China (lat. 44°04′N, long. 125°420′E) over 3 years (from 2019 to 2021). The plants were grown using a completely randomized design (CRD), and standard horticultural practices were adopted for successful germination.
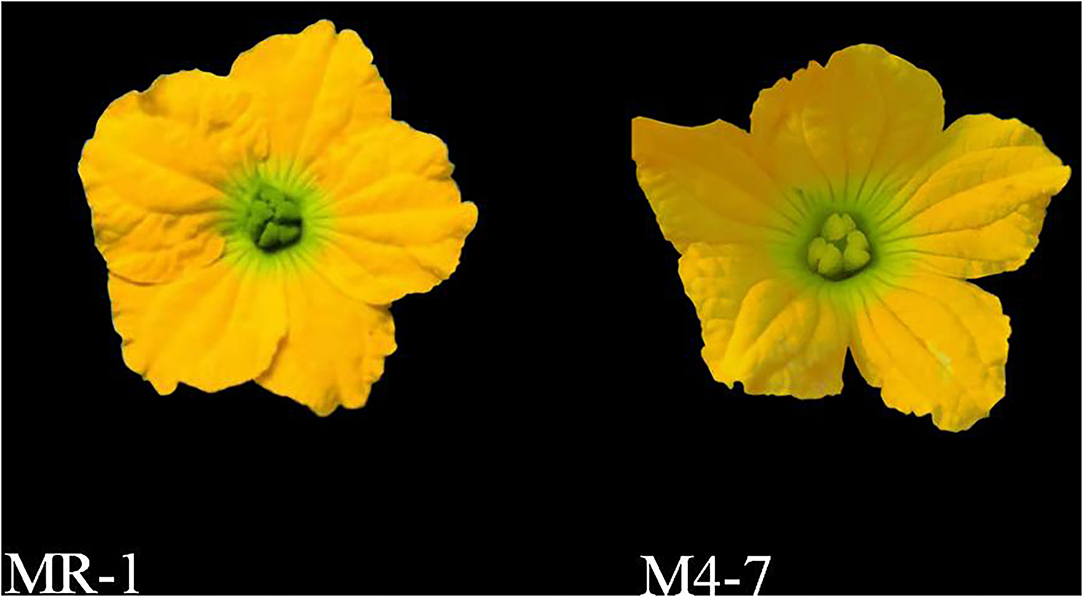
Figure 1. The primary phenotypes of MR-1 and M4-7.
In 2019, an F2 mapping population comprising 133 plants was obtained from the parental lines crossing, and 55 plants with extremely divergent phenotypes were self-crossed to get the respective F2:3 families. In 2020, all of the 55-F2:3 families (20 plants for each family and a total of 1,100 individuals) were planted to detect the stable QTLs associated with stigma color. In 2021, an expanded population of 545-F2 lines was also planted. In this study, fifteen (15) plants, each line for P1, P2, and F1, generations, were grown along with all generations and subsequently utilized for genetic linkage analysis of melon stigma color.
Observation of Flower-Visiting Insects
The observation site was located in Harbin, Heilongjiang Province, China. The numbers of flower-visiting insects on the stigmas of both parent lines “MR-1 and M4-7” were visually observed during the peak flowering. The flowers were observed on daily basis from 7:30 up to 9:30 am and photos were taken for 3 consecutive days using a Gopro7 camera in the time-lapse mode.
Phenotypic Data Collection
The stigmas of respective flowers of F2 and F2:3 mapping populations were checked, three stigmas from each plant were chosen, and color phenotypes were collected from three flower repetitions using a 3NQ portable colorimeter (NR10QC). The respective color hues of “L,” “A,” and “B” were recorded, where “L” indicated lightness, “A” indicates red-green difference, “B” indicates yellow-blue difference, and “E” denoted the net color difference. The final three-dimensional orthogonal graph was plotted using the color phenotypes, and color difference “E” was calculated for each plant according to the following equation:
Whole Genome Re-sequencing and Markers Development
The leaf material (0.2 g) was taken from 2-week-old seedlings of P1, P2, F1, and F2 progeny, chilled in cryogenic liquid nitrogen, and freshly stored at −80°C. Then, high-quality DNA was isolated using the cetyl trimethyl ammonium bromide (CTAB) protocol with slight modifications. The quantified DNA was identified with 1% agarose gels electrophoresis fragmented with Bioruptor (Thermo Fisher Scientific, USA), and 200–300 bp fragments were prepared for the High-throughput Illumina™ X10 sequencing platform. The resultant clean end bases of paired-end sequencing of both parent lines were aligned to de novo assembled reference genome (DHL92, v3.5.1) of melon using the default algorithm of Burrows-Wheeler Aligner (BWA)-Maximal Exact Match (MEM) (https://sourceforge.net/projects/bio-bwa/files/). The Binary Alignment/Map (BAM) files were similarly used for the filtering and alignment of re-sequenced clean end bases. The major single-nucleotide polymorphisms (SNPs) were obtained and annotated using the SnpEff tool (v4.3), then 500 bp flanking sequences were extracted from each random SNP site.
The cleaved amplified polymorphism sequence (CAPS) markers were developed by identifying the suitable SNP-based restriction endonucleases (EcoRI, HindIII, PstI, BamHI, and BclI) using SNP2CAPS v0.6 and primer premier v6, respectively (Amanullah et al., 2020). The PCR products of each CAPS marker were digested with restriction endonucleases to verify the codominant polymorphism of each marker. The PCR reaction mixture was prepared as follows: a pair of primers (8–10 pmol), deoxynucleotide triphosphates (dNTPs) (0.25 mM), Taq buffer (10×), and Taq polymerase (1 unit). A thermocycler PCR was performed by preheating the samples at 94°C for 7 min, followed by 30 cycles of 30 s at 94°C, 30 s at 60°C for the first cycle, and a stepwise down-gradient of 0.5°C per cycle, followed by 60 s at 72°C. Then, 10 cycles of 30 s at 94°C, 30 s at 45°C, and 60 s at 72°C were performed, followed by elongation for 5 min at 72°C. For enzyme digestion, a reaction mixture consisted of 4 μl of PCR product, 4.8 μl of ddH2O, 1 μl of CutSmart buffer, and 0.2 μl of restriction enzymes and was incubated at 37°C for 4 h. The digested products were subsequently cleaved by 1% agarose gel electrophoresis.
Linkage Mapping and QTL Analysis
A genetic linkage map was developed and QTLs were mapped by using the default parameter settings of the IciMapping (v4.2) tool as followed (Meng et al., 2015). All the genotyped CAPS markers were evenly scattered across the whole genome chromosomes. The coded genotypic data of respective F2 mapping populations were grouped and anchored over the whole genome chromosomes according to their exact physical positions and maximum likelihood means. The default chi-squared method and Kosambi's mapping function were selected to determine the segregation ratio of genotypic markers and to estimate the genetic distances, intervals, and positions at p (>0.001). The significant QTLs were defined above the threshold level of the default logarithm of odd (LOD) score (3.00) and the genome-wide type I error at α = 0.05.
qRT-PCR Analysis
Total RNAs were extracted using DiNing DP230-01 Plant Total RNA Purification Kit following the manufacturer's protocol (DiNing Biotech, Beijing, China). The qRT-PCR was performed on RNA extracted from the stigma of MR-1 and M4-7 on the day the female flowers were opened using the Actin gene as MELO03C023264. For qRT-PCR, assays were prepared using 20 ng cDNA and 300 nM of each primer in a 10 μl of reaction mixture with the addition of SYBR Green I Master Mix. qRT-PCR was performed using three biological replicates for each tissue sample and at least three technical replicates of each biological replicate. After normalization of the transcript level of each gene with the most suitable internal control gene for each sample, fold change was calculated by a 2−ΔΔCT method.
Results
Pollinator Observation
We observed that some flower-visiting insects generally fed on flowers for pollen and nectar, while some insects only stayed on flowers with no further activity (Figure 1). The most frequent pollinators were Apidae (bees), followed by Muscidae (flies). The proportion of visiting pollinators for green stigma melon (MR-1) was three times more than that of yellow stigma melon (M4-7) (Table 1).
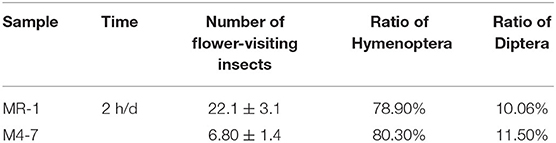
Table 1. Visitation of flower visiting insects in melons with different stigma colors.
Genetic Analysis of Melon Stigma Color
“Lab” color space is based on the human eye's perception of color and could represent the colors observed by the human eye. The “E” values of MR-1 and M4-7 stigmas were measured for 3 consecutive years and the data obtained were stable, with the “E” value of M4-7 being consistently higher than that of MR-1 (Supplementary Table S1). According to Figure 2, the “E” value displays continuous variation among F2 individuals and follows a normal distribution, suggesting that melon stigma color is controlled by quantitative loci. Besides, there is no color difference between the stigmas in one plant individual.
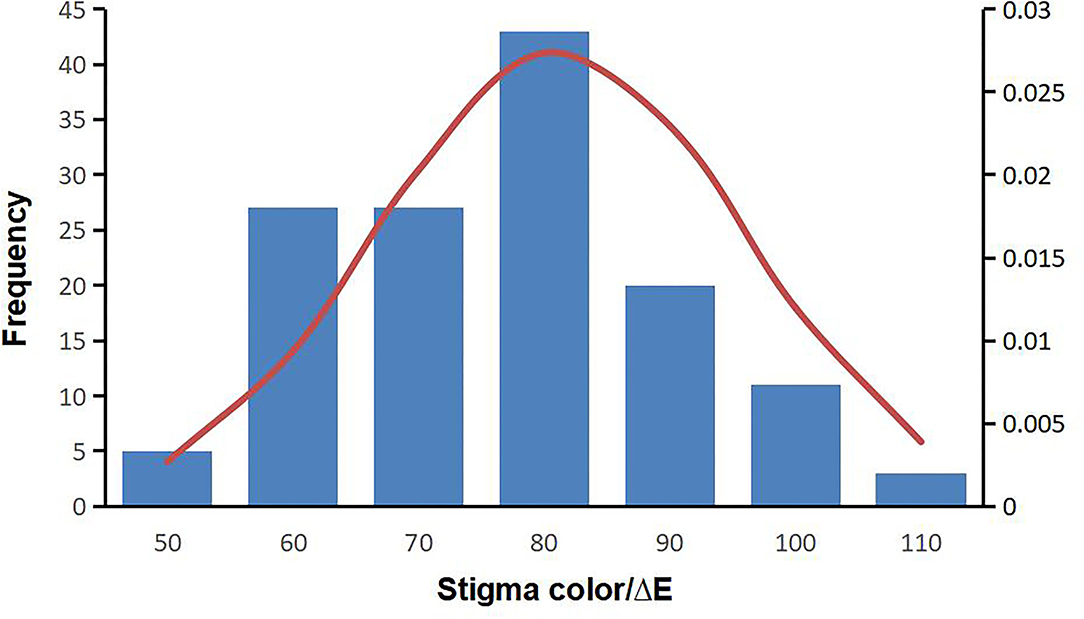
Figure 2. Frequency histogram of stigma E value of the F2 population in 2019.
Linkage Map Construction and Primary Mapping
In 2019, a total of 116 CAPS markers were effectively developed and genotyped for linkage mapping, which spanned a total of 1802.49 cm length with an average of 15.54 cm over the whole genome chromosomes (Figure 3). The chromosome 8 showed the least number of CAPS markers and total of 8 polymorphic markers covered 183.88 cm length and separated with an average genetic distance of 8.32 cm; however, chromosome 12 exhibited more CAPS markers comprising 12 CAPS markers, which covered 174 cm length with an average distance of 14.06 cm between each marker.
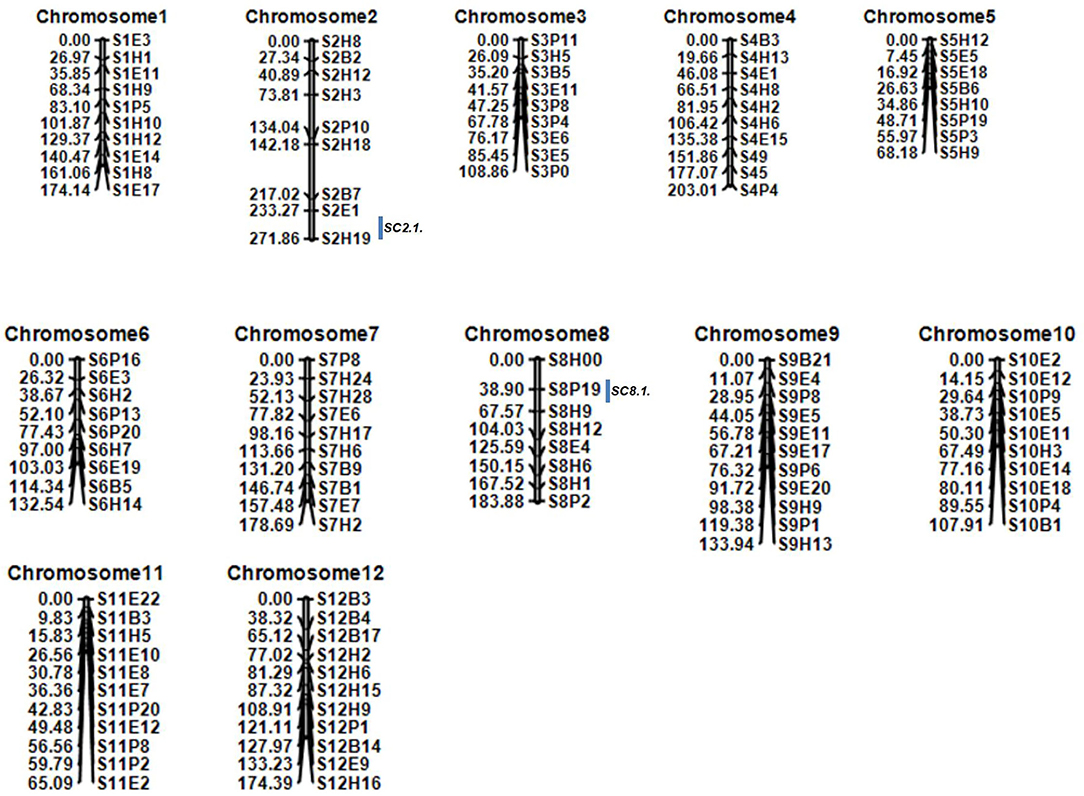
Figure 3. A constructed linkage map of melon chromosomes based on the F2 mapping population of a cross between parental lines “MR-1 and M4-7.” The box to the right of the chromosomes indicates the stable quantitative trait loci (QTL) identified as associated with stigma color by 2 years of data.
Quantitative trait locus analysis exposed that three QTLs, SC2.1, SC5.1, and SC8.1, were mapped on chromosomes 2, 5, and 8, respectively (Table 2). SC2.1 was mapped on the genetic position of chromosome 2 between flanking markers S2E1 and S2H19 with 5.92% phenotypic variance explained (PVE) and LOD value of 5.54, SC5.1 was located on chromosome 5 between adjacent markers S5H10 and S5P3 with 12.30% PVE and LOD value of 3.90, and SC8.1 was mapped on chromosome 8 between S8P19 and S8H9 with 23.18% PVE and LOD value of 14.29, respectively.
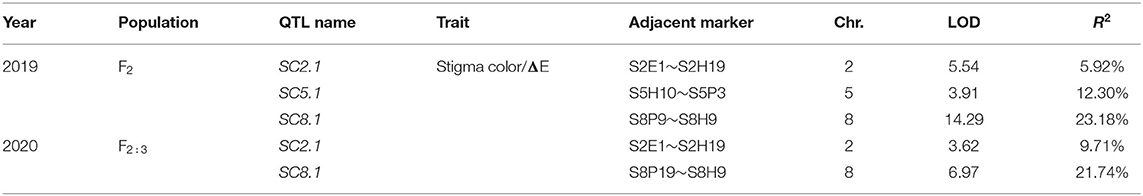
Table 2. Quantitative traits locus (QTL) analysis of melon stigma color using F2 population and F2:3 population, respectively.
In 2020, the F2:3 lines were generated from the same F2 self-crosses and the genetic map was re-constructed to verify the stable QTLs. Then, two stable QTLs, SC2.1 and SC8.1, were found to be consistent with the F2 mapping population (Table 2); SC2.1 explained somewhat lower phenotypic variation (9.71%) with an LOD value of 3.6 and was positioned between markers S2E1 and S2H19. Meanwhile, SC8.1 explained a high phenotypic variation (21.74%) with the LOD value of 6.97 between markers S8P19 and S8H9, respectively.
In 2021, we developed five new CAPS markers in the detected QTL regions (Table 3) and further validated that both candidate QTLs, SC2.1 and SC8.1, were associated with stigma color. For this purpose, phenotypic data of an expanded mapping population comprising 545 F2 individuals were incorporated for QTL analysis (Table 4). The confidence region of SC2.1 explained 9.40% phenotypic variation and further delimited to 3.6 cm and physical position from 24,730,977 to 25,015,025 bp exhibited 180 kb interval between flanking markers S2M3 and S2B1-2 (Figure 4). The confidence interval (CI) of SC8.1 explained 25.92% phenotypic variation in the enlarged mapping population, further narrowed down to a 3.7 cm region, which corresponded to a 138 kb interval (from 30,395,830 to 30,532,659 bp) between markers S8H-1 and S8E-7 (Figure 5), respectively.
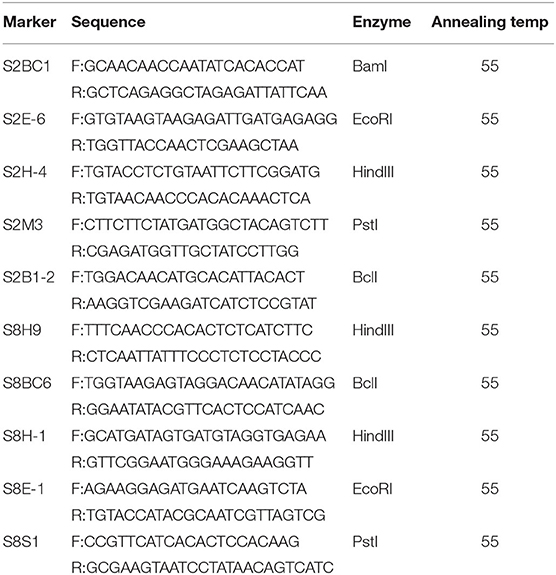
Table 3. Detailed information of the new polymorphic cleaved amplified polymorphism sequence (CAPS) markers within SC2.1 and SC8.1.

Table 4. Quantitative traits locus (QTL) analysis of melon stigma color using expanded F2 population.
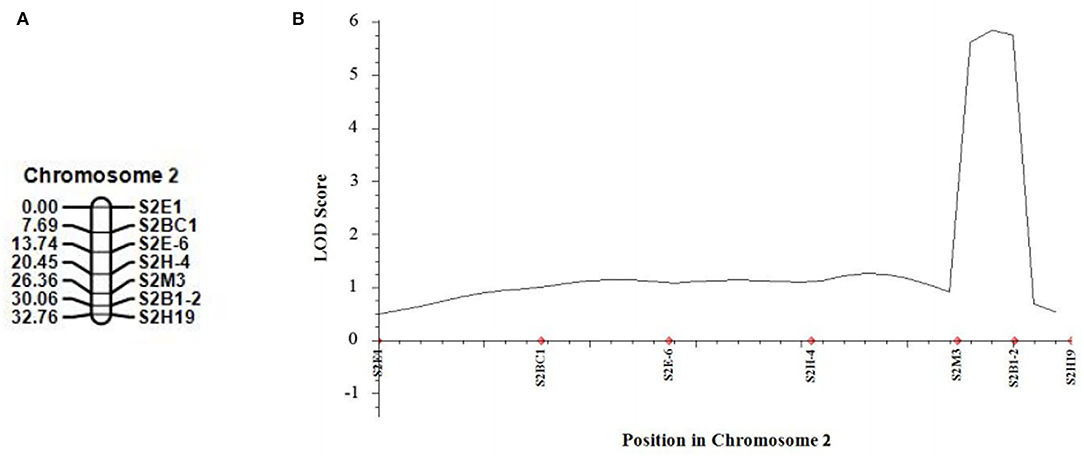
Figure 4. Validation of the stigma color quantitative trait loci (QTL) in melon. (A) Linkage map of melon chromosome 2, based on 540 F2 individuals derived from a cross between MR-1 and M4-7. (B) QTL curve for melon stigma color.
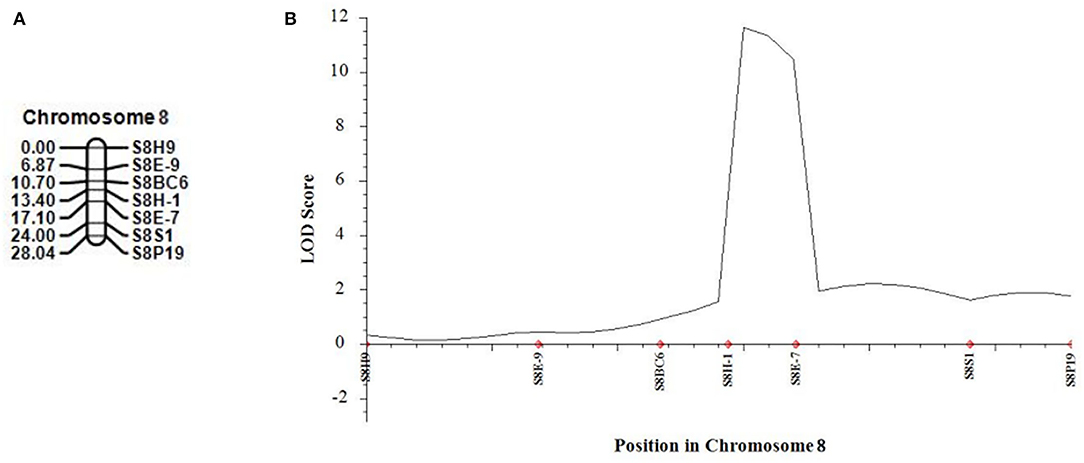
Figure 5. Validation of the stigma color quantitative trait loci (QTLs) in melon. (A) Linkage map of melon chromosome 8 based on 540 F2 individuals derived from parental lines crossing. (B) QTL curve for melon stigma color.
A pairwise combination of the genotypes of SC2.1 and SC8.1 in the F2 population was analyzed in 2019 and 2021 (Figure 6A). The genotype of candidate QTLs SC2.1 and SC8.1 in MR-1 with green stigma was AA while for M4-7 with the yellow stigma it was BB (the genotypes of SC2.1 and SC8.1 being indicated by markers S2H9 and S8P19), respectively. The AA genotypes of SC2.1+SC8.1 depicted that the “E” value was significantly lower as compared to BB genotypes, and the stigma color showed a natural tendency of green color. In contrast, the stigma color inclined to yellow when the genotype of SC2.1+SC8.1 was BB; however, when the genotype of SC2.1+SC8.1 was heterozygous, the “E” value was generally reported at the intermediate level. These findings support our claim that SC2.1 and SC8.1 jointly affected melon stigma color.
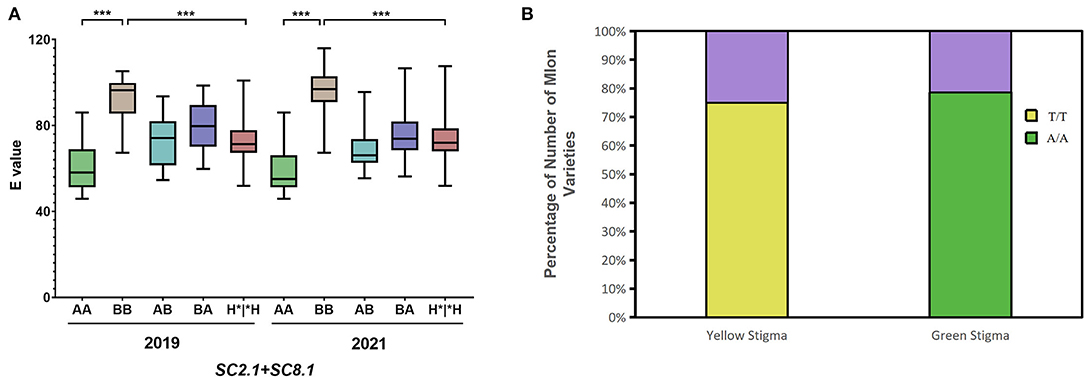
Figure 6. Genotype analysis of quantitative trait locus (QTL) and candidate gene (MELO03C003165). (A) The combined genotype and phenotype of SC2.1+SC8.1 in F2 individuals were recorded in 2019 and 2021. In the horizontal coordinates, the former genotype belongs to SC2.1, the latter genotype belongs to SC8.1, and H*|*H represents the genotype containing H. (B) Relationship between genotype and stigma color of the MELO03C003165 alleles in 110 melon varieties. The purple color shows the proportion of genotype and phenotype inconsistencies, Yellow and green show the proportion of genotype and phenotype concordance.
Analysis of Predicted Candidate Genes
A total of 10 and 26 genes with non-synonymous SNPs (nsSNPs) were identified as putative genes positioned on chromosomes 2 and 8 (Tables 5, 6), and qRT-PCR was performed to identify the potential genes controlling stigma color, respectively (Supplementary Figure S1). A single gene (MELO03C003165) exhibited the significant differential expression profiling between parental lines at a 138 kb CI of SC8.1 (Figure 7). In addition, a total of 6 genes exhibited significant differential expressions at a 180 kb CI of SC2.1.
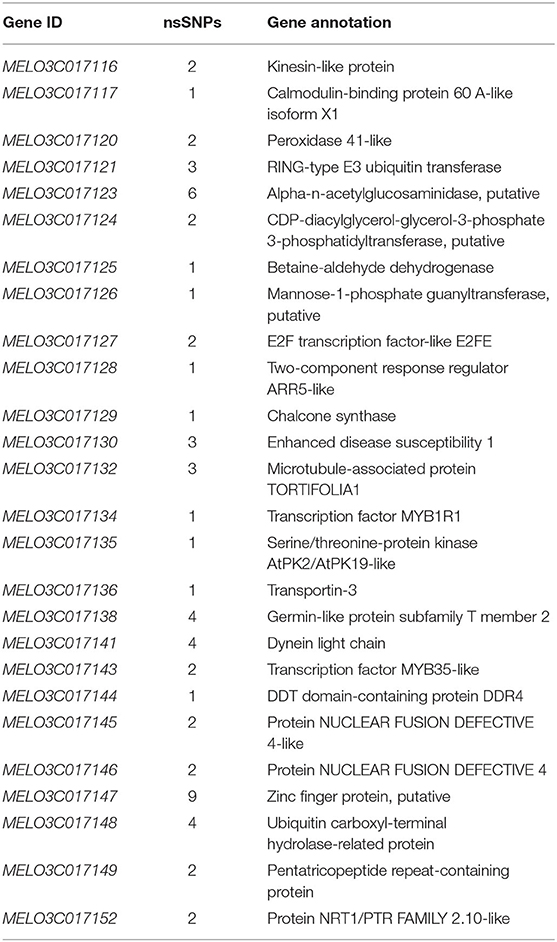
Table 5. Predicted 26 genes with non-synonymous single-nucleotide polymorphisms (SNPs) between markers S2M3 and S2B1-2.
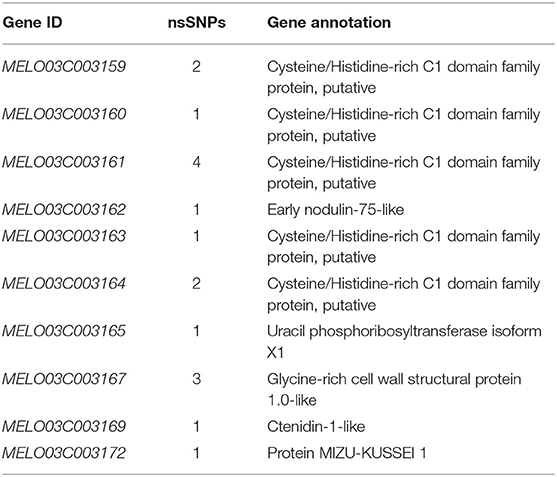
Table 6. Predicted 10 genes with non-synonymous single-nucleotide polymorphisms (SNPs) between markers S8P19 and S8H9.
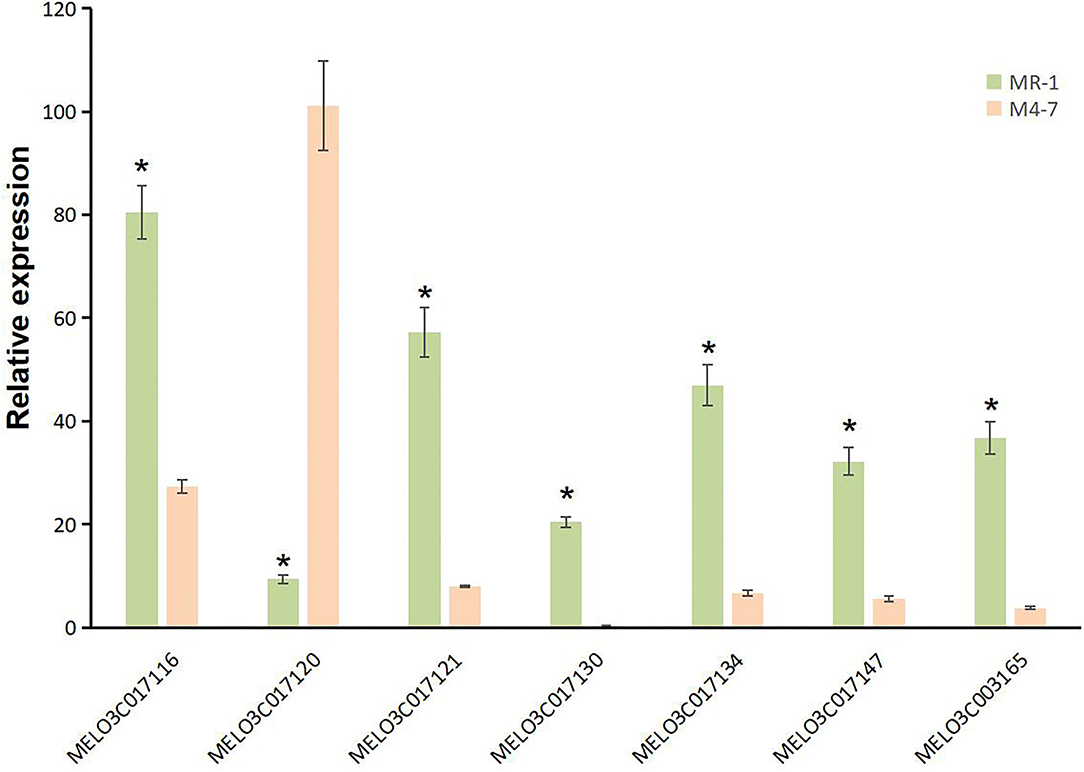
Figure 7. Expression analysis for candidate genes with non-synonymous single-nucleotide polymorphisms (SNPs) on chromosome 2 (MELO03C017116, MELO03C017120, MELO03C017121, MELO03C017130, MELO03C017134, and MELO03C017147) and chromosome 8 (MELO03C017165). * represents the presence of significant differences.
The new marker 8B-13 used in 2021 is derived from the major effective QTL GS8.1 obtained from another set of mapping populations used in a previous report from our lab (Qiao et al., 2021). Interestingly, QTLs representing the similar positions were obtained from two different populations, leading us to conclude that SC8.1 is a stable QTL, which could have a major contribution to the regulation of stigma color. The gene MELO03C003165 located in GS8.1 also displayed the same nsSNP mutation site (SNP30, 467, 367), which was located in the exon region at 30,467,367th bp position. In MR-1, a base encodes leucine (Leu), whereas this base is mutated as T in the M4-7 line and significantly resulted in an amino acid change from Leu to histidine (His). Therefore, we analyzed MELO03C003165 alleles across 110 melon varieties with different stigma colors (40 yellow stigmas and 70 green stigmas) and similarly checked the relationship between alleles and phenotype differences (Supplementary Table S2). The results showed that 78% of green stigma varieties had the same genotype with MR-1 and 75% of yellow stigma varieties had the same genotype with M4-7 (Figure 6B).
Discussion
The stigma color phenotype is often considered as a communication signal for natural pollinators of flowers, and its differential diversity is driven by the natural selection process. At the physiological level, pigment content accumulation and chloroplast development are associated with differential coloration in higher plants (Yang et al., 2015). Different concentrations of chlorophyll and carotenoid components were known to cause a variety of colors in cucurbit fruits (Henderson et al., 1998; Burger et al., 2010; Zhang et al., 2016).
Development and usage of bi-parental F2 population are known as a conventional and rapid method to identify the significant putative genes regulating the important traits. The size of F2 mapping population can reduce the influence of environmental factors and reduce the biasness of accurate findings (Amanullah et al., 2021). In this study, we used fairly good mapping populations of F2 and F2:3 families and effectively identified two stable QTLs in chromosomes 2 and 8, harboring the potential genes associated with stigma color. Further, genetic mapping in the expanded F2 population also signified the delimited target regions of SC2.1 and SC8.1, respectively.
The QTL SC8.1 was consistent with the genetic position of major QTL GS8.1 that is reported in the previous report of our lab (Qiao et al., 2021), which similarly suggested the conservation of genetic mechanisms governing stigma color across distinct germplasms in melon. The gene MELO03C003165 was the only gene with nsSNP mutation locus in both candidate QTLs (SC8.1 and GS8.1) (Table 6). However, this gene exhibited to encode the uracil phosphoribosyl transferase (UPRT), triggered the plastid levels (Mainguet et al., 2009). The UK/UPRT has a dual role in coding both uridine kinase and uracil phosphoribosyltransferase that form uridine 5′-monophosphate (UMP) through the pyrimidine salvage pathway in Arabidopsis and regulates chlorophyll content in plants (Islam et al., 2007; Mainguet et al., 2009).
Further, our RT-qPCR analysis revealed 6 candidate genes harboring putative involvement in stigma color and similarly have explicit description, e.g., MELO03C017116, MELO03C017120, MELO03C017121, MELO03C017130, MELO03C017134, and MELO03C017147 (Table 5). The gene MELO03C017116 encodes kinesin-like protein (KAC), which is required for chloroplast dispersion within the cell under standard culture conditions (Suetsugu et al., 2012). In addition, KACs mediate the chloroplast light evasion response in an actin dependent (Shen et al., 2015). The gene MELO03C017120 encodes peroxidase, which mediates chlorophyll degradation in the chloroplast or vacuole in the presence of phenolic compounds, such as apigenin (Yamauchi et al., 2004). The gene MELO03C017121 encodes ring-type E3 ubiquitin transferase, which is homologous to the rice GW2 gene encoding ring-type E3 ubiquitin transferase. The earlier studies have confirmed that OsGW2 controlled the chlorophyll content with positive regulation of leaf senescence through genetic analysis of a knockout mutant (Shim et al., 2020). The gene MELO03C017130 encodes enhanced disease susceptibility 1 (EDS1), which has been shown to affect many biological processes, such as chlorophyll content and reactive oxygen species (ROS) metabolism in annual plants (Arabidopsis thaliana) and woody plants (Populus tremula L. × P. tremuloides) (Su et al., 2014; Bernacki et al., 2018). The gene MELO03C017134 encodes transcription factor MYBR1, and loss-of-function in Arabidopsis plants showed more rapid chlorophyll loss and senescence (Jaradat et al., 2013). The gene MELO03C017147 encodes zinc finger protein, and it has been reported that overexpression of zinc-finger protein gene (such as RHL41, AtZFP1) resulted in an increase in chlorophyll content of Arabidopsis (Kazuoka et al., 2010; Han et al., 2014). PSA2 is a member of the DnaJ-like zinc finger domain protein family that affects the light acclimation and chloroplast development (Wang et al., 2016). In conclusion, further screening of our candidate genes using more rigorous methodologies will provide more light in this direction.
At present, we infer that the difference in the stigma color of melon might be caused by the difference in total chlorophyll content in accordance with our results. There are other studies with similar results, chlorophyll deficiency in mutant tomato fruits triggered the yellowish skin color due to abnormal chloroplast development (Liu et al., 2021). At higher latitudes, some cucumbers are naturally subjected to a longer time for photosynthesis and chlorophyll synthesis, which results in green flesh color (Bo et al., 2019). However, the involvement of candidate genes in the synthesis and degradation of chlorophyll similarly indicate the specific biological pathway responsible for the differences in color of melon stigma, which need to be further investigated.
In addition, our field observations confirmed this favored behavior in bees feeding on melon flowers and showed a preference to visit the flowers with green stigma than flowers with yellow stigma. This confirms beyond the doubt that green stigmas are of greater value to melons both for farming and breeding programs. Thus, novel outcomes would be beneficial to provide the fundamental basis for the in-depth genetic understanding of the melon stigma color traits.
Data Availability Statement
The original contributions presented in the study are included in the article/Supplementary Material, further inquiries can be directed to the corresponding author.
Author Contributions
YL performed the experiment, data curation, formal analysis, manuscript draft, and reviewed and edited the manuscript. PG and SL guided for the theoretical and practical experiments. XF, TZ, TL, and XW helped in formal analysis. SA reviewed and edited the manuscript language. FL supervised the research project and reviewed and edited the manuscript. All authors approved the final version of manuscript and disclosed no conflicts of interest.
Funding
This work was supported by the National Nature Science Foundation of China (31772331 and 32030094), the China Agriculture Research System of MOF and MARA (CARS-25), and Taishan Industrial Leading Talents Project [grant no. LJNY202112].
Conflict of Interest
The authors declare that the research was conducted in the absence of any commercial or financial relationships that could be construed as a potential conflict of interest.
Publisher's Note
All claims expressed in this article are solely those of the authors and do not necessarily represent those of their affiliated organizations, or those of the publisher, the editors and the reviewers. Any product that may be evaluated in this article, or claim that may be made by its manufacturer, is not guaranteed or endorsed by the publisher.
Supplementary Material
The Supplementary Material for this article can be found online at: https://www.frontiersin.org/articles/10.3389/fpls.2022.865082/full#supplementary-material
References
Ahrazem, O., Diretto, G., Picazo, J. A., Fiore, A., Rubio-Moraga, A., Rial, C., et al. (2019). The specialized roles in carotenogenesis and apocarotenogenesis of the phytoene synthase gene family in saffron. Front. Plant Sci. 10, 249. doi: 10.3389/fpls.2019.00249
Amanullah, S., Gao, P., Osae, B. A., Saroj, A., Yang, T., Liu, S., et al. (2021). Genetic linkage mapping and QTLs identification for morphology and fruit quality related traits of melon by SNP based CAPS markers. Sci. Hortic. 278, 109849. doi: 10.1016/j.scienta.2020.109849
Amanullah, S., Saroj, A., Osae, B. A., Liu, S., Liu, H., Gao, P., et al. (2020). Detection of putative QTL regions associated with ovary traits in melon using SNP-CAPS markers. Sci. Hortic. 270, 109445. doi: 10.1016/j.scienta.2020.109445
Bernacki, M. J., Czarnocka, W., Witon, D., Rusaczonek, A., Szechynska-Hebda, M., Slesak, I., et al. (2018). Enhanced disease susceptibility 1 (EDS1) affects development, photosynthesis, and hormonal homeostasis in hybrid aspen (Populus tremula L. x P. tremuloides). J. Plant Physiol. 226, 91–102. doi: 10.1016/j.jplph.2018.04.014
Biesmeijer, J. C., Giurfa, M., Koedam, D., Potts, S. G., Joel, D. M., and Dafni, A. (2005). Convergent evolution: floral guides, stingless bee nest entrances, and insectivorous pitchers. Sci. Nat. 92, 444–450. doi: 10.1007/s00114-005-0017-6
Blacquiere, T. (2010). Pesticide risk to wild pollinators: workshop report [Report]. Wageningen University and Research Centre. Vol. 5. p. 17–20.
Bo, K., Wei, S., Wang, W., Miao, H., and Gu, X. (2019). Qtl mapping and genome-wide association study reveal two novel loci associated with green flesh color in cucumber. BMC Plant Biol. 19, 243. doi: 10.1186/s12870-019-1835-6
Burger, Y., Paris, H. S., Cohen, R., Katzir, N., Tadmor, Y., Lewinsohn, E., et al. (2010). Genetic diversity of Cucumis melo. Hortic. Rev. 36, 165–198. doi: 10.1002/9780470527238.ch3
Castillo, R., Fernandez, J. A., and Gomez-Gomez, L. (2005). Implications of carotenoid biosynthetic genes in apocarotenoid formation during the stigma development of crocus sativus and its closer relatives. Plant Physiol. 139, 674–689. doi: 10.1104/pp.105.067827
Dafni, A., and Giurfa, M. (1999). The functional ecology of floral guides in relation to insects behaviour and vision. Evol. Theory Processes Mod. Perspect. 363–383. doi: 10.1007/978-94-011-4830-6_23
Davies, K. M., Albert, N. W., and Schwinn, K. E. (2012). From landing lights to mimicry: the molecular regulation of flower colouration and mechanisms for pigmentation patterning. Funct. Plant Biol. 39, 619–638. doi: 10.1071/FP12195
Han, G. L., Wang, M. J., Yuan, F., Sui, N., Song, J., Wang, B. S., et al. (2014). The CCCH zinc finger protein gene AtZFP1 improves salt resistance in Arabidopsis thaliana. Plant Mol. Biol. 86, 237–253. doi: 10.1007/s11103-014-0226-5
Henderson, W. R., Scott, G. H., and Wehner, T. C. (1998). Interaction of flesh color genes in watermelon. J. Hered 89, 50–53. doi: 10.1093/jhered/89.1.50
Iida, A., Kazuoka, T., Torikai, S., Kikuchi, H., and Oeda, K. (2010). A zinc finger protein RHL41 mediates the light acclimatization response in Arabidopsis. Plant J. 24, 191–203. doi: 10.1046/j.1365-313x.2000.00864.x
Islam, M. R., Kim, H., Kang, S. W., Kim, J. S., Leong, Y. M., Hwang, H. J., et al. (2007). Functional characterization of a gene encoding a dual domain for uridine kinase and uracil phosphoribosyltransferase in Arabidopsis thaliana. Plant Mol. Biol. 63, 465–477. doi: 10.1007/s11103-006-9101-3
Jaradat, M. R., Feurtado, J. A., Huang, D., Lu, Y., and Cutler, A. J. (2013). Multiple roles of the transcription factor AtMYBR1/AtMYB44 in ABA signaling, stress responses, and leaf senescence. BMC Plant Biol. 13, 192. doi: 10.1186/1471-2229-13-192
Kevan, P. G., and Viana, B. F. (2003). The global decline of pollination services. Biodiversity 4, 3–8. doi: 10.1080/14888386.2003.9712703
Klein, A. M., Vaissiere, B. E., Cane, J. H., Steffan-Dewenter, I., Cunningham, S. A., Kremen, C., et al. (2007). Importance of pollinators in changing landscapes for world crops. Proc. Biol. Sci. 274, 303–313. doi: 10.1098/rspb.2006.3721
Liu, G. Z., Yu, H. Y., Yuan, L., Li, C., and Zhang, Y. (2021). SIRCM1, which encodes tomato Lytescent1, is required for chlorophyll synthesis and chloroplast development in fruits. Hortic. Res. 8, 14. doi: 10.1038/s41438-021-00563-6
Lunau, K. (2005). Stamens and mimic stamens as components of floral colour patterns. Bot. Jahrb. Syst. 127, 13–41. doi: 10.1127/0006-8152/2006/0127-0013
Lunau, K., Wacht, S., and Chittka, L. (1996). Colour choices of naive bumble bees and their implications for colour perception. J. Comp. Physiol. A. 178, 477–489. doi: 10.1007/BF00190178
Mainguet, S. E., Gakière, B., Majira, A., Pelletier, S., Bringel, F., Guérard, F., et al. (2009). Uracil salvage is necessary for early Arabidopsis development. Plant J. 60, 280–291. doi: 10.1111/j.1365-313X.2009.03963.x
Meng, L., Li, H., Zhang, L., and Wang, J. (2015). QTL Ici mapping: integrated software for genetic linkage map construction and quantitative trait locus mapping in biparental populations. Crop J. 3, 269–283. doi: 10.1016/j.cj.2015.01.001
Peitsch, D., Fietz, A., Hertel, H., Desouza, J., Ventura, D. F., and Menzel, R. (1992). The spectral input systems of hymenopteran insects and their receptor-based color-vision. J. Compar. Physiol. Sensory Neural Behav. Physiol. 170, 23–40. doi: 10.1007/BF00190398
Qiao, A. H., Fang, X. F., Liu, S., Liu, H. Y., Gao, P., et al. (2021). QTL-seq identifies major quantitative trait loci of stigma color in melon. Hortic. Plant J. 7, 318–326. doi: 10.1016/j.hpj.2021.01.004
Rodrigo Gomez, S., Ornosa, C., Selfa, J., Guara, M., and Polidori, C. (2016). Small sweat bees (hymenoptera: halictidae) as potential major pollinators of melon (Cucumis melo) in the mediterranean. Entomol. Sci. 19, 55–66. doi: 10.1111/ens.12168
Shen, Z. Y., Liu, Y. C., Bibeau, J. P., Lemoi, K. P., Tuzel, E., Vidali, L., et al. (2015). The kinesin-like proteins, KAC1/2, regulate actin dynamics underlying chloroplast light-avoidance in Physcomitrella patens. J. Integr. Plant Biol. 57, 106–119. doi: 10.1111/jipb.12303
Shim, K. C., Kim, S. H., Jeon, Y. A., Lee, H. S., Adeva, C., Kang, J. W., et al. (2020). A ring-type E3 ubiquitin ligase, OsGW2, controls chlorophyll content and dark-Induced senescence in rice. Int. J. Mol. Sci. 21, 1704. doi: 10.3390/ijms21051704
Su, X. F., Qi, X. L., and Cheng, H. M. (2014). Molecular cloning and characterization of enhanced disease susceptibility 1 (EDS1) from Gossypium barbadense. Mol. Biol. Rep. 41, 3821–3828. doi: 10.1007/s11033-014-3248-9
Suetsugu, N., Sato, Y., Tsuboi, H., Kasahara, M., Imaizumi, T., Kagawa, T., et al. (2012). The KAC family of kinesin-like proteins is essential for the association of chloroplasts with the plasma membrane in land plants. Plant Cell Physiol. 53, 1854–1865. doi: 10.1093/pcp/pcs133
Wang, C. H. (2016). Fine mapping and Cloning of purple stigma gene in rice (Oryza sativa L.) (master's thesis). Beijing: Chinese Academy of Agricultural Sciences.
Wang, Y. W., Chen, S. M., Wang, W. J., Huang, X. Q., Zhou, C. F., Zhuang, Z., et al. (2016). The dnaJ-like zinc finger domain protein PSA2 affects light acclimation and chloroplast development in arabidopsis thaliana. Front. Plant Sci. 7, 360. doi: 10.3389/fpls.2016.00360
Yamauchi, N., Funamoto, Y., and Shigyo, M. (2004). Peroxidase-mediated chlorophyll degradation in horticultural crops. Phytoche. Rev. 3, 221–228. doi: 10.1023/B:PHYT.0000047796.98784.06
Yang, Y. X., Chen, X. X., Xu, B., Li, Y. X., Ma, Y. H., and Wang, G. G. (2015). Phenotype and transcriptome analysis reveals chloroplast development and pigment biosynthesis together influenced the leaf color formation in mutants of Anthurium andraeanum'Sonate'. Front. Plant Sci. 6, 139. doi: 10.3389/fpls.2015.00139
Keywords: melon, stigma color, gene mapping, CAPS markers, chlorophyll
Citation: Lv Y, Gao P, Liu S, Fang X, Zhang T, Liu T, Amanullah S, Wang X and Luan F (2022) Genetic Mapping and QTL Analysis of Stigma Color in Melon (Cucumis melo L.). Front. Plant Sci. 13:865082. doi: 10.3389/fpls.2022.865082
Received: 29 January 2022; Accepted: 28 March 2022;
Published: 09 May 2022.
Edited by:
Pei Xu, China Jiliang University, ChinaReviewed by:
Jianbin Hu, Henan Agricultural University, ChinaKailiang Bo, Insititute of Vegetables and Flowers (CAAS), China
Copyright © 2022 Lv, Gao, Liu, Fang, Zhang, Liu, Amanullah, Wang and Luan. This is an open-access article distributed under the terms of the Creative Commons Attribution License (CC BY). The use, distribution or reproduction in other forums is permitted, provided the original author(s) and the copyright owner(s) are credited and that the original publication in this journal is cited, in accordance with accepted academic practice. No use, distribution or reproduction is permitted which does not comply with these terms.
*Correspondence: Feishi Luan, bHVhbmZlaXNoaUBuZWF1LmVkdS5jbg==