 Tong Zhou1†
 Ning Wang1†Yuan Wang1Xian-Liang Zhang2
 Bao-Guo Li1Wei Li2
 Jun-Ji Su3
 Cai-Xiang Wang3Ai Zhang3Xiong-Feng Ma2*
 Zhong-Hu Li1*
- 1Shaanxi Key Laboratory for Animal Conservation, Key Laboratory of Resource Biology and Biotechnology in Western China (Ministry of Education), College of Life Sciences, Northwest University, Xi’an, China
- 2State Key Laboratory of Cotton Biology, Institute of Cotton Research, Chinese Academy of Agricultural Sciences, Anyang, China
- 3Gansu Provincial Key Laboratory of Aridland Crop Science, College of Life Science and Technology, Gansu Agricultural University, Lanzhou, China
Gossypium hirsutum (upland cotton) is one of the most economically important crops worldwide, which has experienced the long terms of evolution and domestication process from wild species to cultivated accessions. However, nucleotide evolution, domestication selection, and the genetic relationship of cotton species remain largely to be studied. In this study, we used chloroplast genome sequences to determine the evolutionary rate, domestication selection, and genetic relationships of 72 cotton genotypes (36 cultivated cotton accessions, seven semi-wild races of G. hirsutum, and 29 wild species). Evolutionary analysis showed that the cultivated tetraploid cotton genotypes clustered into a single clade, which also formed a larger lineage with the semi-wild races. Substitution rate analysis demonstrated that the rates of nucleotide substitution and indel variation were higher for the wild species than the semi-wild and cultivated tetraploid lineages. Selection pressure analysis showed that the wild species might have experienced greater selection pressure, whereas the cultivated cotton genotypes underwent artificial and domestication selection. Population clustering analysis indicated that the cultivated cotton accessions and semi-wild races have existed the obviously genetic differentiation. The nucleotide diversity was higher in the semi-wild races compared with the cultivated genotypes. In addition, genetic introgression and gene flow occurred between the cultivated tetraploid cotton and semi-wild genotypes, but mainly via historical rather than contemporary gene flow. These results provide novel molecular mechanisms insights into the evolution and domestication of economically important crop cotton species.
Introduction
Since Darwin’s time, biologists have recognized that investigating the human domestication of wild plants can help to improve our understanding of the evolutionary process (Yoo et al., 2014). Generally, domesticated forms of cultivated species differ from their wild counterparts in numerous traits (Hu et al., 2013; Mabry et al., 2021). Insights into the evolution of chloroplast genome’s domestication and selection are made possible by comparative studies of wild and domesticated representatives of individual cultivated species. In the previous study, scholars used chloroplast genome data to analyze the genetic variation and evolution of olive. As a control, the cultivated species were employed to analyze genome variation and genetic association among olive chloroplasts (Niu et al., 2020). Meanwhile, some other study have also examined the evolutionary mechanism of the chloroplast genome of cultivated Camellia sinensis and its relatives (Li et al., 2021). In recent studies, comparisons of wild and domesticated plants have provided important insights into the developmental mechanisms that underlie traits affected strongly due to targeted selection by humans (Yoo et al., 2014). In general, domesticated plants are characterized by reduced genetic variation and relaxed selection pressure compared with their wild counterparts. Several studies also found high levels of continuous gene flow from wild to cultivated genotypes (Price, 2002; Burger et al., 2008; Gross and Olsen, 2010; Ma et al., 2019). Thus, the domestication process may provide a basis for studying the overall evolutionary relationships associated with wild crop transformation and identifying the genes under selection (Gepts, 2004; Burger et al., 2008).
Cotton (Gossypium) is one of the most important crops worldwide (Wendel, 1989; Ruan, 2003) and a major source of natural fiber for the textile industry. Allopolyploid cotton originated in the New World and diverged into at least six species throughout the tropical and subtropical Americas: G. hirsutum (AD1), G. barbadense (AD2), G. tomentosum Nuttalex Seemann (AD3), G. mustelinum Miersex Watt (AD4), G. darwinii Watt (AD5), and G. ekmanianum (AD6) (Wendel and Cronn, 2003; Wendel and Grover, 2015). The diploid species comprise eight monophyletic genome groups: A, B, C, D, E, F, G, and K (Wendel and Cronn, 2003; Grover et al., 2007; Wendel et al., 2010). These groups can be separated into three main lineages in three continental regions: 13 D-genome species from the American continents, 15 species from the Asian and African continents (A-, B-, E-, and F-genomes), and 18 species (C-, G- and K-genomes) from Australia (Wendel and Cronn, 2003). Hence, cotton species provide a fascinating model system for studying evolution, domestication selection, genetic introgression, and gene flow among different continents (Fryxell, 1969, 1978; Wendel, 1989; Wendel and Grover, 2015; Chen et al., 2016, 2017a,2017b). Four species in the genus Gossypium are cultivated for the production of spinnable fiber, i.e., two allotetraploid species comprising G. hirsutum L. and G. barbadense L. (2n = 4x = 52), and two diploid species comprising Gossypium herbaceum L. (A1) and Gossypium arboretum L. (A2) (2n = 2x = 26) (Wendel and Cronn, 2003; Wendel and Grover, 2015). Allopolyploid cottons were considered to be about 1.5 million years old and were domesticated by humans 4,000 to 5,000 years ago (Wendel, 1989; Wang et al., 2017), which were originally domesticated from tree cotton in the Mesoamerican and Caribbean regions, and then further domesticated and improved in the southern United States (Fang et al., 2017). And two diploid cotton species, G. arboretum and G. herbaceum, have been cultivated for several millennia (Simon et al., 2016), which were initially domesticated on Madagascar or in the Indus Valley (Mohenjo Daro), and was subsequently dispersed to Africa and other areas of Asia (Wendel and Grover, 2015; Du et al., 2018; Huang et al., 2020). Due to the high-yield characteristics of allopolyploid cottons, the American upland cottons have been introduced and replaced by two diploid cotton species (G. arboretum and G. herbaceum) (Fang et al., 2017; Du et al., 2018). Up to now, the Upland cotton (G. hirsutum) accounts for more than 95% of the worldwide production of cotton (Yoo et al., 2014; Fang et al., 2017; Ma et al., 2019; Wang et al., 2019; Zhang et al., 2020).
Following human-mediated selection and agronomic improvement, the ability of cotton species to adapt to various environments was enhanced and the production of fiber from cotton improved significantly (Ma et al., 2019). The domestication process also resulted in other morphological changes in other crops such as sorghum, rice and soybean (Ma et al., 2019), including early flowering, larger and/or more fruits, annualized habit, plant height reduction, and loss of seed dormancy (Yoo et al., 2014). When plants undergo artificial domestication, the relaxation of certain features is inevitable (Price, 2002), that is, when plants undergo relatively large changes, such as from the transition from nature to domestication, certain characteristics important for survival in nature lose much of their adaptive significance under artificial directional selection. Hence, one would expect natural selection for such characteristics to lose its intensity (Coss, 1999; Price, 2002). Many studies have shown that the genetic diversity of upland cotton varieties is low, mainly due to several bottlenecks in the domestication process (Brubaker and Wendel, 1994; May et al., 1995; Iqbal et al., 2001; Wendel and Cronn, 2003). In addition, previous studies based on whole-genome resequencing of upland cotton have indicated that the genomic diversity of upland cotton decreased under the stress of artificial selection (Fang et al., 2017; Ma et al., 2019). Thus, in the current era of genomic big data, high-throughput “omics” sequencing techniques allow detailed analyses of the genetic changes associated with artificial domestication, as well as providing new, accurate, and targeted genome-based crop breeding strategies (Wang et al., 2017; Li et al., 2020; Yang et al., 2020). For example, in maize and rice, the use of high-quality backbone parents can obtain notable improvements in breeding efficiency (Ma et al., 2019). The whole-genome sequences of allotetraploid cotton and its ancestors have been completed, and the high-quality allotetraploid upland cotton genome is an effective tool for systematically exploring the genomic mysteries of polyploidy (Li et al., 2014, 2015; Zhang et al., 2015). Compared with whole-genome sequencing, the chloroplast genome is single-copy, maternally inherited, and there is no chain exchange or free combination phenomenon. It has a relatively independent evolutionary route. In addition, the highly conserved characteristics of the chloroplast genome make them useful for the rapid analysis of species evolution (Jansen et al., 2007; Parks et al., 2009; Wang et al., 2013; Chen et al., 2014). However, the whole-genome resequencing (WGR) is parental inheritance, and there may be genetic recombination (Gover et al., 2020; Wang et al., 2020).
In the current study, to better understand the evolution, domestication selection, and genetic relationships of cotton, we analyzed the chloroplast genomic variation in 72 cotton genotypes comprising G. hirsutum and its 29 cultivated upland cotton accessions, G. barbadense and its three cultivated accessions (Gossypium barbadense cultivar zhonghai 7, Gossypium barbadense cultivar Kaiyuan, and Gossypium barbadense cultivar yuanmou), G. africanum, G. arboretum, seven semi-wild races of G. hirsutum, and 29 wild cotton species. We also estimated molecular dating, genetic introgression, nucleotide substitutions, and indel variation.
Materials and Methods
DNA Extraction and Plant Materials
The fresh leaves of seven semi-wild races of upland cotton, i.e., punctatum, latifolium, richmondi, morrilli, marie-galante, palmeri, and yucatanense, were collected from the National Wild Cotton Nursery in Sanya, China. In addition, 29 cultivated upland cotton accessions were also obtained from different ecological geographic regions, with three accessions from the United States, eight from the Yellow River region, 12 from the Yangtze River area, four from northwest China, and two from north China (Table 1). Leaf tissues were dried with silica gel and genomic DNA was extracted using the modified CTAB method (Doyle and Doyle, 1987). Approximately 5 μg of purified DNA was used to construct paired-end libraries with an insert size of 350 bp and sequencing was performed with the Illumina HiSeq 2500 platform by Novogene (Beijing, China). Additionally, we have also downloaded the 36 chloroplast genomes of cotton species from NCBI (National Center for Biotechnology Information) for further combination analysis.
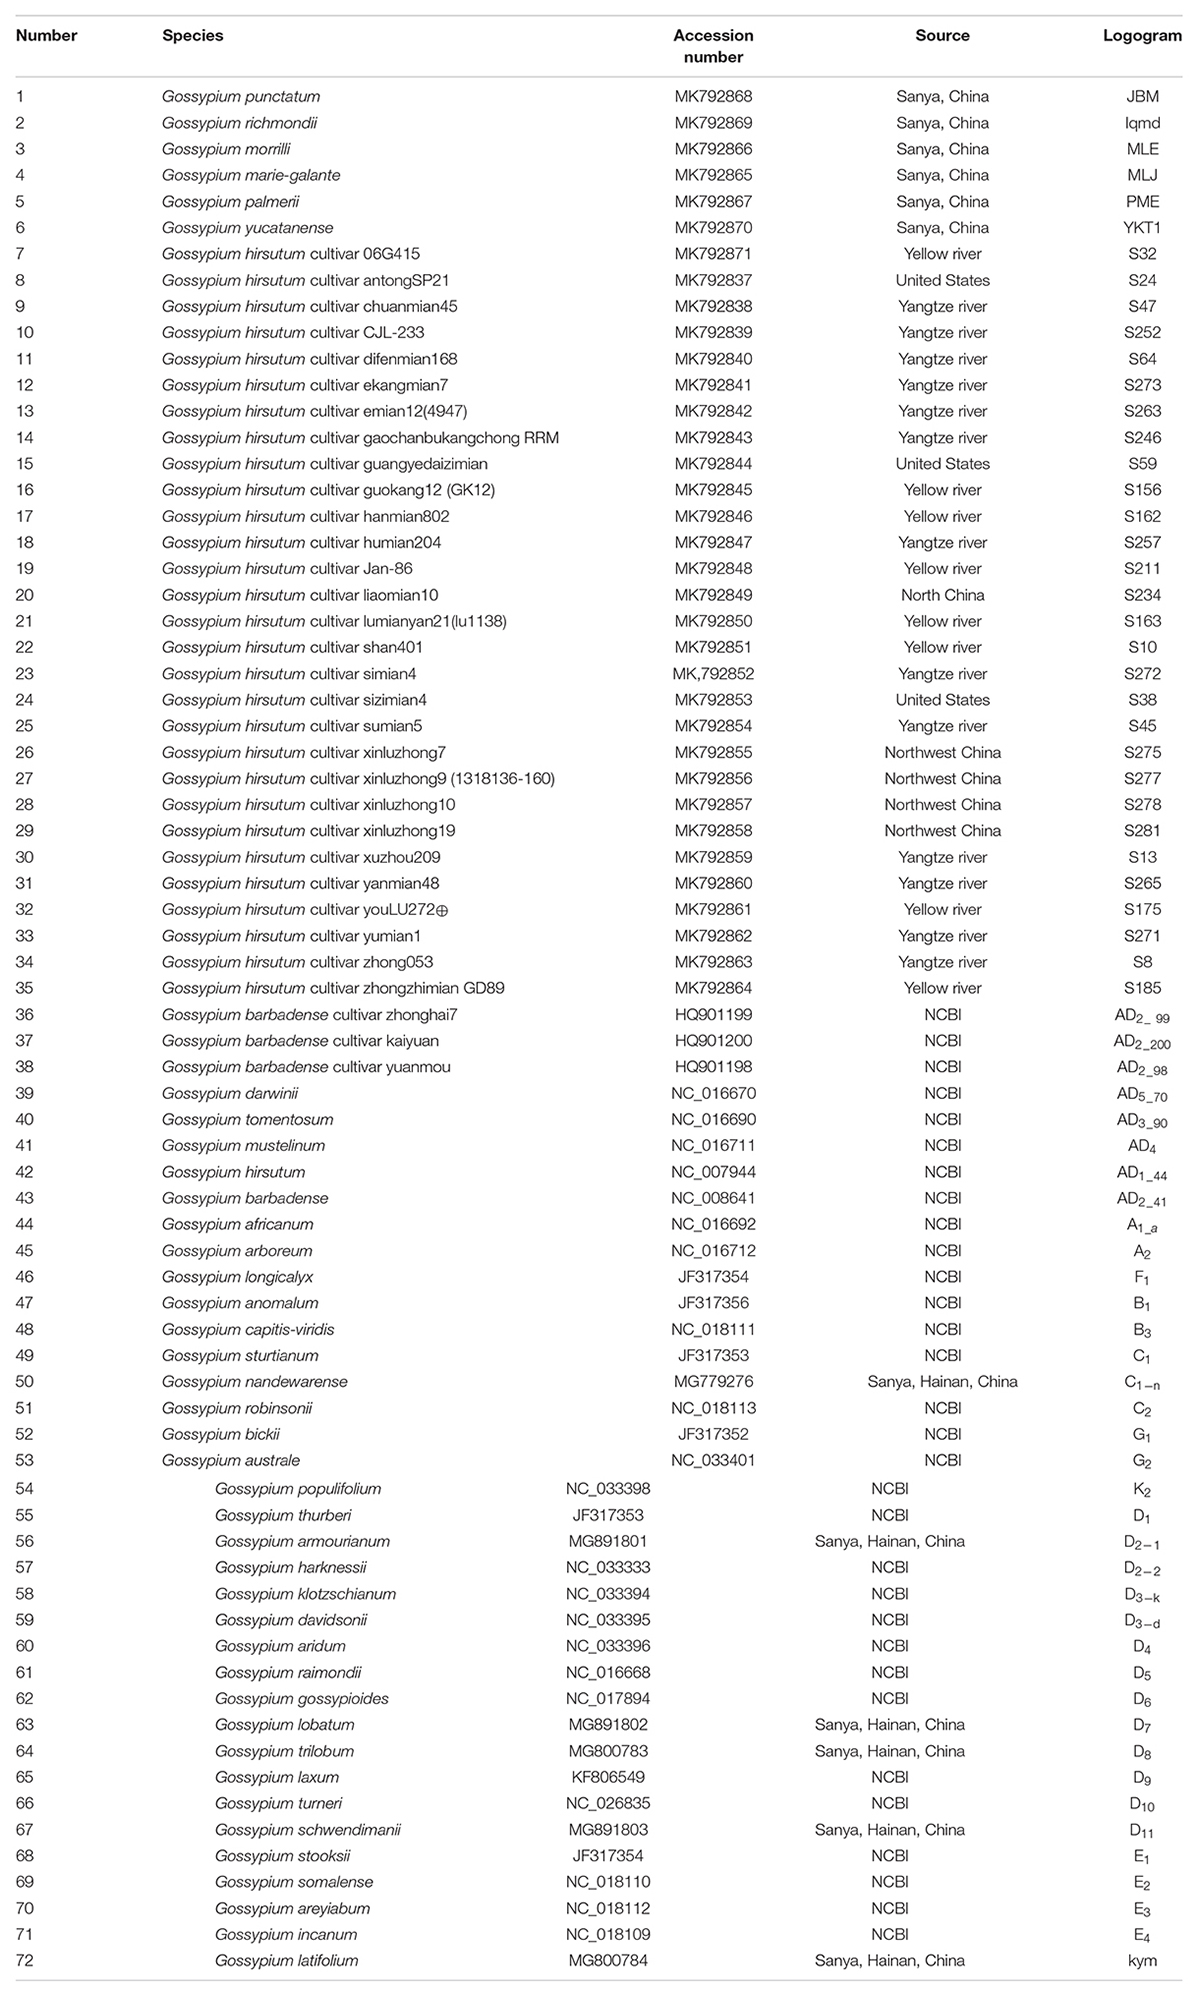
Table 1. List of taxa sampled in this study and species accession numbers (GenBank).
Chloroplast Genome Assembly, and Annotation
The raw sequencing reads obtained by the company (Novogene, Beijing, China) were filtered through the “AmbiguityFiltering.pl” script in the NGSQCToolkit software (Patel and Jain, 2012), and removed the fragments with fuzzy bases greater than 2% and those with bases less than 50 bp. The clean reads were assembled by the MIRA 4.0.2 program (Chevreux et al., 2004) where the complete chloroplast genome of G. hirsutum (AD1) (NC_007944) was used as the reference sequence in this process. In order to further assemble the whole chloroplast genomes, some ambiguous regions were extended using the MITObim v1.7 program with a baiting and iteration method (Hahn et al., 2013). The contigs obtained were used to generate consensus sequences with Geneious v8.0.2 (Kearse et al., 2012). The chloroplast genomes were then annotated using the Dual Organellar Genome Annotator (DOGMA, Wyman et al., 2004) program and manual corrections were made for some specific genes. All tRNA genes were further confirmed using the online tool tRNAscan-SE (Schattner et al., 2005). All of the newly generated genome sequences were submitted to GenBank (accession numbers MK792837–MK792871 and MG800784).
Genetic Clustering Analysis
To evaluate the genetic relationships among cotton genotypes, molecular phylogenetic analysis was conducted using 72 complete chloroplast genome sequences (Table 1) and two outgroups comprising Bombax ceiba (NC_037494) and Theobroma cacao (NC_014676). First, all of the sequences were aligned using the MAFFT program (Katoh and Standley, 2013) and the best-fit model was then selected with Modeltest v3.7 (Posada and Crandall, 1998) based on Akaike’s information criterion. Finally, a maximum likelihood tree was constructed using RAxML v7.2.8 (Stamatakis, 2006) where the best model was GTR + G based on 1000 bootstrap replicate tests.
Estimation of Divergence Times
Previously estimated dates of speciation events (fossil records) were used to calibrate the phylogenetic tree (Pfeil and Crisp, 2008). In BEAST v1.8.0 (Drummond et al., 2012), we used the Yule process speciation prior and the uncorrelated lognormal model of rate change with a relaxed clock to estimate the divergence times among cotton lineages. The divergence time was calculated based on 74 chloroplast protein-coding sequences shared by the cotton genotypes, and we used three fossil records: AD1 (G. hirsutum) and A2 (G. arboreum) diverged 1–2 Mya (Wendel, 1989), A2 (G. arboreum) and D5 (G. raimondii) diverged ∼ 5–10 Mya (Senchina et al., 2003), and Theobroma-Gossypium diverged 60 Mya (Carvalho et al., 2011). A normal prior probability distribution was used to account for the uncertainty of prior knowledge. The analyses were run for 50,000,000 generations and the parameters were sampled every 5,000 generations. Tracer v 1.6 (Drummond et al., 2012) was used to determine the effective sample size (>200) and the first 20% of the samples were discarded as burn-in. Tree Annotator v.1.8.0 (Drummond et al., 2012) was used to summarize the set of post-burn-in trees and their parameters were used to produce a maximum clade credibility chronogram, which illustrated the mean divergence time estimates in the 95% highest posterior density (HPD) intervals. Finally, FigTree V1.3.1 (Drummond et al., 2012) was used to visualize the molecular dating estimates.
Analysis of Nucleotide Substitutions
Transitions/transversions explain the substitution rates of nucleotides, so we determined the transition/transversion rates using single nucleotide polymorphism (SNP) loci in protein-coding sequences in the cotton chloroplast genome. These analyses were conducted based on two genetic groups obtained from the phylogenetic analyses. One group contained the diploid cotton species (including G. africanum and G. arboretum) and the other group comprised tetraploid semi-wild races and cultivated upland cotton genotypes (excluding G. barbadense). MEGA files generated from SNP data were analyzed with MEGA7 software (Kumar et al., 2016) to obtain the transition/transversion rate. The following parameters were employed: statistical method, maximum likelihood; analysis, substitution pattern estimation (MCL); substitution type, nucleotides; scope, all selected taxa; model/method, Tamura–Nei (automatic selection); gaps/missing data treatment, partial deletion, and site coverage cut off (%), 95 (Mohanta and Bae, 2017). Finally, we converted the transition/transversion rates for the two groups into two histograms. In addition, DnaSP v5.10 (Librado and Rozas, 2009) was used to calculate the non-synonymous (dN) and synonymous (dS) mutations in coding regions for the two groups.
Estimation of Mutation Rates
The two cotton groups described above were also used to calculate the mutation rates. The rate of mutation per site per year (μ) was estimated using the formula: μ = m/(nT), where m is the number of observed mutations, n is the number of total sites, and T is the divergence time of a node (Denver et al., 2009). The μ values for structural mutations were calculated using the method described by Saiton and Ueda (Saitou and Ueda, 1994), where the total number of structural mutations was divided by the additive time based on the branch lengths and by the length of the nucleotide sequences. Finally, we calculated the evolutionary rates for nucleotide substitutions and indels. The indel rates were calculated for the two groups using DnaSP v5.10 (Librado and Rozas, 2009).
Selection Pressure Analysis
To identify domestication selected genes, we performed selection pressure analysis using the Codeml program (Yang et al., 2005) and two different groups of genotypes, where one group comprised the wild diploid cotton species with a total of 28 genotypes and the other group contained the upland cotton semi-wild races and cultivated varieties with a total of 37 cotton genotypes (excluding G. barbadense and its three cultivated accessions, i.e., G. tomentosum, G. mustelinum and G. darwinii, because these seven genotypes were not involved in the domestication selection process for upland cotton). In general, the non-synonymous (dN) and synonymous substitution (dS) rate ratio (ω = dN/dS) was sensitive to selection pressure during evolution at the protein level, and it was particularly useful for identifying positive selection. Geneious v8.0.2 (Kearse et al., 2012) and MAFFT v7.0.0 (Katoh and Standley, 2013) were used to extract and align 77 protein-coding chloroplast genes from the two groups. Maximum likelihood phylogenetic trees were constructed based on the complete chloroplast genome sequences using RAxML v7.2.8 (Stamatakis, 2006). This model allowed the ω ratio to vary among sites with a fixed ω ratio for the whole tree to test for site-specific evolution in the gene phylogeny (Yang and Nielsen, 2002). Log-likelihood values of every model were compared against a neutral model based on likelihood ratio tests in order to determine statistically significant differences. Only the candidate sites for positive selection with significant support based on the posterior probability (p of (ω > 1) ≥0.99; Bayes Empirical Bayes approach) identified by M2 and M8 were considered further.
Diversity and Genetic Structure Analysis
DnaSP v5.10 (Librado and Rozas, 2009) was used to analyze the genetic diversity parameters based on the complete chloroplast genome sequences of seven semi-wild races and 29 cultivated upland cotton genotypes. We also calculated the haplotype diversity (Hd) (Nei and Tajima, 1981), nucleotide diversity (π) (Nei and Li, 1979), and the number of haplotypes (H) with DnaSP v5.10 software.
We also analyzed the genetic structure patterns using the Bayesian Markov chain Monte Carlo clustering analysis method implemented in STRUCTURE 2.3.3 (Pritchard et al., 2000; Falush et al., 2003; Hubisz et al., 2009). The admixture model with correlated allele frequencies was implemented for each run without a prior placed on the population information (Hubisz et al., 2009). We conducted eight independent runs for each value from K = 1–10 to estimate the “true” number of clusters in 200,000 Markov chain Monte Carlo cycles following a burn-in step of 500,000 iterations. The most likely number of clusters was defined using log probabilities [Pr(X| K)] (Pritchard et al., 2000) and the △K method (Evanno et al., 2005) via the online website STRUCTURE HARVESTER (Earl and VonHoldt, 2012). Next, CLUMPP 1.1.2 and the Greedy algorithm were used to align multiple runs of STRUCTURE for the same K value (Jakobsson and Rosenberg, 2007). Finally, we applied DISTRUCT 1.1 (Rosenberg, 2004) to graphically visualize the individual probabilities of cluster membership.
Gene Flow
We calculated the historical gene flow in semi-wild races and cultivated upland genotypes using Migrate-n (Beerli, 2006). First, we generated five independent Markov chain Monte Carlo cycles, each with 5,000,000 generations. We then sampled every 100 steps under a constant variation model and discarded the first 1,000,000 records as a burn-in and the other settings were at their default values. After checking for data convergence, we estimated the mode and 95% HPD (Du et al., 2017). In addition, we applied BAYESASS v3.0 to detect contemporary gene flow in the two groups (Wilson and Rannala, 2003). In these calculations, the three parameters comprising the migration rates (ΔM), allele frequencies (ΔA), and inbreeding coefficients (ΔF) were used as references to ensure that the optimal acceptance rates for the three parameters fell within the range of 20–60%. After continuous calculations, the correlation values for the genetic components were finally determined as 0.03, 0.16, and 0.14, respectively. We then conducted the analyses based on 57 iterations after a burn-in of 56 iterations and set 1,000 as the sampling frequency. Ten separate runs were performed to minimize the convergence problem (Feng et al., 2016). The method proposed by Meirmans was used to obtain the results with the lowest deviance (Meirmans, 2014).
Results
Evolutionary Relationships
The chloroplast genome sequences and concatenated protein-coding genes were used to reconstruct the maximum likelihood phylogenetic relationships for 72 Gossypium genotypes, and the cotton relationships generated from the data sets had the same topology, as shown in Figure 1. The six major genetic clades identified comprised the A + AD, F, E, D, B, and C + G + K genomic groups. Interestingly, all of the cultivated upland cotton genotypes clustered with the semi-wild race latifolium, which also formed a large evolutionary lineage with the other semi-wild races. The A-genome cotton species and G. barbadense genotypes also formed a single clade and they were closest to the upland cotton branch, whereas the 13 D-genome species formed a strong monophyletic lineage. The Australian species (C + G + K) clustered into a small branch, which clustered into a large branch with the B-genome species. Four species representing the E-genomic group also clustered into a large evolutionary branch. These results were in good agreement with the biogeographic distributions of cotton species from different continents.
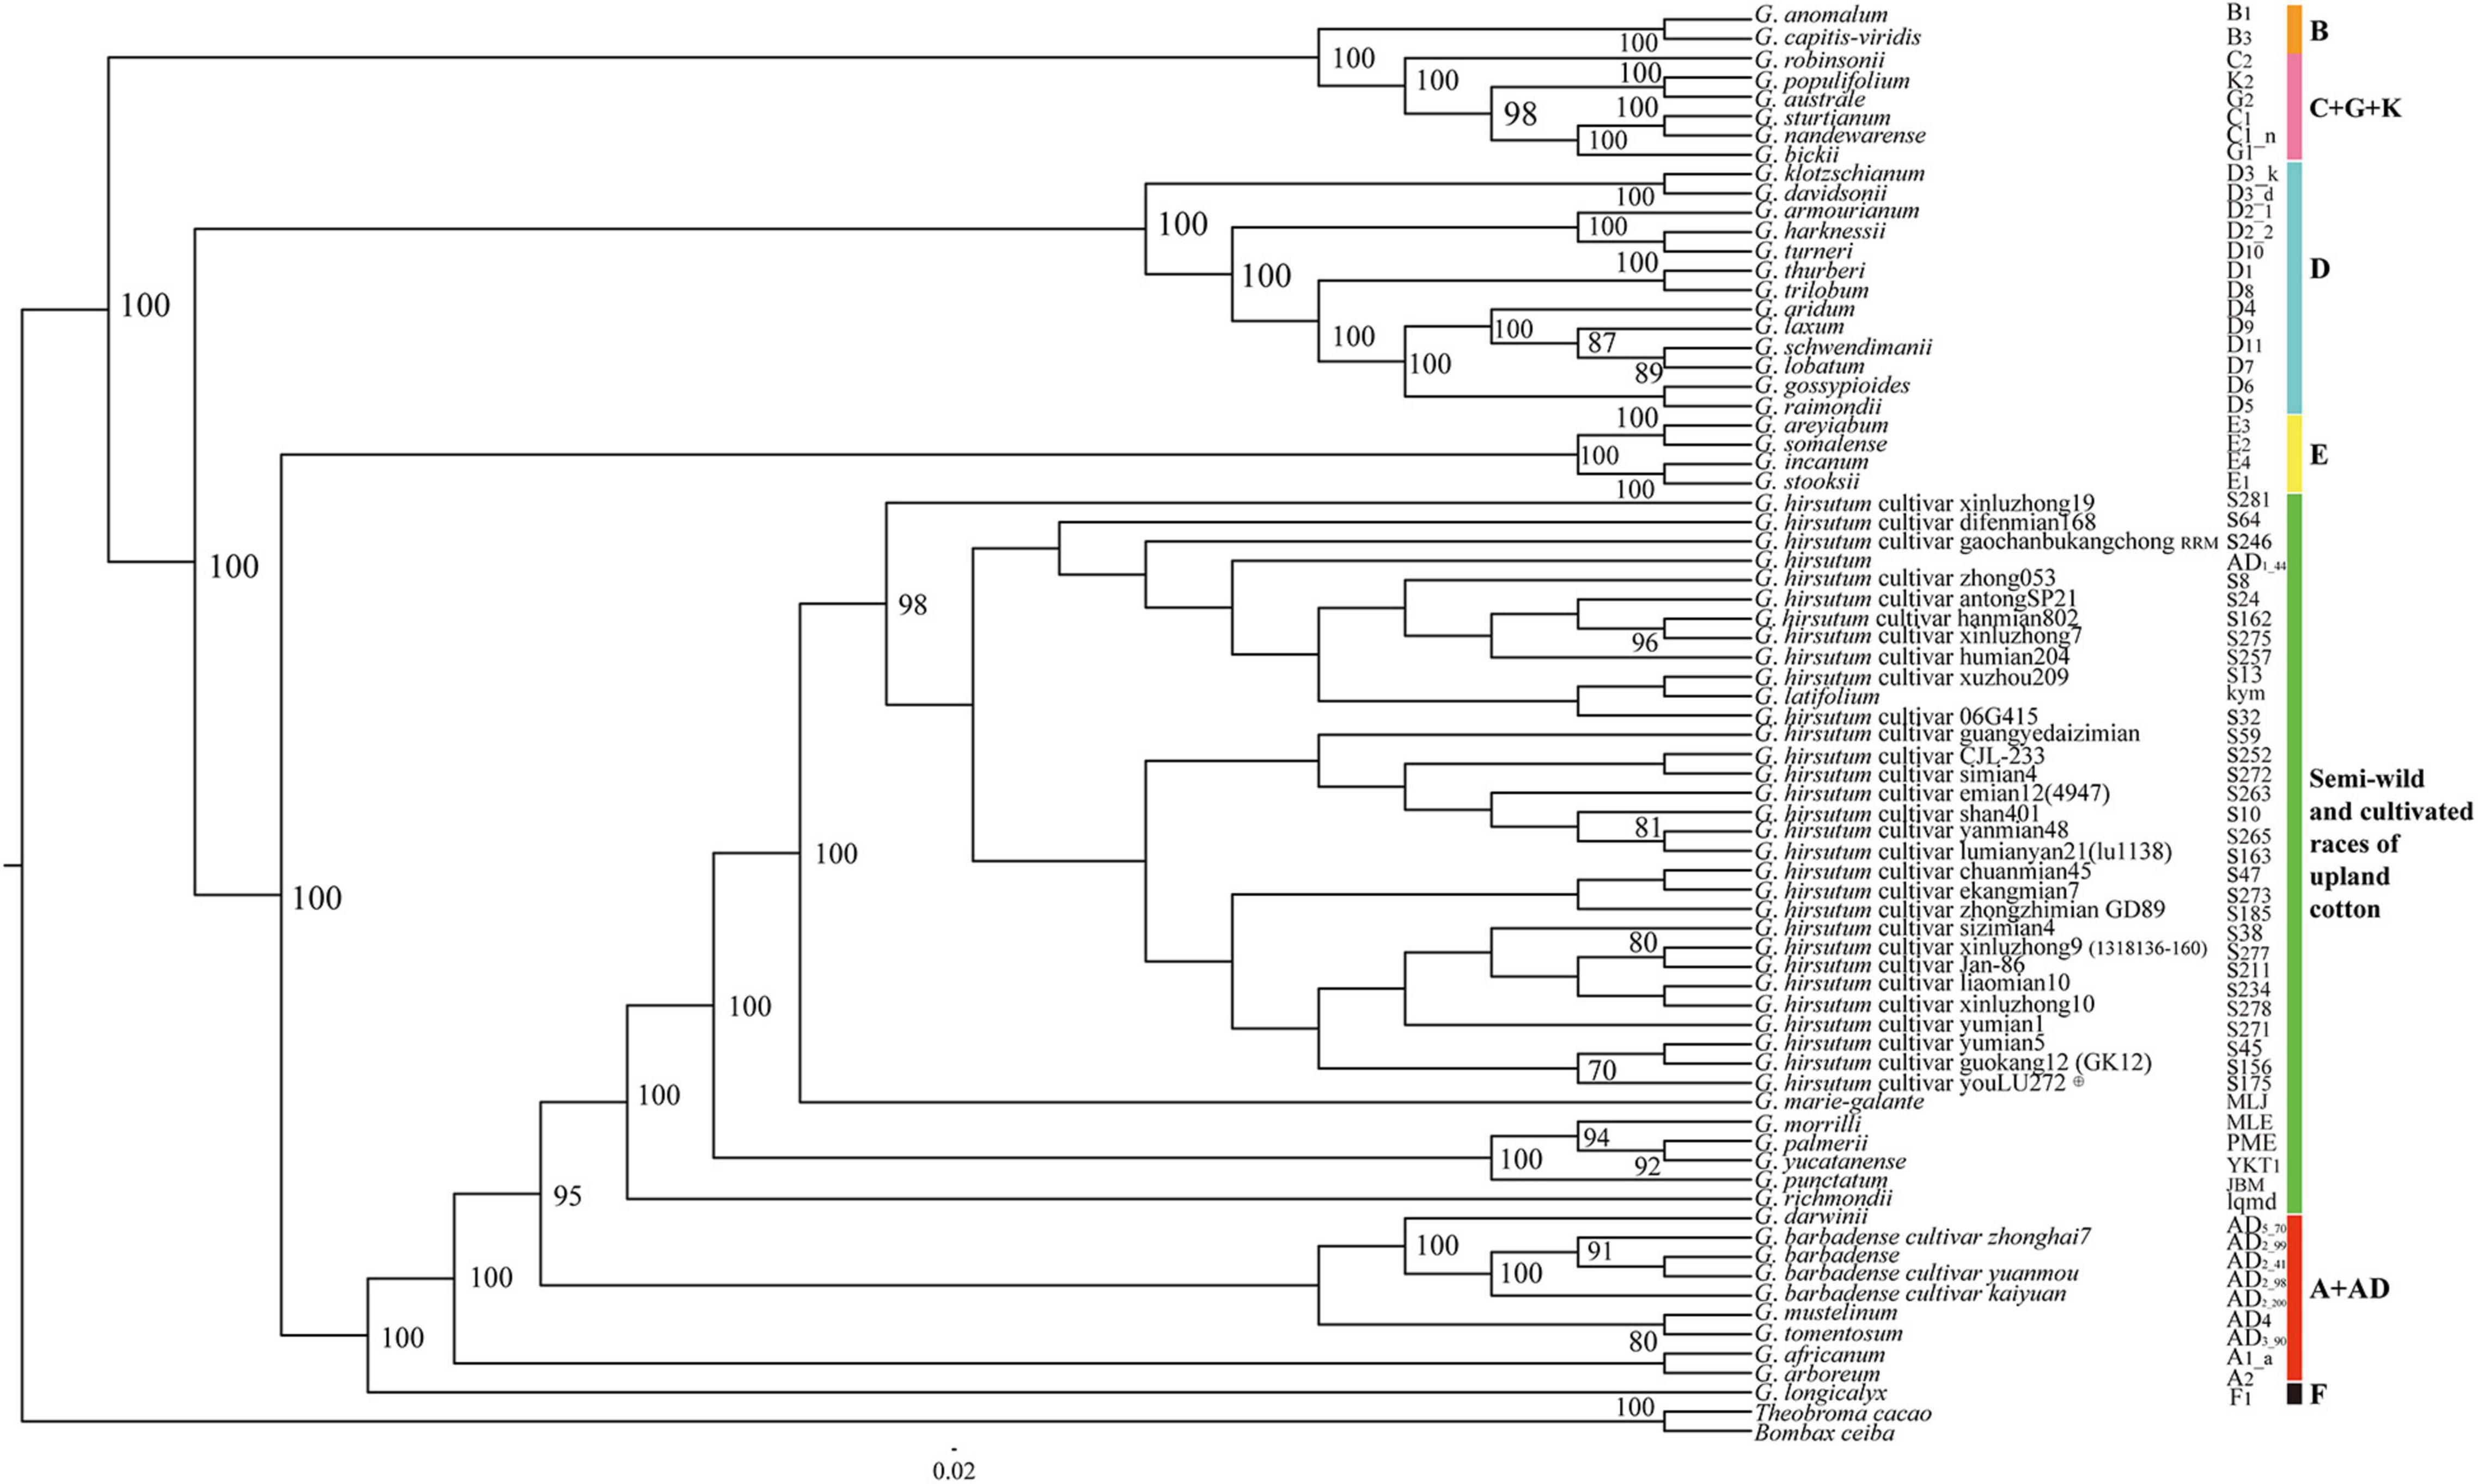
Figure 1. Phylogenetic relationships among 72 Gossypium accessions based on complete chloroplast genomes. Green represents the cultivated accessions and semi-wild races of upland cotton, and other colors represent six genetic clades. B. ceiba and T. cacao were used as outgroups.
Divergence Time Estimation
The molecular dating showed that the divergence time between the genus Gossypium and outgroups (B. ceiba and T. cacao) was about 58.15 Mya (95% HPD = 56.53–60.04 Mya), which are consistent with previous estimates (Carvalho et al., 2011; Figure 2). The genus Gossypium originated about 11 Mya (95% HPD = 9.34–11.74 Mya) and most genomic groups in the genus diverged radially in a relatively narrow time range. Interestingly, the divergence time between the B-genome (African origin) and Australian clades (C + G + K) was estimated at 7.7 Mya (95% HPD = 6.3–9.8 Mya), which again supported the genetic relationship present in the B-genome, i.e., the B-genome branch and Australian branch were strongly grouped phylogenetically. The semi-wild races and cultivated upland cotton accessions diverged about 3.12 Mya and the ancestor of the D-genome originated at 5 Mya (95% HPD = 3.59–5.44 Mya). The divergence time of the allotetraploid AD clade was about 3.37 Mya (95% HPD = 2.44–4.93 Mya).
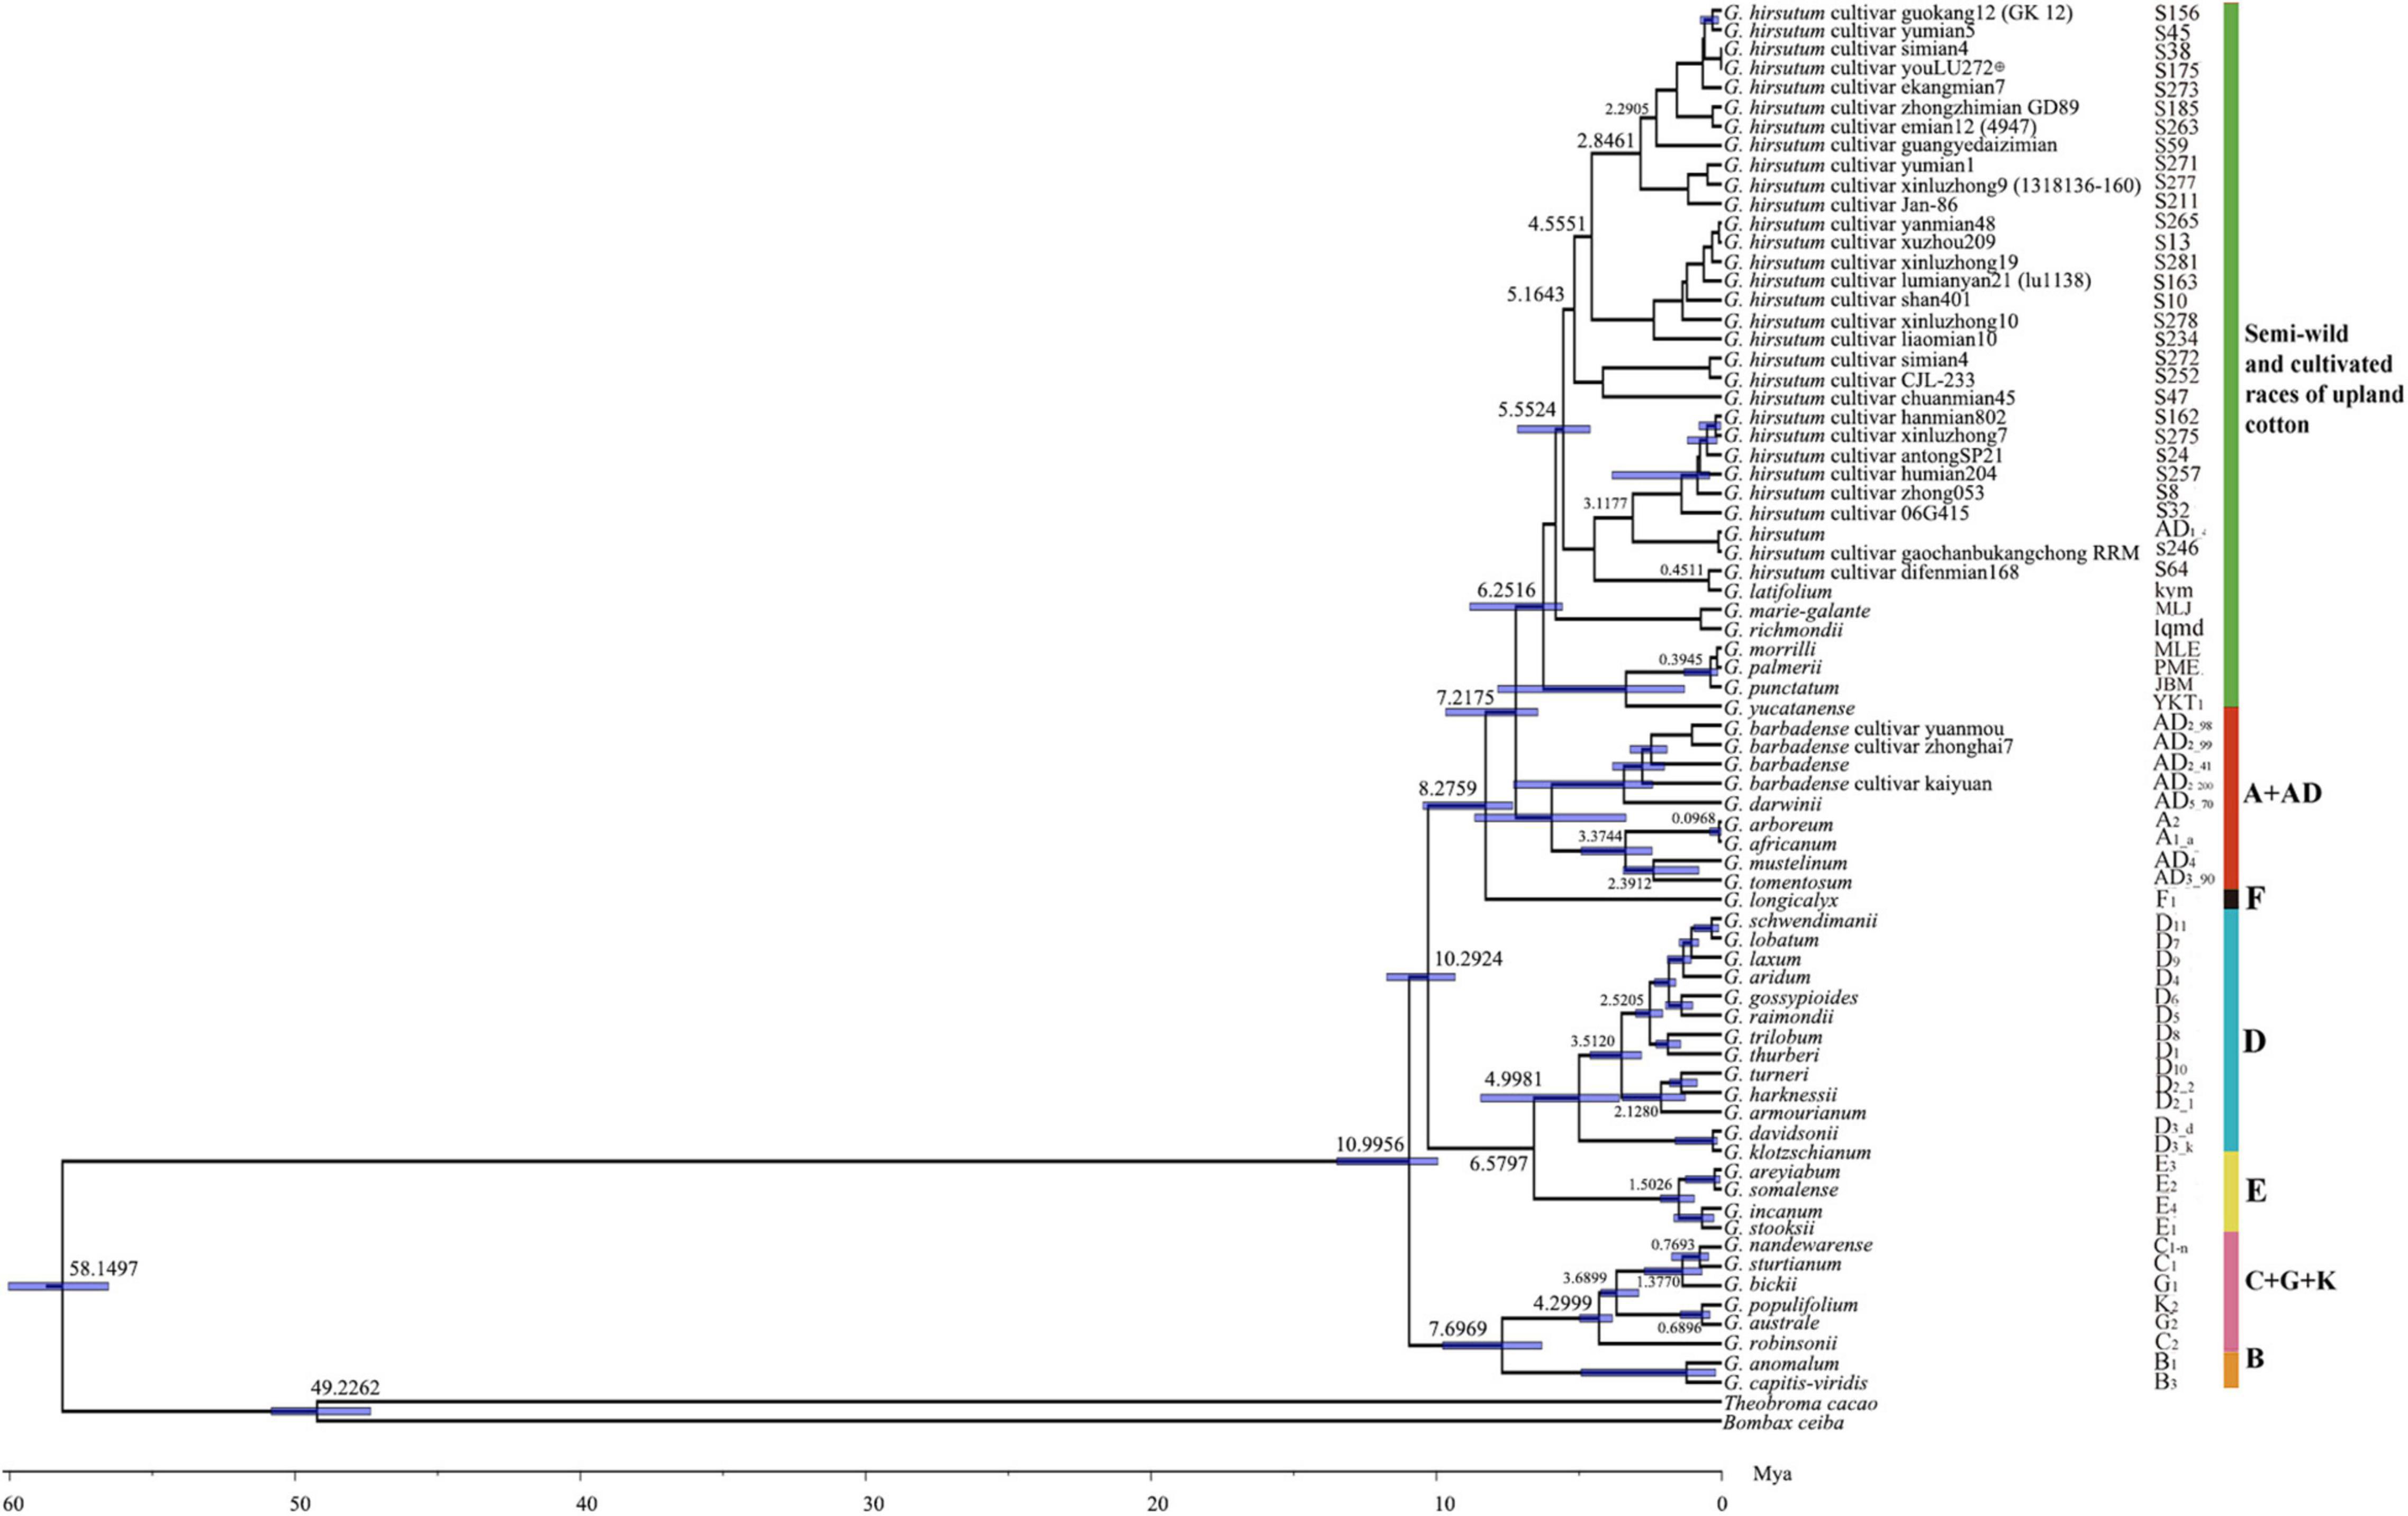
Figure 2. Divergence time tree obtained for cotton accessions based on 72 chloroplast protein-coding sequences.
Nucleotide Substitutions
The ratios of transition/transversion were high among the semi-wild races and cultivated upland cotton genotypes (1.41), but low among the genotypes of the wild cotton species (1.16) (Table 2). There were significant differences in the proportions of two transition mutations and four transversion mutations between the two groups (Figure 3). Among the four transversion mutations, the proportion of A-C + T-G mutations was similar to that of C-G + G-C mutations in the groups. In addition, few A-T + T-A and C-A + G-T mutations were found in all combinations.

Table 2. Ratios of transitions and transversions for plastid protein-coding sequences in cotton accessions.
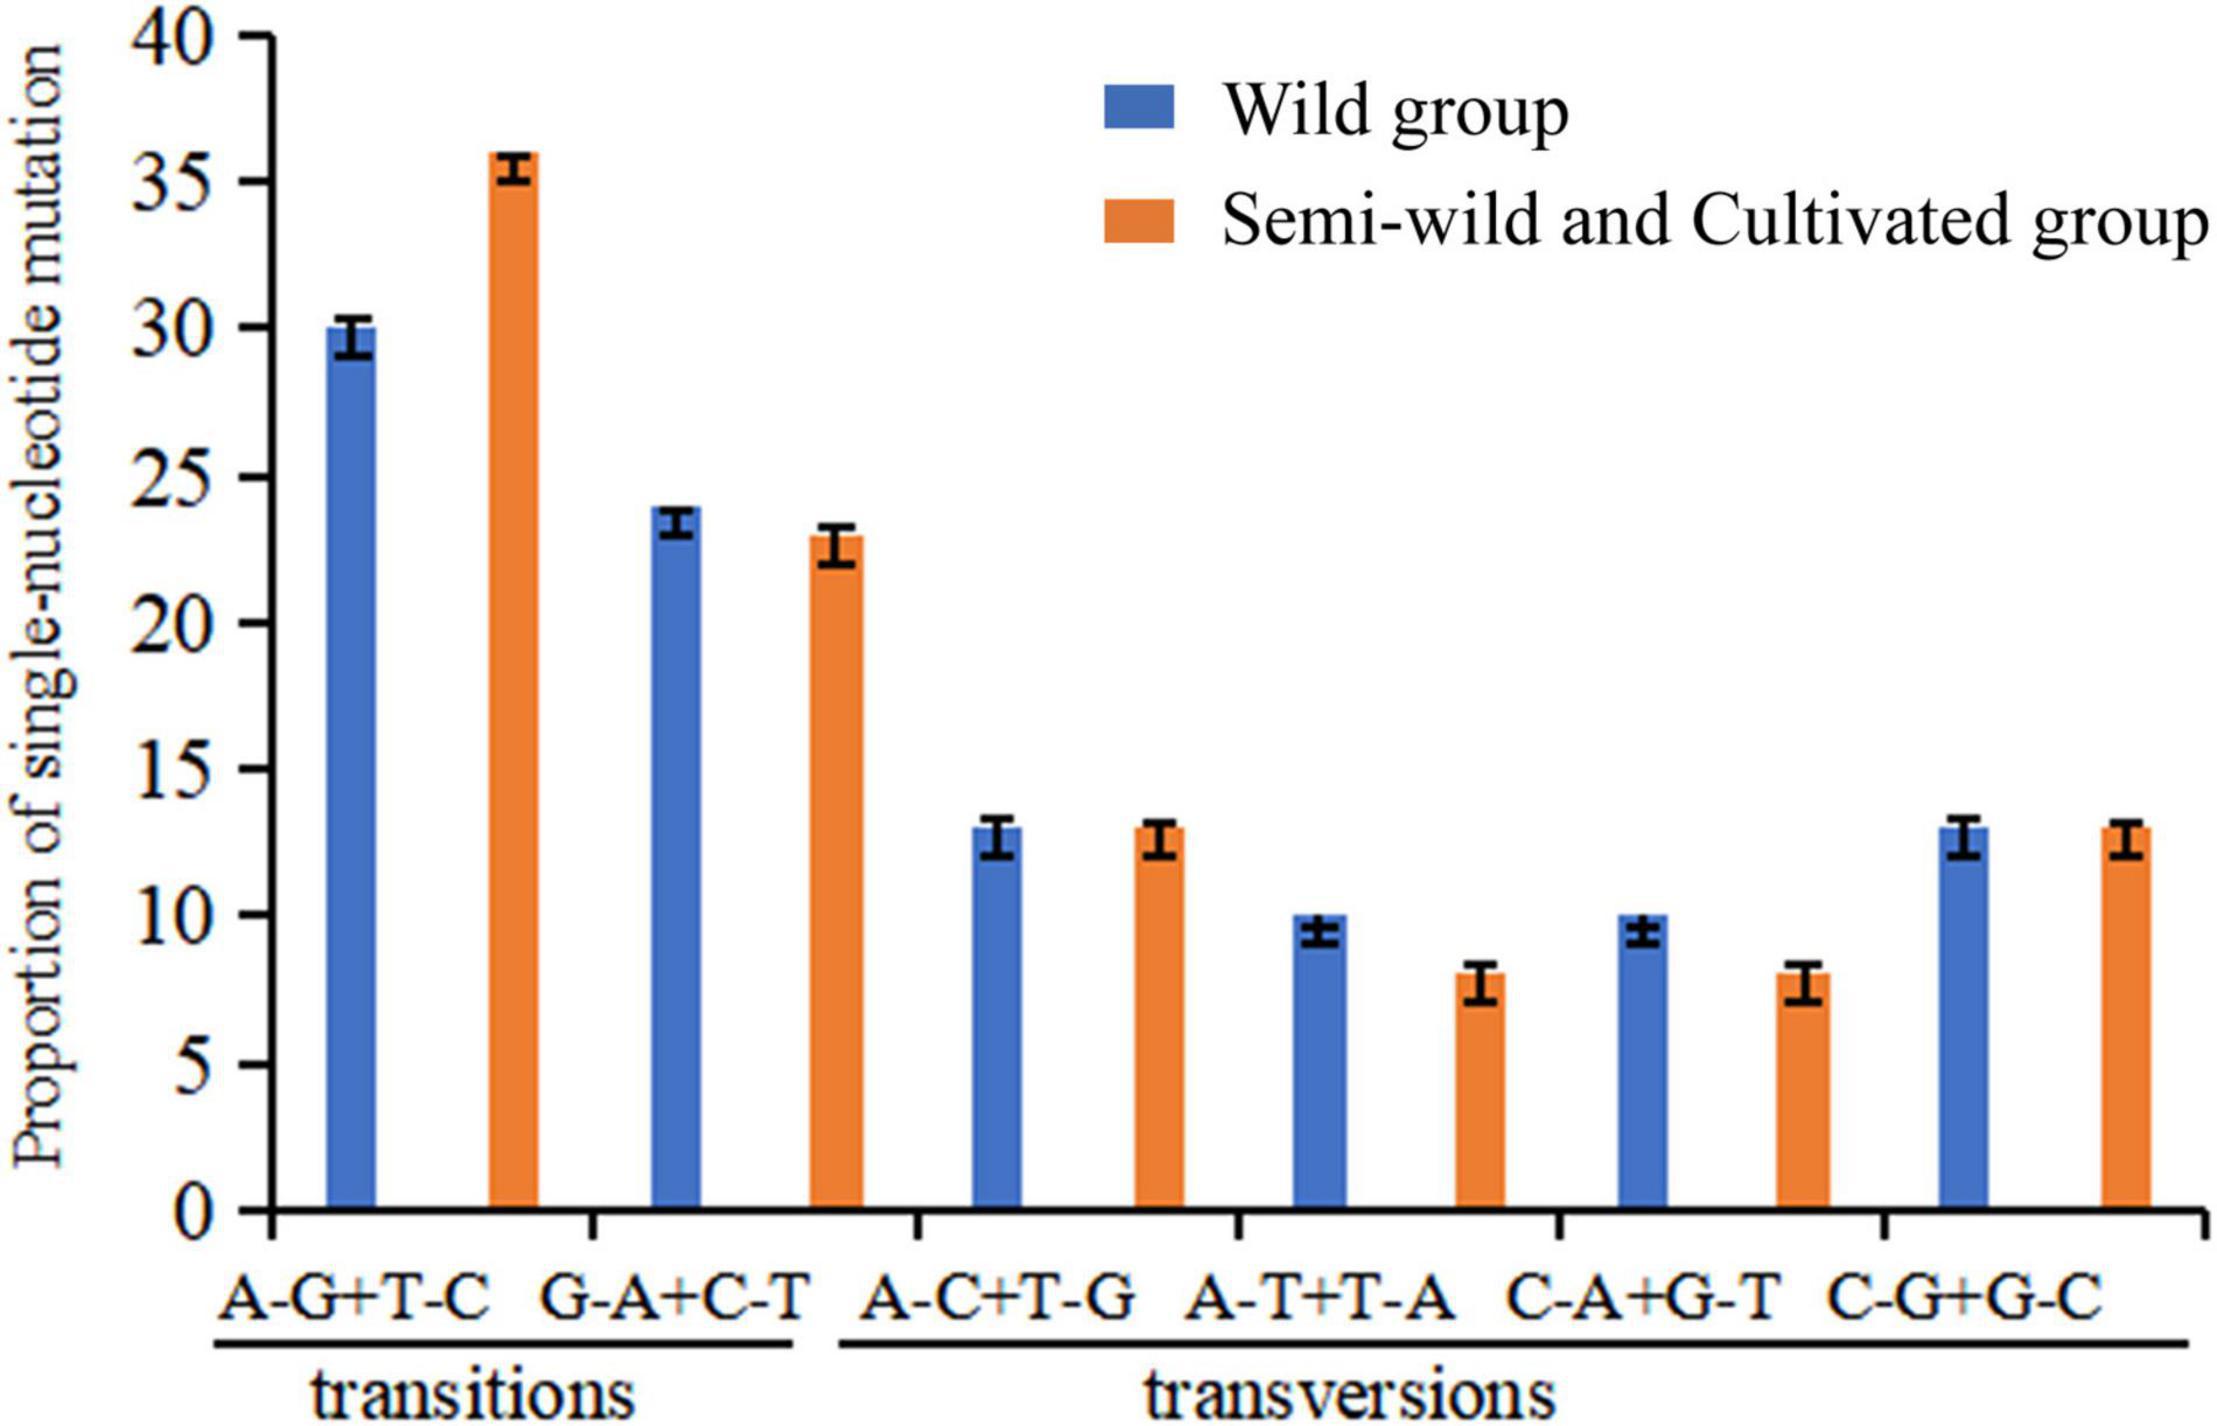
Figure 3. Nucleotide substitution patterns in wild cotton species, semi-wild races, and cultivated cotton accessions based on SNP site variations. The patterns were divided into six types as indicated by the six non-strand-specific base substitution types. p = 0.97681. Because the calculated value is a fixed value with a decimal. We calculate the error bar between the actual value and the integer substitution site. The p-value is calculated by T-test.
The 4,074 biallelic SNPs were subdivided into coding, intron, and intergenic spacer regions, and sorted into two groups comprising wild cotton species, and semi-wild and cultivated upland cotton genotypes (Table 3). In wild cotton group, there were 3,753 SNPs in total: 1,375 in coding regions, 264 in intron regions, and 2,693 in intergenic spacer regions. The percentages of SNP to the total lengths were 1.72, 1.22, 2.95, respectively, manifesting the intergenic spacer region sequences were more variable than the intron regions. In the coding regions, there were 1,027 non-synonymous mutations and 347 synonymous mutations, and the dN/dS was about 2.96. In the semi-wild and cultivated cotton genotypes, the sequences of the intergenic spacers and intron regions were more variable than the coding regions. The dN/dS ratio (3.5) was larger for this group than the wild cotton species (56 non-synonymous mutations and 16 synonymous mutations).
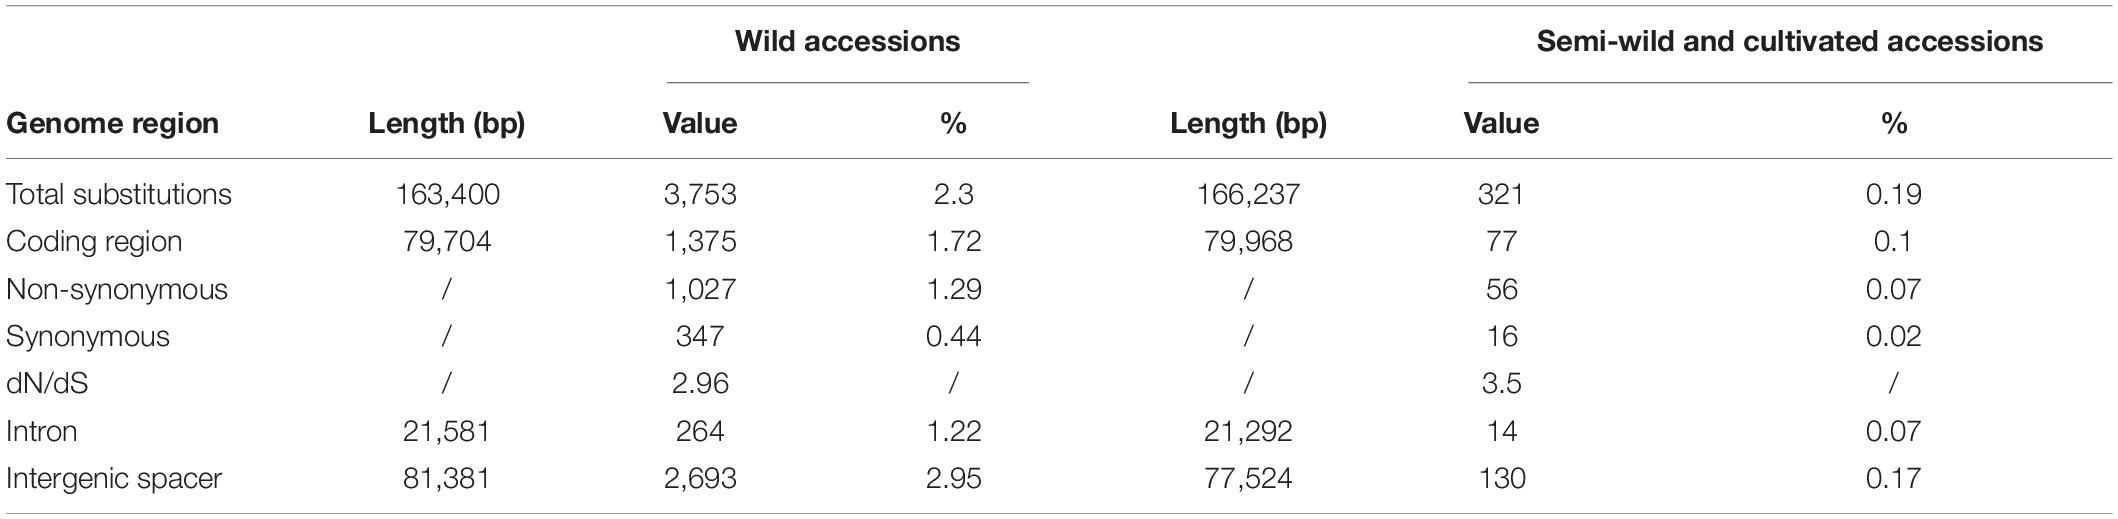
Table 3. Taxonomic and genomic distribution of biallelic single nucleotide polymorphic loci in wild, semi-wild, and cultivated cotton plastid genomes.
Estimation of Mutation Rate
The evolutionary rates were calculated based on the lengths of the genomes, number of substitutions, and times since divergence. In total, 1,375 substitutions were estimated in the wild species group and 77 in the semi-wild races and cultivated upland cotton group. The evolutionary rate of nucleotide substitutions was 1.2 × 10⁻⁹ per site per year in the wild species group compared with 0.18 × 10⁻⁹ per site per year in the semi-wild and cultivated group. In addition, 479 indels were identified in the wild cotton species and the evolutionary rate for indels was estimated at 0.4 × 10⁻⁹ per site per year. In the semi-wild and cultivated group, 24 indels were detected and the evolutionary rate was estimated at 0.05 × 10⁻¹¹ per site per year.
Selection Pressures
We identified 16 genes with sites under positive selection in the wild species group (Supplementary Tables 1, 2). These genes comprised two ATP subunit genes (atpB and atpE), three ribosome small subunit genes (rps2, rps3, and rps12), three genes encoding cytochrome b/f complex subunit proteins (petB, petD, and petN), one NADH oxidoreductase gene (ndhG), one DNA-dependent RNA polymerase gene (rpoC2), one gene encoding ribosome large subunit protein (rpl16), and five other genes (ccsA, cemA, rbcL, ycf1, and ycf2). According to the M2 and M8 models, the rps12 gene harbored 28 sites under positive selection, as well as 34 sites in ycf2, six and four sites in ycf1, two and five sites in ndhG, and one site each in the ccsA, cemA, rpl16, rps3, and petB genes. The M8 model detected 15 sites under positive selection in the rps2 gene. However, sites under positive selection in the atpB (five), atpE (two), and rbcL (two) genes were only detected by the M2 model, and the other six genes had only one active site.
We only identified the ribosome large subunit protein (rpl2) gene with sites under positive selection in the semi-wild and cultivated group, where it harbored four sites under positive selection in the M2 model (Supplementary Tables 3, 4).
Diversity and Genetic structure
Seven chloroplast DNA haplotypes were identified in the semi-wild races and 22 in the cultivated upland cotton genotypes (Table 4). The haplotypes diversity (Hd) and π values were slightly higher for the semi-wild races than the cultivated genotypes. STRUCTURE analyses and the ΔK statistic indicated an “optimal” value for K (number of populations modeled) of 2 (Supplementary Figure 1), thereby supporting the existence of two major clusters in the data set (Figure 4). The semi-wild races were primarily assigned to cluster I and the cultivated genotypes to cluster II, whereas the races marie-galante and latifolium had notable fractions assigned to cluster II, thereby suggesting genetic introgression between the two groups.

Table 4. Nucleotide diversity and haplotype frequencies for plastid genomes in semi-wild and cultivated accessions of upland cotton.
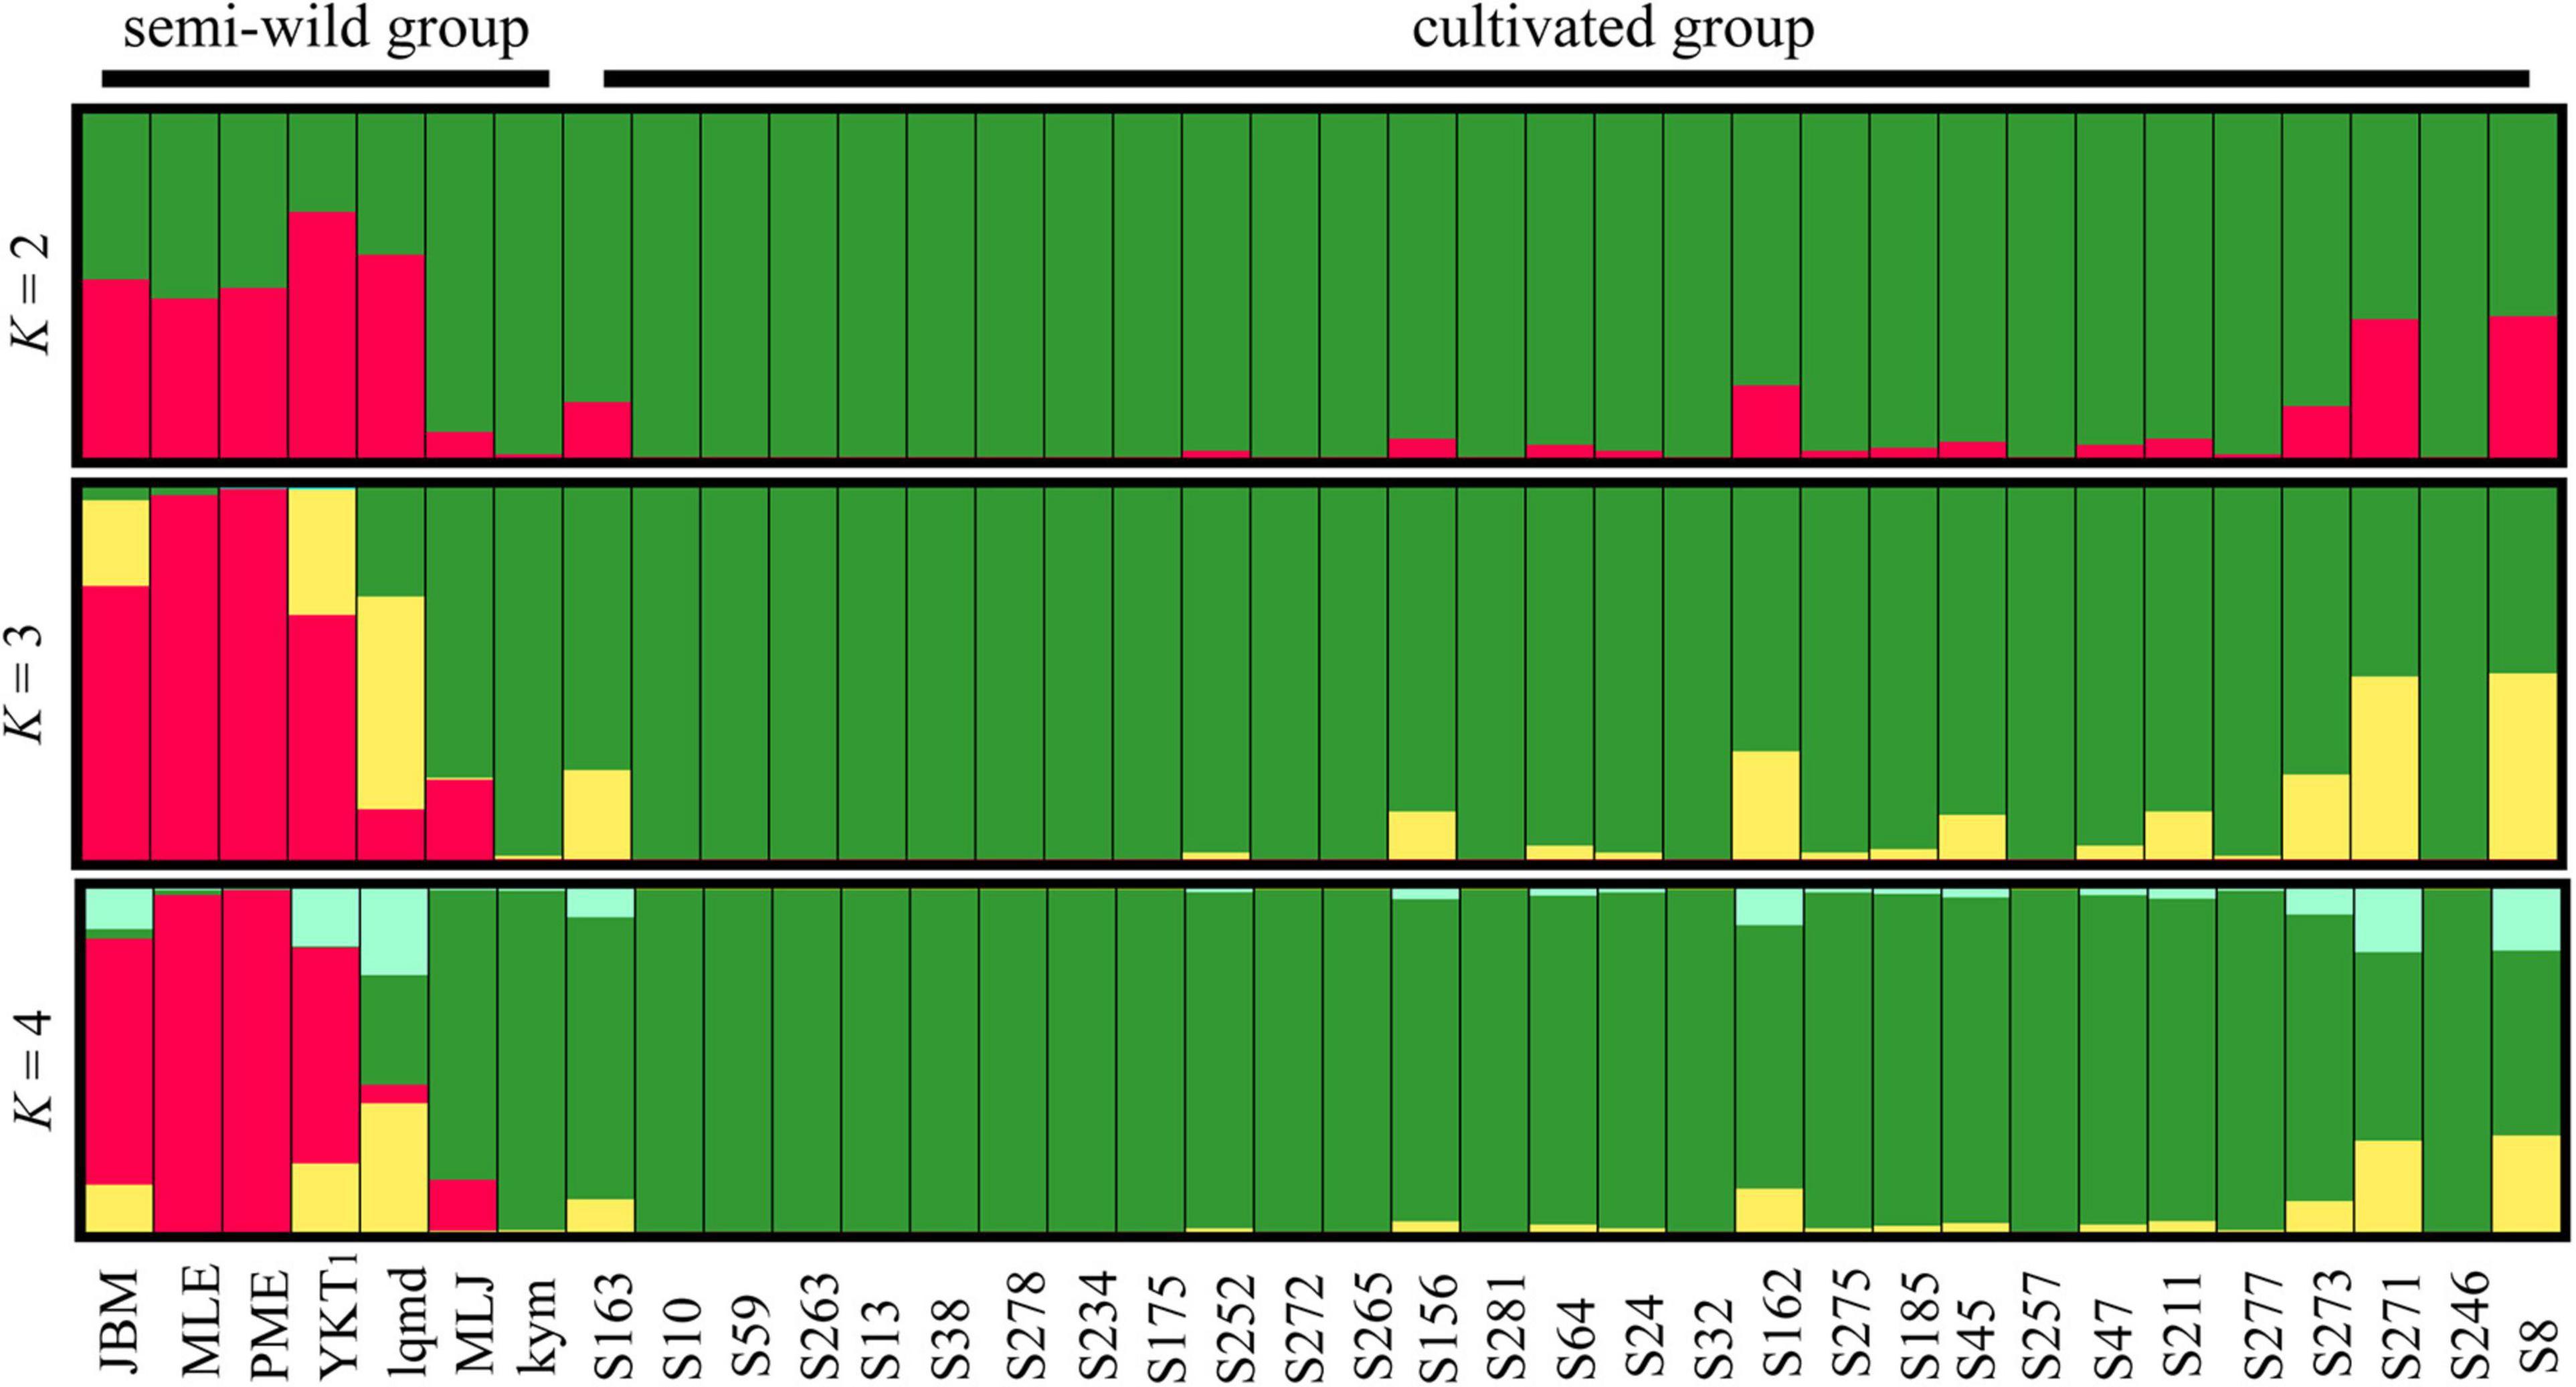
Figure 4. Bayesian clustering results obtained for cotton accessions by STRUCTURE analysis. Each individual is represented by a vertical bar, which is partitioned into K colored segments showing the individual’s probability of belonging to the group with that color.
Gene Flow
Patterns of historical and contemporary gene flow were detected between the semi-wild and cultivated upland cotton genotypes. Migrate-n analysis showed that historical gene flow ranged from 149.77 (135.69–164.85) for the semi-wild group to 377.47 (344.25–413.03) for the cultivated group, thereby indicating asymmetric gene flow between the groups. Significant asymmetric contemporary gene flow was also found between the groups, where the values ranged from 0.1110 (0.0612–0.1608) for the semi-wild group to 0.0108 (0.0004–0.0212) for the cultivated group. These results suggest a higher level of historical gene flow during domestication compared with the low level of contemporary gene flow.
Discussion
Evolutionary Relationships
Some previous studies have explored the molecular phylogenetic relationships of cotton, mostly based on a small number of plastids and nuclear DNA markers, as well as the complete chloroplast genome sequence and mitochondrial genome data set of a limited number of cotton species (Cronn et al., 2002; Senchina et al., 2003; Wendel et al., 2009; Xu et al., 2012; Wendel and Grover, 2015; Chen et al., 2016, 2017a,2017b; Wu et al., 2018). However, the relationship between cultivated accessions of upland cotton and other species of Gossypium is not clear now. Therefore, we built phylogenetic analyses on 72 cotton plastid genome sequences including wild species, semi-wild races and cultivated accessions of Gossypium, representing the largest number of known cotton species. In the phylogenetic tree, Gossypium species were primarily divided into three large genetic branches. The outer two branches mainly comprised diploid cotton species and the upland cotton clade formed the inner branch. One of the two outside branches included the Australian species with C, G, and K-genomes, American D-genome species, and African E- and B-genome species. Other studies have also shown that species with the G-genome have a common nested relationship with C-genome species, probably due to the frequent capture of chloroplasts in the G. bickii lineage (Seelanan et al., 1999; Liu et al., 2001). The other outside branch comprised the African F-genome species, Asian–African A-genome species, and American AD-genome wild species and cultivated G. barbadense genotypes. The large internal branch included all of the upland cotton cultivars and semi-wild races. The race latifolium clustered more closely with the upland cotton genotypes, which may suggest a classification error because the race yucatanense is considered the closest progenitor of cultivated upland cotton. Some studies have reported that the maternal donor of the chloroplast genome for the allotetraploid species was the A-genome progenitor (Cronn et al., 2002; Chen et al., 2016, 2017a; Huang et al., 2020), and this was supported by our phylogenetic analysis. The latest research showed that the two A-genome species (G. herbaceum and G. arboreum) have evolved independently with no ancestor-progeny relationship (Huang et al., 2020). In addition, the phylogenetic tree showed that all 13 D-genome species clustered into a single lineage with high support and they were more distantly related to the upland cotton genotypes. Some D-genome species formed closely associated pairs, including G. klotzschianum (D3–k) with G. davidsonii (D3–d), G. harknessii (D2–2) with G. turneri (D10), G. thurberi (D1) with G. trilobum (D8), and G. raimondii (D5) with G. gossypioides (D6). These results are consistent with previous reports of phylogenetic relationships based on nuclear genetic markers and chloroplast genome sequences (Alvarez et al., 2005; Ulloa et al., 2013; Chen et al., 2017a; Wu et al., 2018; Huang et al., 2020). The difference in phylogenetic relationships may be caused by the different genetic characteristics of the DNA markers used.
Divergence Time Analysis
We estimated the divergence time of Gossypium species based on the plastid protein-coding sequences. The results showed that the diversification between Gossypium and T. cacao was found to have occurred about 58 Mya, which was consistent with previous inferred results (Wendel, 1989; Senchina et al., 2003; Carvalho et al., 2011; Chen et al., 2016). Interestingly, the divergence time was estimated at 7.7 Mya (95% HPD = 6.3–9.8 Mya) between the B-genome and Australian clade (C + G + K), which was similar to the rapid radiation time calculated for all other cotton branches after differentiation from Australian cotton species (Chen et al., 2016). In addition, the evolutionary time of the cotton ancestors was 11 Mya and cotton species then rapidly differentiated radially, where the differentiation time of most branches was 5–6 Mya. These results were largely consistent with those obtained in other molecular studies (Chen et al., 2016, 2017a,2017b). The differentiation time for the semi-wild races, cultivated upland cotton genotypes, and AD-genome was estimated at 6.25 Mya, and that estimated for the race latifoloum and Gossypium hirsutum cultivar difenmian168 was 0.45 Mya. We also found that the divergence time betweem semi-wild races and cultivated upland cotton accessions were about 3.12 Mya, thereby indicating that they may have differentiated recently. The evolutionary time for the allotetraploid upland cotton accessions was 6.25 Mya (6.4–9.7), which agrees with the results obtained in previous studies (Senchina et al., 2003; Wang et al., 2017; Ma et al., 2019; Huang et al., 2020), where it was domesticated at least 4,000 to 5,000 years ago and subsequently subjected to direct selection (Wang et al., 2017). To the best of our knowledge, the present study is the first to use the protein-coding sequences in the chloroplast genome to estimate the divergence dates of the whole Gossypium species including semi-wild races and cultivated upland cotton genotypes, although the results could be improved by larger phylogenetic analyses.
Genetic Mutation
Mutation is the ultimate source of genetic variation, the substrate of evolution (Nachman and Crowell, 2000; Zhang et al., 2020). A previous study suggested that the mutation/substitution rates varied between and within genomes (Mohanta and Bae, 2017), and that they were influenced by factors such as the nearest neighbor bases, chromosomal position, and the efficiency of the repair systems between the leading and lagging DNA strands. In general, the presence of similar bases or derivatives of similar bases facilitates the base replacement in the DNA repair process, and thus transitions occur more frequently than transversions (Mohanta and Bae, 2017). Our results of nucleotide sequence evolution analysis showed that the transition rate was higher than the transversion rate for the cotton genotypes evaluated, which is consistent with previous reports (Mohanta and Bae, 2017; Mohanta et al., 2019). SNP represents the most common form of polymorphism in biological genomes. Common polymorphisms are effective genetic markers related to biological evolution (Zhang et al., 2020). In the present study, we identified 4,074 SNPs in the Gossypium cp genomes. Among them, there were more SNPs in the intergenic region than the intron region, indicating that intergenic spacer sequences were more variable than intron regions in the plastid genome, which was consistent with the latest research results (Zhang et al., 2020). Furthermore, the dN/dS ratios were larger than 1, thereby indicating that non-synonymous mutations were fixed in the genomes, which may be due to component-driven mutation pressure (Foster et al., 1997). The dN/dS ratios were higher for the semi-wild and cultivated upland cotton genotypes than those determined for the wild cotton species, which may suggest that upland cotton has been subject to very strong artificial selection during domestication. The results of evolutionary rates indicated that the rates of nucleotide substitutions and indels were higher in wild species than the upland genotypes, thereby suggesting that the semi-wild and cultivated upland genotypes might have evolved more slowly after speciation. Due to the influence of artificial domestication, the cultivated genotypes exhibited less variation with fewer mutations. Previous studies have shown that selection can act on the mutation rate (Baer et al., 2007). Moreover, according to our results, the mutation rate was lower for indels than nucleotide substitutions, which is consistent with a previous report (Wu et al., 2018).
Domestication Selection
By the mid-18th century, the coastal colonies of the southeastern United States had developed upland and Sea Island cotton varieties, which showed a long history of cotton domestication and breeding (Du et al., 2017). Evidence suggested that the domestication and breeding of allotetraploid cotton were superior to A-genomic diploid cotton in yield and quality (Hovav et al., 2008). And the allopolyploid cultivated cotton was first domesticated about 5,000 years ago (Yoo et al., 2014). Generally, synonymous and non-synonymous nucleotide substitutions are important markers of gene evolution. In most genes, synonymous nucleotide substitutions have occurred more frequently than non-synonymous substitutions (Ogawa et al., 1999). The rates of non-synonymous and synonymous substitutions are relatively slow in plant chloroplast genomes because of purifying and neutral selection (Erixon and Oxelman, 2008; Ivanova et al., 2017). In the present study, selection pressure analysis identified 16 genes with sites under positive selection in the wild species group, but only one of these genes (rpl2) was identified in the semi-wild and cultivated group. We conclude that the selection pressure on semi-wild and cultivated cotton species has fewer genes at positive selection sites, whereas the wild species retained adaptive genes and the selected sites increased. These results are generally consistent with those obtained in previous studies of the effects of artificial domestication on selection pressure (Price, 2002). When plants experience relatively large changes in the environment, such as artificial domestication or natural selection, the relaxation of selection for certain characteristics is inevitable (Coss, 1999; Price, 2002). Thereby, humans would expect that natural selection of these features would lose its strength (Price, 2002). The rpl2 domestication selection gene identified in semi-wild and cultivated cotton species may have played an important role in the adaptation of Gossypium to various environments (Price, 2002; Fan et al., 2018; Wu et al., 2018; Chen et al., 2020). Moreover, selection pressure analysis for wild and domesticated cotton species can provide novel insights into how human selection has affected duplicated genes in allopolyploids (Yoo et al., 2014; Chen et al., 2020). It is known that many important crops such as potato, wheat and soybean are obvious polyploids, so studying the genes of allopolyploid cotton may provide new insights into the role of polyploids in crop evolution (Yoo et al., 2014).
Genetic Diversity
Additionally, genetic diversity is the basis of crop improvement (Akter et al., 2019). Therefore, understanding the genetic diversity, structure, and relationships between varieties of upland cotton is very important for breeding (Fang et al., 2013). The semi-wild races exhibited higher nucleotide diversity (Hd = 1.000, π = 0.00035) than the cultivated genotypes (Hd = 0.946, π = 0.00010), thereby suggesting that artificial domestication reduced the chloroplast genetic diversity, which is consistent with a previous report (Ma et al., 2019). The low level of genetic diversity determined in the cultivated upland cotton accessions was primarily due to several genetic bottlenecks during the domestication process (Fang et al., 2013; Wang et al., 2017). Various studies have also suggested that the genetic basis of cultivated upland cotton genotypes is narrow (Abdurakhmonov et al., 2008; Campbell et al., 2009; Akter et al., 2019), although the diversity of derived cultivars obtained by various breeding methods is still evident. In addition, cotton breeding often involves hybridization and re-selection with a small number of breeding materials, thereby resulting in a loss of genetic diversity (Tyagi et al., 2014). The genetic structure is mainly affected by geographical isolation and genetic exchange isolation (Guo et al., 1997; Gutierrez et al., 2002). Genetic structure analysis showed that the semi-wild races and cultivated upland accessions were divided into two groups when K = 2. We observed that the seven semi-wild races and cultivated upland accessions exhibited significant admixture, that was, the two semi-wild races Marie-galante and latifolium had notable fractions assigned to cultivated accessions group, which indicated that the race latifolium had closest relationships with cultivated accessions, followed by the race marie-galante race, thereby indicating the introgression of a certain gene between the semi-wild races and cultivated accessions, or possibly germplasm sharing (Tyagi et al., 2014). These results were consistent with a previous study on increasing human-mediated effects leading to significantly genetic introgression (Du et al., 2017). A previous study also showed that the existence of this mixture may be related to the domestication history and the frequent appearance of superior genotypes in different breeding programs (Mulugeta et al., 2018). China is not a natural cotton-growing region, and thus many cotton genotypes, such as Foster, STV, DPL, Trice, King, and Uganda, have been introduced as extensive genetic sources for upland cotton varieties in China from several overseas sources for improving varieties (Chen and Du, 2006; Du et al., 2007; Jia et al., 2014a; Mulugeta et al., 2018). It is important to study the diversity and genetic structure of upland cotton genotypes as well as their relationships to facilitate the conservation and improvement of cotton (Mulugeta et al., 2018). In addition, the genetic diversity and population structure of upland cotton germplasm resources can be effectively used for genetic breeding, and it is of great significance for the systematic utilization of long-term genetic variation of upland cotton (Tyagi et al., 2014).
Genetic Introgression
Ancient gene flow between domesticated varieties and their wild relatives probably occurred historically through seed transmission, and it was possibly influenced by human activities and environmental events (Wegier et al., 2011). In the present study, asymmetric historical gene flow was determined between the semi-wild and cultivated upland genotypes, which is consistent with a previous study (Deynze et al., 2011). However, contemporary gene flow was greatly reduced, which may have been due to current isolation. Genetic studies of species in the early stages of domestication have identified multiple domestication origins or high levels of sustained gene flow between wild and cultivated genotypes (Gross and Olsen, 2010). A previous study also suggested that the genetic structure of upland cotton genotypes was weak or an admixture, which may have resulted in a strong historical gene flow (Epps et al., 2013). In general, gene flow is an important factor that affects the population structure over time, where it may reduce local adaptation by homogenizing the populations found in different environments or by spreading harmful alleles between populations. Gene flow might also contribute to the introduction of potential adaptive alleles into populations and increased genetic variation (Sexton et al., 2011; Epps and Keyghobadi, 2015; Welt et al., 2015). Some studies have also indicated that gene flow from cultivated upland genotypes to wild cotton tetraploid species has increased the risk of extinction for these wild species (Wegier et al., 2011). I.e., some wild cotton species G. tomentosum (in Hawaii), G. mustelinum (in Brazil) and G. darwinii (in Galapagos) were in danger of extinction as a result of hybridization with domesticated tetraploid cotton (Ellstrand, 2003; Simard, 2010). In addition, numerous studies have shown that interspecific hybrids (G. hirsutum x G. barbadense) can serve as genetic links for gene transfer from domesticated cotton to other wild relatives (G. darwinii) (Ellstrand, 2003; Simard, 2010). This occurred during or after speciation lead to the retention of ancestral polymorphism due to incomplete lineage sorting (Heckman et al., 2007; Wilyard et al., 2009), or introgression or introgressive hybridization of previously geographically isolated species resulting from the genetic exchange after secondary contact (Liston et al., 1999; Gay et al., 2007). Moreover, among the four cultivated Gossypium plants, upland cotton exhibits the highest level of gene flow (Wendel et al., 1992; Abdurakhmonov et al., 2008), which is related to the strong artificial domestication that it has undergone. The extensive gene flow and/or genetic introgression among cotton accessions might have provided the novel genetic resources of cotton breeding. Therefore, the suitable management and conservation of different cotton species accessions are important in the future.
Conclusion
In conclusion, our phylogenetic analysis confirms the evolutionary relationship within the whole Gossypium, especially the relationships between semi-wild races and cultivated accessions were well resolved. We also identified that the rpl2 gene was positively selected in semi-wild races and cultivated genotypes. Meanwhile, we found that the cultivated genotypes have experienced very strong selection pressure. In addition, we found that the genetic diversity of cultivated accessions was low compared to wild ones due to artificial domestication. Through the analyses of genetic structure and gene flow, we concluded that there was a certain gene introgression between semi-wild races and cultivated accessions. The present research provided novel genetic resources for cotton breeding, as well as novel molecular mechanisms insights for the evolution and domestication of cotton species.
Data Availability Statement
The original contributions presented in the study are included in the article/Supplementary Material, further inquiries can be directed to the corresponding author/s.
Author Contributions
TZ, NW, and Z-HL: data curation and writing – original draft. YW: formal analysis. TZ, NW, and X-FM: investigation. YW, X-LZ, B-GL, WL, J-JS, C-XW, and AZ: methodology. X-FM: resources and validation. TZ and NW: software. Z-HL: supervision and writing – review & editing. All authors contributed to the article and approved the submitted version.
Funding
This research was funded by grants from the National Key R&D Program (2021YFF1000100), the Innovation Project of the Chinese Academy of Agricultural Sciences (CAAS-ASTIP-ICR-KP-2021-01), the Xinjiang Tianshan Talents Program (2021), the Central Public-interest Scientific Institution Basal Research Fund (Y2021XK12), the Project of Introduction High-level Talents in Xinjiang Uygur Autonomous Region Flexible Talents (2020), the Shaanxi Science and Technology Innovation Team (2019TD-012), and the Key Program of Research and Development of Shaanxi Province (2022ZDLSF06-02), and the Public Health Specialty in the Department of Traditional Chinese Medicine (2019-39).
Conflict of Interest
The authors declare that the research was conducted in the absence of any commercial or financial relationships that could be construed as a potential conflict of interest.
Publisher’s Note
All claims expressed in this article are solely those of the authors and do not necessarily represent those of their affiliated organizations, or those of the publisher, the editors and the reviewers. Any product that may be evaluated in this article, or claim that may be made by its manufacturer, is not guaranteed or endorsed by the publisher.
Supplementary Material
The Supplementary Material for this article can be found online at: https://www.frontiersin.org/articles/10.3389/fpls.2022.873788/full#supplementary-material
References
Abdurakhmonov, I., Kohel, R., Yu, J., Pepper, A., Abdullaev, A., Kushanov, F., et al. (2008). Molecular diversity and association mapping of fiber quality traits in exotic G. hirsutum L. germplasm. Genomics 92, 478–487. doi: 10.1016/j.ygeno.2008.07.013
Akter, T., Islam, A. K. M. A., Rasul, M. G., Kundu, S., Khalequzzaman, J. U., and Ahmed, J. U. (2019). Evaluation of genetic diversity in short duration cotton (Gossypium hirsutum L.). J. Cotton Res. 2:1. doi: 10.1186/s42397-018-0018-6
Alvarez, I., Cronn, R., and Wendel, J. F. (2005). Phylogeny of the new world diploid cottons (Gossypium L., Malvaceae) based on sequences of three low-copy nuclear genes. Plant Syst. Evol. 252, 199–214. doi: 10.1007/s00606-004-0294-0
Baer, C. F., Miyamoto, M. M., and Denver, D. R. (2007). Mutation rate variation in multicellular eukaryotes: causes and consequences. Nat. Rev. Genet. 8, 619–631. doi: 10.1038/nrg2158
Beerli, P. (2006). Comparison of bayesian and maximum likelihood inference of population genetic parameters. Bioinformatics 22, 341–345. doi: 10.1093/bioinformatics/bti803
Brubaker, C. L., and Wendel, J. F. (1994). Re-evaluating the origin of domesticated cotton (Gossypium hirsutum: Malvaceae) using nuclear restriction fragment length polymorphisms (RFLPs). Am. J. Bot. 81, 1309–1326. doi: 10.2307/2445407
Burger, J. C., Chapman, M. A., and Burke, J. M. (2008). Molecular insights into the evolution of crop plants. Am. J. Bot. 95, 113–122. doi: 10.2307/27733400
Campbell, B. T., Williams, V. E., and Park, W. (2009). Using molecular markers and field performance data to characterize the Pee Dee cotton germplasm resources. Euphytica 169, 285–301. doi: 10.1007/s10681-009-9917-4
Carvalho, M. R., Herrera, F. A., Jaramillo, C. A., Wing, S. L., and Callejas, R. (2011). Paleocene malvaceae from northern South America and their biogeographical implications. Am. J. Bot. 98, 1337–1355. doi: 10.3732/ajb.1000539
Chen, G., and Du, X. M. (2006). Genetic diversity of source germplasm of upland cotton in China as determined by SSR marker. Acta Genet. Sinica 33, 733–745. doi: 10.1016/S0379-4172(06)60106-6
Chen, S. L., Pang, X. H., Song, J. Y., Shi, L. C., Yao, H. W., Han, J. P., et al. (2014). A renaissance in herbal medicine identification: from morphology to DNA. Biotechnol. Adv. 32, 1237–1244. doi: 10.1016/j.biotechadv.2014.07.004
Chen, Z. W., Feng, K., Grover, C. E., Li, P., Liu, F., Wang, Y. M., et al. (2016). Chloroplast DNA structural variation, phylogeny, and age of divergence among diploid cotton species. PLoS One 11:e0157183. doi: 10.1371/journal.pone.0157183
Chen, Z., Grover, C. E., Li, P. B., Wang, Y. M., Nie, H. S., Zhao, Y. P., et al. (2017a). Molecular evolution of the plastid genome during diversification of the cotton genus. Mol. Phylogenet. Evol. 112, 268–276. doi: 10.1016/j.ympev.2017.04.014
Chen, Z., Nie, H., Grover, C. E., Wang, Y., Li, P., Wang, M., et al. (2017b). Entire nucleotide sequences of Gossypium raimondii and G. arboreum mitochondrial genome srevealed a-genome speciesas cytoplasmic donor of the allotetraploid species. Plant Biol. 19, 484–493. doi: 10.1111/plb.12536
Chen, Z. J., Sreedasyam, A., Ando, A., Song, Q., Santiago, L. M., Hulse-Kemp, A. M., et al. (2020). Genomic diversifications of five Gossypium allopolyploid species and their impact on cotton improvement. Nat. Genet. 52, 525–533. doi: 10.1038/s41588-020-0614-5
Chevreux, B., Pfisterer, T., Drescher, B., Driesel, A. J., Müller, W. E., Wetter, T., et al. (2004). Using the miraEST assembler for reliable and automated mRNA transcript assembly and SNP detection in sequenced ESTs. Genome Res. 14, 1147–1159. doi: 10.1101/gr.1917404
Coss, R. G. (1999). “). Effects of relaxed natural selection on the evolution of behavior. geographic variation,” in Behavior: Perspectives on Evolutionary Mechanisms, eds S. A. Foster and J. A. Endler (New York, NY: Oxford University Press). 180–208. doi: 10.1099/vir.0.81834-0
Cronn, R. C., Small, R. L., Haselkorn, T., and Wendel, J. F. (2002). Rapid diversification of the cotton genus (Gossypium: Malvaceae) revealed by analysis of sixteen nuclear and chloroplast genes. Am. J. Bot. 89, 707–725. doi: 10.3732/ajb.89.4.707
Denver, D. R., Dolan, P. C., Wilhelm, L. J., Sung, W., Lucas-Lledo, J. I., Howe, D. K., et al. (2009). A genome-wide view of Caenorhabditis elegans base-substitution mutation processes. Proc. Natl. Acad. Sci. U.S.A. 106, 16310–16314. doi: 10.1073/pnas.0904895106
Deynze, A. E. V., Hutmacher, R. B., and Bradford, K. J. (2011). Gene flow between Gossypium hirsutum L. and Gossypium barbadense L. is asymmetric. Crop Sci. 51, 298–305. doi: 10.2135/cropsci2010.04.0213
Doyle, J. J., and Doyle, J. L. (1987). A rapid DNA isolation procedure for small quantities of fresh leaf tissue. Phytochem. Bull. 19, 11–15.
Drummond, A. J., Suchard, M. A., Xie, D., and Rambaut, A. (2012). Bayesian phylogenetics with beauti and the beast 1.7. Mol. Biol. Evol. 29, 1969–1973. doi: 10.1093/molbev/mss075
Du, X. M., Zhou, Z. L., Jia, Y. H., and Liu, G. Q. (2007). Collection and conservation of cotton germplasm in China (english abstract). Cotton Sci. 19, 346–353.
Du, F. K., Hou, M., Wang, W., Mao, K., and Hampe, A. (2017). Phylogeography of Quercus aquifolioides provides novel insights into the Neogene history of a major global hotspot of plant diversity in South-West China. J. Biogeogr. 44, 294–307. doi: 10.1111/jbi.12836
Du, X., Huang, G., He, S., Yang, Z., Sun, G., Ma, X., et al. (2018). Resequencing of 243 diploid cotton accessions based on an updated a genome identifies the genetic basis of key agronomic traits. Nat. Genet. 50, 796–802. doi: 10.1038/s41588-018-0116-x
Earl, D. A., and VonHoldt, B. M. (2012). STRUCTURE HARVESTER: a website and program for visualizing STRUCTURE output and implementing the evanno method. Conserv. Genet. Resour. 4, 359–361. doi: 10.1007/s12686-011-9548-7
Ellstrand, N. C. (2003). Dangerous liaisons-when cultivated plants mate with their wild relatives. Plant Sci. 167, 187–188. doi: 10.1016/j.plantsci.2004.02.020
Epps, C. W., Castillo, J. A., Schmidt-Kuntzel, A., du Preez, P., Stuart-Hill, G., Jago, M., et al. (2013). Contrasting historical and recent gene flow among African buffalo herds in the Caprivi Strip of Namibia. J. Hered. 104, 172–181. doi: 10.1093/jhered/ess142
Epps, C. W., and Keyghobadi, N. (2015). Landscape genetics in a changing world: disentangling historical and contemporary influences and inferring change. Mol. Ecol. 24, 6021–6040. doi: 10.1111/mec.13454
Erixon, P., and Oxelman, B. (2008). Whole-gene positive selection, elevated synonymous substitu-tion rates, duplication, and indel evolution of the chloroplast clpP1 gene. PLoS One 3:e1386. doi: 10.1371/journal.pone.0001386
Evanno, G., Regnaut, S., and Goudet, J. (2005). Detecting the number of clusters of individuals using the software STRUCTURE: a simulation study. Mol. Ecol. 14, 2611–2620. doi: 10.1111/j.1365294X.2005.02553.x
Falush, D., Stephens, M., and Pritchard, J. K. (2003). Inference of population structure using multilocus genotype data: linked loci and correlated allele frequencies. Genetics 164, 1567–1587. doi: 10.3410/f.1015548.197423
Fan, W. B., Wu, Y., Yang, J., Shahzad, K., and Li, Z. H. (2018). Comparative chloroplast genomics of dipsacales species: insights into sequence variation, adaptive evolution, and phylogenetic relationships. Front. Plant Sci. 9:689. doi: 10.3389/fpls.2018.00689
Fang, D. D., Hinze, L. L., Percy, R. G., Li, P., and Thyssen, G. (2013). A microsatellite-based genome-wide analysis of genetic diversity and linkage disequilibrium in upland cotton (Gossypium hirsutum L.) cultivars from major cotton-growing countries. Euphytica 191, 391–401. doi: 10.1007/s10681-013-0886-2
Fang, L., Wang, Q., Hu, Y., Jia, Y., Che, J., Liu, B., et al. (2017). Genomic analyses in cotton identify signatures of selection and loci associated with fiber quality and yield traits. Nat. Genet. 49, 1089–1098. doi: 10.1038/ng.3887
Feng, L., Zheng, Q. J., Qian, Z. Q., Yang, J., Zhang, Y. P., Li, Z. H., et al. (2016). Genetic structure and evolutionary history of three alpine sclerophyllous oaks in east himalaya-hengduan mountains and adjacent regions. Front. Plant Sci. 7:1688. doi: 10.3389/fpls.2016.01688
Foster, P. G., Jermiin, L. S., and Hickey, D. A. (1997). Nucleotide composition bias affects amino acid content in proteins coded by animal mitochondria. J. Mol. Evol. 44, 282–288. doi: 10.1007/PL00006145
Fryxell, P. A. (1969). A classification of Gossypium L. (Malvaceae). Taxon 18, 585–591. doi: 10.2307/1218405
Fryxell, P. A. (1978). The Natural History of the Cotton Tribe (Malvaceae tribe, Gossypieae). College Station, TX: Texas A&M University Press.
Gay, L., Neubauer, G., Zagalska-Neubauer, M., Debain, C., Pons, J. M., David, P., et al. (2007). Molecular and morphological patterns of introgression between two large white-headed gull species in a zone of recent secondary contact. Mol. Ecol. 16, 3215–3227. doi: 10.1111/j.1365-294X.2007.03363.x
Gepts, P. (2004). Crop domestication as a dong-term selection experiment. Plant Breed. Rev. 24, 1–44. doi: 10.1002/9780470650288.ch1
Gross, B. L., and Olsen, K. M. (2010). Genetic perspectives on crop domestication. Trends Plant Sci. 15, 529–537. doi: 10.1016/j.tplants.2010.05.008
Grover, C. E., Kim, H. R., Wing, R. A., Paterson, A. H., and Wendel, J. F. (2007). Microcolinearity and genome evolution in the AdhA region of diploid and polyploid cotton (Gossypium). Plant J. 50, 995–1006. doi: 10.1111/j.1365-313X.2007.03102.x
Gover, C. E., Pan, M., Yuan, D., Arick, M. A., Hu, G., Brase, L., et al. (2020). The Gossypium longicalyx genome as a resource for cotton breeding and evolution. G3: Genes Genom. Genet. 10, 1457–1467. doi: 10.1534/g3.120.401050
Guo, W. Z., Zhang, T. Z., Pan, J. J., and Wang, X. Y. (1997). A preliminary study on genetic diversity of Upland cotton cultivars in China. Acta Gossypii. Sinica. 9, 19–24.
Gutierrez, O. A., Basu, S., Saha, S., Jenkins, J. N., Shoemaker, D. B., Cheatham, C. L., et al. (2002). Genetic distance among selected cotton genotypes and its relationship with F2 performance. Crop Sci. 42, 1841–1847. doi: 10.2135/cropsci2002.1841
Hahn, C., Bachmann, L., and Chevreux, B. (2013). Reconstructing mitochondrial genomes directly from genomic next-generation sequencing reads-a baiting and iterative mapping approach. Nucleic Acids Res. 41:e129. doi: 10.1093/nar/gkt371
Heckman, K. L., Mariani, C. L., Rasoloarison, R., and Yoder, A. D. (2007). Multiple nuclear loci reveal patterns of incomplete lineage sorting and complex species history within western mouse lemurs (Microcebus). Mol. Phylogenet. Evol. 43, 353–367. doi: 10.1016/j.ympev.2007.03.005
Hu, G., Koh, J., Yoo, M. J., Grupp, K., Chen, S., and Wendel, J. F. (2013). Proteomic profiling of developing cotton fibers from wild and domesticated Gossypium barbadense. New Phytol. 200, 570–582. doi: 10.1111/nph.12381
Huang, G., Wu, Z., Percy, R. G., Bai, M., Li, Y., Frelichowski, J. E., et al. (2020). Genome sequence of Gossypium herbaceum and genome updates of Gossypium arboreum and Gossypium hirsutum provide insights into cotton a-genome evolution. Nat. Genet. 52, 516–524. doi: 10.1038/s41588-020-0607-4
Hovav, R., Chaudhary, B., Udall, J. A., Flagel, L., and Wendel, J. F. (2008). Parallel domestication, convergent evolution and duplicated gene recruitment in allopolyploid cotton. Genetics 179, 1725–1733. doi: 10.1534/genetics.108.089656
Hubisz, M. J., Falush, D., Stephens, M., and Pritchard, J. K. (2009). Inferring weak population structure with the assistance of sample group information. Mol. Ecol. Resour. 9, 1322–1332. doi: 10.1111/j.1755-0998.2009.02591.x
Iqbal, M. J., Reddy, O. U. K., El-Zik, K. M., and Pepper, A. E. (2001). A genetic bottleneck in the ‘evolution under domestication’ of upland cotton Gossypium hirsutum L. examined using DNA fingerprinting. Theor. Appl. Genet. 103, 547–554. doi: 10.1007/PL00002908
Ivanova, Z., Sablok, G., Daskalova, E., Zahmanova, G., Apostolova, E., Yahubyan, G., et al. (2017). Chloroplast genome analysis of resurrection tertiary relict Haberlea rhodo-pensis highlights genes important for desiccation stress response. Front. Plant Sci. 8:204. doi: 10.3389/fpls.2017.00204
Jakobsson, M., and Rosenberg, N. A. (2007). Clumpp: a cluster matching and permutation program for dealing with label switching and multimodality in analysis of population structure. Bioinformatics 23, 1801–1806. doi: 10.1093/bioinformatics/btm233
Jansen, R. K., Raubeson, L. A., Boore, J. L., Chumley, T. W., Haberle, R. C., Wyman, S. K., et al. (2007). Methods for obtaining and analyzing whole chloroplast genome sequences. Methods Enzymol. 395, 348–384. doi: 10.1016/S0076-6879(05)95020-9
Jia, Y. H., Sun, J. L., and Du, X. M. (2014a). “Cotton germplasm resources in China,” in World Cotton Germplasm Resources, ed. I. Y. Abdurakhmonov (Uzbekistan: Academy of Sciences of Uzbekistan).
Katoh, K., and Standley, D. M. (2013). MAFFT multiple sequence alignment software version 7: improvements in performance and usability. Mol. Biol. Evol. 30, 772–780. doi: 10.1093/molbev/mst010
Kearse, M., Moir, R., Wilson, A., Stones-Havas, S., Cheung, M., Sturrock, S., et al. (2012). Geneious basic: an integrated and extendable desktop software platform for the organization and analysis of sequence data. Bioinformatics 28, 1647–1649. doi: 10.1093/bioinformatics/bts199
Kumar, S., Stecher, G., and Tamura, K. (2016). MEGA7: molecular evolutionary genetics analysis version 7.0 for bigger datasets. Mol. Biol. Evol. 33, 1870–1874. doi: 10.1093/molbev/msw054
Li, F. G., Fan, G. Y., Wang, K. B., Sun, F. M., Yuan, Y. Y., and Song, G. L. (2014). Genome sequence of the cultivated cotton Gossypium arboretum. Nat. Genet. 46, 567–572. doi: 10.1038/ng.2987
Li, F. G., Fan, G. Y., Lu, C. R., Xiao, G. H., Zou, C. S., and Kohel, R. J. (2015). Genome sequence of cultivated Upland cotton (Gossypium hirsutum TM-1) provides insights into genome evolution. Nat. Biotechnol. 33, 524–530. doi: 10.1038/nbt.3208
Li, L., Hu, Y., He, M., Zhang, B., Wu, W., Cai, P., et al. (2021). Comparative chloroplast genomes: insights into the evolution of the chloroplast genome of Camellia sinensis and the phylogeny of Camellia. BMC Genet. 22:138. doi: 10.1186/s12864-021-07427-2
Li, Y. Z., Liu, Z., Zhang, K. Y., Chen, S. Y., and Zhang, Q. D. (2020). Genome-wide analysis and comparison of the DNA-binding one zinc finger gene family in diploid and tetraploid cotton (Gossypium). PLoS One 15:e0235317. doi: 10.1371/journal.pone.0235317
Librado, P., and Rozas, J. (2009). DnaSPv5: a software for comprehensive analysis of DNA polymorphism data. Bioinformatics 25, 1451–1452. doi: 10.1093/bioinformatics/btp187
Liu, Q., Brubaker, C. L., Green, A. G., Marshall, D. R., Sharp, P. J., and Singh, S. P. (2001). Evolution of the FAD2-1 fatty acid desaturase 5’UTR intron and the molecular systematics of Gossypium (Malvaceae). Am. J. Bot. 88, 92–102. doi: 10.2307/2657130
Liston, A., Robinson, W. A., Piñero, D., and Alvarez-Buylla, E. R. (1999). Phylogenetics of Pinus (Pinaceae) based on nuclear ribosomal DNA internal transcribed spacer region sequences. Mol. Phylogenet. Evol. 11, 95–109. doi: 10.1006/mpev.1998.0550
Ma, X. F., Wang, Z. Y., Li, W., Zhang, Y. Z., Zhou, X. J., Liu, Y. A., et al. (2019). Resequencing core accessions of a pedigree identifies derivation of genomic segments and key agronomic trait loci during cotton improvement. Plant Biotechnol. J. 17, 762–775. doi: 10.1111/pbi.13013
Mabry, M. E., Turner-Hissong, S. D., Gallagher, E. Y., McAlvay, A. C., An, H., Edger, P. P., et al. (2021). The Evolutionary History of Wild, Domesticated, and Feral Brassica oleracea (Brassicaceae). Mol. Biol. Evol. 38, 4419–4434. doi: 10.1093/molbev/msab183
May, O. L., Bowman, D. T., and Calhoun, D. S. (1995). Genetic diversity of US upland cotton cultivars released between 1980 and 1990. Crop Sci. 35, 1570–1574. doi: 10.2135/cropsci1995.0011183X003500060009x
Meirmans, P. G. (2014). Nonconvergence in bayesian estimation of migration rates. Mol. Ecol. Resour. 14, 726–733. doi: 10.1111/1755-0998.12216
Mohanta, T. K., and Bae, H. (2017). Analyses of genomic tRNA reveal presence of novel tRNAs in Oryza sativa. Front. Genet. 8:90. doi: 10.3389/fgene.2017.00090
Mohanta, T. K., Khan, A. L., Hashem, A., Allah, E. F. A., Yadav, D., and Al-Harrasi, A. (2019). Genomic and evolutionary aspects of chloroplast tRNA in monocot plants. BMC Plant Biol. 19:39. doi: 10.1186/s12870-018-1625-6
Mulugeta, S., Ming, D. X., Pu, H. S., Hua, J. Y., Zhaoe, P., and Ling, S. J. (2018). Analysis of genetic diversity and population structure in upland cotton (Gossypium hirsutum L.) germplasm using simple sequence repeats. J. Genet. 97, 513–522. doi: 10.1007/s12041-018-0943-7
Nachman, M. W., and Crowell, S. L. (2000). Estimate of the mutation rate per nucleotide in humans. Genetics 156, 297–304. doi: 10.1093/genetics/156.1.297
Nei, M., and Li, W. H. (1979). Mathematical model for studying genetic variation in terms of restriction endonucleases. Proc. Natl. Acad. Sci. U.S.A. 76, 5269–5273. doi: 10.1073/pnas.76.10.5269
Nei, M., and Tajima, F. (1981). DNA polymorphism detectable by restriction endonucleases. Genetics 97, 145–163. doi: 10.1007/BF00135050
Niu, E., Jiang, C., Wang, W., Zhang, Y., and Zhu, S. (2020). Chloroplast genome variation and evolutionary analysis of Olea europaea L. Genes 11:879. doi: 10.3390/genes11080879
Ogawa, T., Ishii, C., Kagawa, D., Muramoto, K., and Kamiya, H. (1999). Accelerated evolution in the protein-coding region of galectin cDNAs, congerin I and congerin II, from skin mucus of conger eel (Conger myriaster). Biosci. Biotechnol. Biochem. 63, 1203–1208. doi: 10.1271/bbb.63.1203
Parks, M., Cronn, R., and Liston, A. (2009). Increasing phylogenetic resolution at low taxonomic levels using massively parallel sequencing of chloroplast genomes. BMC Biol. 7:84. doi: 10.1186/1741-7007-7-84
Patel, R. K., and Jain, M. (2012). NGS QC Toolkit: a toolkit for quality control of next generation sequencing data. PloS one. 7:e30619. doi: 10.1371/journal.pone.0030619
Pfeil, B. E., and Crisp, M. D. (2008). The age and biogeography of citrus and the orange subfamily (Rutaceae: Aurantioideae) in Australasia and New Caledonia. Am. J. Bot. 95, 1621–1631. doi: 10.2307/41923047
Posada, D., and Crandall, K. A. (1998). Modeltest: testing the model of DNA substitution. Bioinformatics 14, 817–818. doi: 10.1093/bioinformatics/14.9.817
Pritchard, J. K., Stephens, M., and Donnelly, P. (2000). Inference of population structure using multilocus genotype data. Genetics 155, 945–959. doi: 10.1093/genetics/155.2.945
Rosenberg, N. A. (2004). Distruct: a program for the graphical display of population structure. Mol. Ecol. Resour. 4, 137–138. doi: 10.1046/j.1471-8286.2003.00566.x
Ruan, Y. L. (2003). Suppression of sucrose synthase gene expression represses cotton fiber cell initiation, elongation, and seed development. Plant Cell 15, 952–964. doi: 10.1105/tpc.010108
Saitou, N., and Ueda, S. (1994). Evolutionary rates of insertion and deletion in noncoding nucleotide sequences of primates. Mol. Biol. Evol. 11, 504–512. doi: 10.1016/0303-7207(94)90253-4
Schattner, P., Brooks, A. N., and Lowe, T. M. (2005). The tRNAscan-SE, snoscan and snoGPS web servers for the detection of tRNAs and snoRNAs. Nucleic Acids Res. 33, 686–689. doi: 10.1093/nar/gki366
Seelanan, T., Brubaker, C. L., Stewart, J. M., Craven, L. A., and Wendel, J. F. (1999). Molecular systematics of Australian Gossypium section Grandicalyx (Malvaceae). Syst. Bot. 24:183. doi: 10.2307/2419548
Senchina, D. S., Alvarez, I., Cronn, R. C., Liu, B., Rong, J., Noyes, R. D., et al. (2003). Rate variation among nuclear genes and the age of polyploidy in Gossypium. Mol. Biol. Evol. 20, 633–643. doi: 10.1093/molbev/msg065
Sexton, J. P., Strauss, S. Y., and Rice, K. J. (2011). Gene flow increases fitness at the warm edge of a species’ range. Proc. Natl. Acad. Sci. U.S.A 108, 11704–11709. doi: 10.1073/pnas.1100404108
Simard, M. J. (2010). Gene flow between crops and their wild relatives. Evol. Appl. 3, 402–403. doi: 10.1111/j.1752-4571.2010.00138.x
Simon, R. B., Justin, T. P., Joshua, A. U., William, S. S., Daniel, G. P., Mark, A. A., et al. (2016). Independent domestication of two old world cotton species. Genome Biol. Evol. 8, 1940–1947. doi: 10.1093/gbe/evw129
Stamatakis, A. (2006). RAxML-VI-HPC: maximum likelihood-based phylogenetic analyses with thousands of taxa and mixed models. Bioinformatics 22, 2688–2690. doi: 10.1093/bioinformatics/btl446
Tyagi, P., Gore, M., Bowman, D., Campbell, B., Udall, J., and Kuraparthy, V. (2014). Genetic diversity and population structure in the US upsland cotton (Gossypium hirsutum L.). Theor. Appl. Genet. 127, 283–295. doi: 10.1007/s00122-013-2217-3
Ulloa, M., Abdurakhmonov, I. Y., Perez-m, C., Percy, R., and Stewart, J. M. (2013). Genetic diversity and population structure of cotton (Gossypium spp.) of the new world assessed by SSR markers. Botany 91, 251–259. doi: 10.1139/cjb-2012-0192
Wang, M., Tu, L., Lin, M., Lin, Z., Wang, P., Yang, Q., et al. (2017). Asymmetric subgenome selection and cis-regulatory divergence during cotton domestication. Nat. Genet. 49, 579–587. doi: 10.1038/ng.3807
Wang, S., Shi, C., and Gao, L. Z. (2013). Plastid genome sequence of a wild woody oil species, Prinsepia utilis, provides insights into evolutionary and mutational patterns of Rosaceae chloroplast genomes. PLoS One 8:e73946. doi: 10.1371/journal.pone.0073946
Wang, M., Tu, L., Yuan, D., Zhu, D., Shen, C., Li, J., et al. (2019). Reference genome sequences of two cultivated allotetraploid cottons, Gossypium hirsutum and Gossypium barbadense. Nat. Genet. 51, 224–229. doi: 10.1038/s41588-018-0282-x
Wang, X., Zhang, Y., Wang, L., Pan, Z., and Du, X. (2020). Casparian strip membrane domain proteins in Gossypium arboreum: genome-wide identification and negative regulation of lateral root growth. BMC Genom. 21:340. doi: 10.1186/s12864-020-6723-9
Wegier, A., Pineyro-nelson, A., Alarcon, J., Galvez-mariscal, A., Alvarezbuylla, E. R., and Pinero, D. (2011). Recent long-distance transgene flow into wild populations conforms to historical patterns of gene flow in cotton (Gossypium hirsutum) at its centre of origin. Mol. Ecol. 20, 4182–4194. doi: 10.1111/j.1365-294X.2011.05258.x
Welt, R. S., Litt, A., and Franks, S. J. (2015). Analysis of population genetic structure and geneflow in an annual plant before and after a rapid evolutionary response to drought. AoB Plants 7:lv026. doi: 10.1093/aobpla/plv02
Wendel, J. F. (1989). New world tetraploid cottons contain old world cytoplasm. Proc. Natl. Acad. Sci. U.S.A 86, 4132–4136. doi: 10.1073/pnas.86.11.4132
Wendel, J. F., Brubaker, C., Alvarez, I., Cronn, R., and Stewart, J. M. (2009). “Evolution and natural history of the cotton genus,” in Genetics and Genomics of Cotton, ed. A. HPaterson (London: Springer Science). 3–22. doi: 10.1007/978-0-387-70810-2_1
Wendel, J. F., Brubaker, C. L., and Seelanan, T. (2010). “The origin and evolution of Gossypium,” in. Physiology of Cotton. (Dordrecht: Springer Netherlands). 1–18. doi: 10.1007/978-90-481-3195-2_1
Wendel, J. F., and Cronn, R. C. (2003). Polyploidy and the evolutionary history of cotton. Adv. Agron. 78, 139–186. doi: 10.1016/s0065-2113(02)78004-8
Wendel, J. F., and Grover, C. E. (2015). “Taxonomy and evolution of the cotton genus, Gossypium,” in Cotton, eds D. D. Fang and R. G. Percy (Madison, WI: American Society of Agronomy Inc.). 25–44. doi: 10.2134/agronmonogr57.2013.0020
Wendel, J. F., Brubaker, C. L., and Percival, A. E. (1992). Genetic diversity in Gossypium hirsutum and the origin of upland cotton. Am. J. Bot. 79, 1291–1310. doi: 10.1002/j.1537-2197.1992.tb13734.x
Wilson, G. A., and Rannala, B. (2003). Bayesian inference of recent migration rates using multilocus genotypes. Genetics 163, 1177–1191. doi: 10.1093/eurpub/13.1.11
Wilyard, A., Cronn, R., and Liston, A. (2009). Reticulate evolution and incomplete lineage sorting among the Ponderosa pines. Mol. Phylogenet. Evol. 52, 498–511. doi: 10.1016/j.ympev.2009.02.011
Wu, Y., Liu, F., Yang, D. G., Li, W., Zhou, X. J., Pei, X. Y., et al. (2018). Comparative chloroplast genomics of Gossypium species: insights into repeat sequence variations and phylogeny. Front. Plant Sci. 9:376. doi: 10.3389/fpls.2018.00376
Wyman, S. K., Jansen, R. K., and Boore, J. L. (2004). Automatic annotation of organellar genomes with DOGMA. Bioinformatics 20, 3252–3255. doi: 10.1093/bioinformatics/bth352
Xu, Q., Xiong, G. J., Li, P. B., He, F., Huang, Y., Wang, K. B., et al. (2012). Analysis of complete nucleotide sequences of 12 Gossypium chloroplast genomes: origin and evolution of allotetraploids. PLoS One 7:e37128. doi: 10.1371/journal.pone.0037128
Yang, Z. H., and Nielsen, R. (2002). Codon-substitution models for detecting molecular adaptation at individual sites along specific lineages. Mol. Biol. Evol. 19, 908–917. doi: 10.1093/oxfordjournals.molbev.a004148
Yang, Z., Qanmber, G., Wang, Z., Yang, Z., and Li, F. (2020). Gossypium genomics: trends, scope, and utilization for cotton improvement. Trends Plant Sci. 25, 488–500. doi: 10.1016/j.tplants.2019.12.011
Yang, Z. H., Wong, W. S., and Nielsen, R. (2005). Bayes empirical Bayes inference of amino acid sites under positive selection. Mol. Biol. Evol. 22, 1107–1118. doi: 10.1093/molbev/msi097
Yoo, M. J., Wendel, J. F., and Bomblies, K. (2014). Comparative evolutionary and developmental dynamics of the cotton (Gossypium hirsutum) fiber transcriptome. PLoS Genet. 10:e1004073. doi: 10.1371/journal.pgen.1004073
Zhang, T. Z., Hu, Y., Jiang, W. K., Fang, L., Guan, X. Y., and Chen, J. D. (2015). Sequencing of allotetraploid cotton (Gossypium hirsutum L. acc. TM-1) provides a resource for fiber improvement. Nat. Biotechnol. 33, 531–537. doi: 10.1038/nbt.3207
Keywords: cotton, domestication selection, gene flow, genetic relationship, nucleotide evolution
Citation: Zhou T, Wang N, Wang Y, Zhang X-L, Li B-G, Li W, Su J-J, Wang C-X, Zhang A, Ma X-F and Li Z-H (2022) Nucleotide Evolution, Domestication Selection, and Genetic Relationships of Chloroplast Genomes in the Economically Important Crop Genus Gossypium. Front. Plant Sci. 13:873788. doi: 10.3389/fpls.2022.873788
Received: 11 February 2022; Accepted: 24 March 2022;
Published: 15 April 2022.
Edited by:
Lin-Feng Li, Fudan University, ChinaReviewed by:
Jie Qiu, Shanghai Normal University, ChinaNian Wang, Huazhong Agricultural University, China
Xiongming Du, State Key Laboratory of Cotton Biology, Cotton Institute of the Chinese Academy of Agricultural Sciences, China
Copyright © 2022 Zhou, Wang, Wang, Zhang, Li, Li, Su, Wang, Zhang, Ma and Li. This is an open-access article distributed under the terms of the Creative Commons Attribution License (CC BY). The use, distribution or reproduction in other forums is permitted, provided the original author(s) and the copyright owner(s) are credited and that the original publication in this journal is cited, in accordance with accepted academic practice. No use, distribution or reproduction is permitted which does not comply with these terms.
*Correspondence: Zhong-Hu Li, bGl6aG9uZ2h1QG53dS5lZHUuY24=; Xiong-Feng Ma, bWF4Zl9jYWFzQDE2My5jb20=
†These authors have contributed equally to this work