 Pradeep Kumar Bhati1,2
 Philomin Juliana1,2*
 Ravi Prakash Singh3
 Arun Kumar Joshi1,2
 Manish Kumar Vishwakarma1,2
 Jesse Poland4
 Velu Govindan3
 Sandesh Shrestha4
 Leonardo Crespo-Herrera3
 Suchismita Mondal3
 Julio Huerta-Espino5
 Uttam Kumar1,2*
- 1International Maize and Wheat Improvement Center (CIMMYT), New Delhi, India
- 2Borlaug Institute for South Asia (BISA), New Delhi, India
- 3International Maize and Wheat Improvement Center (CIMMYT), Texcoco, Mexico
- 4Department of Plant Pathology, Wheat Genetics Resource Center, Kansas State University, Manhattan, KS, United States
- 5Campo Experimental Valle de México-INIFAP, Carretera los Reyes-Texcoco, Texcoco, Mexico
Spring bread wheat adaptation to diverse environments is supported by various traits such as phenology and plant architecture. A large-scale genome-wide association study (GWAS) was designed to investigate and dissect the genetic architecture of phenology affecting adaptation. It used 48 datasets from 4,680 spring wheat lines. For 8 years (2014–2021), these lines were evaluated for days to heading (DH) and maturity (DM) at three sites: Jabalpur, Ludhiana, and Samastipur (Pusa), which represent the three major Indian wheat-producing zones: the Central Zone (CZ), North-Western Plain Zone (NWPZ), and North-Eastern Plain Zone (NEPZ), respectively. Ludhiana had the highest mean DH of 103.8 days and DM of 148.6 days, whereas Jabalpur had the lowest mean DH of 77.7 days and DM of 121.6 days. We identified 119 markers significantly associated with DH and DM on chromosomes 5B (76), 2B (18), 7D (10), 4D (8), 5A (1), 6B (4), 7B (1), and 3D (1). Our results clearly indicated the importance of the photoperiod-associated gene (Ppd-B1) for adaptation to the NWPZ and the Vrn-B1 gene for adaptation to the NEPZ and CZ. A maximum variation of 21.1 and 14% was explained by markers 2B_56134146 and 5B_574145576 linked to the Ppd-B1 and Vrn-B1 genes, respectively, indicating their significant role in regulating DH and DM. The results provide important insights into the genomic regions associated with the two phenological traits that influence adaptation to the major wheat-producing zones in India.
Introduction
Wheat (Triticum aestivum L.) is one of the most important food crops in the world, consumed by about 40% of the world’s population (Gupta et al., 2008). It provides about 20% of the daily protein and calories requirements for 4.5 billion people worldwide (Wright et al., 2021). Over 776.5 million tons of wheat was produced globally in 2021 (FAO, 2022). In India, wheat production touched a milestone output of 109.5 million tons in 2021 with a record nationwide average productivity of 3.42 t/ha.1 However, population growth, dietary changes, social and policy issues, the recent impact of COVID-19, and global unrest have increased the demand for staple foods such as wheat. Wheat yield is increasing by 0.9% per year, which is significantly lower than the required rate of ∼2.4% per year by 2050 (Ray et al., 2013). In addition, the present trends in wheat production are insufficient to feed the population of 9 billion people predicted for 2050 (Curtis and Halford, 2014; Aslam et al., 2022).
Without effective selection of adapted plants and genetic improvement, a global decrease of 6% in wheat production is estimated for 1°C increase in temperature (Zhao et al., 2017). The performance of a wheat variety is measured by its adaptability and yield potential under target environments, which is dependent on the genetic and environmental factors as well as the interaction between these factors. Wheat cultivation across the globe under different environmental and climatic conditions requires cultivar adaptability to a wide range of growing conditions. This adaptation is achieved by variations in phenology and related traits that affect plant architecture (Hyles et al., 2020). Wheat heading, flowering time, plant stature, and maturity time are important phenological and agronomic traits for adaptation, yield potential, and yield stability. The major genes affecting wheat adaptation include those associated with phenology and plant architecture, such as vernalization (Vrn), photoperiod (Ppd), earliness per se (Eps), and reduced height (Rht), in addition to other minor-effect loci.
Heading time is a vital component of wheat phenology under a complex genetic control. Timely heading is critical for the production to avoid late-season stresses, mainly terminal heat (Joshi et al., 2007). However, this stress can manifest itself at an early stage (Kumar et al., 2021). Three gene groups, including Vrn, Ppd, and Eps, have a major influence on heading and flowering time of wheat (Snape et al., 2001; Distelfeld et al., 2009; Kumar et al., 2012; Khumalo et al., 2017). Early studies reported that the switch from vegetative to reproductive development is promoted by the prolonged cold temperatures of winter (vernalization) (Chouard, 1960). Unlike winter types, spring wheats require little-to-no environmental inducement for flowering. Vernalization requirement is typically combined with day-length-responsive flowering, such that plants that have vernalized over winter will flower rapidly as days subsequently lengthen in spring (Chouard, 1960). Vernalization occurs most rapidly at 4.9°C and requires temperatures between −1.3 and 15.7°C (Porter and Gawith, 1999).
The vernalization requirement of wheat is controlled by the Vrn1 genes located on the long arm of chromosomes 5A, 5B, and 5D (Snape et al., 2001). The Vrn1 gene is the wheat ortholog of the meristem identity gene APETALA1 from Arabidopsis thaliana and plays an important role in floral development by triggering early flowering when expressed at high levels (Yan et al., 2003). It is expressed in both leaves and shoots, and the accumulation of Vrn1 transcripts in the shoot apex is associated with the switch to reproductive development. The vernalization-insensitive alleles of Vrn1 (Vrn-A1, Vrn-B1, and Vrn-D1) shorten both the vegetative and the reproductive/maturity stages (Snape et al., 2001). The Vrn2 gene is a repressor of flowering that plays a key role in blocking the long-day flowering response before winter (Yan et al., 2004). The third gene (Vrn3), which can reduce the vernalization requirement of wheat, was identified to be completely linked to a gene similar to the Arabidopsis FLOWERING LOCUS T (Yan et al., 2006). The Vrn4 found in ancient wheat subspecies accessions from South Asia is located on chromosome 5DS and plays a role in local adaptation (Kippes et al., 2015).
Spring wheat can also have varying levels of sensitivity to day length. Day-length-insensitive spring cultivars can progress to the terminal spikelet stage and flower rapidly, even on short days. Photoperiod sensitivity to day length is largely determined by alleles of the photoperiod-1 (Ppd-1) genes located on chromosomes 2A, 2B, and 2D (Keim et al., 1973). Plants having an increased copy number of Ppd-B1 and Vrn-A1 alleles (Vrn-A1, Vrn-B1, and Vrn-D1) flowered early and showed increased vernalization requirement, respectively, suggesting that copy number variation is important for the adaptation of wheat (Díaz et al., 2012). Alleles of Ppd-D1 (PPD-D1a, PPD-B1a, and PPD-A1a) that confer a strong insensitivity to day length are associated with rapid flowering under all day-length conditions (Wilhelm et al., 2009; Díaz et al., 2012; Bentley et al., 2013). Alleles of Ppd-1 that are associated with reduced day-length sensitivity are also associated with an increased rate of spikelet development and decreased spike fertility (Prieto et al., 2018). A recent study attributed a shorter duration of pre-anthesis stem elongation and a decreased number of fertile florets to Ppd-D1a, highlighting the scope for increased yield potential by selection for photoperiod-sensitive alleles (Pérez-Gianmarco et al., 2019). Genes that influence the duration of the wheat life cycle under conditions where vernalization and photoperiod requirements have been met are described as “Earliness per se” (Eps) genes (Snape et al., 2001). Ochagavía et al. (2019) reported that allelic differences at the Eps-D1 gene on chromosome 1D conferred differing levels of sensitivity to temperature; earliness was associated with an increased sensitivity to temperature during the late reproductive phase of development in hexaploid wheat.
Understanding the genetic basis of phenology and other adaptive traits in spring bread wheat is important for developing varieties adapted to various environmental conditions and stresses. In this regard, a genome-wide association study (GWAS) is a high resolution and an approach to dissect the genetic basis of complex traits. It is preferred over linkage mapping because it accounts for greater allelic diversity at a given locus and exploits the ancestral recombination events that have occurred in an existing diversity panel (landraces, elite cultivars, and advanced breeding lines) at the population level (Yu and Buckler, 2006; Zhu et al., 2008; Ingvarsson and Street, 2011; Waugh et al., 2014; Scherer and Christensen, 2016). Another advantage of GWAS is that they use available germplasm and bypass the time-consuming process of developing segregating populations. Moreover, QTL mapping by bi-parental populations focuses on specific traits, whereas a wider range of germplasm can be used in GWAS to phenotype many traits with one cycle of genotyping (Li et al., 2019). GWASs are more efficient and require less effort in analyzing complex traits under various environmental conditions (George and Cavanagh, 2015). They have been used successfully to dissect several complex traits in wheat (Breseghello and Sorrells, 2006; Crossa et al., 2007; Yu et al., 2011; Maccaferri et al., 2015; Sukumaran et al., 2015; Juliana et al., 2019, 2021). While few GWASs in wheat have identified genomic regions associated with phenological traits including heading and maturity (Zhang et al., 2018; Gahlaut et al., 2021; Muhammad et al., 2021), a comprehensive study to dissect the genetic architecture of these traits in multiple wheat production zones has not been reported. A total of 43 SNPs (single-nucleotide polymorphisms) were consistently detected, including seven across multiple environments by ML-GWAS (Muhammad et al., 2021). Nine significant marker–trait associates were identified for days to anthesis under drought stress by Gahlaut et al. (2021). Hence, the main objective of this study was to use GWAS to identify consistently significant marker–trait associations for heading and maturity, affecting the adaptation of spring bread wheat to three major zones of India where wheat is cultivated in about 25 mha under diverse environmental and management conditions.
Materials and Methods
Populations and Field Experimental Design
A total of 4,680 advanced breeding lines from eight South Asia Bread Wheat Genomic Prediction Yield Trial (SABWGPYT) panels were evaluated in eight consecutive crop cycles between 2014 and 2021. In each crop cycle, about 540–600 different genotypes including six high-yielding checks were planted in two replications at the research stations of the Borlaug Institute for South Asia (BISA) in the three main wheat-growing regions of India: (1) Ludhiana, Punjab [30° 59′ N, 75° 44′ E, representing the North-Western Plain Zone (NWPZ)], (2) Jabalpur, Madhya Pradesh [23° 22′ N, 80° 07′ E, representing the Central Zone (CZ)], and (3) Pusa, Samastipur, Bihar [25° 95′ N, 85° 66′ E, representing the North-Eastern Plain Zone (NEPZ)]. The panels were named by the site where they were evaluated followed by the harvest year (e.g., Jabalpur panel, 2014; Ludhiana panel, 2014; Pusa panel, 2014).
The lines were planted in an alpha lattice design (Patterson et al., 1978) during the optimum planting time (the second to third week of November at each location), and they received an optimum irrigation of about 500 mm of water in total from five or more irrigations. The whole experiment was divided into 10 trials with 60 entries per trial, except panel 2014 and panel 2021 (nine trials with 60 entries each). Each replicate was divided into six sub-blocks of 10 plots. The plot size was 5.016 m2, and the lines were sown in six rows, 22 cm apart and 3.8 m in length. Field trials were managed by standard agronomic practices recommended for the location.2 Fertilizer was applied as 150 N/60 P/40 K kg ha–1 at Ludhiana and 120 N/60 P/40 K kg ha–1 at Jabalpur and Pusa as per wheat-growing zone recommendation.
Phenotyping and Statistical Analysis of the Phenotyping Data
The lines at all the sites were evaluated for Days to heading (DH) and days to maturity (DM) using alpha lattice design of field experiment. DH are counted visually as the number of days from planting until 50% of the spikes are visible through the flag leaf sheath. Similarly, DM was recorded as the number of days from planting to the day when 50% of the main tiller peduncles became entirely visible. In each of the 24 environments (three sites and eight panels), the best linear unbiased estimates (BLUEs) for DH and DM were obtained across replications using the META-R v6.03 software (Alvarado et al., 2020). The DH and DM were used as random effects while performing the analysis. Visualization of the trait distributions was performed using the “R” package “ggplot2” (Wickham, 2009).
For the two traits, we also obtained the following statistical measures using the META-R v6.03 software: (i) broad-sense heritabilities across replications to understand the selection response, (ii) coefficients of variation for each dataset to understand whether the field trial was well conducted, (iii) the least significant differences between genotypes for comparison and selection of the best genotypes, (iv) variance components including the genotypic variance and residual variance within each dataset to understand what proportion of the variance can be attributed to the genotypes, (v) genotypic and phenotypic correlations across sites, (vi) biplot based on the genetic correlations showing the relationship between the sites, and (vii) the variance components to understand whether there was a significant difference between the genotypes and sites. Heritability (h2) was estimated following Nyquist (1991) as h2 = 1 − [MS (Genotype × Year)]/MS (Genotype).
Genotyping
Genotyping data for all the eight SABWGPYT panels used in this study were obtained using the genotyping-by-sequencing (GBS) method (Poland et al., 2012). We estimated the SNPs using the Trait Analysis by Association Evolution and Linkage (TASSEL) version 5 GBS pipeline (Glaubitz et al., 2014). This was followed by SNP discovery at a minor allele frequency of 0.01, and the resulting GBS tags were aligned to the reference sequence of bread wheat version 1.0 (RefSeq v1.0) using Bowtie (Langmead and Salzberg, 2012). The tags were then filtered using p-values from Fisher’s exact test, inbred coefficient, and chi-square as described in Juliana et al. (2021), and over 80,000 SNPs that passed at least one of these filters were obtained. We removed the markers that had greater than 50% missing data, less than 5% minor allele frequency, and greater than 10% heterozygosity. In addition, we also removed the lines with greater than 90% missing data in each panel. We obtained the following number of filtered markers and lines for GWAS: (i) panel 2014: 481 lines and 18,351 markers, (ii) panel 2015: 582 lines and 17,764 markers, (iii) panel 2016: 583 lines and 17,094 markers, (iv) panel 2017: 529 lines and 17,620 markers, (v) panel 2018: 540 lines and 16,152 markers, (vi) panel 2019: 528 lines and 16,771 markers, (vii) panel 2020: 540 lines and 16,709 markers, and (viii) panel 2021: 491 lines and 17,851 markers. Marker imputation was performed using Beagle version 4.1 (Browning and Browning, 2016).
Genome Wide Association Mapping
We performed GWAS for DH and DM in all the 24 datasets for each trait using the mixed linear model (Yu et al., 2006) in TASSEL version 5 (Bradbury et al., 2007). The model was fitted using population structure as a fixed effect and kinship as a random effect, which were accounted for using the first two principal components (Patterson et al., 2006; Price et al., 2006) and the genomic relationship matrix obtained using the centered identity-by-state method (Endelman and Jannink, 2012), respectively. In addition, we used the optimum level of compression and the “population parameters previously determined” (Zhang et al., 2010) options for fitting the mixed linear model. We obtained the p-values for the tests of significance of the marker and trait associations, the additive effects of the markers, and the percentage of variation explained by them. The GWAS results were visualized using Manhattan plots using the “R” package “CMplot” (Lilin, 2018). Correction for multiple testing was performed using the Bonferroni correction at an α level of 0.20, and the markers which had p-values lower than the cut-off level (ranging between 1.09E-05 and 1.24E-05 in the different panels) were considered to be significant. In addition, we also obtained markers that were (i) consistently significant in more than one site that could indicate the markers associated with broad adaptation to different sites and (ii) associated with DH and maturity, which could provide insights into the genomic regions that were associated with both these phenological traits. The markers that were significant in more than one dataset were then plotted on a reference map using ‘‘Phenogram.’’3
Results
Phenotyping Data
Large and continuous variation was observed for the phenological traits in all three environments from 2014 to 2021 for the 4,680 advanced breeding lines (Table 1 and Figure 1). The DH (58–98 days) and DM (103–137 days) were shortest at Jabalpur, but longest (87–120 for DH and 138–163 for DM) at Ludhiana. The mean DH ranged from 96 (panel 2017) to 112 (panel 2018) days at Ludhiana, 68 (panel 2021) to 84 (panel 2019) days at Jabalpur, and 76 (2021) to 87 (2016) days at Pusa. For DM, the rage was 143 (panel 2015) to 156 (panel 2020) days at Ludhiana, 116 (2021) to 126 (2020) days at Jabalpur, and 120 (2015) to 134 (2020) days at Pusa.
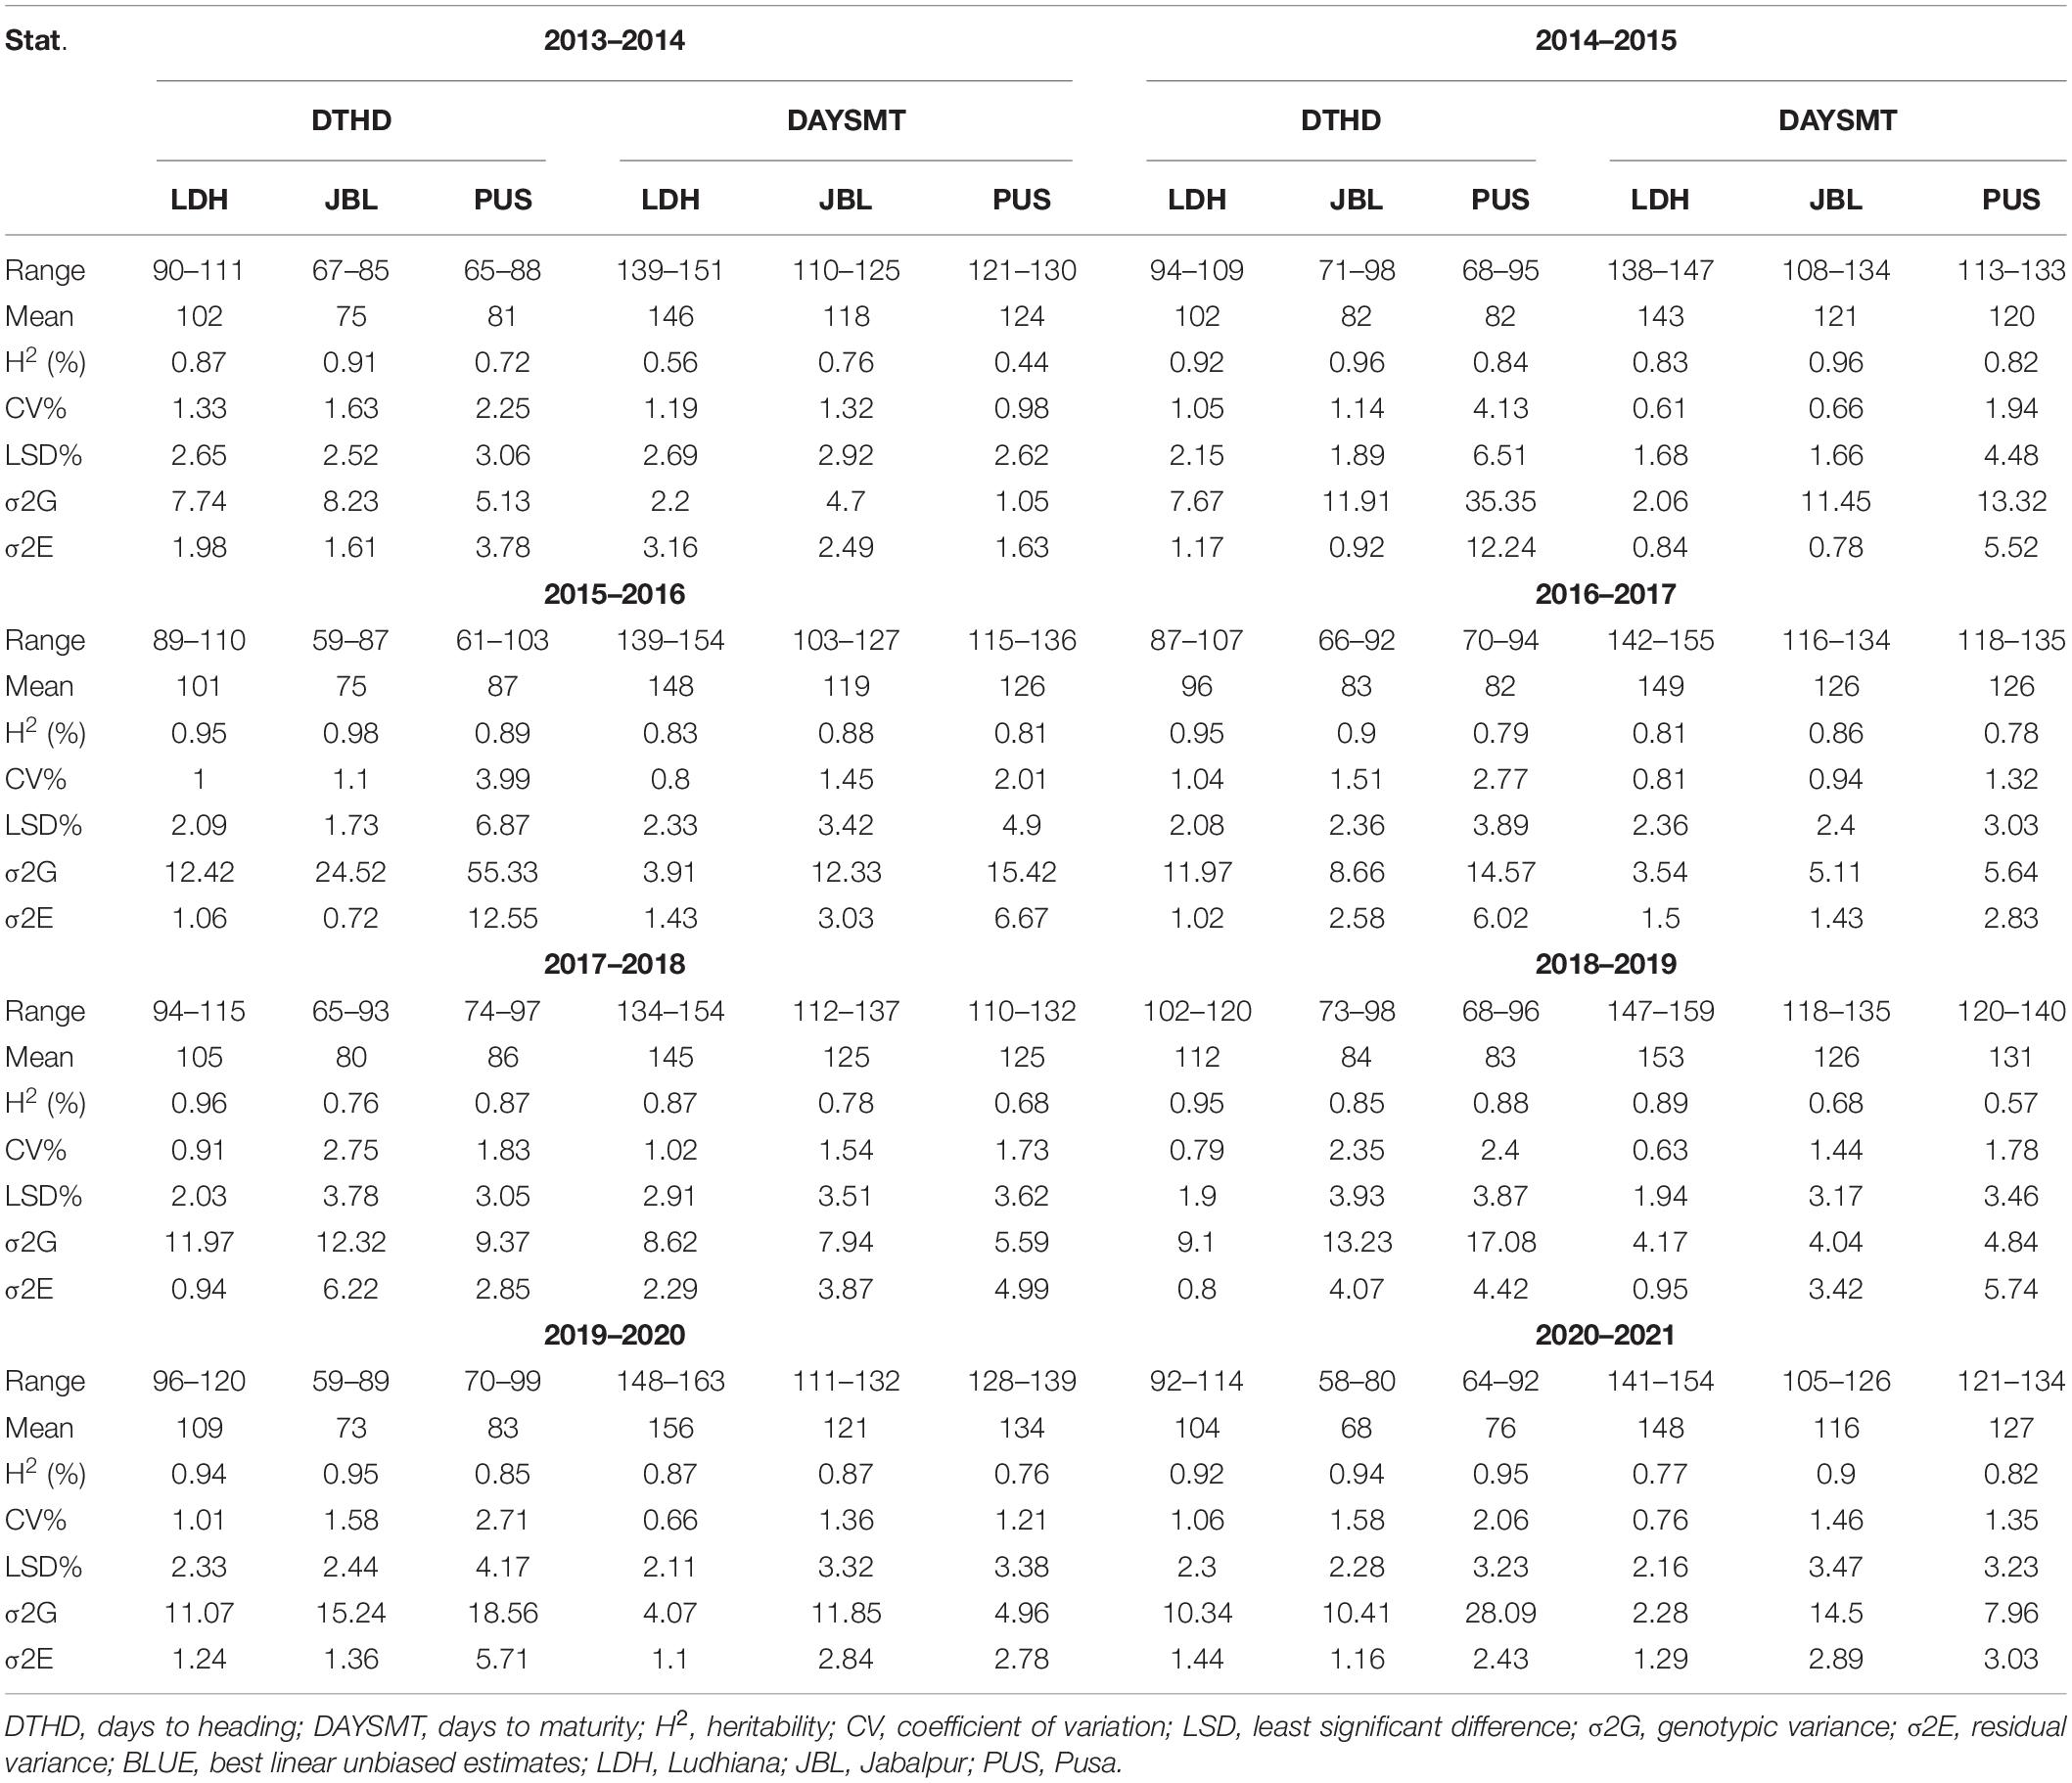
Table 1. Descriptive statistics and variance parameters estimated for days to heading (DH) and maturity (DM) agronomic traits based on best linear unbiased estimate (BLUE) values in association panel grown at three different environments in India from 2014 to 2021.
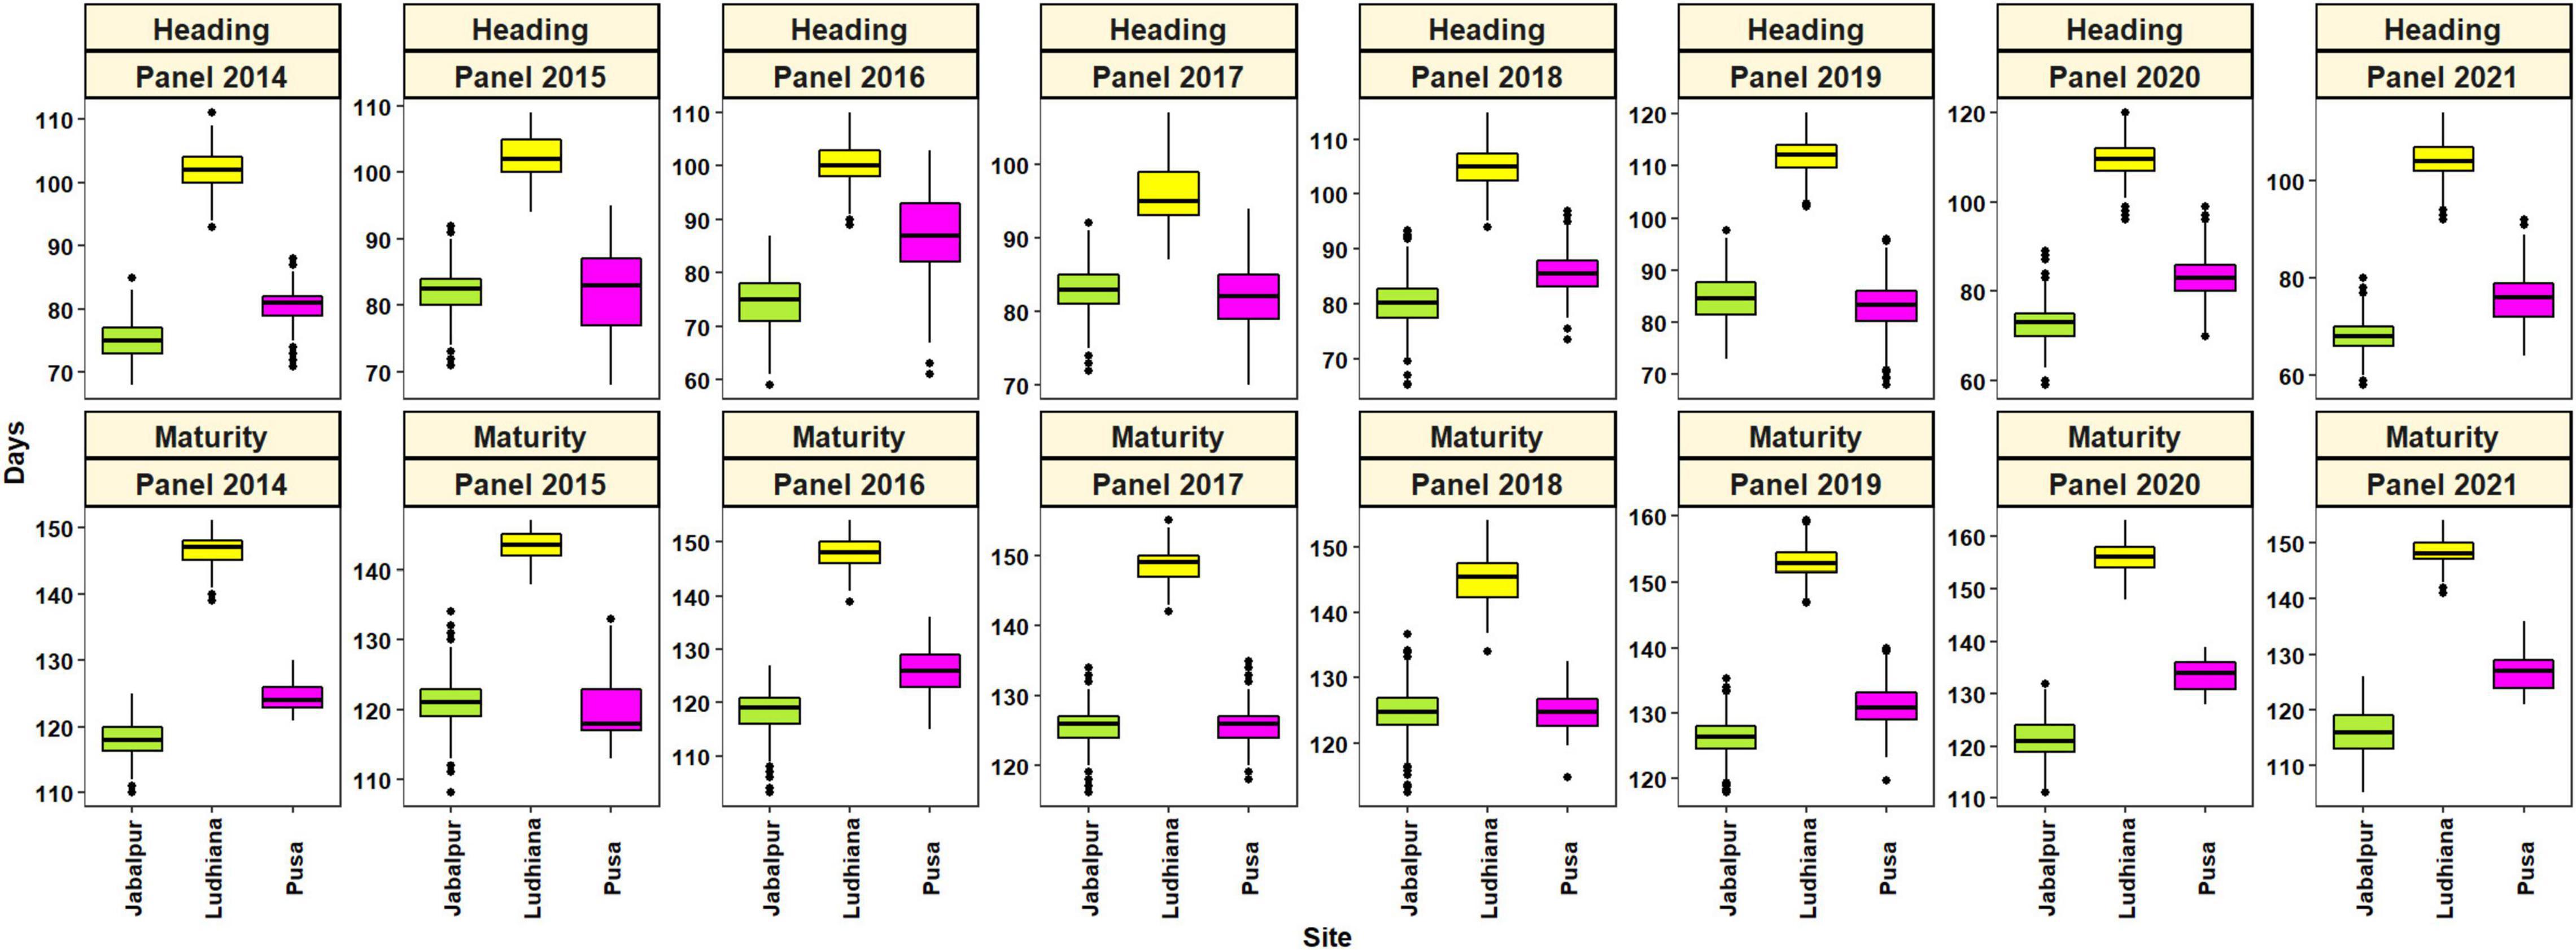
Figure 1. Boxplots showing the distributions of heading and maturity in Jabalpur, Ludhiana, and Pusa in panels 2014–2021.
We observed high heritability for DH over years, ranging from 0.87 to 0.98 at Ludhiana, 0.76 to 0.98 at Jabalpur, and 0.72 to 0.95 at Pusa (Table 1). Heritability for DM was moderate to high, ranging from 0.56 to 0.89 at Ludhiana, 0.68 to 0.96 at Jabalpur, and 0.44 to 0.82 at Pusa. The coefficient of variation ranged from 0.79 (Ludhiana panel 2019) to 4.13 (Pusa panel 2015) for DH and 0.61 (Ludhiana panel 2015) to 2.01 (Pusa panel 2016) for DM (Table 1).
Phenotypic and Genetic Correlations for Days to Heading and Maturity Across Locations
For DH, the phenotypic Pearson correlations across locations ranged from 0.46 (panel 2017 between Pusa and Ludhiana) to 0.84 (panel 2021 between Pusa and Jabalpur) (Table 2). Similarly, for DM, it ranged from 0.31 (panel 2014 between Pusa and Ludhiana) to 0.72 (panel 2019 between Pusa and Jabalpur). Positive phenotypic correlations ranged from 0.32 to 0.85 between DH and DM between locations. We also observed moderate-to-strong genetic correlations ranging from 0.56 (panel 2017 between Pusa and Jabalpur) to 0.92 (panel 2020 between Pusa and Jabalpur) for DH and from 0.45 (panel 2021 between Pusa and Ludhiana) to 0.83 (panel 2020 between Pusa and Jabalpur) for DM (Table 3). Dendrograms and biplots showing the genetic correlations between different traits in different locations and years were obtained (Supplementary File 1).
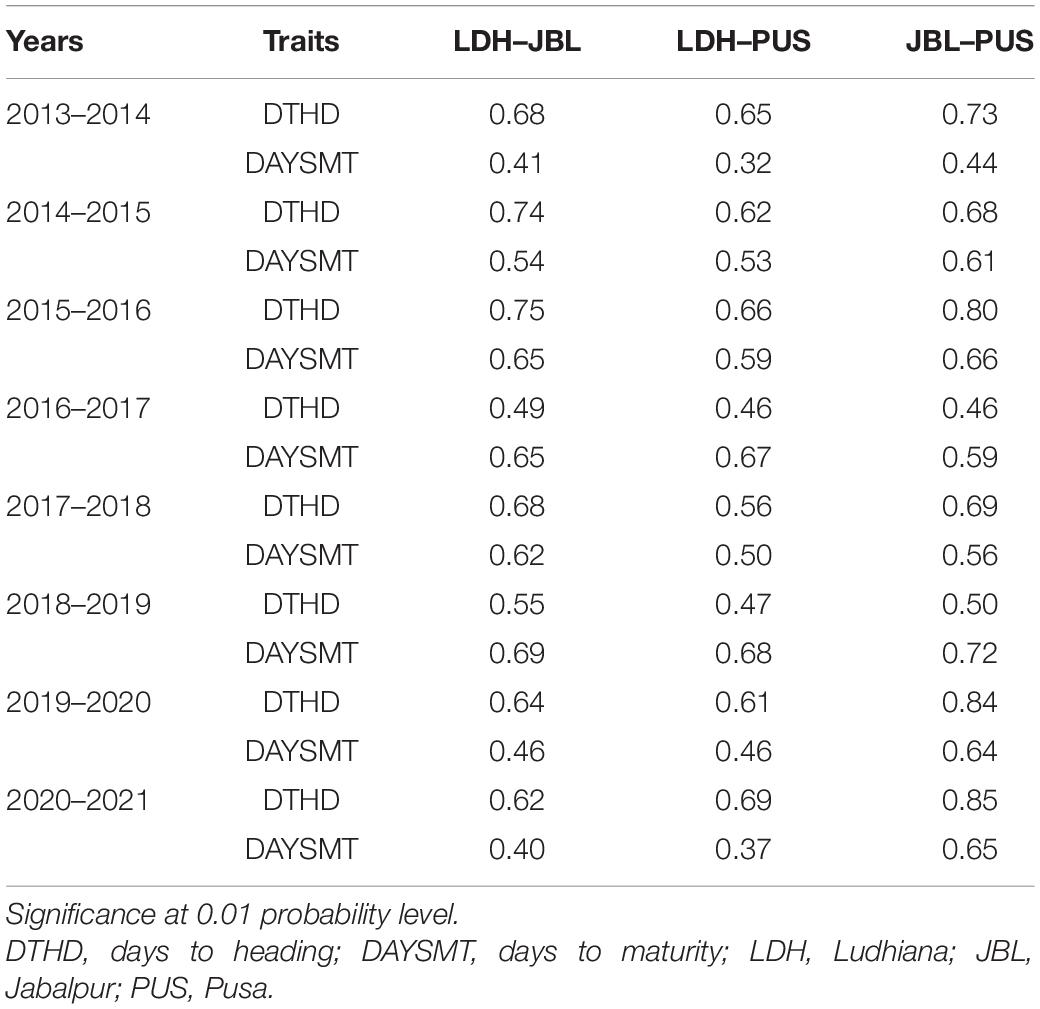
Table 2. Phenotypic correlations between locations for days to heading (DH) and days to maturity (DM) from 2014 to 2021.
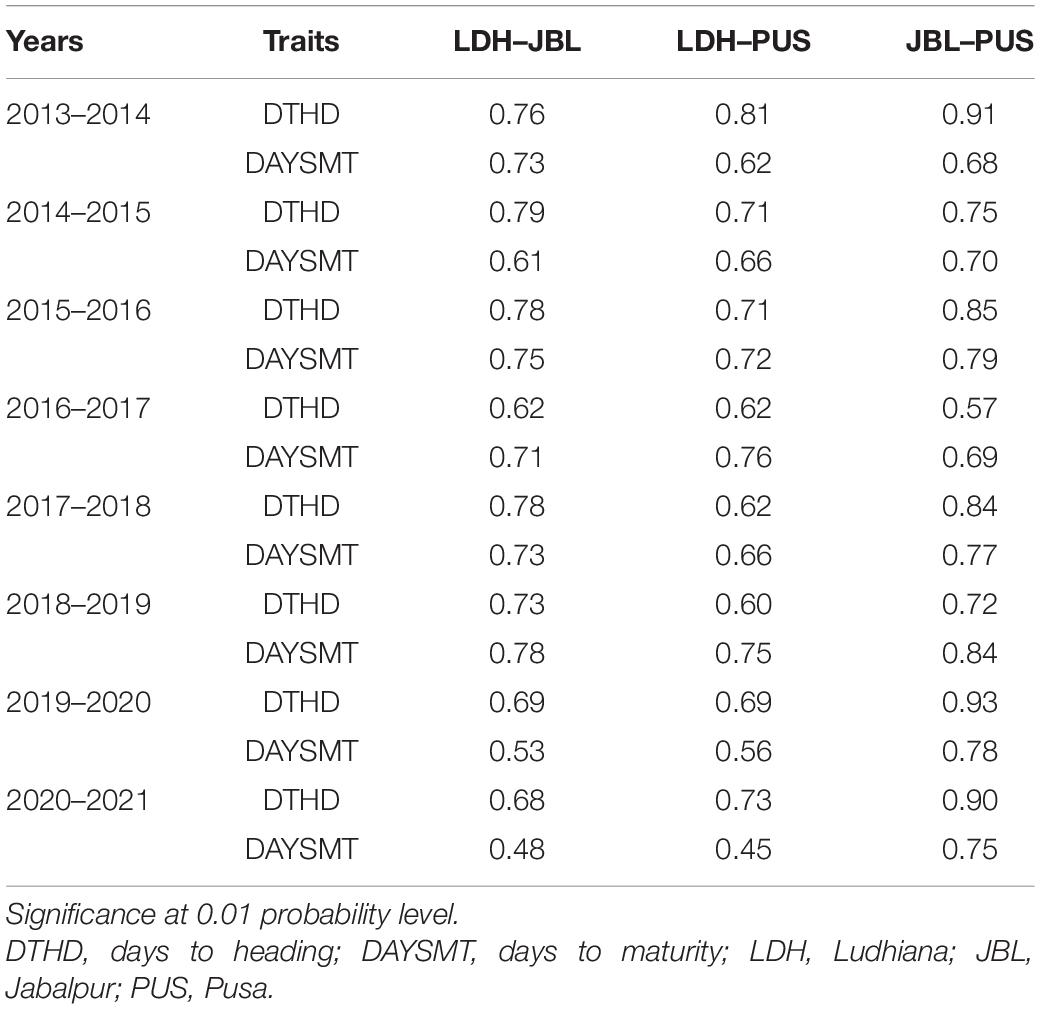
Table 3. Genetic correlations between locations for days to heading (DH) and days to maturity (DM) from 2014 to 2021.
The variance components of the traits showed that for both DH and DM, the genotypes and sites were significantly different in all the panels (Table 1).
Genotyping Data and Population Structure Analysis
Of 23,979 unique GBS markers used in all the panels for GWAS, 23,581 were mapped to the RefSeq v1.0 and their densities within a window size of 10 Mb were obtained (Figure 2). We observed a good coverage of markers on all chromosomes with a high density on the telomeric end of chromosomes such as 4AL, 6A, 6DS, 7AS, and 7BS. The highest number of markers was on chromosomes 7A (2,227 markers) and 2B (2,148 markers), but the lowest on chromosomes 5D (296 markers), 4D (401 markers), 6D (445 markers), 1D (453 markers), and 3D (454 markers). A plot of the first two principal components in the eight panels indicated a weak-to-moderate population structure (Figure 3). The% variation explained by principal component analysis in each panel from 2014 to 2021 is given in Table 4.
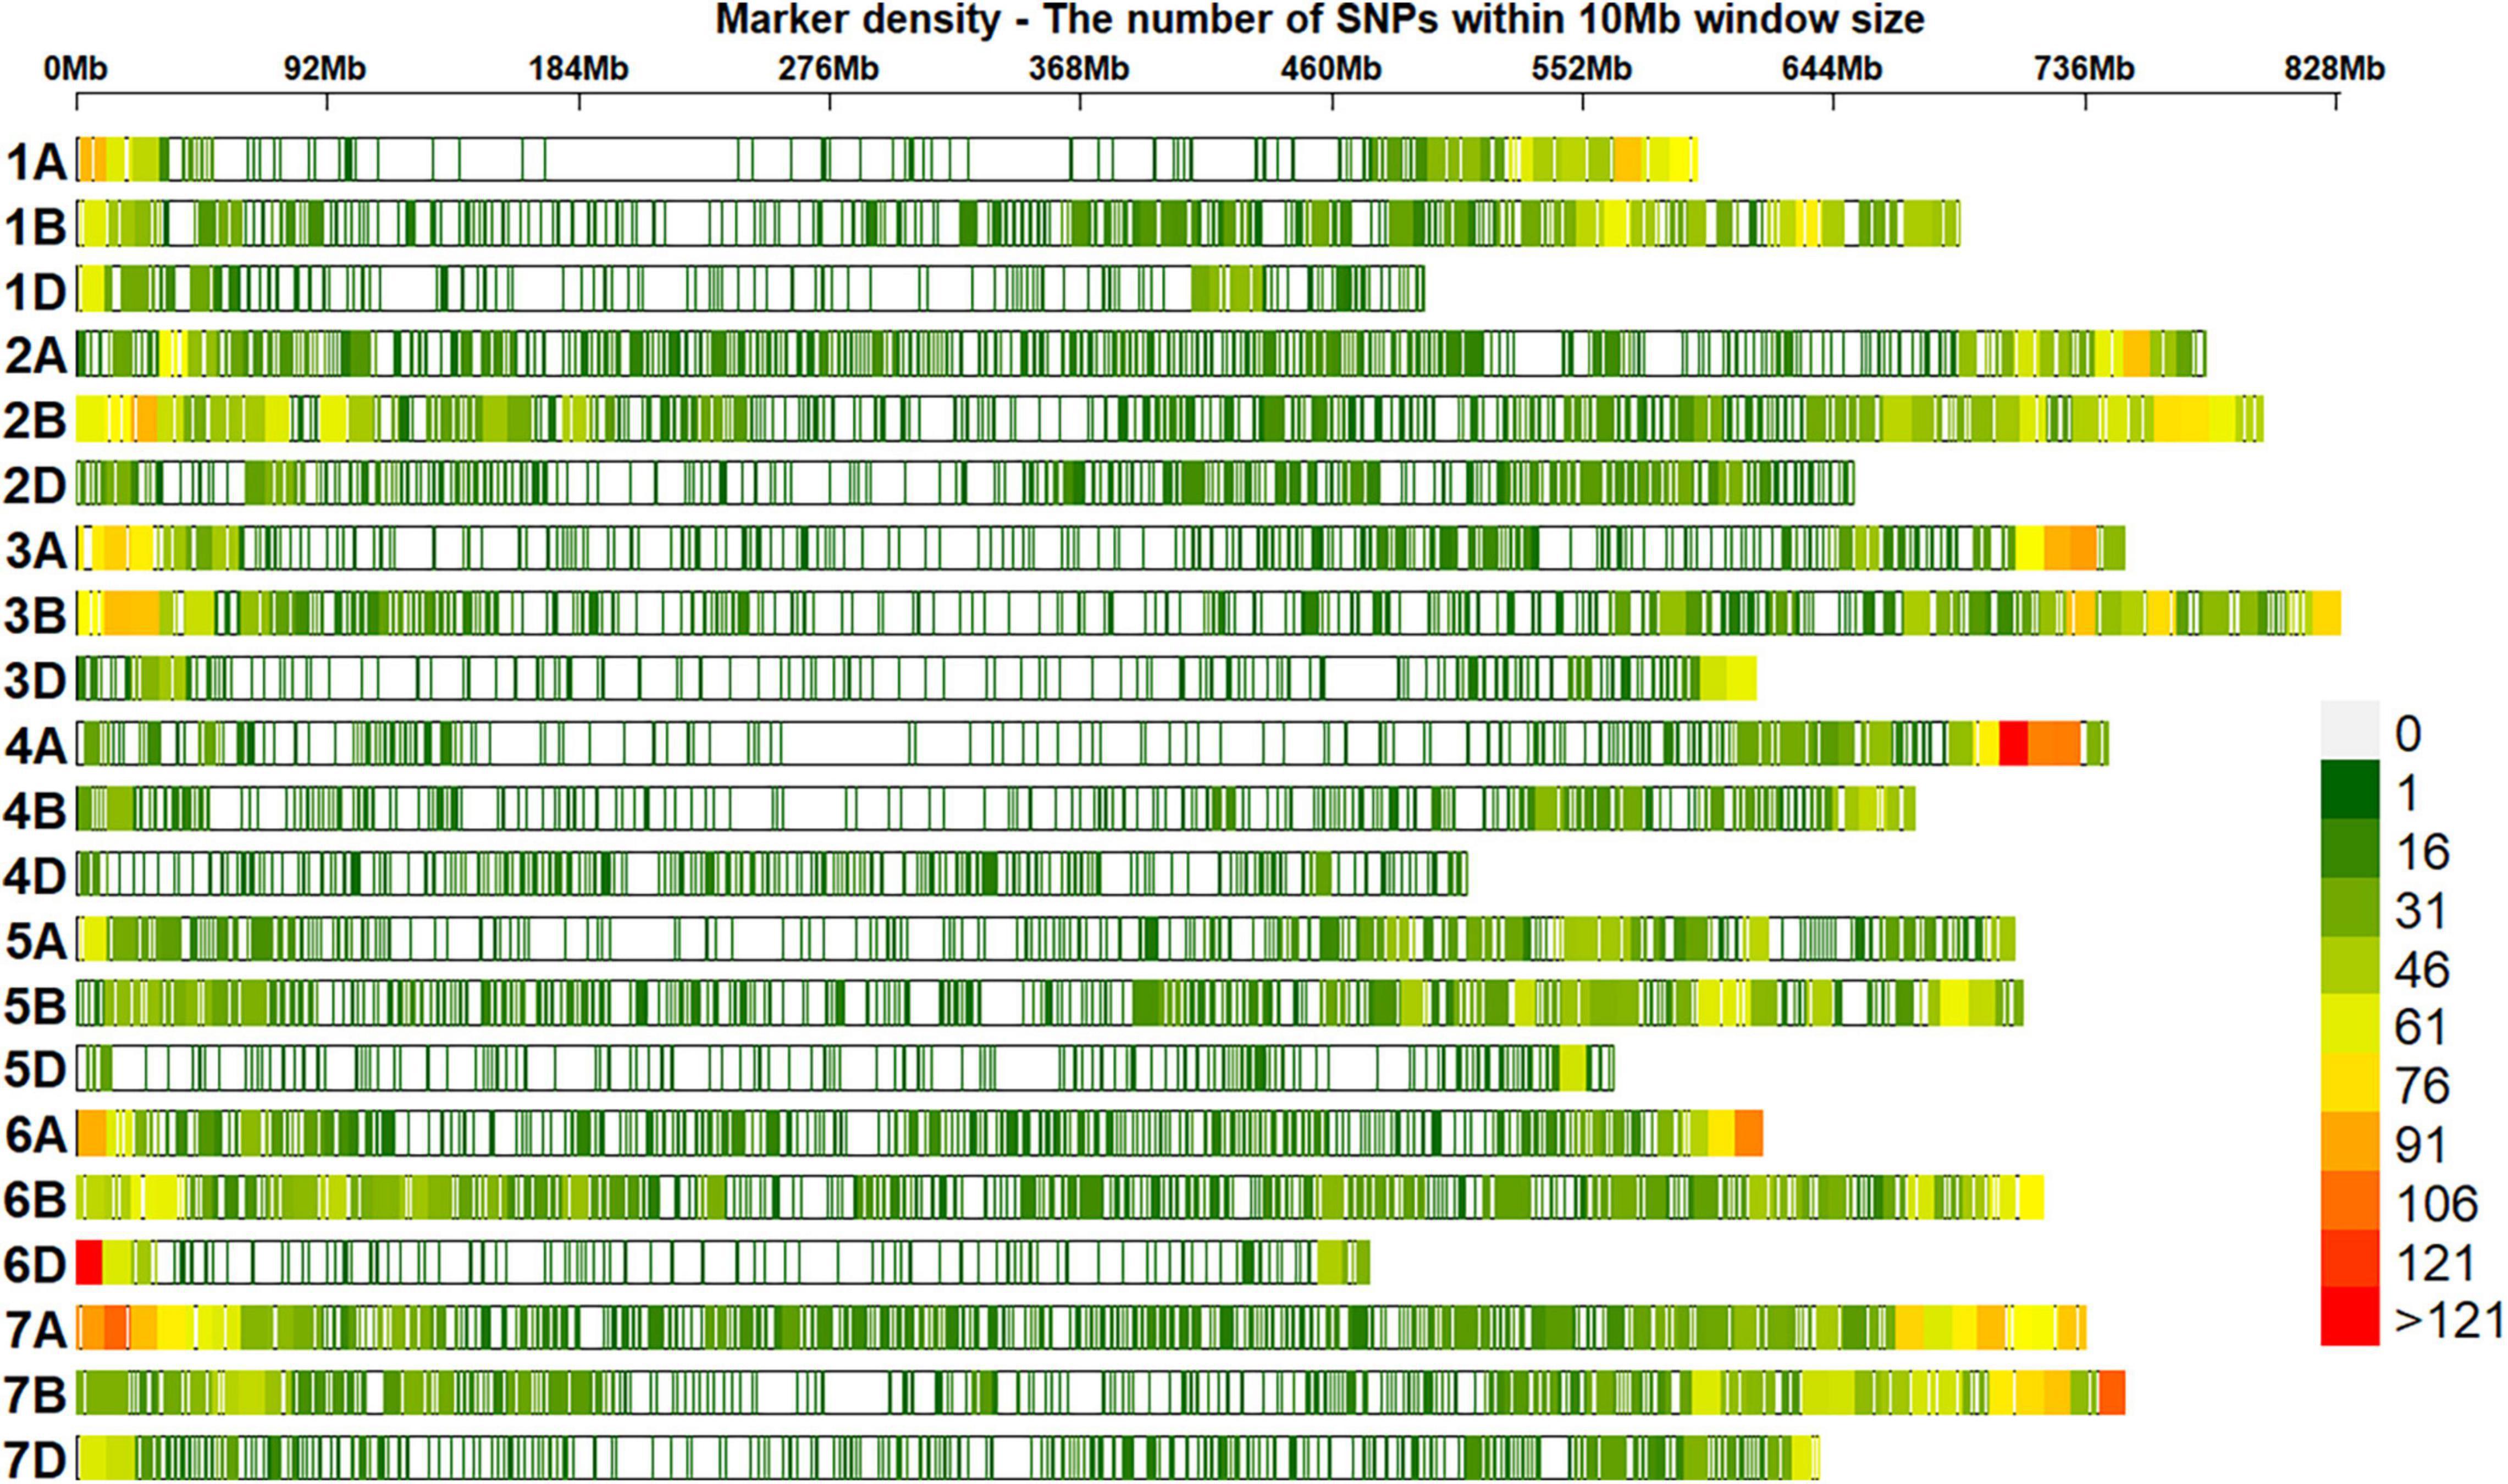
Figure 2. Densities of 23,581 genotyping-by-sequencing (GBS) single-nucleotide polymorphisms (SNPs) in the reference bread wheat genome (RefSeq v1.0). The color key with marker densities indicates the number of markers within a window size of 10 Mb.
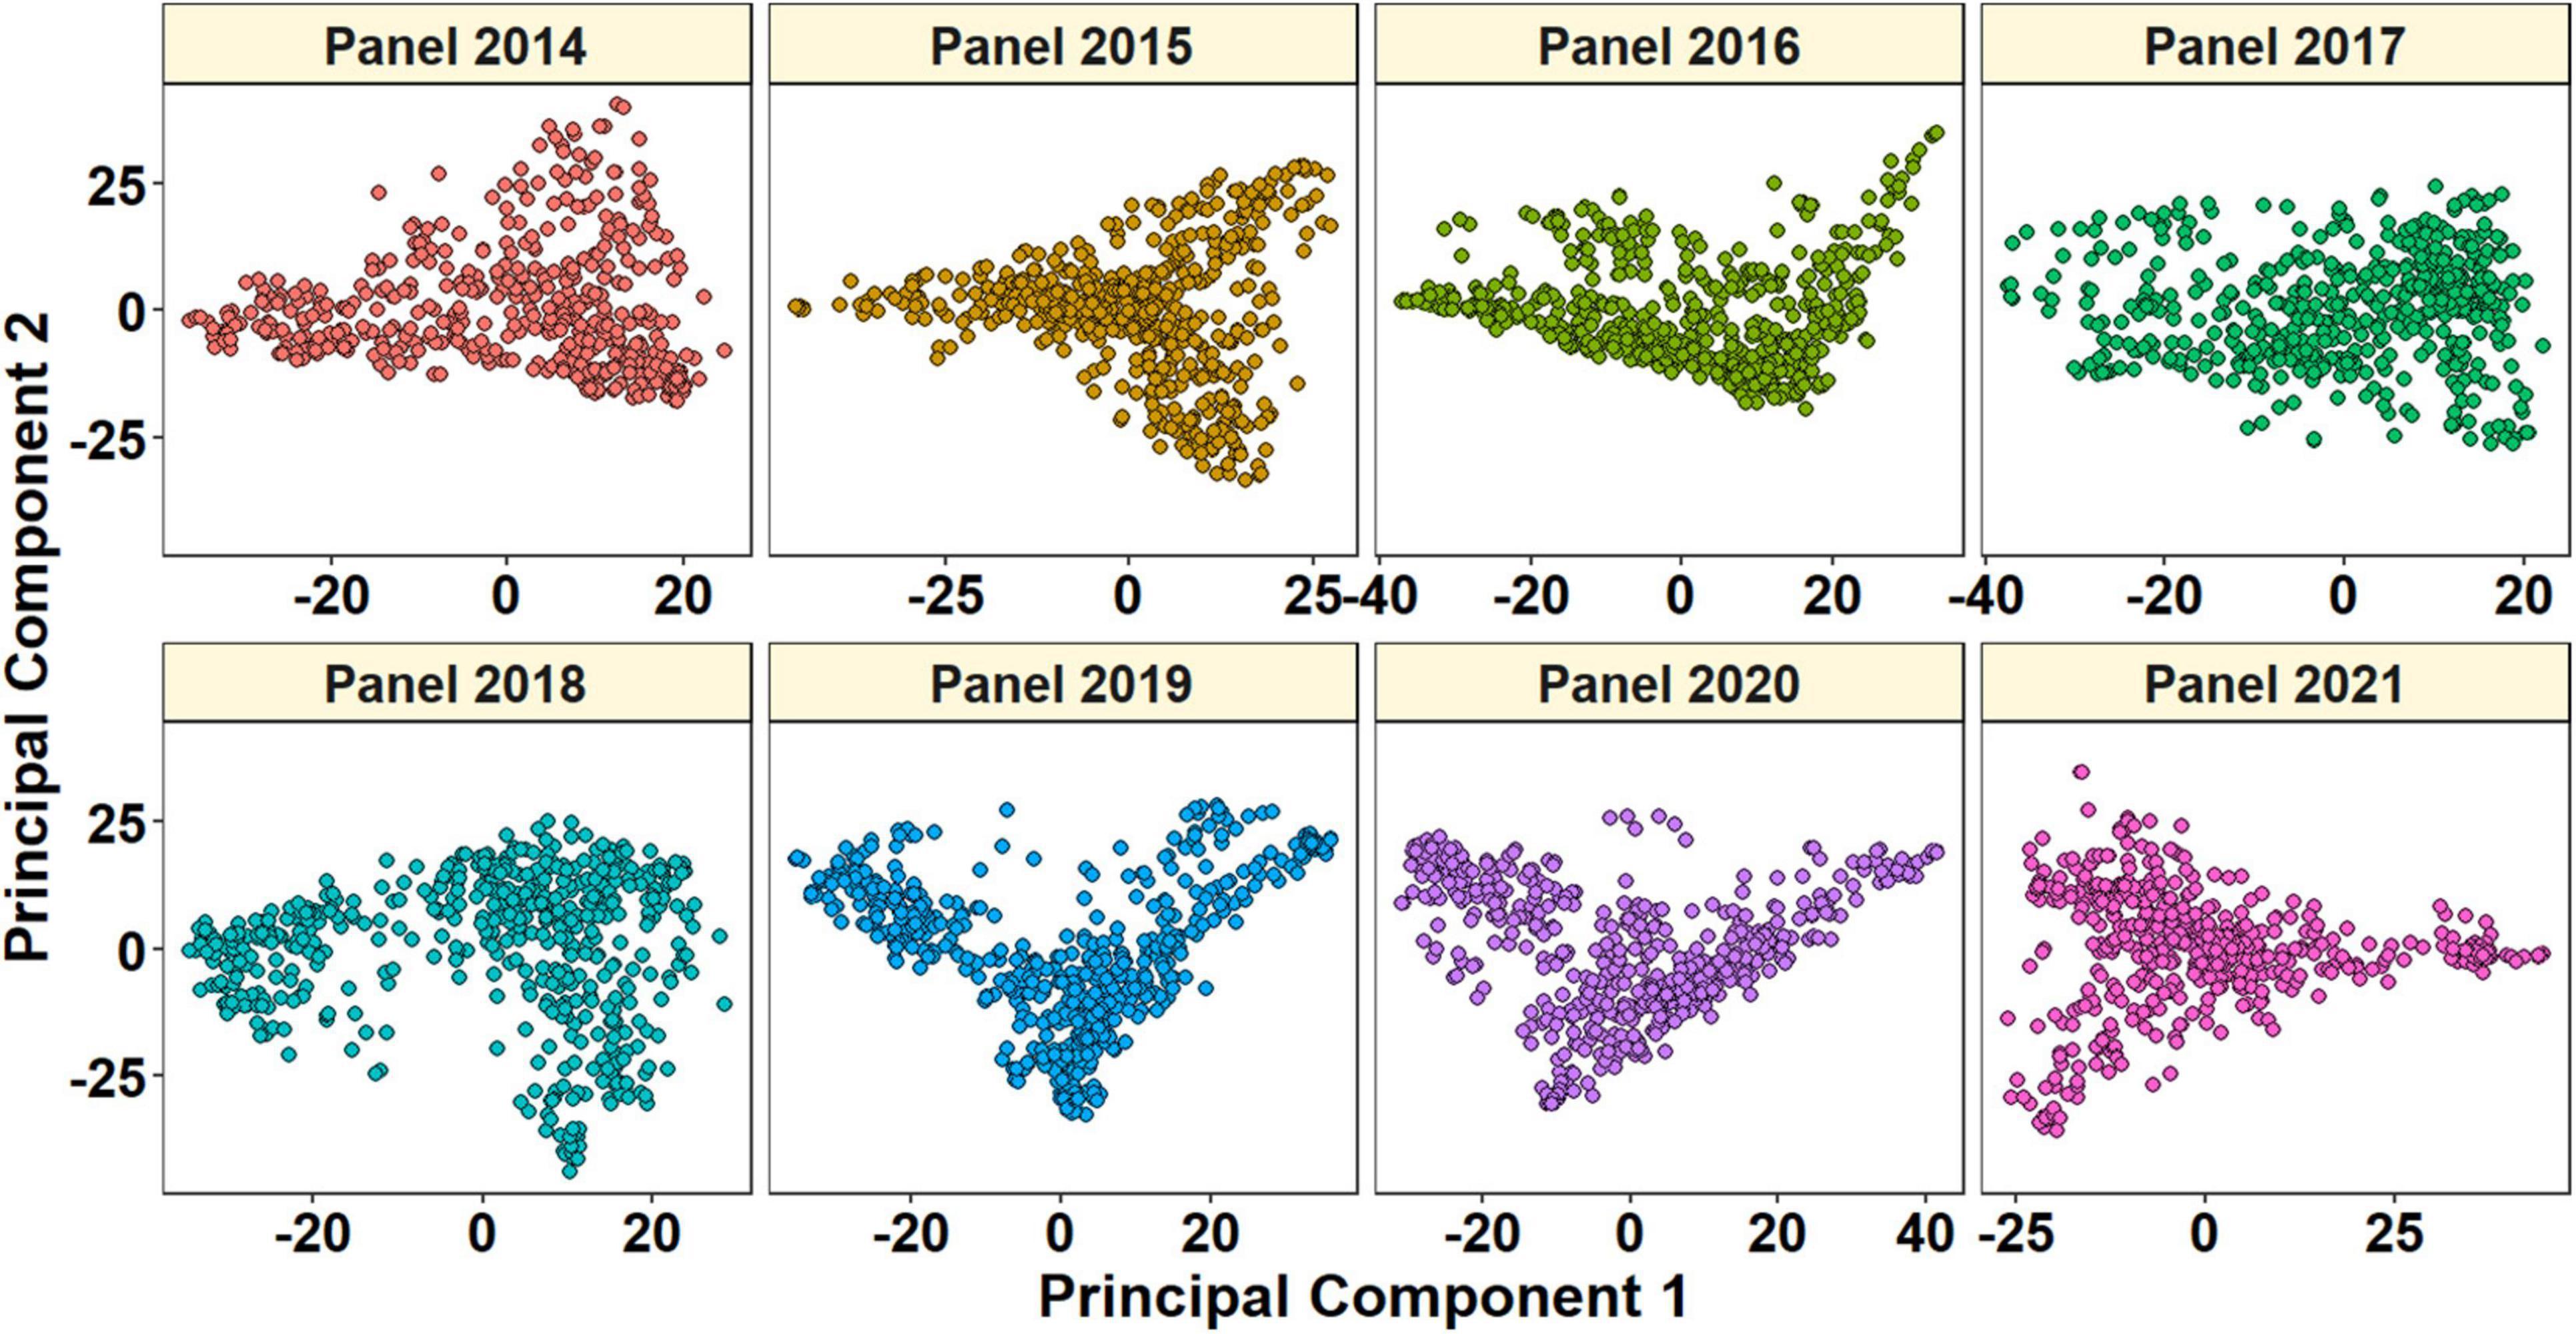
Figure 3. Plot of principal components 1 and 2 indicating the population structure in panels 2014–2021.
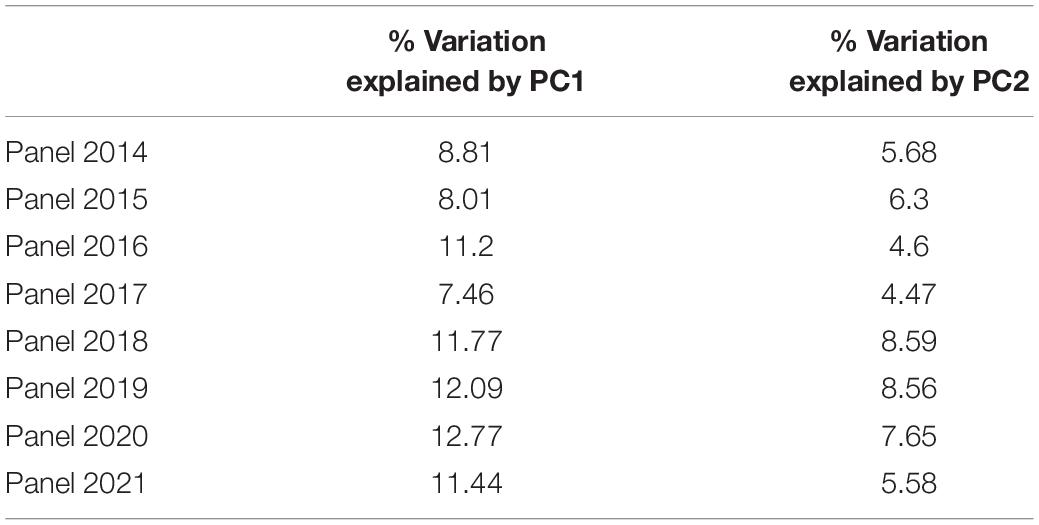
Table 4. Principal component analysis (PCA) of the SABWGPTY panels obtained based on single-nucleotide polymorphism (SNP) genotyping.
Genome Wide Association Mapping for Days to Heading and Days to Maturity
We performed GWAS for DH and DM using 48 datasets and obtained the p-values, additive effects, and the percentage variation explained by each of the markers in the different panels (Supplementary File 2). After Bonferroni’s correction for multiple testing, we obtained 222 markers that were associated with the traits in the different datasets (Supplementary File 3). Among them, 119 markers were significant in at least two datasets and were considered as consistent significant markers (Supplementary File 4). The highest numbers of these markers were on chromosome 5B (76). The markers significantly associated with DH and DM in the different sites and panels are described in the following.
Markers Significantly Associated With Days to Heading
In Jabalpur, among the 101 markers significantly associated with DH, 43 markers (43%) were consistently significant in more than one panel, and they were all on chromosome 5B, between 556185926 and 596948341 bps. The consistent markers had additive effects ranging between 1 and 1.95 days and explained 4.3–12.3% of the variation. Among them, marker 5B_574145576 was significant in the highest number of panels (panels 2016, 2018, 2019, 2020, and 2021), with additive effects ranging between 1.45 and 1.95 days and explained 7–12.3% of the phenotypic variation. In addition, 58 markers were significantly associated in only one panel in Jabalpur, including 38 markers on chromosome 5B between 447567055 and 689895400 bps, eight markers on chromosome 6B between 185171994 and 229054418 bps, five markers on chromosome 7D between 55486522 and 58633321 bps, and markers 2D_82143828, 3B_777688779, 3D_562906853, 5A_570528289, 5A_580935013, 7A_266640411, and 7B_669973991.
In Ludhiana, among the 77 markers significantly associated with DH, only seven markers (9.1%) were consistently associated in more than one panel which were all on chromosome 2B, between 53667024 and 59584538 bps. These consistent markers had additive effects ranging between 0.7 and 2.1 days and explained 4.6–21.1% of the phenotypic variation. Among them, marker 2B_56134146 was significant in the highest number of panels (panels 2015, 2017, 2018, 2019, and 2021), with additive effects ranging between 0.95 and 2.1 days and explained 4.9–21.1% of the phenotypic variation. We also observed that 70 markers were significantly associated with DH in Ludhiana in one dataset only, which included 27 markers on chromosome 2B, 14 markers on chromosome 7B, 11 markers on chromosome 4D, 10 markers on chromosome 7D, four markers on chromosome 5B, and markers 3A_21112167, 3D_56844252, 4A_684814200, and 7A_174693955.
In Pusa, among the 88 markers significantly associated with DH, 68 markers (77.3%) were consistently associated in more than one panel which were all on chromosome 5B between 549777627 and 596948341 bps. These consistent markers had additive effects ranging between 1 and 2.8 days and explained 4.3–14.1% of the phenotypic variation. We also observed that six markers (5B_574145576, 5B_575270556, 5B_576348143, 5B_586610468, 5B_586805570, and 5B_586862827) were significant in five panels and they had additive effects ranging between 1.2 and 2.7 days and explained 4.5–14.1% of the variation. In addition, 20 markers were significantly associated with DH in one panel only in Pusa, including 16 markers on chromosome 5B between 549730988 and 610372912 bps and markers 5A_481889948, 5A_580935013, 6A_559740187, and 7B_653976952.
Markers Significantly Associated With Days to Maturity
In Jabalpur, among the 67 markers significantly associated with DM, only five markers (7.5%) were consistently significant in more than one panel. This included markers 5B_574145576, 5B_575270556, 5B_592792409, 5B_594614262, and 5B_594913947 that had additive effects ranging between 1 and 1.8 days and explained 4.5–9.5% of the phenotypic variation. Marker 5B_574145576 was significant in the highest number of panels (panels 2018, 2020, and 2021) and had additive effects ranging between 1.4 and 1.75 days and explained 4.6–9.5% of the phenotypic variation. Furthermore, the 62 markers were associated with DM in Jabalpur in one panel only, which included 36 markers on chromosome 5B between 550910513 and 595649946 bps, nine markers on chromosome 7D, eight markers on chromosome 6B, two markers on chromosomes 7A and 7B each, and five markers on other chromosomes.
In Ludhiana, among the 49 markers significantly associated with DM in the different panels after correction for multiple testing, only one marker (2%) was consistently significant in more than one panel. This marker (2B_56134146) had additive effects ranging between 0.6 and 1.4 days and explained 4.4–11.4% of the phenotypic variation. The 48 markers were significantly associated with DM in one panel only in Ludhiana, which included 18 markers on chromosome 2B, 11 markers on chromosome 7A, eight markers on chromosome 4D, five markers on chromosome 7D, two markers each on chromosomes 3A and 3D, and markers 1D_189345725 and 5B_601867021. In Pusa, among the 11 markers significantly associated with DM in the different panels after correction for multiple testing, only one marker (9%) was consistently significant in more than one panel. This marker (5B_574145576) had additive effects ranging between 0.95 and 1.1 days and explained 4.7–6.4% of the phenotypic variation. In addition, we also observed that 10 markers were significantly associated with DM in Pusa in one panel only.
Markers Significantly Associated With Days to Heading in More Than One Site
We observed that three markers (5B_562646635, 5B_569889755, and 5B_574145576) were significantly associated with DH in all the three sites (Figures 4–6) and they explained 4.3–4.7, 4.4–9.7, and 5.2–14.07% of the phenotypic variation in different sites, respectively. In addition, marker 5A_580935013 and 72 markers on chromosome 5B between 549730988 and 597098833 bps were associated with DH in Jabalpur and Pusa. These markers had additive effects ranging between 1 and 2.8 days in Jabalpur and between 1 and 4.4 days in Pusa and explained 4.3–10.3 and 4.3–13% of the phenotypic variation in Jabalpur and Pusa, respectively. Three markers on chromosome 7D including 7D_55920290, 7D_57904794, and 7D_58369927 were significantly associated with DH in Jabalpur and Ludhiana. These markers had additive effects ranging between 0.94 and 0.99 days in Jabalpur and 0.87 and 0.96 days in Ludhiana, while they explained 4.8–6.6 and 4.9–6.2% of the phenotypic variation in Jabalpur and Ludhiana, respectively. Quantile–quantile plots demonstrating the ratios of expected to observe log10 (P) values for DH and DM at each location are presented in Supplementary File 5.
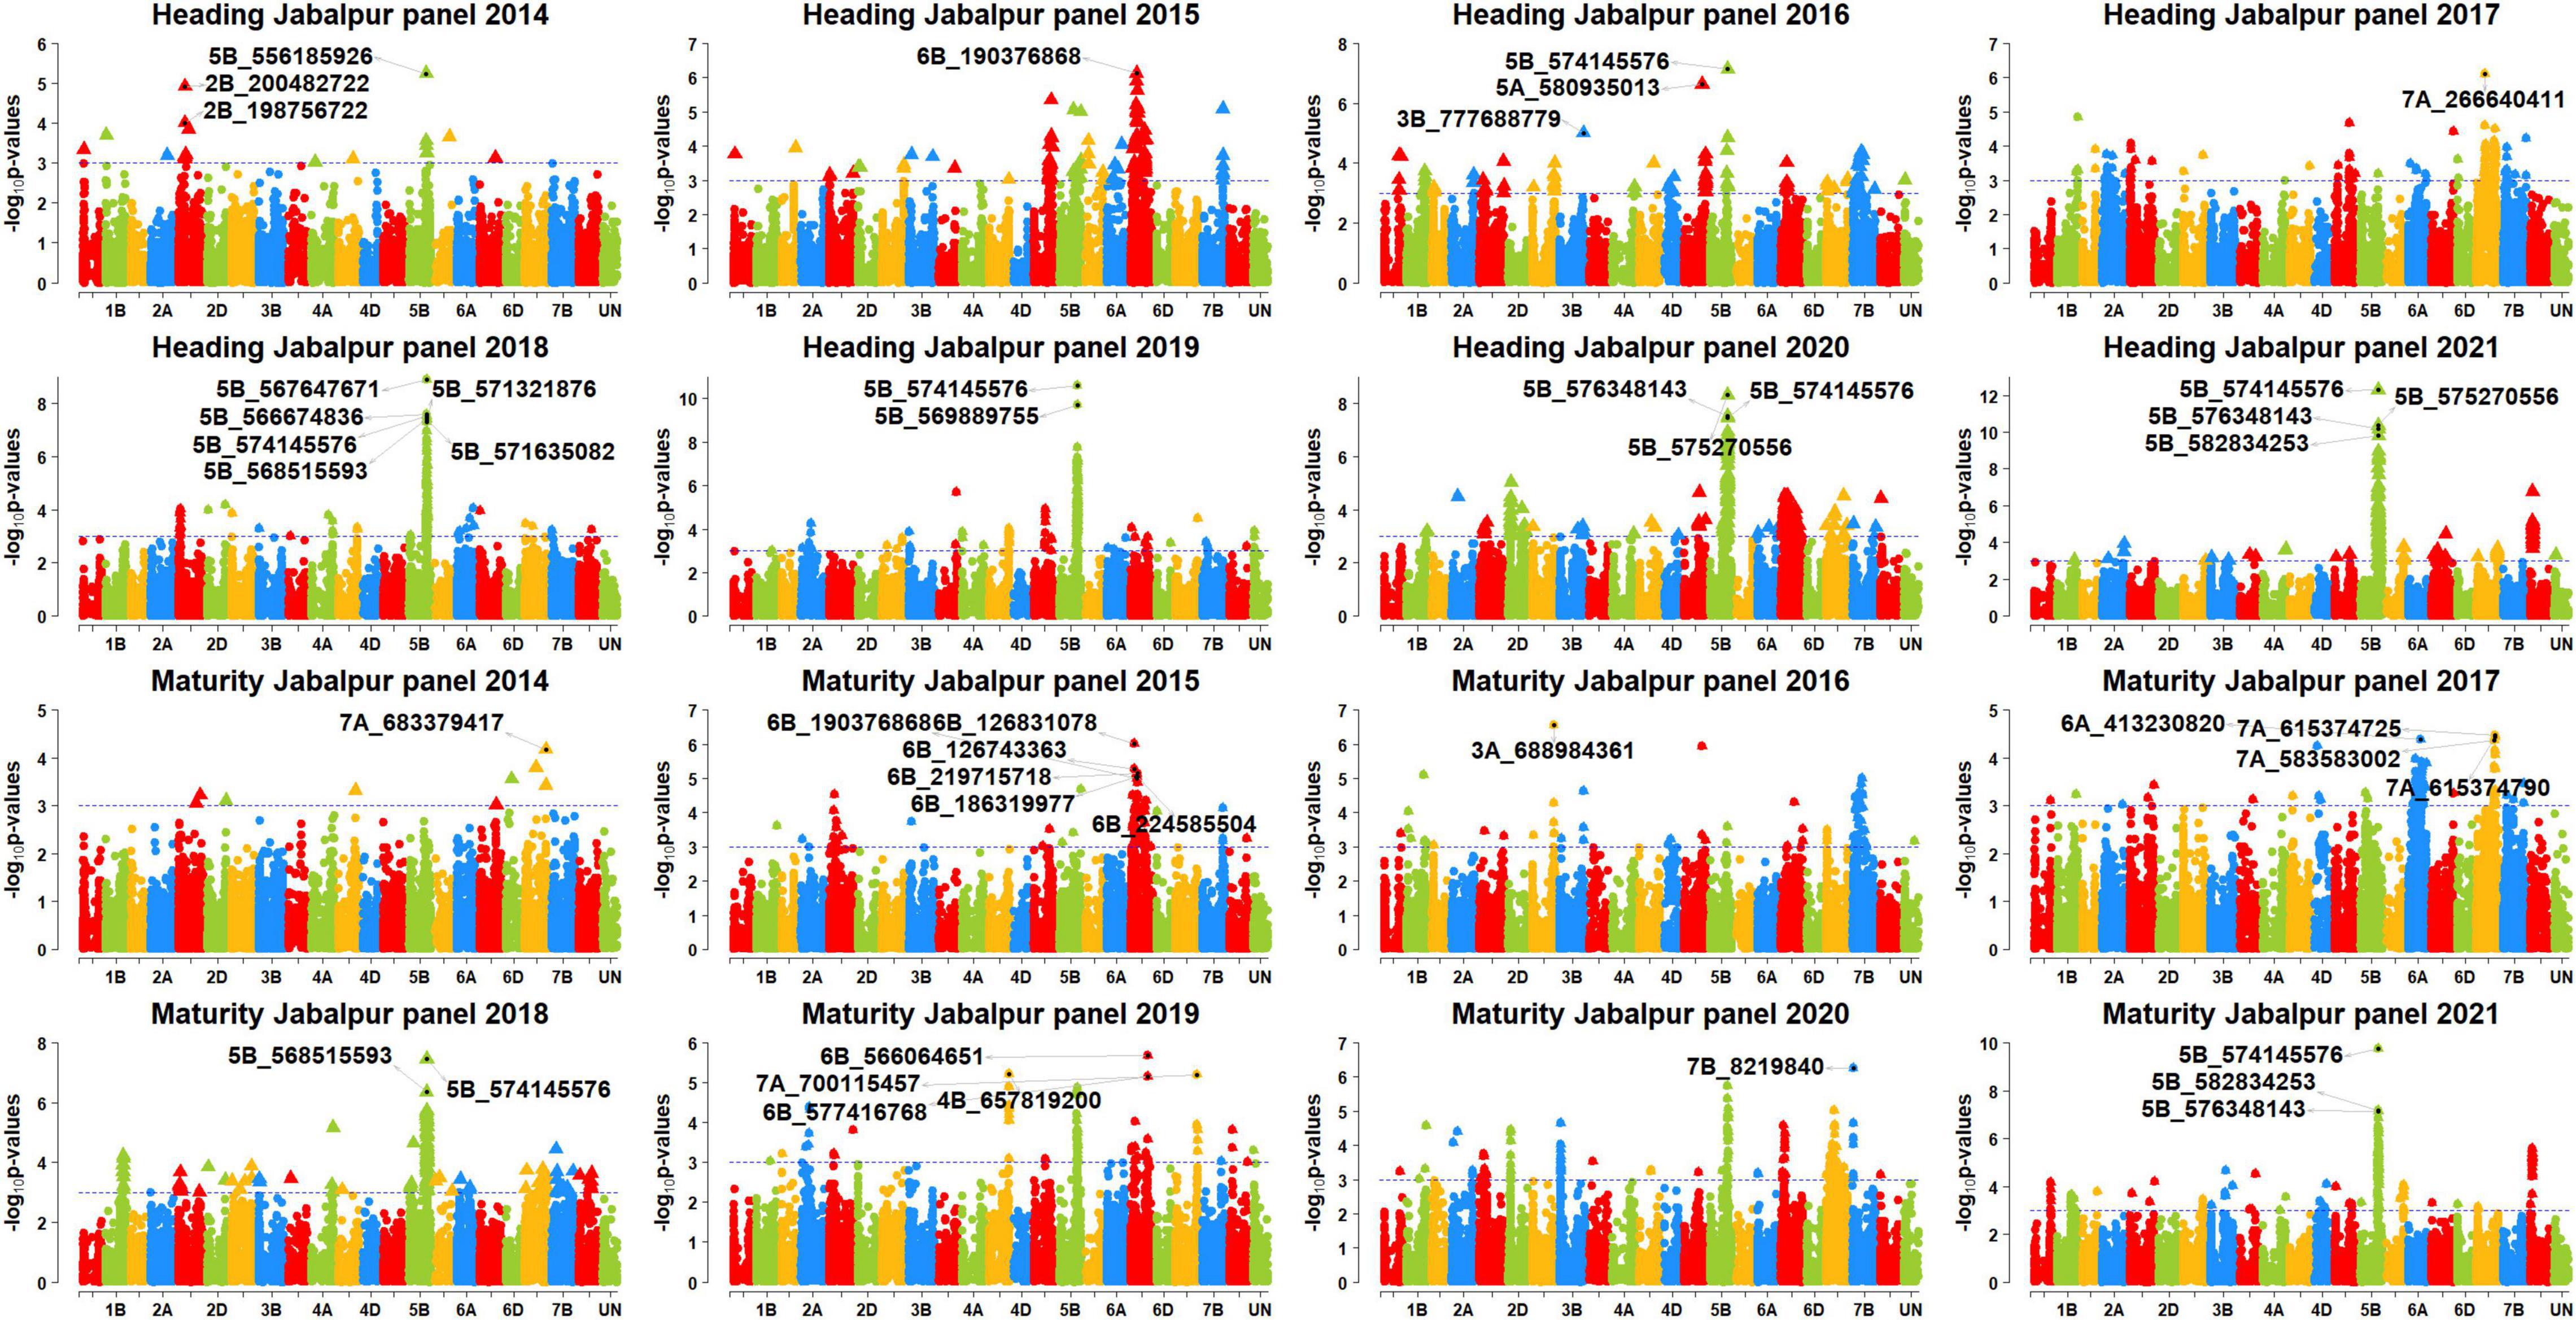
Figure 4. Manhattan plots showing the genomic regions significantly associated with days to heading (DH) and maturity (DH) in Jabalpur in panels 2014–2021.
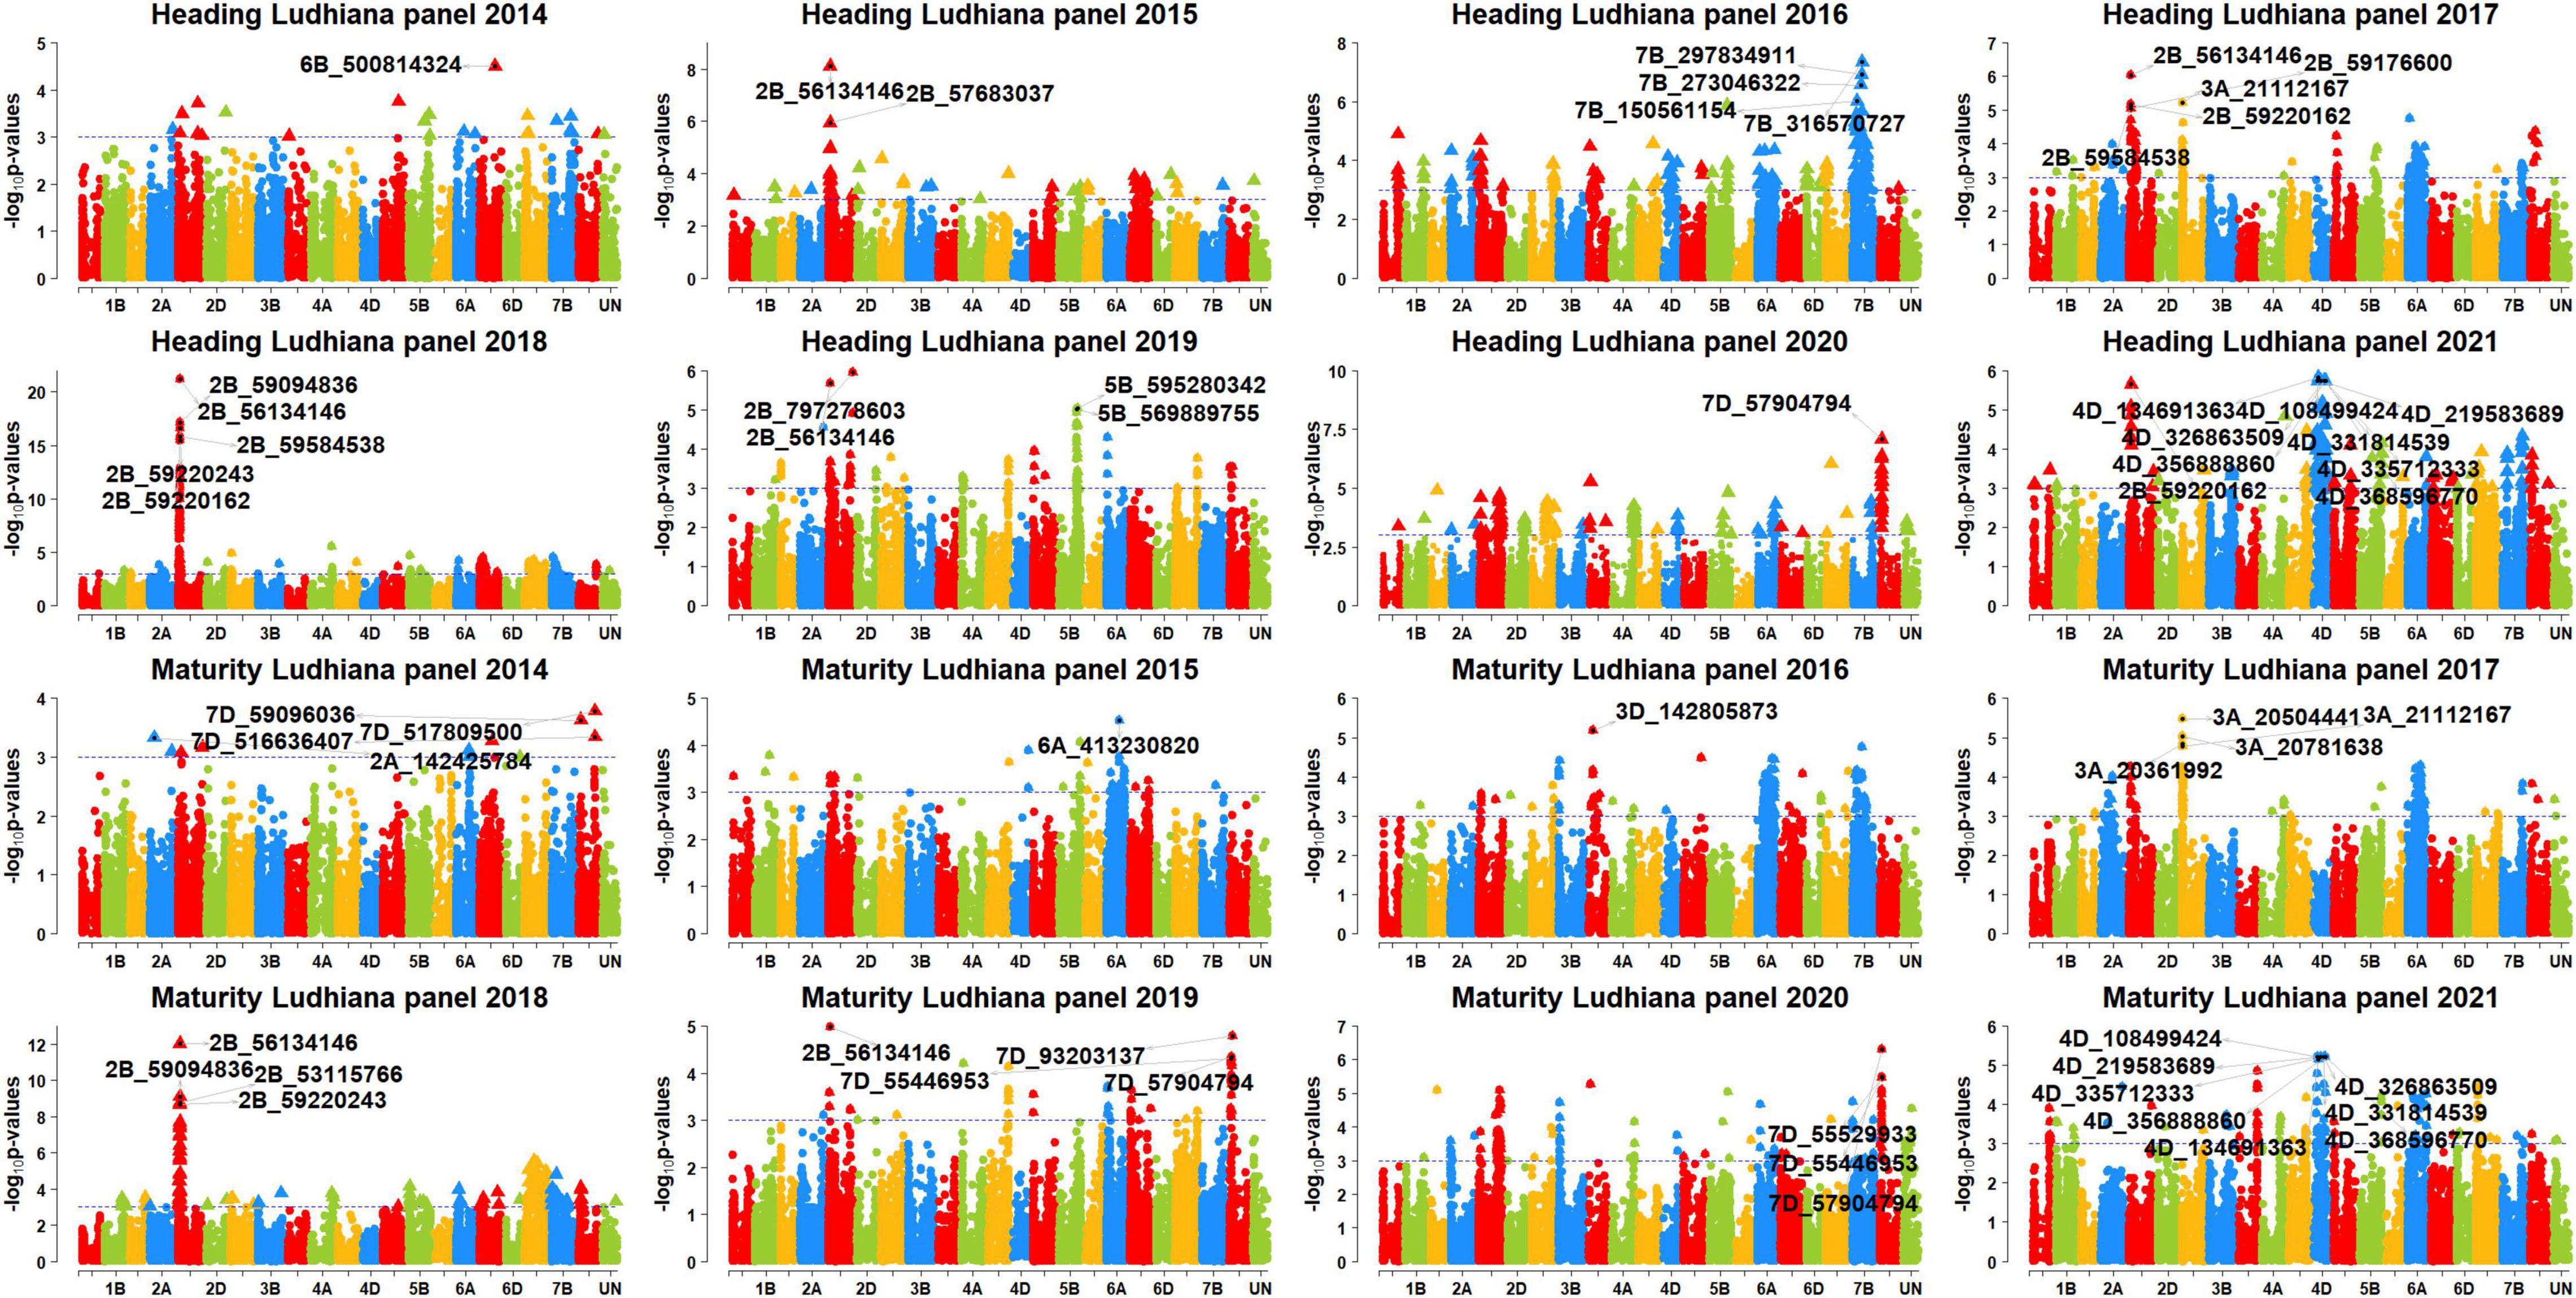
Figure 5. Manhattan plots showing the genomic regions significantly associated with days to heading (DH) and maturity (DM) in Ludhiana in panels 2014–2021.
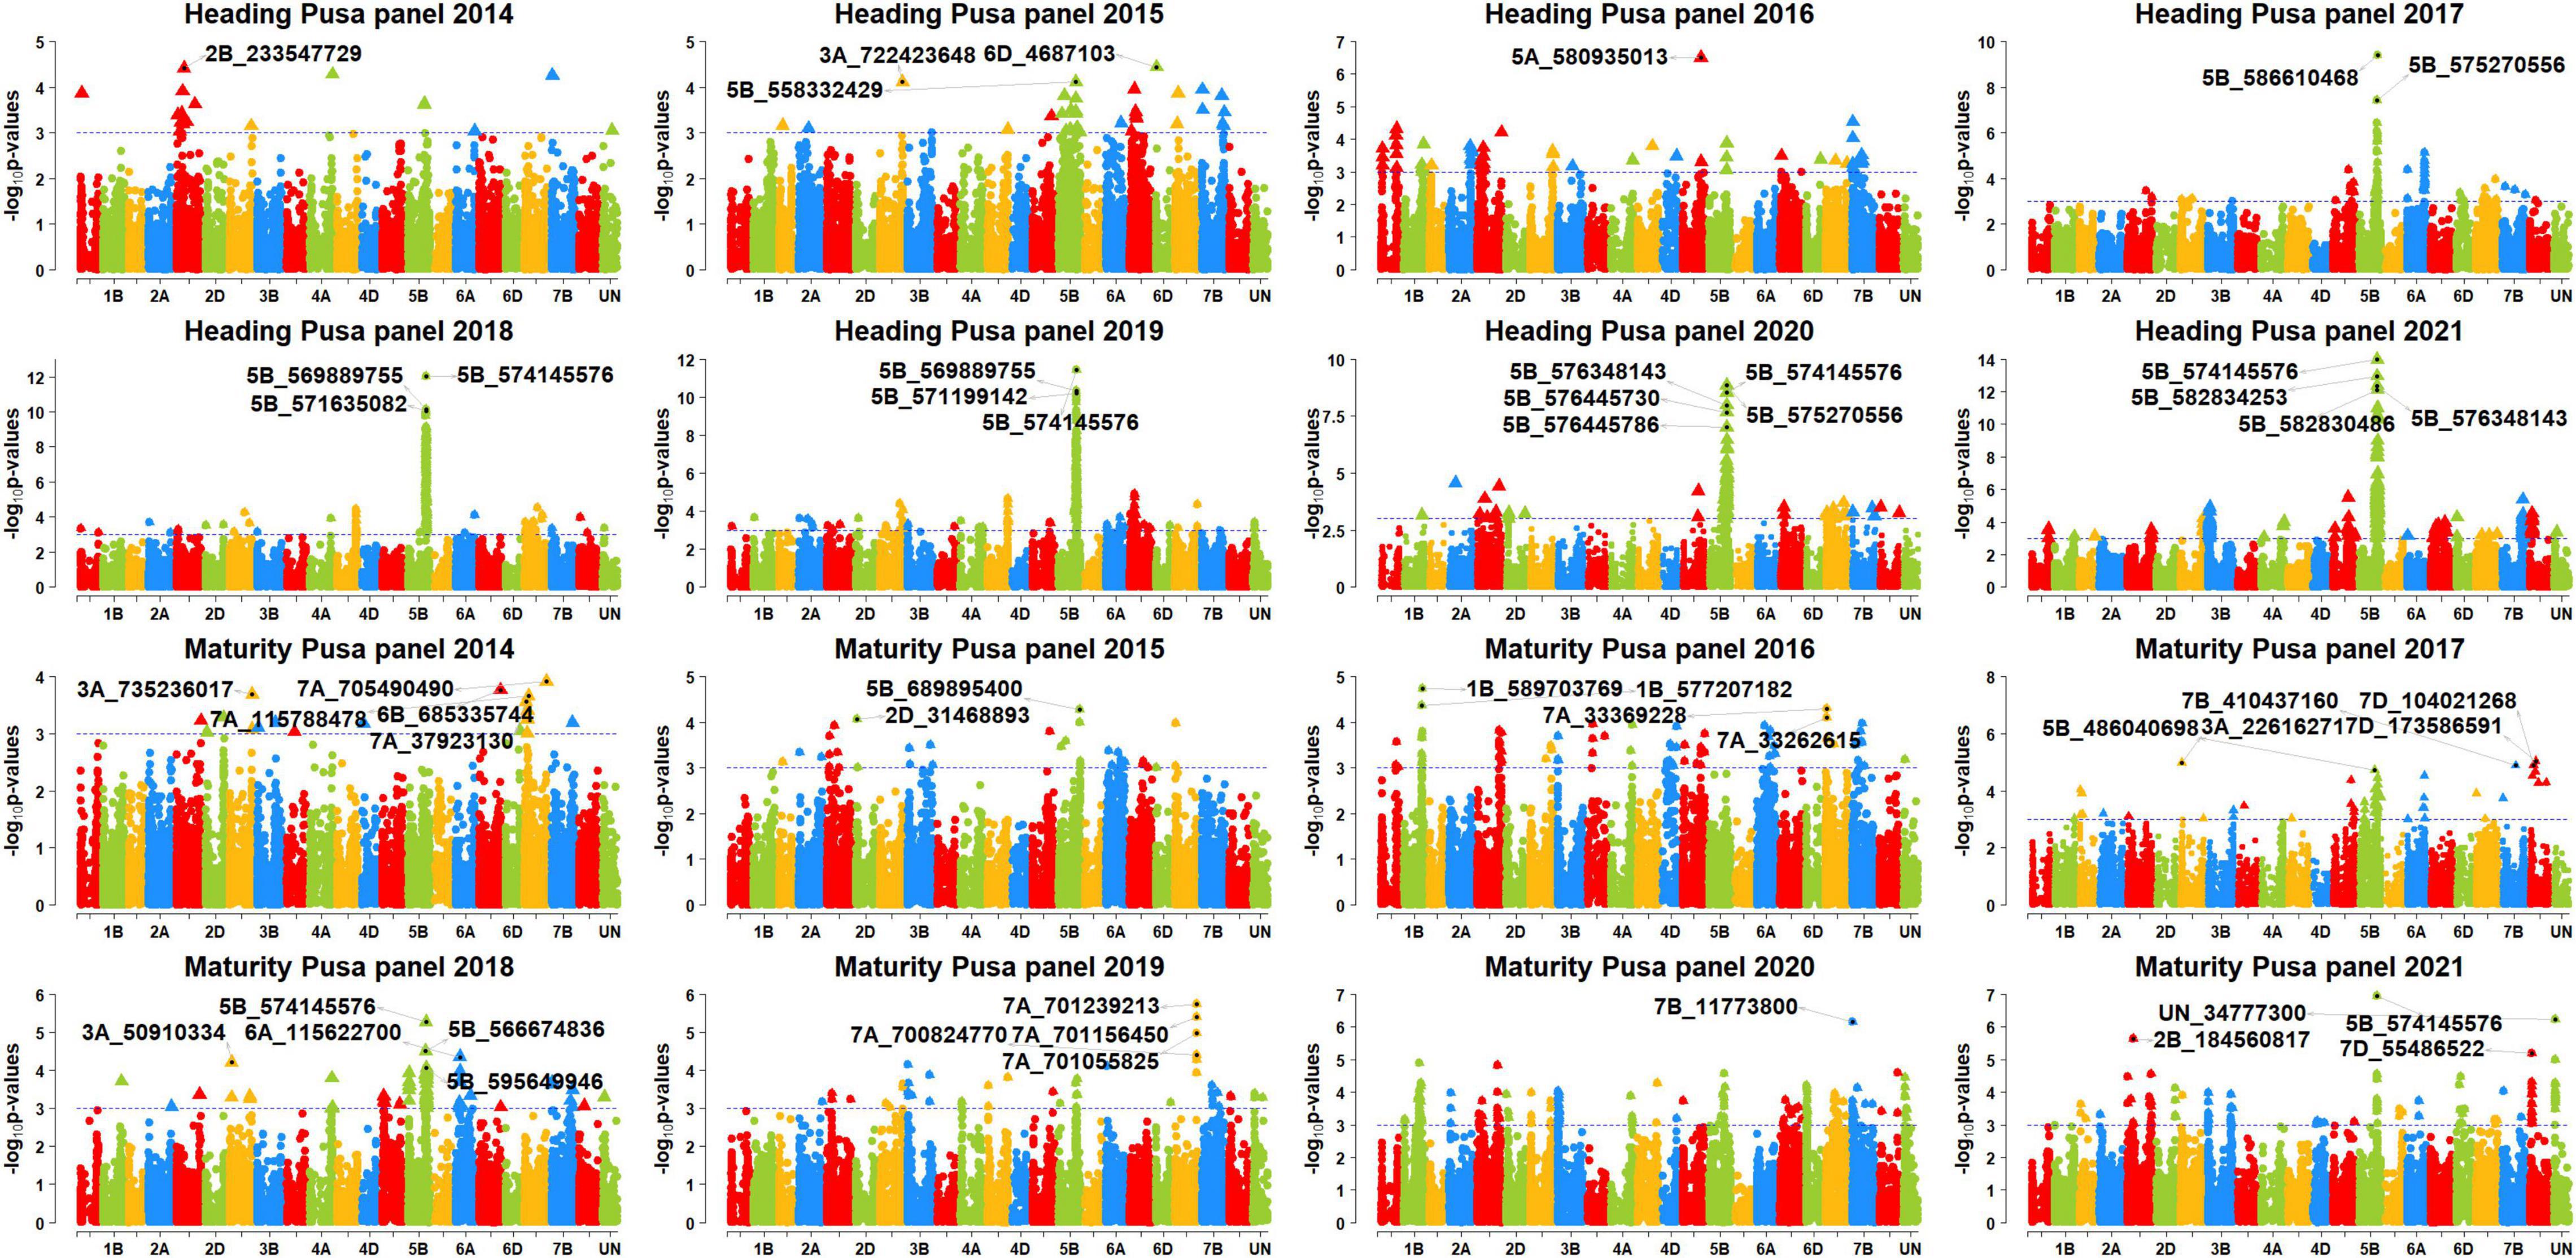
Figure 6. Manhattan plots showing the genomic regions significantly associated with days to heading (DH) and maturity (DM) in Pusa in panels 2014–2021.
Markers Significantly Associated With Days to Maturity in More Than One Site
We observed that markers 5B_574145576 and 7D_55486522 were associated with DM in Jabalpur and Pusa. Among them, marker 5B_574145576 had additive effects ranging from 1.2 to 1.8 days in Jabalpur and 0.95 to 1.1 days in Pusa and explained 4.6 to 9.5% and 4.7 to 6.4% of the phenotypic variation in Jabalpur and Pusa, respectively. The other marker (7D_55486522) had additive effects of 1.1 and 0.66 days in Jabalpur and Pusa, respectively, and it explained 4.8 and 5% of the phenotypic variation in these sites. Furthermore, three markers on 7D (7D_55529933, 7D_55920290, and 7D_57904794) were found to be significantly associated in Jabalpur and Ludhiana. These markers had additive effects ranging from 1.06 to 1.1 days in Jabalpur and 0.67 to 0.68 days in Ludhiana, while they explained 4.7 to 5.2% and 4.7 to 5.5% of the phenotypic variation in Jabalpur and Ludhiana, respectively.
Markers Significantly Associated With Both Days to Heading and Days to Maturity
Eighty-four markers were significantly associated with both traits DH and DM in different sites and panels (Figures 4–6) including 41 markers on chromosome 5B (between 557138254 and 595649946 bps), 18 markers on chromosome 2B (between 43232877 and 59584538 bps), 10 markers on chromosome 7D (between 55446953, and 58633321 bps), eight markers on chromosome 4D (between 108499424 and 368596770 bps), four markers on chromosome 6B (between 186319977 and 224585504 bps), and one marker each on chromosomes 3D, 5A, and 7B.
Discussion
We have analyzed the variation in DH and DM in three main wheat-producing zones in India, including Ludhiana, representing the NWPZ, Jabalpur, representing the CZ and Pusa, representing the NEPZ. We observed that across all the panels, the mean DH was the highest in Ludhiana (103.8 ± 6 days) and lowest in Jabalpur (77.7 ± 6.7 days), while the mean DM were the highest in Ludhiana (148.6 ± 4.6 days) and lowest in Jabalpur (121.6 ± 4.9). This could be because of local weather conditions, mainly temperature which remains cooler in the northwest India where Punjab (Ludhiana) is located compared with central India which has the state of Madhya Pradesh (Jabalpur). Among the three sites, the mean broad-sense heritabilities for DH were higher in Ludhiana (0.93 ± 0.03) and Jabalpur (0.84 ± 0.09) than in Pusa (0.85 ± 0.07). The high heritabilities that we have observed, along with the high genetic variance compared with the residual variance in all the sites, indicate the high contribution of genetic factors to the phenological traits in the panels and environments analyzed in this study. Our analysis of variance results across sites indicated that both the genotypes and sites were significantly different for both the phenological traits, which indicates the variable performance of the genotypes in the different sites and also the environmental differences in these sites. Our results also indicated that among the three sites, the highest phenotypic correlation for DH (0.69 ± 0.15) and DM (0.61 ± 0.08) was between Pusa and Jabalpur, while the lower correlation was between Pusa and Ludhiana (0.59 ± 0.09, 0.52 ± 0.13) for DH and DM, respectively. This could be due to the fact that wheat-growing seasons at Pusa and Jabalpur are warmer and about 2–3 weeks shorter than Ludhiana. The shorter crop duration at Pusa and Jabalpur had effect on phenological traits such as DH and DM. However, Pusa is more humid compared with Jabalpur and Ludhiana.
We performed GWAS for DH and DM and reported 222 markers significantly associated with the traits in different spring bread wheat panels. On chromosome 2BL, several markers between 43232877 and 59584538 bps were significantly associated with both heading and maturity in Ludhiana with additive effects ranging between 0.62 and 2.1 days. Among them, marker 2B_56134146 that was significant in seven datasets was the closest marker to the Ppd-B1 gene (0.10 Mbs away) and is therefore linked to the gene. However, we also observed that the Ppd-B1 gene was associated with the phenological traits in only Ludhiana representing the NWPZ and not the other sites, indicating that it contributes to specific adaptation to this zone. Díaz et al. (2012) showed that alleles of Ppd-B1 (along with Vrn-A1) were associated with an increased copy number of both genes and resulted in earlier flowering (Ppd-B1a) or increased vernalization requirements (Vrn-A1w). These results, along with a separate study in durum (Würschum et al., 2019), suggest that copy number variation is important for the adaptation of wheat.
On chromosome 4D, we have identified markers between 61853654 and 368596770 bps associated with both DH and DM in Ludhiana with additive effects ranging between 0.2 and 1.6 days. Among them, marker 4D_368596770 was very close to the Vrn-D2 gene (within 141 kb) and appears to indicate a novel locus. Marker 5A_580935013 on 5AL in panel 2016 was associated with DH in Jabalpur and Pusa and DM in Jabalpur. This marker had the additive effects ranging between 2 and 4.4 days and is linked to the Vrn-A1 gene which is only 6.5 Mbps away. However, possibility of some other genes in that region may not be ruled out. Our results indicate that this gene does not play a major role in the phenology and adaptation to the three major wheat-producing zones of India in the lines and environments used in this study. The Vrn-A1 gene, which is known to play a role in frost tolerance, did not appear important as tested in this study, but has shown an increased frequency of its alleles in winter wheat (Eagles et al., 2011; Zhu et al., 2014). A previous study by Juliana et al. (2019) also did not observe a significant effect of the Vrn-A1 gene on phenology in CIMMYT’s advanced spring wheat breeding lines. These results are in contrast to those reported by Santra et al. (2009), which indicated Vrn-A1a as the most frequent allele in spring wheat genotypes from the Pacific Northwest region of the United States.
On chromosome 5BL, several markers between 549730988 and 597098833 were associated with DH in six panels in Jabalpur, two in Ludhiana, and five in Pusa. In addition, they were also associated with DM in three panels in Jabalpur and two in Pusa. While the additive effects of the 5B markers ranged between 0.8 and 2.8 days, the marker 5B_574145576 that was significantly associated in 16 datasets was only 0.33 Mbs away from the Vrn-B1 gene. However, we observed that the Vrn-B1 gene was associated with DH in multiple panels in Jabalpur and Pusa, but only in a few panels in Ludhiana, indicating its strong association with phenology in multiple years at the NEPZ and CZ, compared with the NWPZ of India.
On chromosome 6B, markers between 186319977 and 224585504 bps were associated with both heading and maturity in Jabalpur in panel 2015 and suggest a specific adaptation QTL for Jabalpur, with additive effects ranging between 1 and 1.1 days. These markers flank Qcim.6B.5.2 linked to marker S6B_190376868 that was associated with DH in irrigated and drought-stressed environments of Obregon, Mexico (Juliana et al., 2019), and indicate the presence of the same QTL. On chromosome 7BS, markers 7B_8219840 and 7B_11773800 that were associated with DM in Jabalpur and Pusa with additive effects ranging between 0.9 and 1 days flanked the Vrn-B3 gene but were significant only in panel 2020. On chromosome 7DS, several markers between 55446953 and 58633321 bps were associated with DH and DM in panels 2020 and 2021 in Ludhiana and Jabalpur and DM in only panel 2021 in Pusa and had additive effects ranging between 0.6 and 1.1 days. While marker 7D_58633321 was 9.8 Kbp away from the Vrn-D3 gene and might be indicating this gene, the markers were in the same position as Qcim.7D.2 associated with DM in irrigated and drought-stressed environments in Obregon, Mexico (Juliana et al., 2019).
While this study has validated genomic regions associated with DH and maturity in previous studies, we have also reported novel genomic regions not reported previously. The presence of Ppd-B1 genes in all the well-adapted lines of each panel suggests the importance of those genes in NWPZ, while the Vrn-B1 gene is indicated to be contributed to adaptation in the NEPZ and CZ of India. We observed a maximum variation of 21.1 and 14% explained by markers 2B_56134146 and 5B_574145576 associated with the Ppd-B1 and Vrn-B1 genes’ regions, respectively, that further provide evidence to their significant role in regulating DH and maturity. We also observed that 9.1–77.3% of the markers significantly associated with DH and 2–9% of the markers significantly associated with DM were significantly associated in more than one panel, indicating a large effect of the years and environments on the traits. In addition, this could also be attributed to different lines with variable allelic frequencies that were present in the different panels and because not all the markers used for GWAS were common across all the panels.
The average extent of LD in wheat was approximately 5 × 10⁷ bps (Juliana et al., 2018). Therefore, finding association of candidate genes with significant markers is difficult due to the high LD in many chromosomal regions/gene intervals. Extensive LD in wheat that decays at about 5 × 10⁷ bps poses a huge challenge for delineating candidate gene intervals, and candidates should be further fine mapped, functionally characterized, and validated (Juliana et al., 2018).
The GWAS results for DH indicated that three markers on chromosome 5B (in proximity of Vrn-B1 gene) were constantly significant in all environments, while 72 markers were significant in Jabalpur and Pusa. Similarly, three markers on chromosome 7D were significant in Jabalpur and Ludhiana. This indicates the existence of shared genetic basis for this trait and adaption in different wheat-producing zones of India. However, for DM we observed that no marker was associated with all the three sites, while two to three markers were common between Jabalpur and Pusa, as well as Jabalpur and Ludhiana (Figure 7). While this indicates that there could be a shared genetic basis for DM in these sites, it is also worth highlighting that none of the markers were significantly associated with DM in both Ludhiana and Pusa. Finally, we also observed 84 markers that were associated with both DH and maturity in the different panels and sites with most of them linked to the Ppd-B1 and Vrn-B1 genes indicating the association of these genes with both traits. Adjusting the developmental stages and maturity of wheat through breeding is one of the best ways to develop widely adapted varieties. The combination of Vrn and Ppd genes plays an important role in adaptation to a particular environment. For example, higher productivity is obtained under early sown wheat where mild vernalization gene and relatively significant effect Ppd gene combination is preferred (Farhad et al., 2022). The results of this study are expected to provide valuable insights into the genetic basis of phenology-driven adaptation of bread wheat genotypes in the major wheat-producing zones of India.
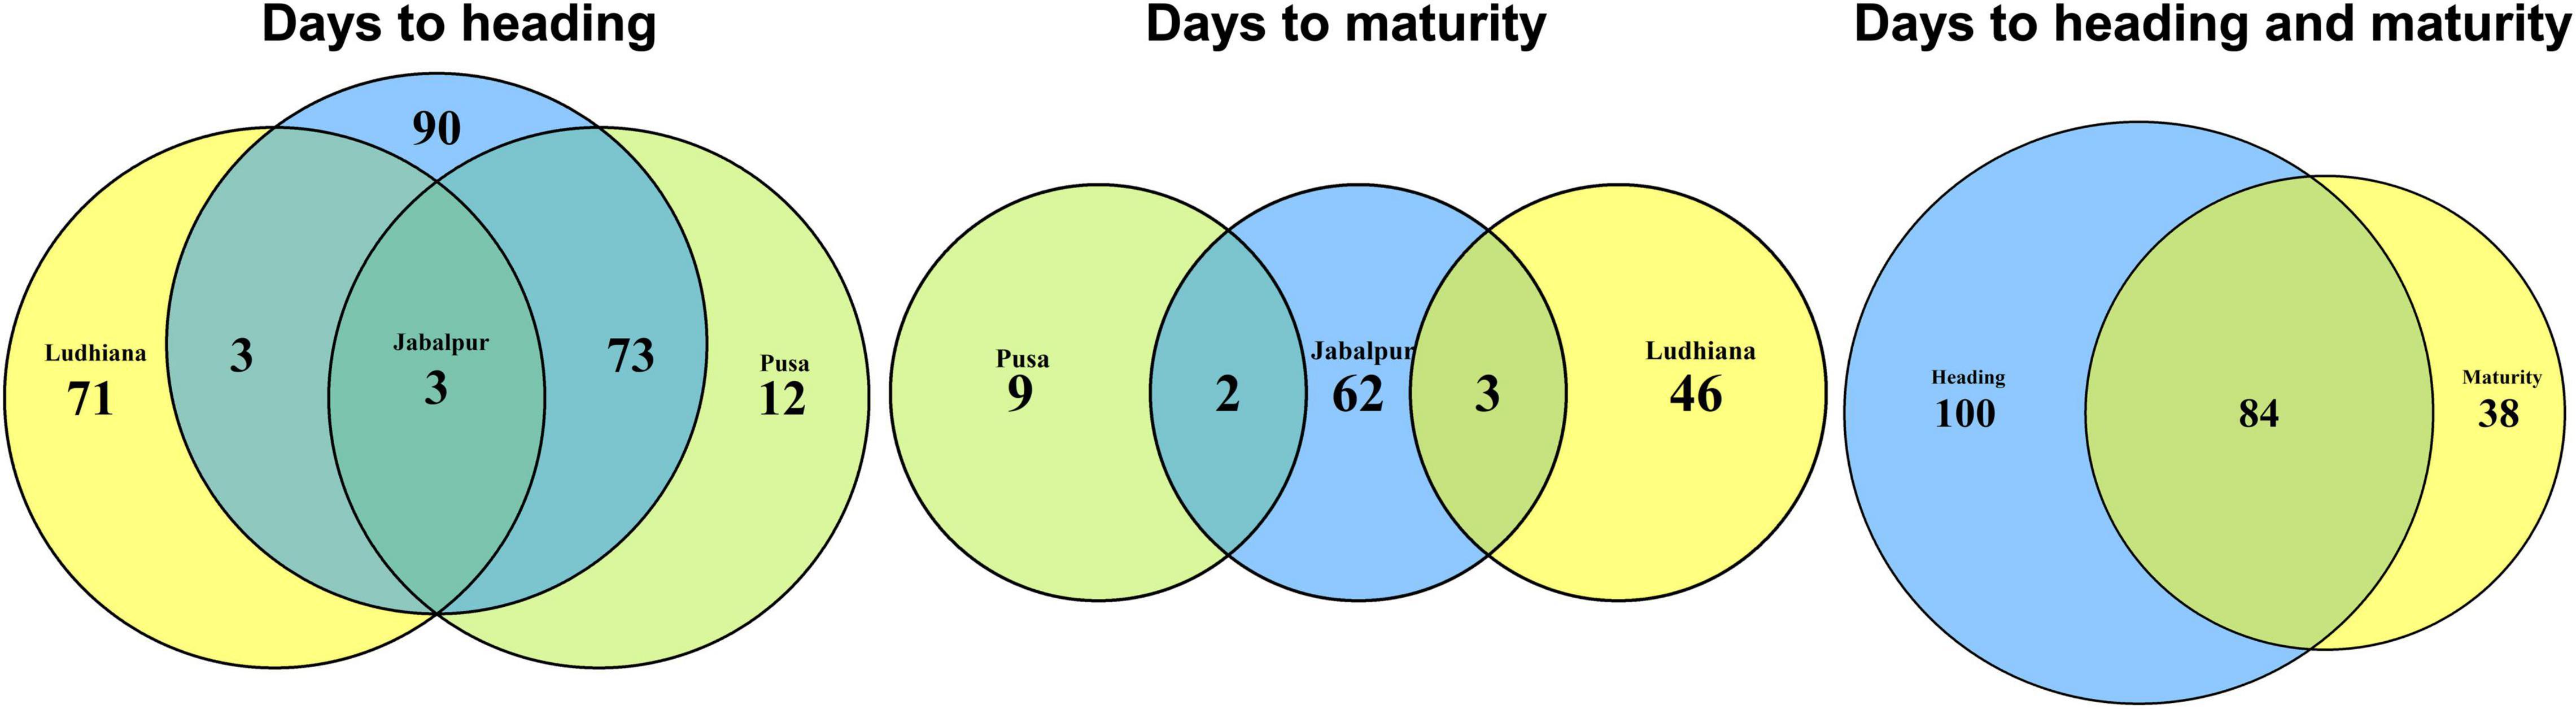
Figure 7. Venn diagrams showing the markers significantly associated with days to heading (DH) and maturity (DM) in different sites and the overlapping number of markers across sites and traits.
Data Availability Statement
The original contributions presented in this study are included in the article/Supplementary Material, further inquiries can be directed to the corresponding authors.
Author Contributions
PKB wrote the manuscript. PKB and PJ analyzed the data and wrote, reviewed, and edited. RPS, JH-E, LC-H, VG, and SM provided the breeding material and review and edited. JP and SS provided genotyping data. PKB, MKV, and UK managed field trials and recorded the phenotypic data. UK, RPS, AKJ, and SM designed the experiment and supervised the research project conceptualization, funding acquisition, project administration, resources, supervision, review, and editing. All authors have read and approved the final manuscript.
Funding
This research was supported by the Accelerating Genetic Gain (AGG) in Maize and Wheat Project Grant INV-003439 funded by the Bill and Melinda Gates Foundation (BMGF), the Foreign and Commonwealth Development Office (FCDO), and Foundation for Food and Agriculture Research (FFAR), Feed the Future project Grant #AID-OAA-A-13-00051 funded by the United States Agency for International Development (USAID) and the Indian Council of Agricultural Research (ICAR) funds.
Conflict of Interest
The authors declare that the research was conducted in the absence of any commercial or financial relationships that could be construed as a potential conflict of interest.
Publisher’s Note
All claims expressed in this article are solely those of the authors and do not necessarily represent those of their affiliated organizations, or those of the publisher, the editors and the reviewers. Any product that may be evaluated in this article, or claim that may be made by its manufacturer, is not guaranteed or endorsed by the publisher.
Acknowledgments
We thank the field staff at the field sites of the Borlaug Institute of South Asia at Ludhiana, Jabalpur, and Samastipur (Pusa) for their assistance with the data collection and specially thank Avdhesh Kumar, Yogesh Kumar, and Manish Kumar for technical support.
Supplementary Material
The Supplementary Material for this article can be found online at: https://www.frontiersin.org/articles/10.3389/fpls.2022.920682/full#supplementary-material
Supplementary File 1 | Biplot and dendrogram of the genetic correlation matrix for the traits studied in the wheat association panel grown in three different environments in India from 2014–2021.
Supplementary File 2 | Individual marker effect, position on each chromosome, and p-value with marker effect.
Supplementary File 3 | Single-nucleotide polymorphism markers significantly associated with phenological traits (DH and DM).
Supplementary File 4 | Consistent markers significantly associated with agro-morphological traits.
Supplementary File 5 | Quantile–quantile plots demonstrating the ratios of expected to observe log10 (P) values.
Footnotes
- ^ https://eands.dacnet.nic.in/
- ^ https://iiwbr.icar.gov.in/
- ^ http://visualization.ritchielab.org/phenograms/plot
References
Alvarado, G., Rodríguez, F. M., Pacheco, A., Burgueño, J., Crossa, J., Vargas, M., et al. (2020). META-R: a software to analyze data from multi-environment plant breeding trials. Crop J. 8, 745–756. doi: 10.1016/j.cj.2020.03.010
Aslam, M. S., Huanxue, P., Sohail, S., Majeed, M. T., Rahman, S., and Anees, S. A. (2022). Assessment of major food crops production-based environmental efficiency in China, India, and Pakistan. Environ. Sci. Pollut. Res. 29, 10091–10100. doi: 10.1007/s11356-021-16161-x
Bentley, A. R., Horsnell, R., Werner, C. P., Turner, A. S., Rose, G. A., Bedard, C., et al. (2013). Short, natural, and extended photoperiod response in BC2F 4 lines of bread wheat with different Photoperiod-1 (Ppd-1) alleles. J. Exp. Bot. 64, 1783–1793. doi: 10.1093/jxb/ert038
Bradbury, P. J., Zhang, Z., Kroon, D. E., Casstevens, T. M., Ramdoss, Y., and Buckler, E. S. (2007). TASSEL: software for association mapping of complex traits in diverse samples. Bioinformatics 23, 2633–2635. doi: 10.1093/bioinformatics/btm308
Breseghello, F., and Sorrells, M. E. (2006). Association mapping of kernel size and milling quality in wheat (Triticum aestivum L.) cultivars. Genetics 172, 1165–1177. doi: 10.1534/genetics.105.044586
Browning, B. L., and Browning, S. R. (2016). Genotype imputation with millions of reference samples. Am. J. Hum. Genet. 98, 116–126. doi: 10.1016/j.ajhg.2015.11.020
Chouard, P. (1960). Vernalization and its relations to dormancy. Annu. Rev. Plant Physiol. 11, 191–238. doi: 10.1146/annurev.pp.11.060160.001203
Crossa, J., Burgueño, J., Dreisigacker, S., Vargas, M., Herrera-Foessel, S. A., Lillemo, M., et al. (2007). Association analysis of historical bread wheat germplasm using additive genetic covariance of relatives and population structure. Genetics 177, 1889–1913. doi: 10.1534/genetics.107.078659
Curtis, T., and Halford, N. G. (2014). Food security: the challenge of increasing wheat yield and the importance of not compromising food safety. Ann. Appl. Biol. 164, 354–372. doi: 10.1111/aab.12108
Díaz, A., Zikhali, M., Turner, A. S., Isaac, P., and Laurie, D. A. (2012). Copy number variation affecting the photoperiod-B1 and vernalization-A1 genes is associated with altered flowering time in wheat (Triticum aestivum). PLoS One 7:e33234. doi: 10.1371/journal.pone.0033234
Distelfeld, A., Li, C., and Dubcovsky, J. (2009). Regulation of flowering in temperate cereals. Curr. Opin. Plant Biol. 12, 178–184. doi: 10.1016/j.pbi.2008.12.010
Eagles, H. A., Cane, K., and Trevaskis, B. (2011). Veery wheats carry an allele of Vrn-A1 that has implications for freezing tolerance in winter wheats. Plant Breed. 130, 413–418.
Endelman, J. B., and Jannink, J. L. (2012). Shrinkage estimation of the realized relationship matrix. G3 Genes Genomes Genet. 2, 1405–1413. doi: 10.1534/g3.112.004259
Farhad, M., Tripathi, S. B., Singh, R. P., Joshi, A. K., Bhati, P. K., Vishwakarma, M. K., et al. (2022). Multi-trait selection of bread wheat ideotypes for adaptation to early sown condition. Crop Sci. 62, 67–82. doi: 10.1002/csc2.20628
Gahlaut, V., Jaiswal, V., Balyan, H. S., Joshi, A. K., and Gupta, P. K. (2021). Multi-Locus GWAS for grain weight-related traits under rain-fed conditions in common wheat (Triticum aestivum L.). Front. Plant Sci. 12:758631. doi: 10.3389/fpls.2021.758631
George, A. W., and Cavanagh, C. (2015). Genome-wide association mapping in plants. Theor. Appl. Genet. 128, 1163–1174. doi: 10.1007/s00122-015-2497-x
Glaubitz, J. C., Casstevens, T. M., Lu, F., Harriman, J., Elshire, R. J., Sun, Q., et al. (2014). TASSEL-GBS: a high capacity genotyping by sequencing analysis pipeline. PLoS One 9:e90346. doi: 10.1371/journal.pone.0090346
Gupta, P. K., Mir, R. R., Mohan, A., and Kumar, J. (2008). Wheat genomics: present status and future prospects. Int. J. Plant Genom. 896451, 1–36. doi: 10.1155/2008/896451
Hyles, J., Bloomfield, M. T., Hunt, J. R., Trethowan, R. M., and Trevaskis, B. (2020). Phenology and related traits for wheat adaptation. Heredity 125, 417–430.
Ingvarsson, P. K., and Street, N. R. (2011). Association genetics of complex traits in plants. New Phytol. 189, 909–922. doi: 10.1111/j.1469-8137.2010.03593.x
Joshi, A. K., Ferrara, O., Crossa, J., Singh, G., Sharma, R., Chand, R., et al. (2007). Combining superior agronomic performance and terminal heat tolerance with resistance to spot blotch (Bipolaris sorokiniana) in the warm humid Gangetic Plains of South Asia. Field Crops Res. 103, 53–61. doi: 10.1016/j.fcr.2007.04.010
Juliana, P., Poland, J., Huerta-Espino, J., Shrestha, S., Crossa, J., Crespo-Herrera, L., et al. (2019). Improving grain yield, stress resilience and quality of bread wheat using large-scale genomics. Nat. Genet. 51, 1530–1539. doi: 10.1038/s41588-019-0496-6
Juliana, P., Singh, R. P., Poland, J., Shrestha, S., Huerta-Espino, J., Govindan, V., et al. (2021). Elucidating the genetics of grain yield and stress-resilience in bread wheat using a large-scale genome-wide association mapping study with 55,568 lines. Sci. Rep. 11:5254. doi: 10.1038/s41598-021-84308-4
Juliana, P., Singh, R. P., Singh, P. K., Poland, J. A., Bergstrom, G. C., Huerta-Espino, J., et al. (2018). Genome-wide association mapping for resistance to leaf rust, stripe rust and tan spot in wheat reveals potential candidate genes. Theor. Appl. Genet. 131, 1405–1422. doi: 10.1007/s00122-018-3086-6
Keim, D. L., Welsh, J. R., and McConnell, R. L. (1973). Inheritance of photoperiodic heading response in winter and spring cultivars of bread wheat. Can. J. Plant Sci. 53, 247–250. doi: 10.4141/cjps73-046
Khumalo, T. P., Barnard, A., Maphosa, L., and Tsilo, T. J. (2017). “Impact of growth habit and architecture genes on adaptation and performance of bread wheat,” in Wheat Improvement, Management and Utilization, eds R. Wanyera and J. Owuoche (Norderstedt: BoD – Books on Demand). doi: 10.5772/67116
Kippes, N., Debernardi, J. M., Vasquez-Gross, H. A., Akpinar, B. A., Budak, H., Kato, K., et al. (2015). Identification of the VERNALIZATION 4 gene reveals the origin of spring growth habit in ancient wheats from South Asia. Proc. Natl. Acad. Sci. U.S.A. 112, E5401–E5410. doi: 10.1073/pnas.1514883112
Kumar, S., Sharma, V., Chaudhary, S., Tyagi, A., Mishra, P., Priyadarshini, A., et al. (2012). Genetics of flowering time in bread wheat Triticum aestivum: complementary interaction between vernalization-insensitive and photoperiod-insensitive mutations imparts very early flowering habit to spring wheat. J. Genet. 91, 33–47. doi: 10.1007/s12041-012-0149-3
Kumar, U., Singh, R. P., Dreisigacker, S., Röder, M. S., Crossa, J., Huerta-Espino, J., et al. (2021). Juvenile heat tolerance in wheat for attaining higher grain yield by shifting to early sowing in October in South Asia. Genes 12:1808. doi: 10.3390/genes12111808
Langmead, B., and Salzberg, S. L. (2012). Fast gapped-read alignment with Bowtie 2. Nat. Methods 9, 357–359. doi: 10.1038/nmeth.1923
Li, F., Wen, W., Liu, J., Zhang, Y., Cao, S., He, Z., et al. (2019). Genetic architecture of grain yield in bread wheat based on genome-wide association studies. BMC Plant Biol. 19:168. doi: 10.1186/s12870-019-1781-3
Maccaferri, M., Zhang, J., Abate, Z., and Chao, S. (2015). A genome-wide association study of resistance to stripe rust (Puccinia striiformis f.sp.tritici) in a worldwide collection of hexaploid spring wheat (Triticum aestivum L). G3 5, 449–465. doi: 10.1534/g3.114.014563
Muhammad, A., Li, J., Hu, W., Yu, J., Khan, S. U., Khan, M. H. U., et al. (2021). Uncovering genomic regions controlling plant architectural traits in hexaploid wheat using different GWAS models. Sci. Rep. 11:6767. doi: 10.1038/s41598-021-86127-z
Nyquist, W. E. (1991). Estimation of heritability and prediction of selection response in plant populations. Crit. Rev. Plant Sci. 10, 235–322. doi: 10.1080/07352689109382313
Ochagavía, H., Prieto, P., Zikhali, M., Griffiths, S., and Slafer, G. A. (2019). Earliness Per Se by temperature interaction on wheat development. Sci. Rep. 9:2584. doi: 10.1038/s41598-019-39201-6
Patterson, H. D., Williams, E. R., and Hunter, E. A. (1978). Block designs for variety trials. J. Agric. Sci. 90, 395–400. doi: 10.1017/S0021859600055507
Patterson, N., Price, A. L., and Reich, D. (2006). Population structure and eigenanalysis. PLoS Genet. 2:e190. doi: 10.1371/journal.pgen.0020190
Pérez-Gianmarco, T. I., Slafer, G. A., and González, F. G. (2019). Photoperiod-sensitivity genes shape floret development in wheat. J. Exp. Bot. 70, 1339–1348. doi: 10.1093/jxb/ery449
Poland, J. A., Brown, P. J., Sorrells, M. E., and Jannink, J. L. (2012). Development of high-density genetic maps for barley and wheat using a novel two-enzyme genotyping-by-sequencing approach. PLoS One 7:e32253. doi: 10.1371/journal.pone.0032253
Porter, J. R., and Gawith, M. (1999). Temperatures and the growth and development of wheat: a review. Eur. J. Agron. 10, 23–36.
Price, A. L., Patterson, N. J., Plenge, R. M., Weinblatt, M. E., Shadick, N. A., and Reich, D. (2006). Principal components analysis corrects for stratification in genome-wide association studies. Nat. Genet. 38, 904–909. doi: 10.1038/ng1847
Prieto, P., Ochagavía, H., Savin, R., Griffiths, S., and Slafer, G. A. (2018). Dynamics of floret initiation/death determining spike fertility in wheat as affected by Ppd genes under field conditions. J. Exp. Bot. 69, 2633–2645. doi: 10.1093/jxb/ery105
Ray, D. K., Mueller, N. D., West, P. C., and Foley, J. A. (2013). Yield trends are insufficient to double global crop production by 2050. PLoS One 8:e66428. doi: 10.1371/journal.pone.0066428
Santra, D. K., Santra, M., Allan, R. E., Campbell, K. G., and Kidwell, K. K. (2009). Genetic and molecular characterization of vernalization genes Vrn-A1, Vrn-B1, and Vrn-D1 in spring wheat germplasm from the pacific northwest region of the U.S.A. Plant Breed. 128, 576–584.
Scherer, A., and Christensen, G. B. (2016). Concepts and relevance of genome-wide association studies. Sci. Prog. 99, 59–67. doi: 10.3184/003685016X14558068452913
Snape, J. W., Butterworth, K., Whitechurch, E., and Worland, A. J. (2001). Waiting for fine times: genetics of flowering time in wheat. Euphytica 119, 185–190. doi: 10.1023/A:1017594422176
Sukumaran, S., Dreisigacker, S., Lopes, M., Chavez, P., and Reynolds, M. P. (2015). Genome-wide association study for grain yield and related traits in an elite spring wheat population grown in temperate irrigated environments. Theor. Appl. Genet. 128, 353–363. doi: 10.1007/s00122-014-2435-3
Waugh, R., Thomas, B., Flavell, A., Ramsay, L., Comadran, J., and Russell, J. (2014). “Genome-wide association scans (GWAS),” in Biotechnology in Agriculture and Forestry, ed. Y. P. S. Bajaj (Berlin: Springer), 345–365.
Wilhelm, E. P., Turner, A. S., and Laurie, D. A. (2009). Photoperiod insensitive Ppd-A1a mutations in tetraploid wheat (Triticum durum Desf.). Theor. Appl. Genet. 118, 285–294. doi: 10.1007/s00122-008-0898-9
Wright, T. I. C., Gardner, K. A., Glahn, R. P., and Milner, M. J. (2021). Genetic control of iron bioavailability is independent from iron concentration in a diverse winter wheat mapping population. BMC Plant Biol. 21:212. doi: 10.1186/s12870-021-02996-6
Würschum, T., Rapp, M., Miedaner, T., Longin, C. F. H., and Leiser, W. L. (2019). Copy number variation of Ppd-B1 is the major determinant of heading time in durum wheat. BMC Genet. 20:64. doi: 10.1186/s12863-019-0768-2
Yan, L., Fu, D., Li, C., Blechl, A., Tranquilli, G., Bonafede, M., et al. (2006). The wheat and barley vernalization gene VRN3 is an orthologue of FT. Proc. Natl. Acad. Sci. U.S.A. 103, 19581–19586. doi: 10.1073/pnas.0607142103
Yan, L., Loukoianov, A., Blechl, A., Tranquilli, G., Ramakrishna, W., SanMiguel, P., et al. (2004). The wheat VRN2 gene is a flowering repressor down-regulated by vernalization. Science 303, 1640–1644. doi: 10.1126/science.1094305
Yan, L., Loukoianov, A., Tranquilli, G., Helguera, M., Fahima, T., and Dubcovsky, J. (2003). Positional cloning of the wheat vernalization gene VRN1. Proc. Natl. Acad. Sci. U.S.A. 100, 6263–6268. doi: 10.1073/pnas.0937399100
Yu, J., and Buckler, E. S. (2006). Genetic association mapping and genome organization of maize. Curr. Opin. Biotechnol. 17, 155–160. doi: 10.1016/j.copbio.2006.02.003
Yu, J., Pressoir, G., Briggs, W. H., Vroh Bi, I., Yamasaki, M., Doebley, J. F., et al. (2006). A unified mixed-model method for association mapping that accounts for multiple levels of relatedness. Nat. Genet. 38, 203–208. doi: 10.1038/ng1702
Yu, L. X., Lorenz, A., Rutkoski, J., Singh, R. P., Bhavani, S., Huerta-Espino, J., et al. (2011). Association mapping and gene-gene interaction for stem rust resistance in CIMMYT spring wheat germplasm. Theor. Appl. Genet. 123, 1257–1268. doi: 10.1007/s00122-011-1664-y
Zhang, X., Chen, J., Yan, Y., Yan, X., Shi, C., Zhao, L., et al. (2018). Genome-wide association study of heading and flowering dates and construction of its prediction equation in Chinese common wheat. Theor. Appl. Genet. 131, 2271–2285. doi: 10.1007/s00122-018-3181-8
Zhang, Z., Ersoz, E., Lai, C.-Q., Todhunter, R. J., Tiwari, H. K., Gore, M. A., et al. (2010). Mixed linear model approach adapted for genome-wide association studies. Nat. Genet. 42, 355–360.
Zhao, C., Liu, B., Piao, S., Wang, X., Lobell, D. B., Huang, Y., et al. (2017). Temperature increase reduces global yields of major crops in four independent estimates. Proc. Natl. Acad. Sci. U.S.A. 114, 9326–9331. doi: 10.1073/pnas.1701762114
Zhu, C., Gore, M., Buckler, E. S., and Yu, J. (2008). Status and prospects of association mapping in plants. Plant Genome 1, 5–20.
Keywords: heading, maturity, wheat, adaptation, GWAS, multi-environments
Citation: Bhati PK, Juliana P, Singh RP, Joshi AK, Vishwakarma MK, Poland J, Govindan V, Shrestha S, Crespo-Herrera L, Mondal S, Huerta-Espino J and Kumar U (2022) Dissecting the Genetic Architecture of Phenology Affecting Adaptation of Spring Bread Wheat Genotypes to the Major Wheat-Producing Zones in India. Front. Plant Sci. 13:920682. doi: 10.3389/fpls.2022.920682
Received: 14 April 2022; Accepted: 07 June 2022;
Published: 06 July 2022.
Edited by:
Pierre Sourdille, INRAE Clermont-Auvergne-Rhône-Alpes, FranceReviewed by:
Patricia Giraldo, Polytechnic University of Madrid, SpainNazgol Emrani, University of Kiel, Germany
Lancelot Lance Maphosa, NSW Government, Australia
Copyright © 2022 Bhati, Juliana, Singh, Joshi, Vishwakarma, Poland, Govindan, Shrestha, Crespo-Herrera, Mondal, Huerta-Espino and Kumar. This is an open-access article distributed under the terms of the Creative Commons Attribution License (CC BY). The use, distribution or reproduction in other forums is permitted, provided the original author(s) and the copyright owner(s) are credited and that the original publication in this journal is cited, in accordance with accepted academic practice. No use, distribution or reproduction is permitted which does not comply with these terms.
*Correspondence: Philomin Juliana, cC5qdWxpYW5hQGNnaWFyLm9yZw==; Uttam Kumar, dS5rdW1hckBjZ2lhci5vcmc=