 Natalia Gutiérrez
 Marie Pégard
 Christiane Balko3
 Ana M. Torres
- 1Área de Mejora y Biotecnología, Andalusian Institute of Agricultural and Fisheries Research and Training (IFAPA), Centro Alameda del Obispo, Córdoba, Spain
- 2INRAE P3F, 86600 Lusignan, France, INRA, Centre Nouvelle-Aquitaine-Poitiers, Lusignan, France
- 3Julius Kühn-Institut (JKI), Federal Research Centre for Cultivated Plants, Institute for Resistance Research and Stress Tolerance, Sanitz, Germany
Faba bean (Vicia faba L.) is an important high protein legume adapted to diverse climatic conditions with multiple benefits for the overall sustainability of the cropping systems. Plant-based protein demand is being expanded and faba bean is a good candidate to cover this need. However, the crop is very sensitive to abiotic stresses, especially drought, which severely affects faba bean yield and development worldwide. Therefore, identifying genes associated with drought stress tolerance is a major challenge in faba bean breeding. Although the faba bean response to drought stress has been widely studied, the molecular approaches to improve drought tolerance in this crop are still limited. Here we built on recent genomic advances such as the development of the first high-density SNP genotyping array, to conduct a genome-wide association study (GWAS) using thousands of genetic polymorphisms throughout the entire faba bean genome. A worldwide collection of 100 faba bean accessions was grown under control and drought conditions and 10 morphological, phenological and physiological traits were evaluated to identify single nucleotide polymorphism (SNP) markers associated with drought tolerance. We identified 29 SNP markers significantly correlated with these traits under drought stress conditions. The flanking sequences were blasted to the Medicago truncatula reference genomes in order to annotate potential candidate genes underlying the causal variants. Three of the SNPs for chlorophyll content after the stress, correspond to uncharacterized proteins indicating the presence of novel genes associated with drought tolerance in faba bean. The significance of stress-inducible signal transducers provides valuable information on the possible mechanisms underlying the faba bean response to drought stress, thus providing a foundation for future marker-assisted breeding in the crop.
Introduction
Grain legumes are among the most important sources of high-protein for food and feed worldwide and represent key crops for sustainable, low-input, and diverse farming systems. In crop rotations, legumes enhance soil fertility through biological nitrogen fixation and break disease cycles, thus reducing the input of chemicals in agriculture (Nemecek et al., 2008). With one of the highest protein contents and a balanced amino acid profile, faba bean (V. faba L.) is the sixth global temperate legume in production (5.7 Million tonnes in 2.7 Mhas), after, chickpea, pea and lentil, with the average yield largely surpassing all of these crops (FAOSTAT, 2020). Faba bean can adapt to a variety of climatic and soil conditions, providing an advantage over other legume crops. Despite these benefits, faba beans still have a limited use in modern agriculture, mainly due to yield instability caused by biotic and abiotic (mainly drought) stresses. In the Mediterranean region, grain legumes are typically grown in rainfed agricultural systems and therefore yield is often variable or low due to the terminal droughts that characterise these areas (Amede et al., 2003; Khan et al., 2007). As a result of climate change, droughts are predicted to increase both in frequency and intensity, further hampering acceptance and wider use of faba beans by farmers in this area as well as in Northern Europe.
Its high sensitivity to drought stress from seedling to maturity (Khan et al., 2007; Khan et al., 2010) prevents faba bean from expressing its full performance potential. A meta-analysis synthesizing the results of field studies and drought experiments across the globe along 34 years revealed a reduction of 40% in faba bean yield following a 65% decrease in water availability, the highest drought-induced yield reduction among the surveyed legume crops (Daryanto et al., 2015). Thus, identifying drought-tolerant faba bean genotypes and developing efficient molecular breeding approaches is crucial to mitigate the devastating impact of drought stress.
A wide genetic variation has been reported in faba bean accessions for various traits related to drought adaptation (Muktadir et al., 2020). In other legume crops, selection for drought resistance based on highly heritable secondary traits, together with physiological attributes such as accumulation of proline or soluble sugars, has proven highly successful (Lafitte et al., 2003; Richards, 2006; Stoddard et al., 2006; Annicchiarico and Iannucci, 2008; Alderfasi and Alghamdi, 2010; Ammar et al., 2015; Balko et al., 2023, submitted). Although the faba bean response to drought stress has been widely studied (Ricciardi et al., 2001; Ammar et al., 2015; Siddiqui et al., 2015), few molecular approaches have been taken to improve drought tolerance in this crop. Khazaei et al. (2014) first reported quantitative trait loci (QTLs) for stomatal characteristics located on chromosome II and exploited the synteny with the model legume species M. truncatula to identify candidate genes within these QTLs. Subsequently, Abid et al. (2015) identified six putative drought stress responsive genes in faba bean by suppression subtractive hybridization. More recently, Ali et al. (2016) published the first and so far only drought genome-wide association analysis (GWAS) focusing on a set of 189 German winter faba bean lines derived from 11 parental founders, by assessing a number of physiological aspects related with dehydration tolerance established in previous studies (Balko et al., 1995; Lafitte et al., 2003; Balko, 2005; Stoddard et al., 2006; Richards, 2006; Annicchiarico and Iannucci, 2008; Alderfasi and Alghamdi, 2010; Ammar et al., 2015; Balko et al., 2023, submitted). Using 175 single-nucleotide polymorphisms (SNPs) and 1147 amplified fragment length polymorphisms (AFLPs), several QTLs were detected but the relatively low number of markers used and the very low linkage disequilibrium (LD) detected, limited the success of this association analysis.
In general, traits that contribute to drought tolerance in plants are quantitative and involve multiple genes. Therefore, it is crucial to exploit new genomic resources for the improvement of this crop. Recent advances in next-generation sequencing (NGS) and high-throughput genotyping have allowed the development of new faba bean genomic tools and resources, including mining of SNPs from transcriptome data (Kaur et al., 2014; Ocaña et al., 2015; Webb et al., 2016) and the development of the first high-density SNP genotyping array (O’Sullivan et al., 2019). These resources allow us to conduct genome-wide association studies (GWAS) using thousands of genetic polymorphisms distributed throughout the entire genome. GWAS aims at identifying genetic markers that are strongly associated with QTLs by using the LD between the genetic marker and the causal mutation. Compared with linkage mapping, GWAS provides higher allelic diversity at the corresponding loci and exploits ancestral recombination events in a population, leading to a better association between the marker and the phenotype of a target trait (Zhu et al., 2008).
In recent years, GWAS studies have been conducted in many plant species to dissect complex quantitative traits related to drought tolerance (Hoyos-Villegas et al., 2017; Dossa et al., 2019; Dramadri et al., 2021; Ravelombola et al., 2021; Choudhary et al., 2022). As stated above, a single GWAS study on drought tolerance has been conducted so far in faba bean (Ali et al., 2016), whose results were limited by the low LD and number of markers. The objectives of the present study were: (1) to evaluate the drought tolerance index in faba bean of ten morphological, phenological and physiological traits, (2) to conduct GWAS to identify SNP markers associated with the drought tolerance indices; (3) to investigate the potential relationship between significant loci associated with the drought tolerance indices.
Materials and methods
Plant material
A panel of 100 faba bean accessions from different countries in Africa (8 accessions), North and South America (2), Asia (27) and Europe (39) were used in the study. The original country of the remaining 24 ICARDA accessions is unknown. Europe with 9 countries is the most represented geographical area in the panel, followed by Asia, Africa and America (7, 4 and 2 countries, respectively). Spain is the country accounting for the highest number of accessions (23). The panel includes genetic stocks, landraces and breeding lines aiming at gathering a wide range of genetic diversity from diverse geographical origins. The drought panel was made in collaboration with four public institutes: ICARDA, IFAPA, INIA and INRA, holding the following genebanks SYR002, ESP046, ESP004, FRA043, respectively. Prior to the genotyping analysis, all the Spanish lines had been selfed for at least four generations. The remaining accessions were purified for two generations by single seed descent (SSD) in insect-proof cages. A detailed description of the collection is provided in Supplementary Table 1.
Phenotypic data analysis
Phenotyping
The 100 faba bean panel was assayed in 2019 and 2020 at the Julius Kühn-Institut (JKI) in Groß Lüsewitz, Germany (54.0701 N 12.33874 E), in a slightly loamy sand soil with pH: 5,7 (Balko et al., 2023 submitted). Field management essentially followed normal local faba bean cropping practices. Plants were sown in a randomized block design with four replications under irrigated (control) and drought stress conditions created under rain-out shelters (two blocks in each shelter). The accessions were grown in single row plots of 1.2 m length with 14 plants each and a row-to-row distance of 0.5 m. Drip irrigation was scheduled in the range of 60 - 70% of field capacity of the soil, determined over winter after excessive rainfall (Balko et al., 2023, submitted). Water content in the soil was assessed by Time Domain Reflectometry (TDR) probes in about 40 cm depth. Drought stress was initiated when about 30% of the plots started flowering. Irrigation in the stress treatment was stopped and during occurring rainfall the shelters were moved over the respective plots.
Six morphological and phenological traits were recorded: maturity date (MAT), defined as the date when more than 90% of the pods have ripened; plant height in cm (PH); number of pods per plant (PP); number of seeds per plant (SP); hundred seed weight (HSW) in grams; and plot yield (PY) in kg. Moreover, four physiological traits were assessed in leaves: free proline content (PRO) (Bates et al., 1973); total content of soluble sugars (TSS) (Yemm and Willis, 1954); and chlorophyll content (SPAD1 and SPAD2). SPAD measurements were performed with a Chlorophyll Meter SPAD 502 plus (Konica Minolta) at the beginning of the stress treatment (SPAD1) and 4 weeks after the onset of stress (SPAD2). Leaf samples for determination of free proline and total content of soluble sugars were taken in the same time window and flash frozen in liquid nitrogen (Balko et al., 2023 submitted). The measurements of these traits were performed by selecting ten individual plants in the middle of the row for each accession.
Adjustment of phenotypic data
All phenotypic traits were independently adjusted for field micro-enviromental heterogeneity using the ‘breedR’ package (Muñoz and Sanchez, 2022). Phenotypes were combined and adjusted by years. In the model, the genomic estimated breeding values (GEBV) for each trait were determined with the genomic best linear unbiased prediction based model (GBLUP) (Whittaker et al., 2000; Meuwissen et al., 2001; Cantet et al., 2005). Within trials, a random effect was fitted thanks to the use of the tensor product of two bi-splines bases with a covariance structure for the random knot effects (RKE) to account for spatial variability along the row (r) and the column (c) of the field design (Cantet et al., 2005; Cappa and Cantet, 2007; Cappa et al., 2015) to capture the spatial heterogeneity at the plot level. The following model was used:
where y is the raw phenotype, µ the global mean, u the vector of random additive effects following N(0,Gσ2a) with σ2a the additive variance and G the relationship matrix, s the vector of random spatial effects containing the parameters of the B-splines tensor product following N(0,Sσ2s) with σ2s the variance of the RKE for row and column and S the covariance structure in two dimension, ϵ the vector of residual effects following N(0,I σ2e) with σ2e the residual variance. The design matrix Z, and W are indicator matrices relating the plot to the random effects. The method used to obtain the relationship matrix is detailed in the following section. Bi-splines were anchored at a given number of knots for rows and columns, a higher number of knots smooths out the surfaces. ‘breedR’ optimized the knot numbers by an automated grid search based on the Akaike Information Criterion (AIC). The micro-environmental individual effect was subtracted from the observed phenotype to obtain a spatially adjusted individual phenotype. A genotypic mean of the spatially adjusted phenotypes was calculated for each trait and used for the GWAS. All measurements were tested for deviations from normality by a randomized Q-Q plot.
Genomic data analysis
Genotyping
Young leaves from individual plants were collected, ground in liquid nitrogen and total genomic DNA was isolated using the DNeasy Plant Mini Kit (QIAGEN Ltd, UK). DNA quality was checked by agarose gel electrophoresis and concentration was estimated using the QubitTM dsDNA BR Assay Kit (Invitrogen by ThermoFisher Scientific, UK) following the manufacturer’s instructions.
For genotyping we used the Vfaba_v2 Axiom SNP array with 50K SNP (O’Sullivan et al., 2019; Khazaei et al., 2021). Seven of the 100 accessions showing poor DNA quality, as well as SNP markers with a call rate below 97% and a minor allele frequency (MAF) below 95% were excluded from the analysis. After quality control, a matrix consisting of 21,915 SNPs and 93 accessions with 0.89% missing data was kept for further GWAS analysis. The imputation of the missing data was performed by mean allelic frequency. To obtain the genetic position of the significant SNPs we used the information and protocols provided by Skovbjerg et al., 2022. Thus, 17,403 out of the 21,915 SNPs markers could be assigned to genomic positions. The extremely large size of chromosome 1 (> 3 Gbp) generated problems with various softwares and therefore the chromosome was split at the centromere to form Chr1S and Chr1L. In addition, to verify and complete the faba bean chromosomal positions, the SNPs flanking sequences were aligned to the V. faba reference genomee1 (Jayakodi et al., 2022) using the Geneious v.7.1.9genomee2.
Genomic relationship matrix
The genomic relationship matrix (GRM) was constructed based on VanRaden, 2008, where the matrix Z was calculated as (M - P). M is a matrix of minor allele counts (0, 1, 2 for the reference, heterozygote and alternative, respectively) with m column (one for each marker) and n rows (one for each accession). P is a matrix which contains the allele frequency, expressed as a difference from 0.5 and multiplied by 2, such that column i of P is 2(pi-0.5). Subtraction of P from M gives Z, which sets mean values of the allele effects to 0. Genomic relationship matrix G was obtained for the first method proposed by VanRaden:
Genetic structure
To estimate the number of distinct genetic clusters (K) and admixture existing in the faba bean panel a bayesian based clustering analysis was performed using FastSTRUCTURE v 1.0 (Raj et al., 2014). FastSTRUCTURE was run on default settings with 10-fold cross validation on the 100 accessions testing for subpopulations (K) values ranging from 1 to 10. The most likely K number was chosen by plotting the marginal likelihood of each model as a function of K and determining when the graph begins to plateau. Accessions with membership probabilities ≥ 0.50 were considered to belong to the same group. The choice of K was further supported by applying a discriminant analysis of principal components (DAPC) based procedure for clustering using the ‘fviz_pca’ function in the ‘factoextra’ R-package (Kassambara and Mundt, 2020).
Correlation and broad sense heritability estimates
To understand the extent of the relationship among the traits, the correlation matrix for control and stress values was made by Pearson correlation analysis. Descriptive analysis and correlations were conducted in the R statistical software. The broad sense heritability (h2) for the traits was estimated using the following formula:
where Vg is the genetic variance component, Vsp is the spatial variance component, Vres is the residual variance component. The genotypic mean value for each accession for each trait under control and stress conditions were represented by mean PCA biplot. PCA was performed in the R software package ‘prcomp’ and visualized with the ‘fviz_pca’ function.
Genome-wide association analysis
Association analyses were performed in 93 faba bean accessions with 21,915 high-quality SNPs. A Multi Locus Mixed Model method (MLMM) (Segura et al., 2012) was implemented in the R package ‘mlmm.gwas’ (Bonnafous et al., 2019) to evaluate the trait-SNP associations. The MLMM, is an iterative approach that improves power over single locus methods by incorporating multiple markers in the model simultaneously as covariates, to reduce the false-positive rates and to increase the detection power. In each step (maximum 10 steps), the variance components are estimated and then used to calculate p-values for the association of each SNP with the trait of interest. MLMM utilizes eBIC (extended Bayesian Information Criterion) to determine the number of steps and therefore the number of QTLs with a lambda value of 0.77. The Bonferroni threshold was used to label an association as significant. Significant markers were visualized with a Manhattan plot and important p-value distributions (expected vs. observed p-values on a -log10 scale) were shown with a quantile–quantile (Q-Q) plot.
Potential candidate gene
The sequences flanking associated SNPs were blasted against the NCBI M. truncatula reference genome3 to annotate potential candidate genes underlying the causal variants. Gene locations were determined using the Genome Data Viewer (GDV)4. In addition, the sequences flanking associated SNPs were blasted against the faba bean reference genome (Jayakodi et al., 2022) to verify chromosomal positions and locate those candidates that did not show significant hits in Medicago. For some of these, the use of the corresponding faba bean contig allowed to infer the Medicago ortholog and include the corresponding gene annotation.
Results
Phenotypic variation and heritability
The ten morphological, phenological and physiological traits listed above were used to examine the possible existence of significant phenotypic variances among the 93 faba bean accessions, both in control and drought conditions. Descriptive statistics revealed large phenotypic variations for all the traits studied (Table 1). For MAT, PH, PP, SP, HSW, PY and SPAD2 the mean values in the drought stress treatment were lower than in the control condition. In contrast, PRO, TSS highly increased under drought stress while in SPAD1 the mean increase was smaller.
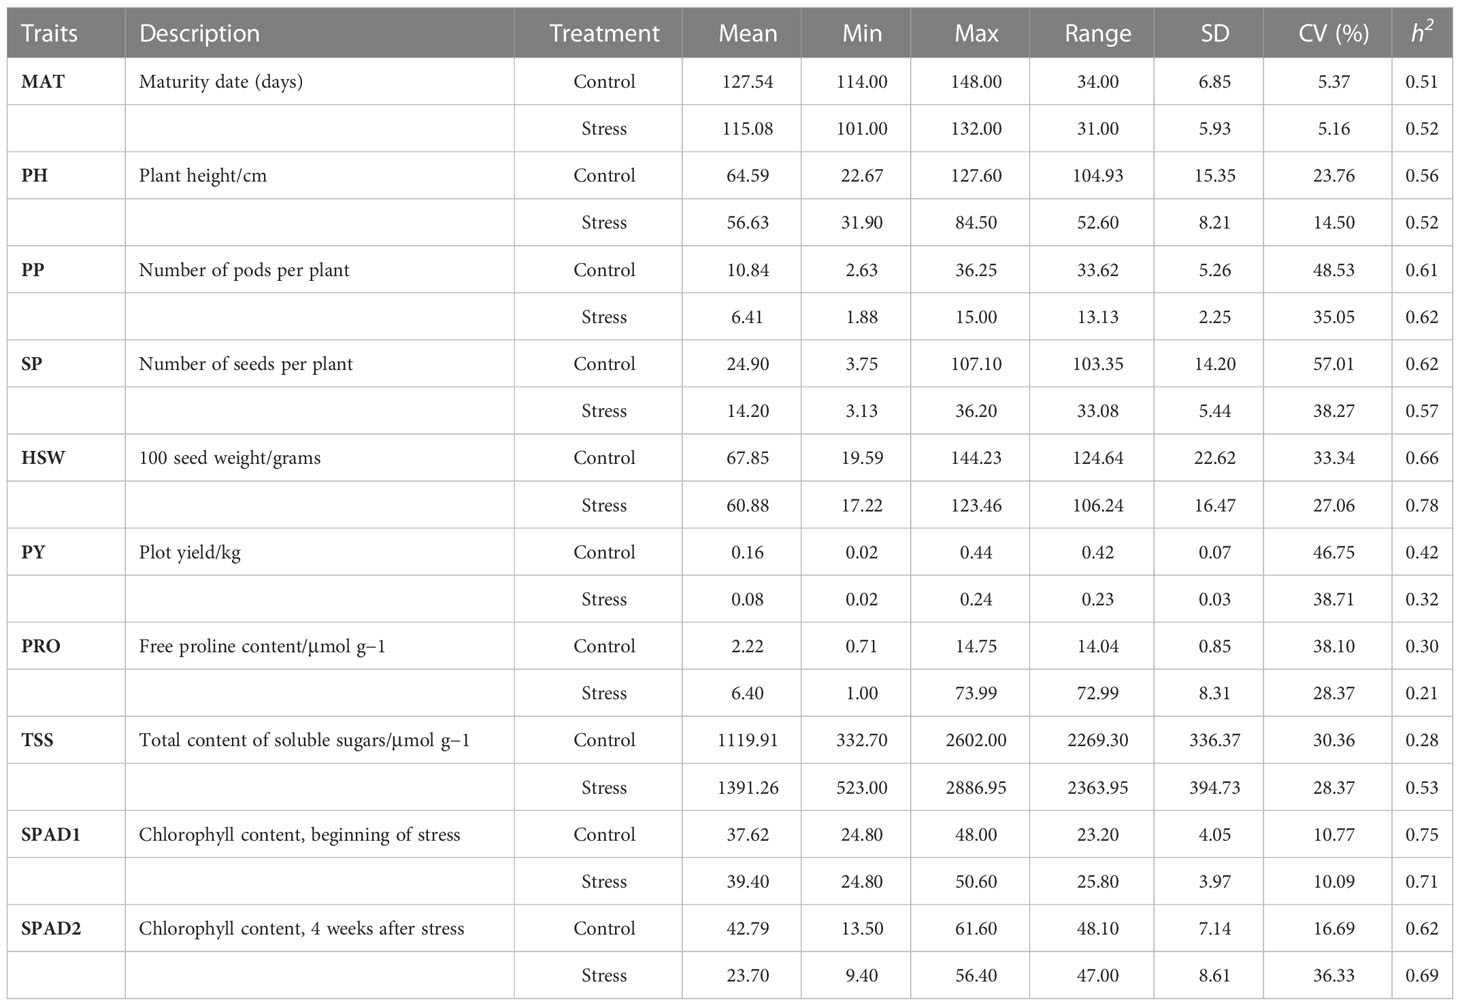
Table 1 Statistical analysis of 10 morphological, phenological and physiological traits in controlled and drought stress conditions.
The frequency distributions of all 10 traits fit the normal distributions, indicating their quantitative nature (Figure 1). The coefficient of variation (CV%) for most of the traits was comparable for control and drought stress. CV ranged from 5.37 (MAT) to 57.01 (SP) under control condition and from 5.16 (MAT) to 38.71 (PY) under drought stress. Narrow-sense heritability (h2) estimates ranged from 0.28 (TSS) to 0.75 (SPAD1) in the control and from 0.21 (PRO) to 0.78 (HSW) in drought stress. Heritabilities calculated for each trait were moderate to high for most of the traits, varying from 0.51 to 0.75 in control conditions and from 0.52 to 0.78 in drought stress. Slightly lower values were recorded for PY and PRO in both conditions. Except for TSS and in both treatments, similar estimates for heritability were detected. Under drought stress a lower coefficient of variation was observed in most traits with exception of (Table 1).
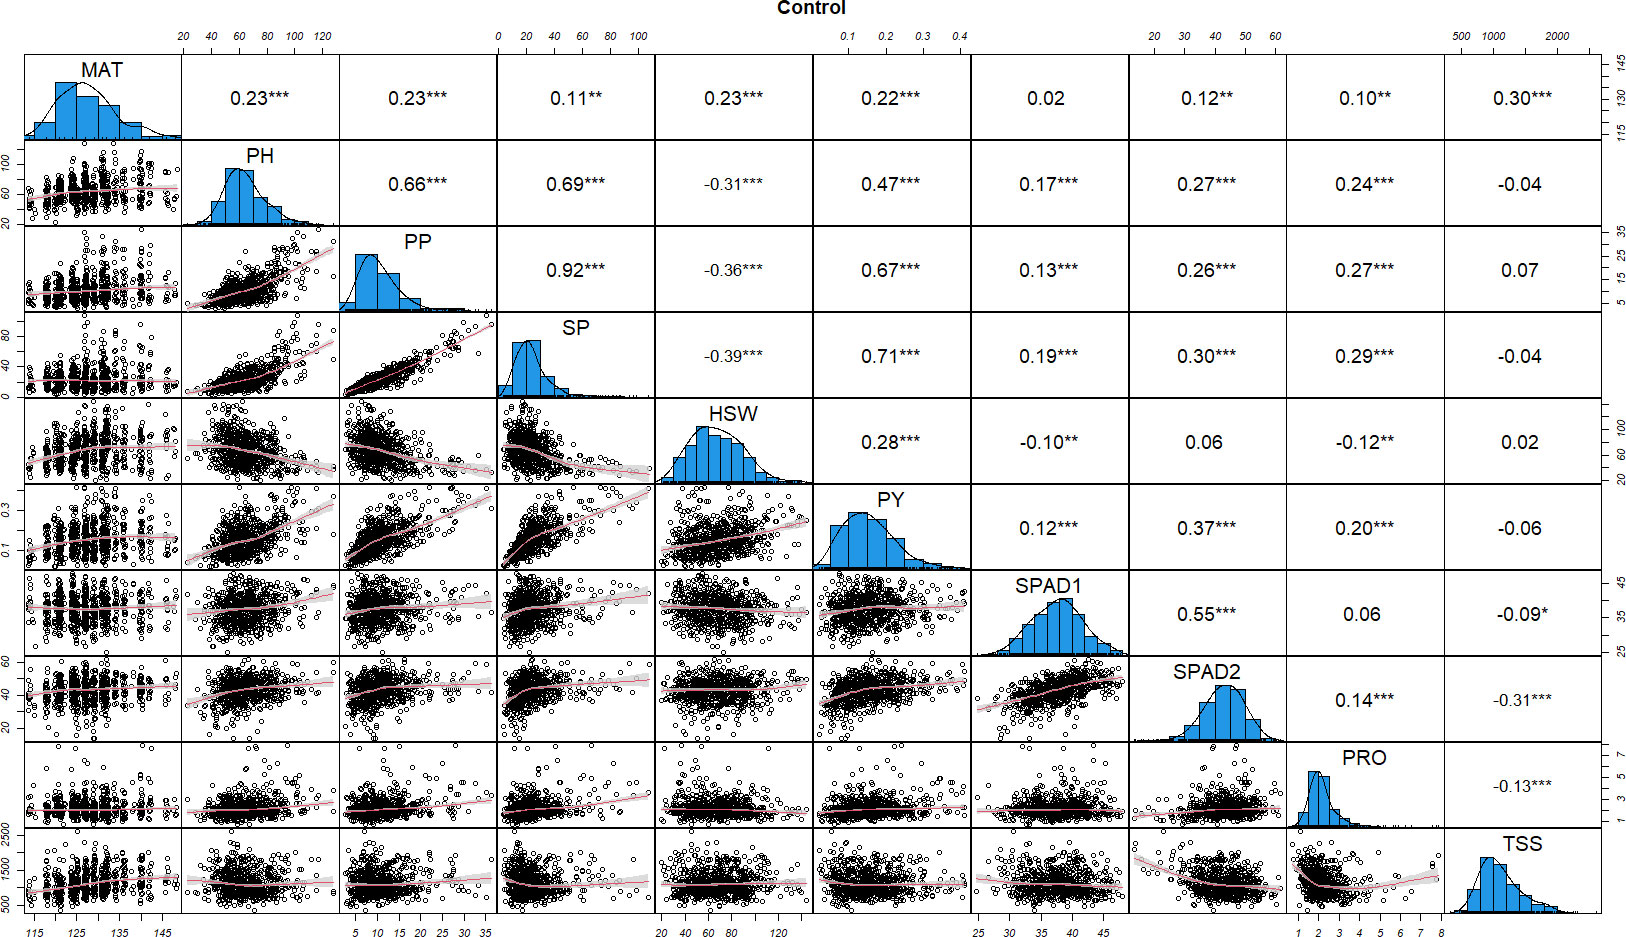
Figure 1 Distributions of phenotypic frequency and correlations between 10 morphological, phenological and physiological traits in control conditions. The frequency distribution of each trait is shown on a central diagonal in the form of a histogram. Scatter plots of correlations between every pair of traits are shown in the areas below the diagonal, and numerical Pearson’s correlation coefficients (r), between every pair of traits are shown in the areas above the diagonal. The red line in the scatter plots represents the slope of the correlations. The x- and y- axes are the values of the measurements (PH in cm, HSW in grams and PY in kg). *, ** and *** indicate significance at P < 0.05, P < 0.01 and P < 0.001, respectively.
Correlation of traits
To understand the relationship among the traits, we performed a correlation matrix for control and stress values using the Pearson correlation method. Under control conditions (Figure 1), significant positive correlations were observed among most of the traits, with correlation coefficient (r) values ranging from 0.10 to 0.92. By contrast, SPAD1 and PRO were negatively correlated with TSS (-0.09, -0.13, respectively), HSW was negatively correlated with SPAD1 and PRO (-0.10, -0.12, respectively) and PH, PP and SP with HSW (-0.31, -0.36 and -0.39, respectively). TSS revealed a close to neutral correlation with most of the physiological, morphological and phenological traits except MAT (0.30) and SPAD2 (-0.31), where highly significant positive and negative associations, respectively, were observed (Figure 1).
Similarly, under drought stress conditions most of the phenological and yield related traits (MAT, PH, PP, SP, HSW and PY), were strongly associated, showing positive correlations with Pearson’s correlation coefficients ranging between 0.12 and 0.85 (Figure 2). PP and SP showed a significant negative correlation with HSW (-0.32 and -0.34, respectively). SPAD1 maintained a neutral or significantly negative correlation with all the traits while SPAD2 was positively correlated with all of the characters except with HSW (-0.19). SPAD1, PRO and TSS showed negative or close to neutral correlation among them and with the rest of yield related traits. The only exceptions were the significant positive correlation of PRO with PH, PP, SPAD2 and TSS (0.14, 0.10, 0.13, 0.14), and the positive association of TSS with MAT (0.22).
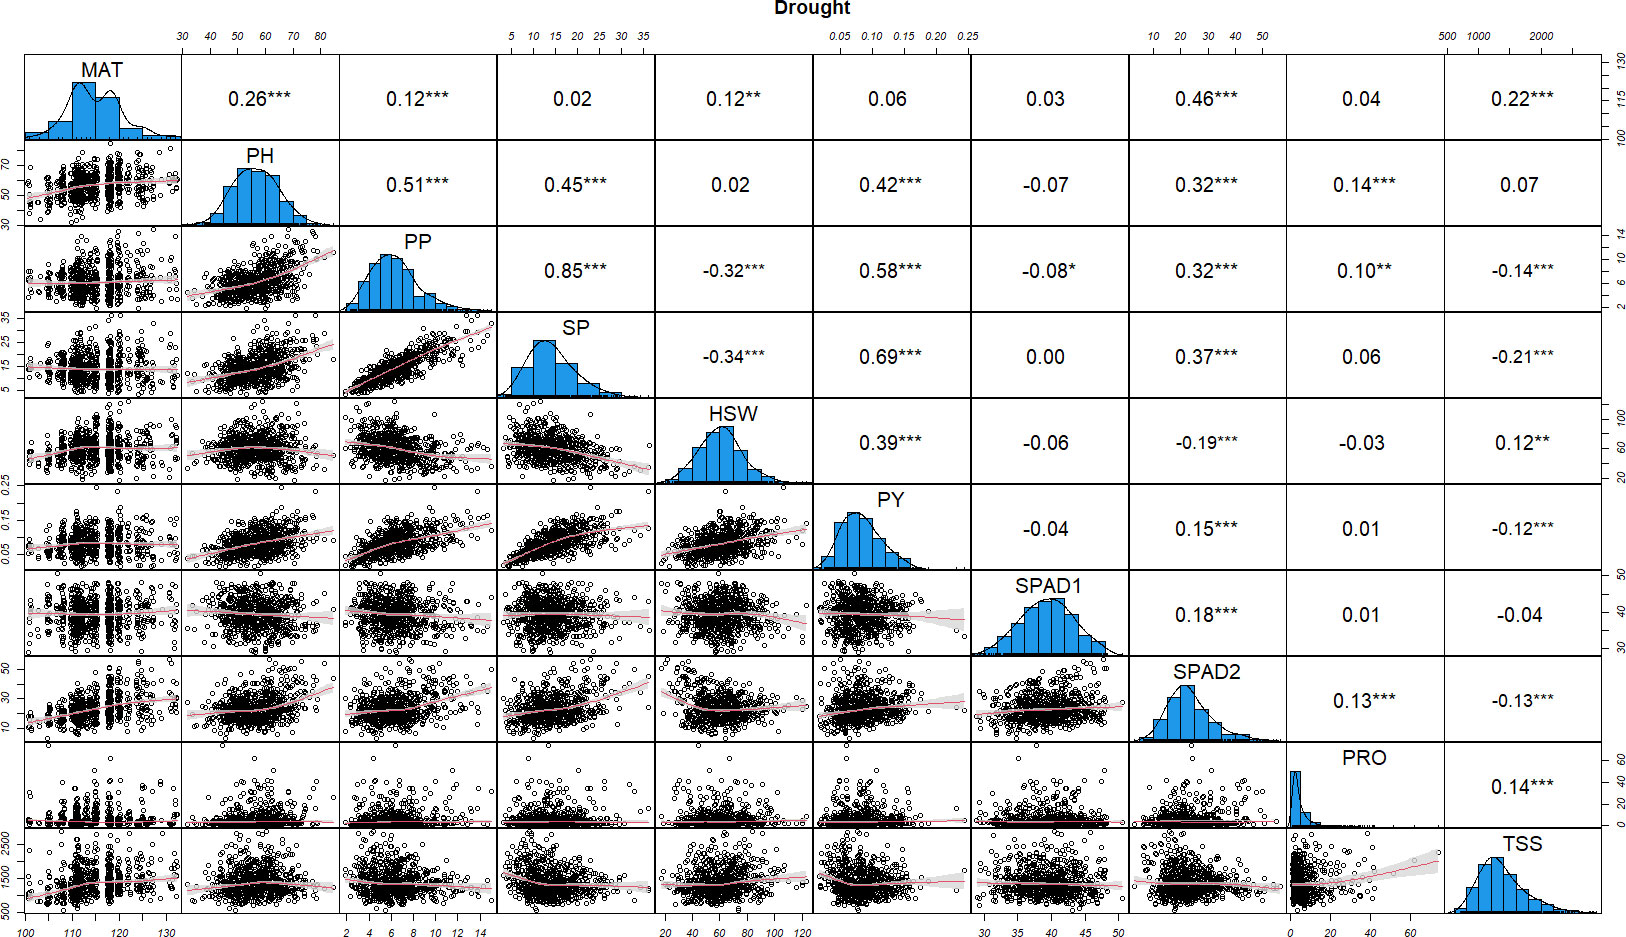
Figure 2 Distributions of phenotypic frequency and correlations between 10 morphological, phenological and physiological traits in drought stress conditions. The frequency distribution of each trait is shown on a central diagonal in the form of a histogram. Scatter plots of correlations between every pair of traits are shown in the areas below the diagonal, and numerical Pearson’s correlation coefficients (r), between every pair of traits are shown in the areas above the diagonal. The red line in the scatter plots represents the slope of the correlations. The x- and y- axes are the values of the measurements (PH in cm, HSW in grams and PY in kg). *, ** and *** indicate significance at P < 0.05, P < 0.01 and P < 0.001, respectively.
Correlations in control and drought treatments provide useful information on the effect of the physiological parameters (SPAD, PRO and TSS) on the yield related traits studied. In both conditions, SPAD2 (the main indicator for drought stress induced leaf senescence), was significantly correlated with PP, SP and PY, with higher correlations observed under drought stress with PP and SP (0.32 and 0.37, respectively). Lower, but still significant correlations were also detected between PP, SP and PY with PRO in control conditions, while under drought stress only a slight correlation between PP and PRO (0.10) was detected. TSS was not significantly correlated with any of the yield related traits in control conditions whereas in stress conditions, highly significant negative correlations with PP, SP and PY (-0.14, -0.21 and -0.12) were observed.
Genetic structure
To examine divergence of the faba bean collection during evolution, a Bayesian based clustering analysis was performed using FastSTRUCTURE and the 21,915 selected SNPs. According to the K genetic clusters, the most likely number of inferred members was three with K ≥ 0.50. Besides, we performed PCA using the first two principal components, PC1 (variance explained, 5.3%) and PC2 (variance explained, 3.3%), which are divided into three groups with slight degrees of introgression between them during cultivation (Figure 3). Clade P1 comprised only oriental accessions (10) from China, Nepal and Japan. Clade P2 was the most numerous and consisted of 73 accessions with a wide range of geographic origins spread over four continents: Europe (25), Africa (7), Asia (18) and South America (1), while the remaining 22 accessions are of unknown origin. The third clade (P3) mainly consisted of European accessions (7) together with one from Canada and another from Egypt. Accession EUC_VF_192 was admixed (Supplementary Table 1).
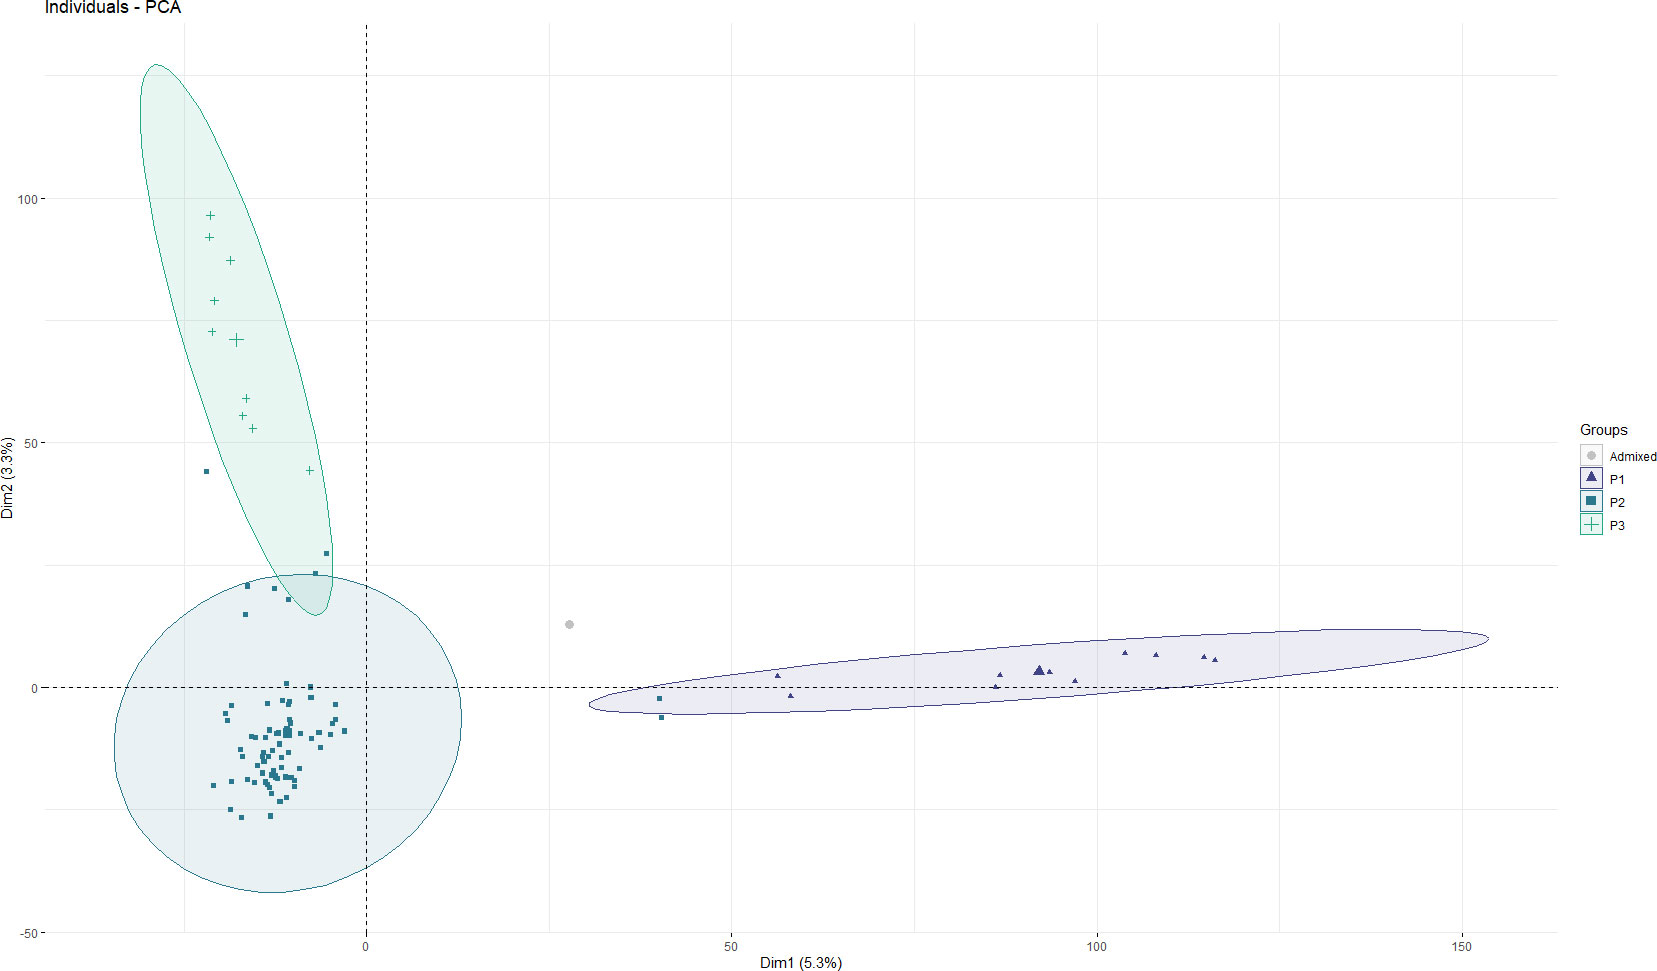
Figure 3 Principal component analysis (PCA) of the 93 faba bean accessions. Each dot represents an accession. The horizontal and vertical coordinates represent the first two principal components of analysis (PC1 and PC2), accounting for 5.3% and 3.3% of the total variation, respectively.
Principal component analysis biplot
The contribution of the various traits to the overall variation in the dataset was investigated by PCA (Figure 4). The first three principal components (PCs) with eigenvalues > 1 accounted for 74.4% of the total variation (Supplementary Figure 1). Since the first two PCs showed the highest percentage of variance (62.8%), the PCA biplot was constructed only with PC1 and PC2, showing a clear separation of control vs. drought stress data points along the main axis (Figure 4). PC1 explained 49.1% of the total variability among traits or individuals and was mostly associated with SP, PP, PH, PY, SPAD2 and MAT (Figure 4). PC2 accounted for an additional 13.7% of the total variability among traits and appeared to be related with HSW PRO and TSS (Figure 3). PC3, PC4 and PC5 explained only 11.66%, 9.5% and 7.6%, respectively, of the phenotypic variation (Supplementary Figure 1). PC2 was highly associated with HSW, PRO and TSS. PC3 was strongly associated with SPAD1 and PC with PRO (Supplementary Figure 2). The biplot vectors showed that the morphological, phenological and yield-related traits (PP, SP, PH, PY, MAT) show a strong positive correlation between each other and with the physiological trait SPAD2, while HSW has a less strong correlation and instead shows a strong negative correlation with PRO and SPAD1 (Figure 4).
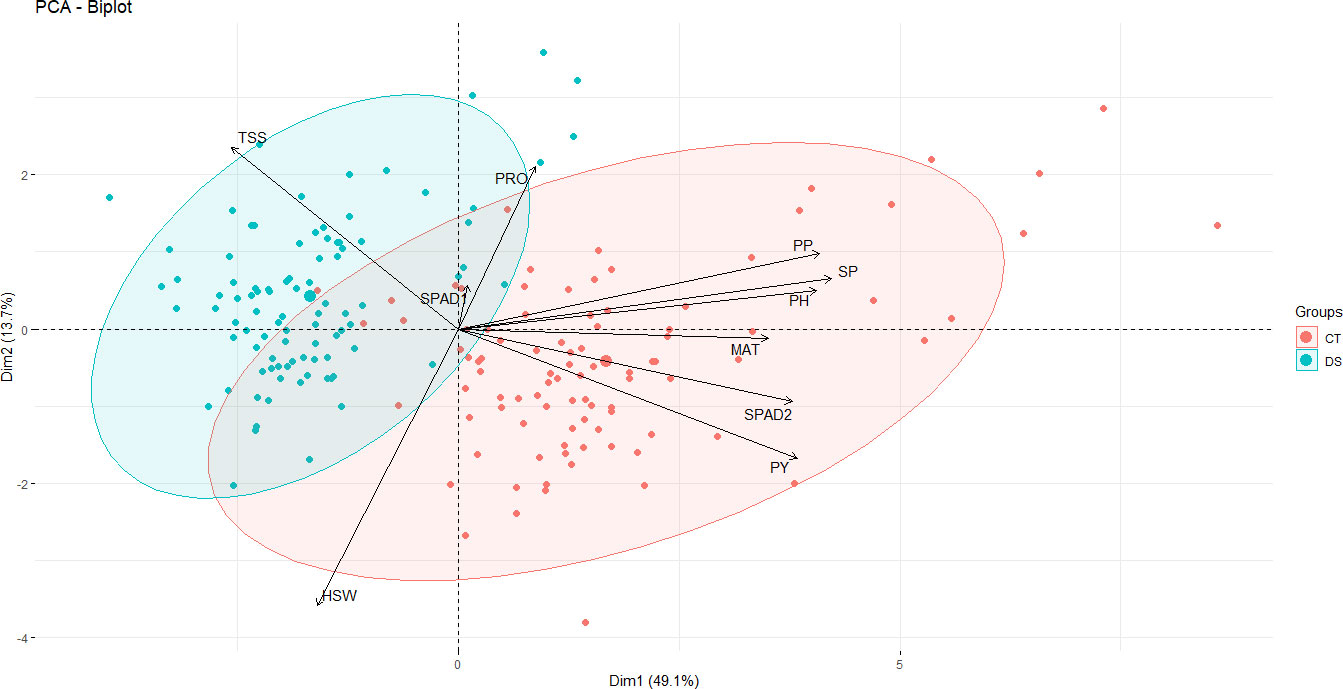
Figure 4 PCA biplot showing the clustering of 93 faba bean accessions grown under control and drought stress conditions based on the variance in 10 morpho-physiological and biochemical traits. The traits are maturity date (MAT), plant height (PH), number of pods per plant (PP), number of seeds per plant (SP), 100 seed weight (HSW) and plot yield (PY), free proline content (PRO), total content of soluble sugars (TSS) chlorophyll content (SPAD1 and SPAD2). The first two components explained 49.3% and 18% of the variances, respectively. The magnitude of the vectors (arrows) shows the strength of their contribution to each PC. Vectors pointing in similar directions indicate positively correlated variables, vectors pointing in opposite directions indicate negatively correlated variables, and vectors at proximately right angles indicate low or no correlation. Colored concentration ellipses (size determined by a 0.95-probability level) show the observations grouped by treatment (control or drought conditions). Individuals on the same side as a given variable should be interpreted as having a high contribution on it.
Genome-wide association mapping
To investigate genetic variants governing drought tolerance in faba bean, 10 morphological, phenological and physiological traits (MAT, PH, PP, SP, HSW, PY, SPAD1, SPAD2, PRO and TSS) were subjected to GWAS analysis using 21,915 SNPs. A total of 74 marker trait associations (MTAs) were identified, revealing candidate loci for each trait across different water regimes (Tables 2 and 3). The manhattan and their corresponding quantile-quantile (Q-Q) plots run with the MLMM method are shown in Figures 5 and 6. Q-Q plots revealed that the -log10 (p-values) for the different traits evaluated under each water regime condition conformed to normal distribution.
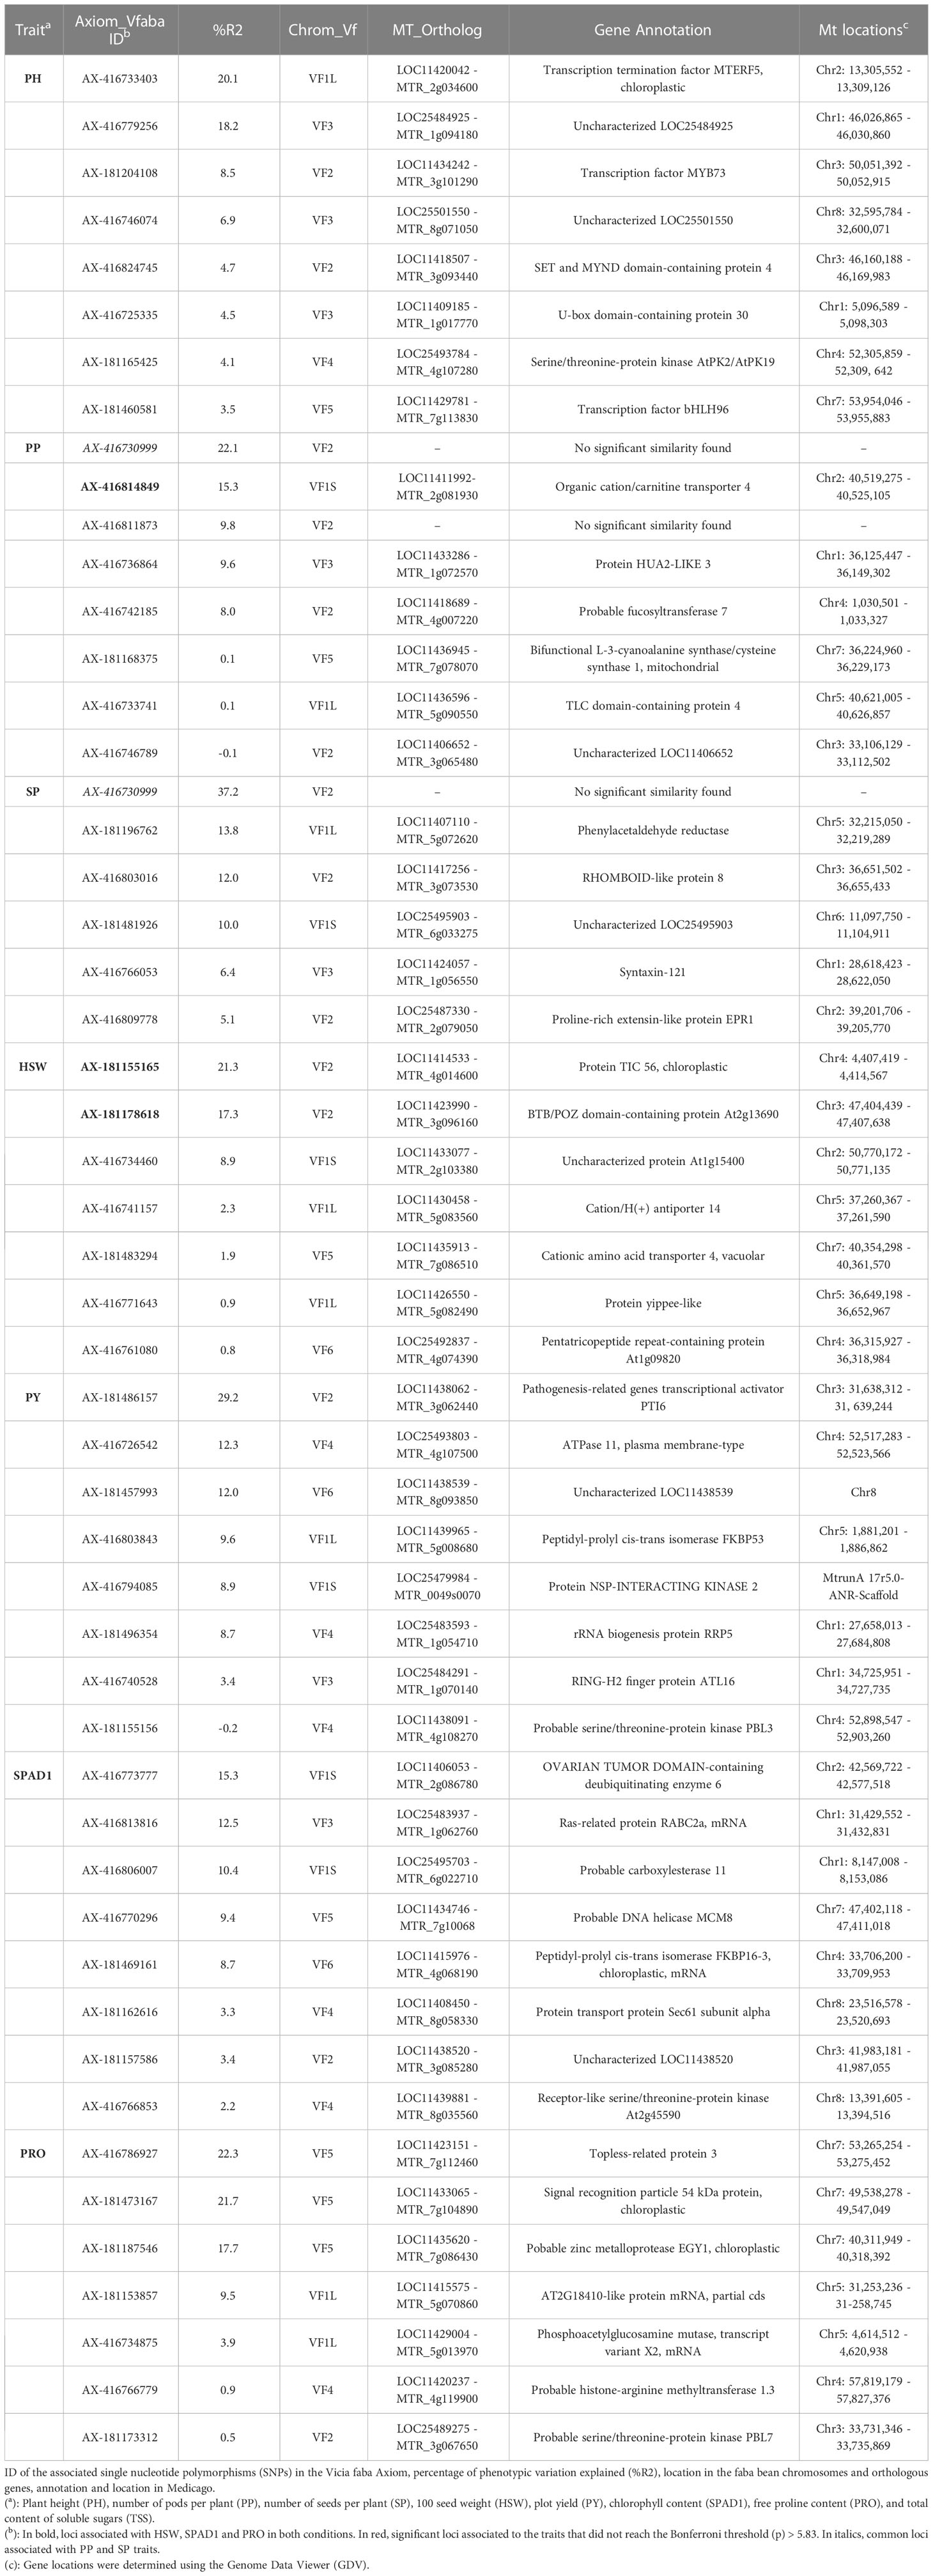
Table 2 List of candidate genes related to control assay traits.
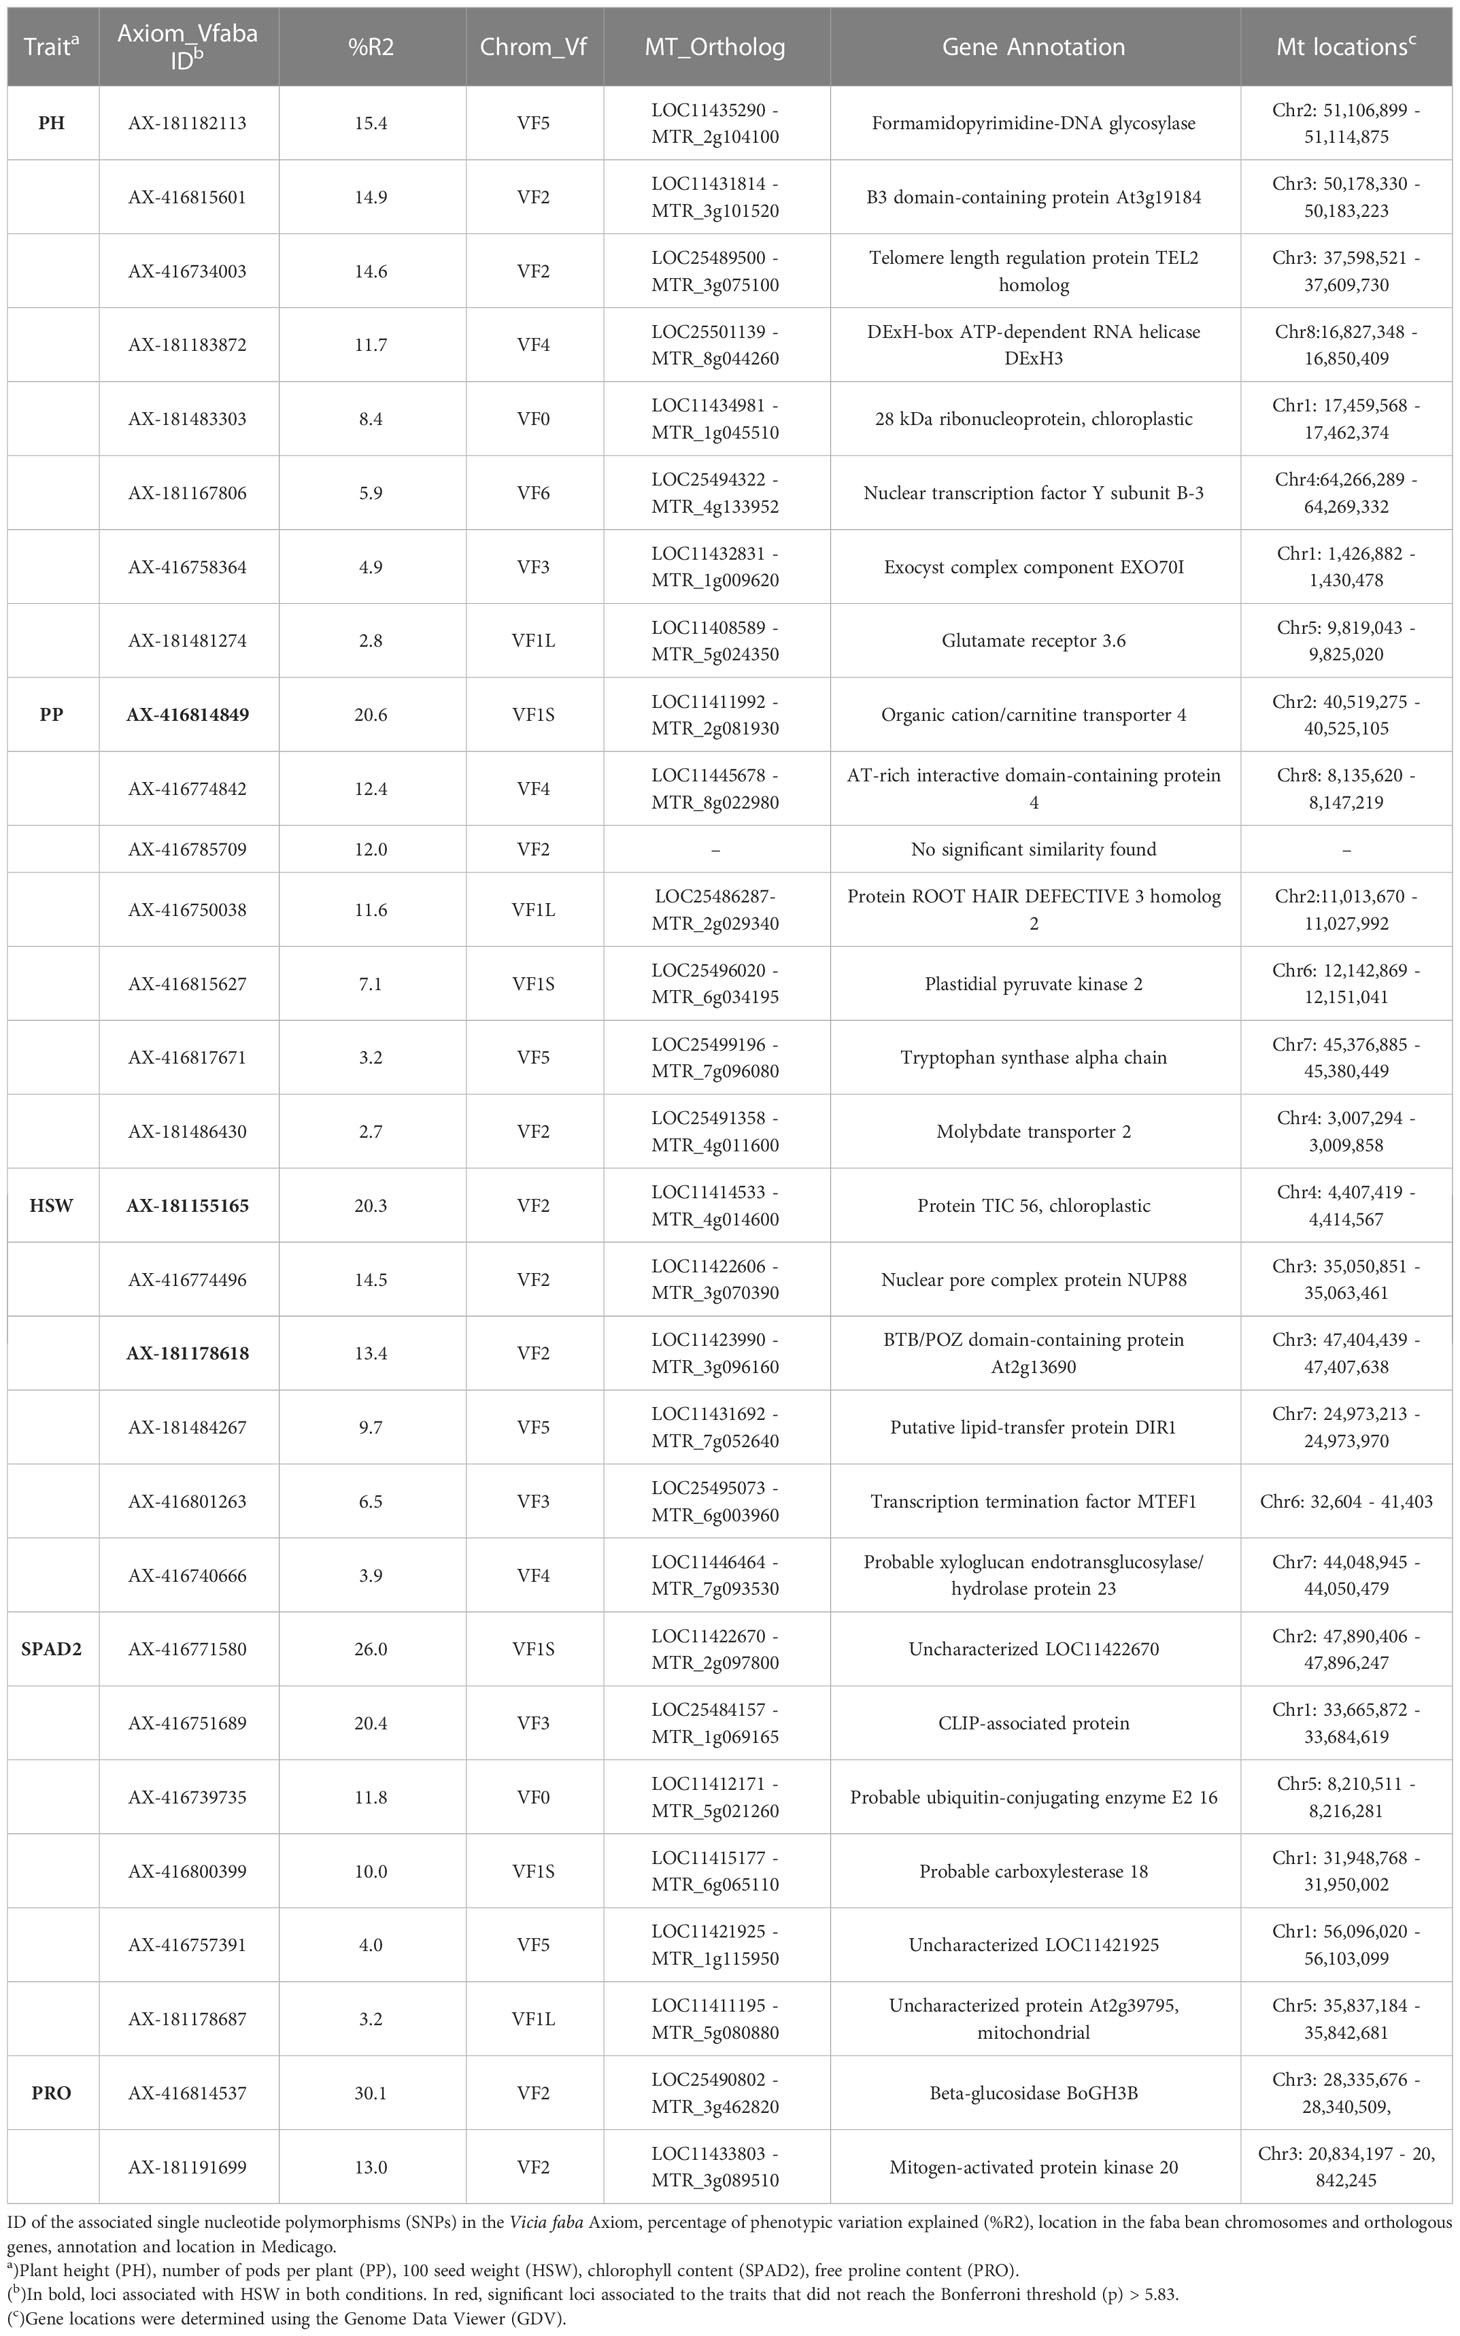
Table 3 List of candidate genes related to drought resistance traits.
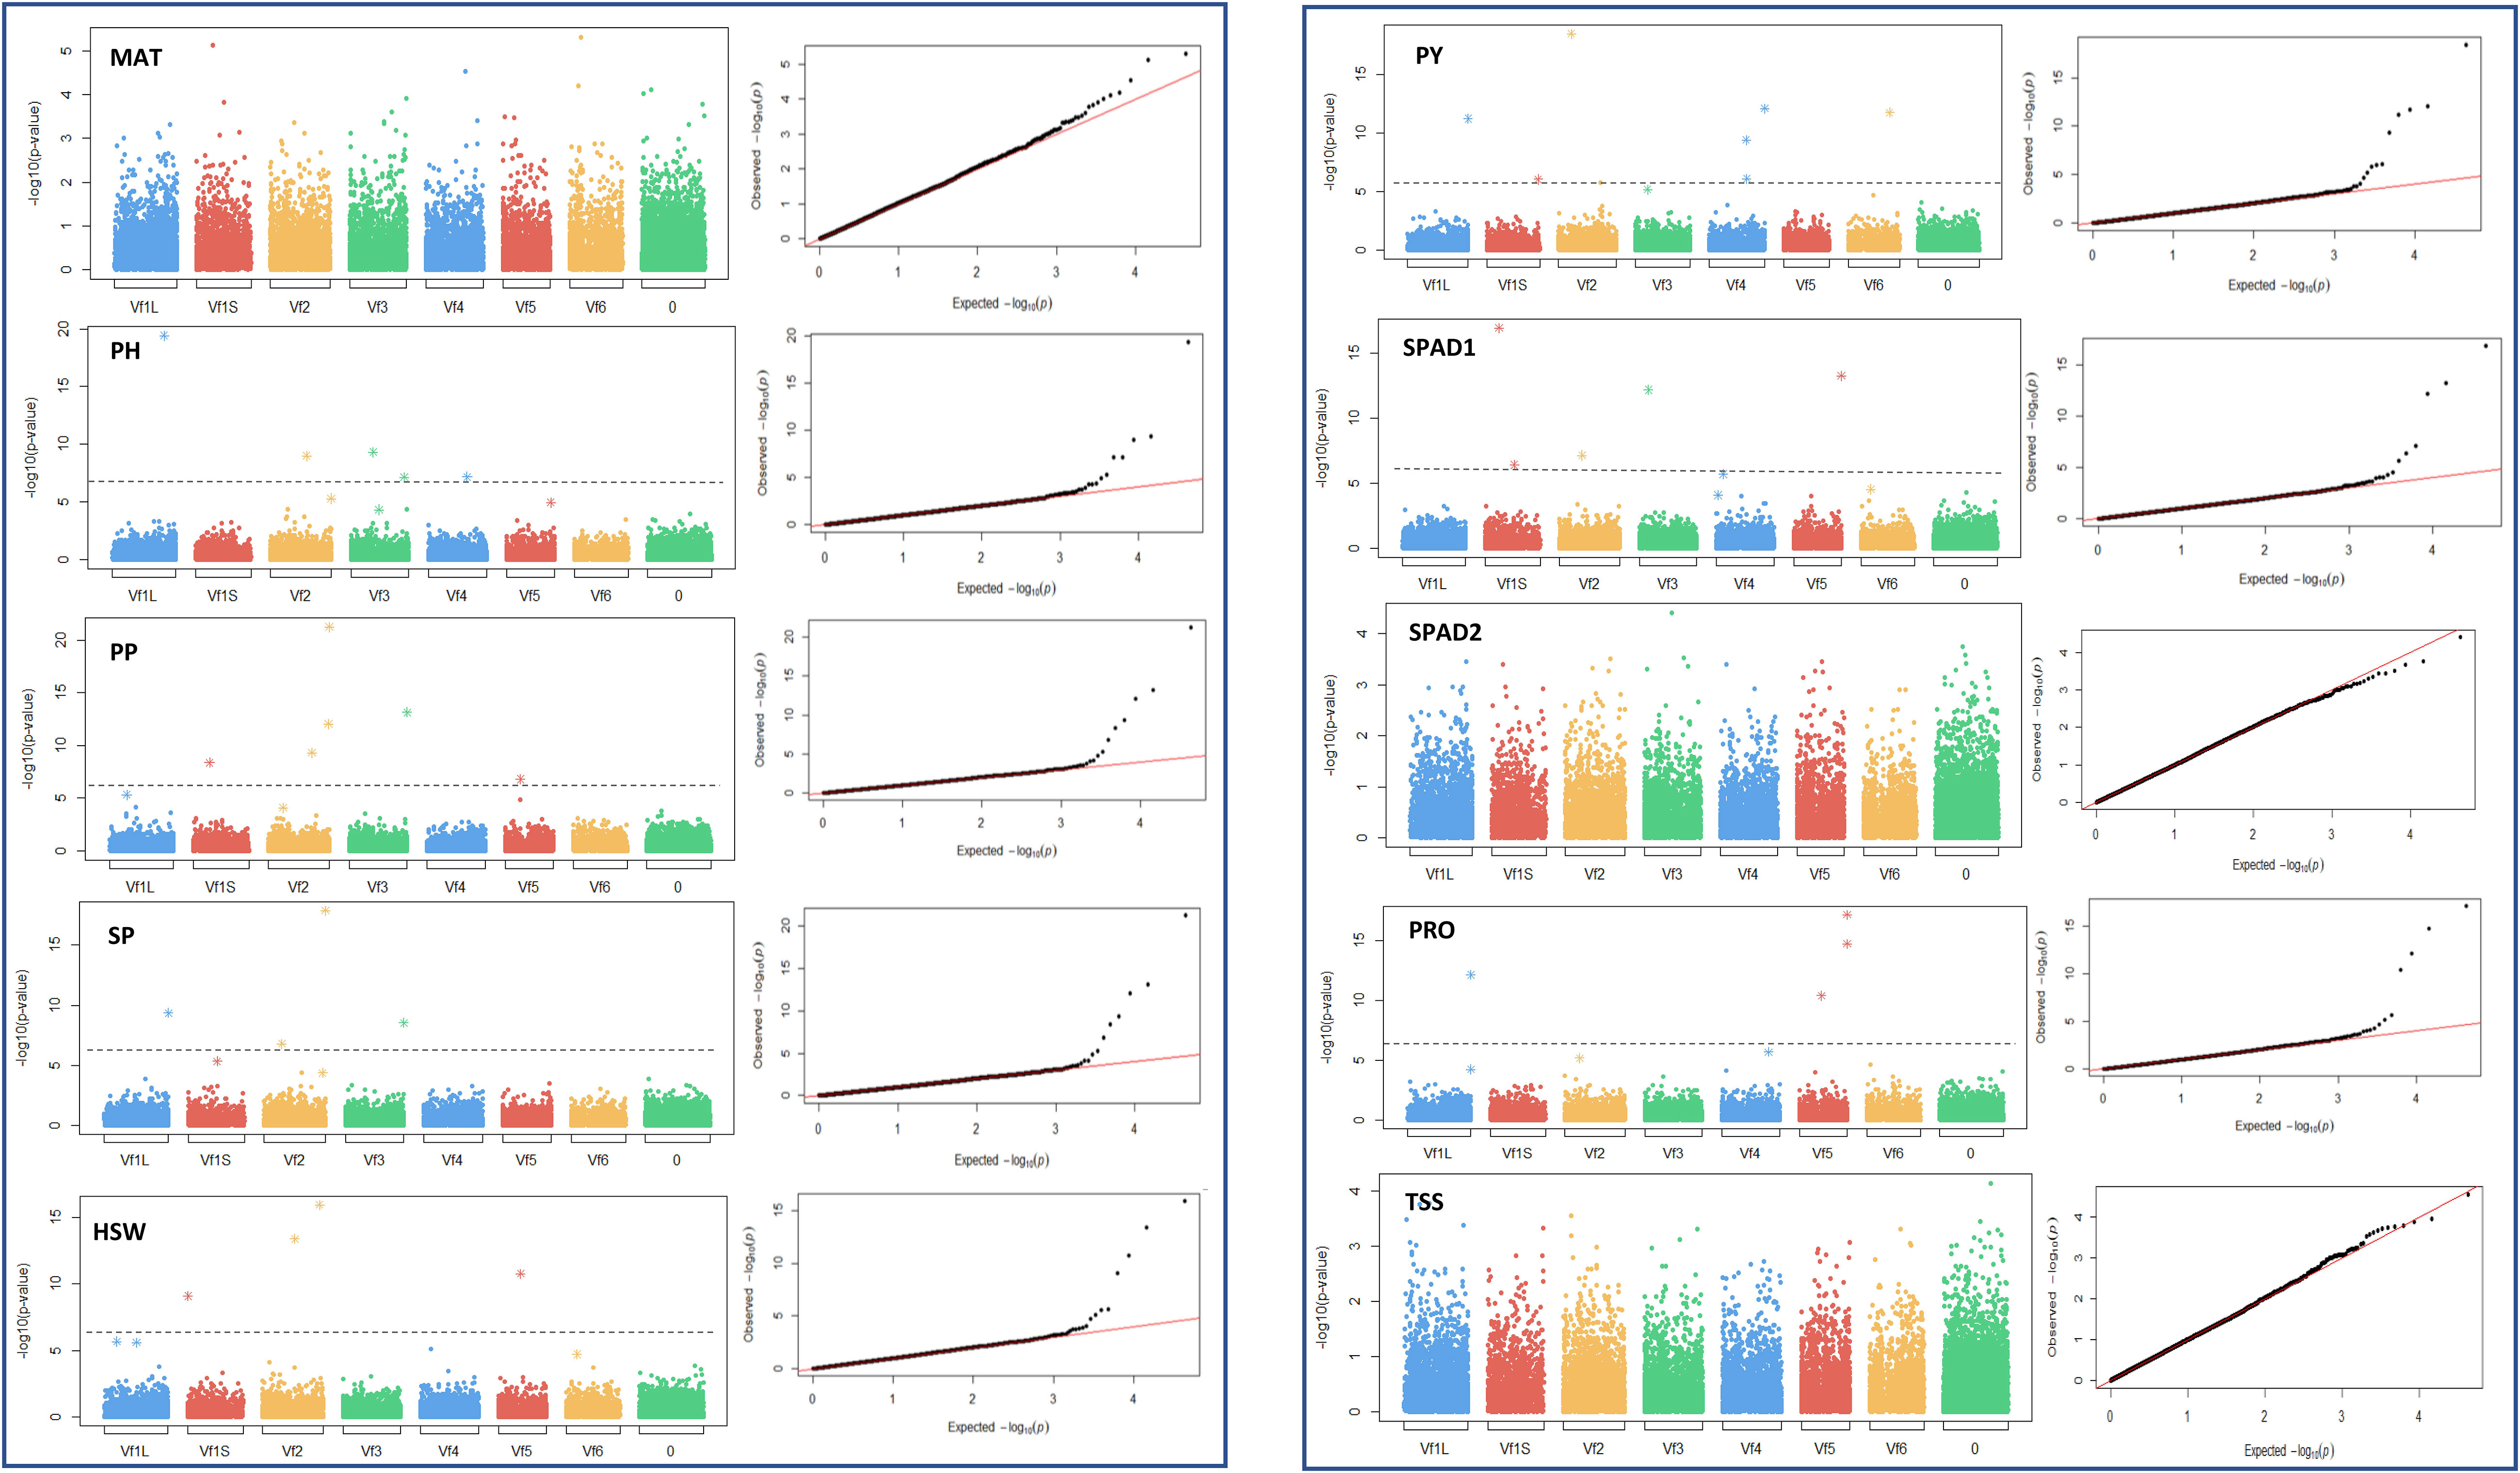
Figure 5 Manhattan plots and quantile-quantile (Q-Q) plots of the GWAS results for the 10 traits studied in control conditions. MAT, maturity date; PH, plant height; PP, number of pods per plant; SP, number of seeds per plant; HSW, 100 seed weight; PY, plot yield; SPAD1 and SPAD2, chlorophyll content at the beginning of the stress treatment and about 4 weeks after onset of drought stress, respectively. PRO, free proline content; TSS, total content of soluble sugars. Bonferroni threshold (-log10 (p) > 5.87), is represented by a continuous grey line. X-axis represents the six faba bean chromosomes. The biggest metacentric chromosome I is divided in two corresponding to the large (L) and short (S) arms. Chromosome 0 stands for unknown locations.
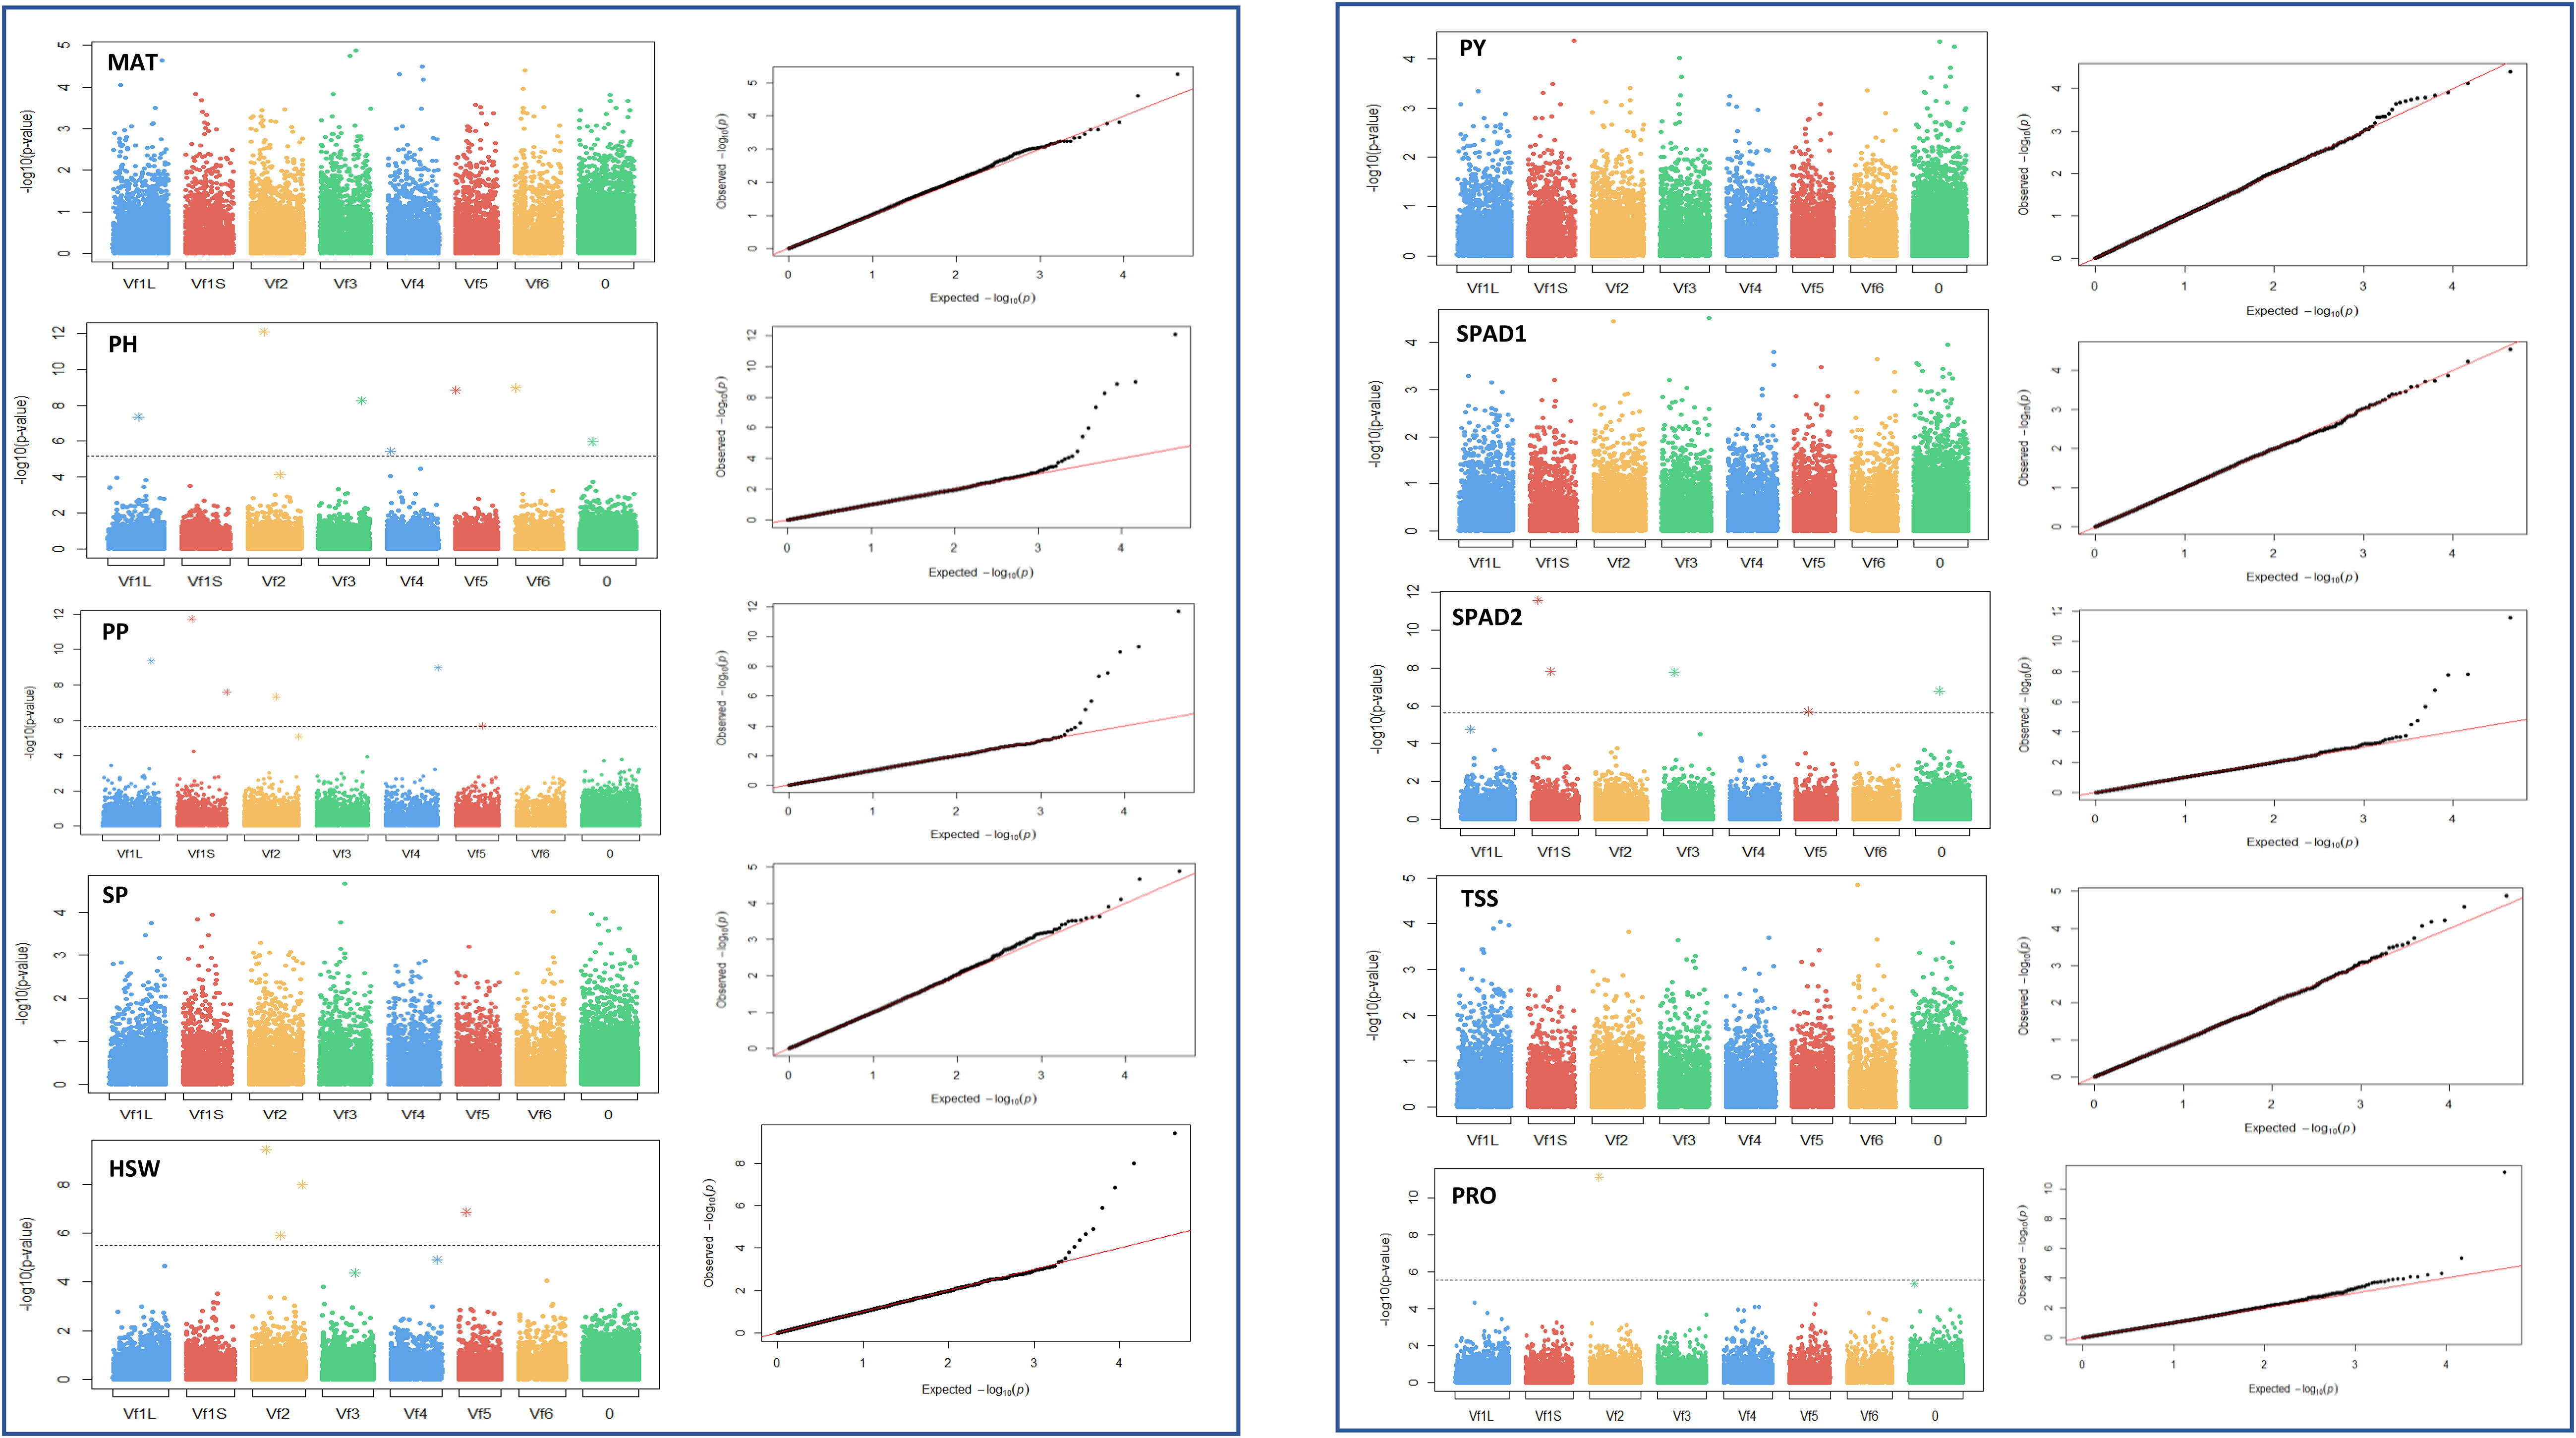
Figure 6 Manhattan plots and quantile-quantile (Q-Q) plots of the GWAS results for the 10 traits studied in drought stress conditions. MAT, maturity date; PH, plant height; PP, number of pods per plant; SP, number of seeds per plant; HSW, 100 seed weight; PY, plot yield; SPAD1 and SPAD2, chlorophyll content at the beginning of the stress treatment and about 4 weeks after onset of drought stress, respectively. PRO, free proline content; TSS, total content of soluble sugars. Bonferroni threshold (-log10 (p) > 5.87), is represented by a continuous grey line. X-axis represents the six faba bean chromosomes. The biggest metacentric chromosome I is divided in two corresponding to the large (L) and short (S) arms. Chromosome 0 stands for unknown locations.
Under control conditions we detected 52 significant SNPs spread along the genome, although 17 did not reach the Bonferroni threshold -log10(p) > 5.83. Most of the significant markers, however, clustered in chromosome 1 and 2 (Table 2). Eight loci were associated with PH, PP, PY and SPAD1, accounting together for 70.5%, 64.9%, 84% and 65.3% of the respective trait variation. Likewise, seven significant SNPs captured 53.4% of the HSW and 76.4% of the PRO variation. Finally, the six markers associated with SP provided the highest contribution to the phenotypic variance (84.6%). No significant associations were detected for MAT, SPAD2 and TSS. The SNP AX-416730999 has a common association with PP and SP. No such colocalization of SNP markers with multiple traits was observed under drought conditions.
Under drought stress, a total of 29 loci were significantly associated with the traits although 8 did not reach the Bonferroni threshold -log10(p) > 5.83 (Table 3). Although distributed across the six faba bean chromosomes, 16 of them (55%) colocalized mostly in chromosomes 1 and 2 while three of them could not be assigned. Six markers were HSW and SPAD2 associated, jointly explaining 68.4% and 75.4% of the trait variation, respectively. Eight SNPs were associated with PH and seven with PP explaining, respectively, 78.6%, 69.6% of the phenotypic variation. No SNPs associated with MAT, SP and PY were found. The GWAS analysis did not identify significant SNP markers for SPAD1 and TSS, but PRO showed association with two SNPs, one of them explaining the highest percentages of the trait variation in drought conditions (30.1%). Three pleiotropic loci (noted in bold in Tables 2 and 3) were associated with HSW and PP in both water regime conditions.
To further understand the genetic basis of faba bean drought stress-related traits, the sequences flanking SNPs associated with significant traits were subjected to a BLAST search to identify the orthologous sequences in M. truncatula or in other model legumes. From the 29 candidate genes (Table 3), 28 were functionally annotated while one of them did not show a significant sequence similarity with Medicago. For the sake of brevity, we will mainly comment on the putative genes explaining around 10% of the trait variation.
Starting with the phenological and yield related traits, eight significant SNPs were found for plant height (PH). Four of these genes, annotated as formamidopyrimidine-DNA glycosylase, B3 domain-containing protein At3g19184, Telomere length regulation protein TEL2 and DExH-box ATP-dependent RNA helicase DExH3 (Table 3), accounted for 15.4%, 14.9%, 14.6% and 11.7%, respectively, of the phenotypic variation. Concerning pods per plant (PP), the most significant gene explaining 20.6% of the variation is annotated as organic cation/carnitine transporter 4. Another putative candidate gene explained 12.4% of the trait variation and corresponds to a AT-rich interactive domain-containing protein 4 and a Protein ROOT HAIR DEFECTIVE 3 homolog 2 accounted for 11.6% of the variation. Finally, one uncharacterized SNP explained 12% of the trait. Six putative candidates were associated with hundred seed weight (HSW). The first of these, Protein TIC 56, which contributes to 20.3% of the variation, participates at the inner chloroplast envelope membrane to form a channel for plastid protein import (Kikuchi et al., 2013). Next, a nuclear pore complex protein NUP88, explained 14.5% of the variation, while another gene annotated as a BTB/POZ domain-containing protein explained 13.4% of the trait.
Concerning the physiological traits, six SNPs were significantly associated with SPAD2 and two of them, the uncharacterized LOC11422670 and a CLIP-associated protein, explained the highest percentage of variation (26% and 20.4%, respectively). Besides, a ubiquitin-conjugating enzyme E2 16 together with a probable carboxylesterase 18 were responsible for 11.8 and 10% of the SPAD2 variation. For proline content (PRO), two SNPs annotated as beta-glucosidase BoGH3B and mitogen-activated protein kinase 20 accounted for a significant percentage of the trait variation (30.1% and 13%, respectively).
Discussion
Drought stress represents a major threat to plant growth and development. Since faba bean is generally grown under rainfed conditions, it often experiences water stress at the terminal growth phase of the crop. Considering the present scenario of climate change, enhancing faba bean productivity through improved drought tolerance is a prioritary goal in breeding efforts.
Phenotyping for drought tolerance is costly and time consuming, but secondary characters with high heritability that are correlated with yield under drought conditions can be used for indirect selection (Ziyomo and Bernardo, 2013). In the present study, 100 faba bean accessions from different origins were evaluated for two years under control and drought conditions, for 10 secondary traits associated to phenology, physiology and grain yield. These traits have been used in different legume studies for efficient assessment of stress tolerance (Nadeem et al., 2019; Valdisser et al., 2020; Ravelombola et al., 2021; Wu et al., 2021). Considering both years and conditions, the yield related traits (PP, SP, HSW, PY) were highly correlated with MAT, PH and SPAD2 and could thus be used as efficient secondary traits for drought tolerance in faba bean improvement programs. Accordingly, the vectors among these traits in Figure 4 had small angles confirming the positive correlation. The selection of faba bean accessions from different origins, with sufficient genetic variation and weak population structure revealed a large variation in these traits, suggesting that the panel is genetically diverse and could be advantageous for GWAS implementation.
GWAS has become a critical tool for detecting genetic variants underlying complex traits. The large number of SNPs obtained with the 50K SNP array from Affymetrix (O’Sullivan et al., 2019; Khazaei et al., 2021) has provided an extensive genome coverage to differentiate germplasm accessions and to carry out high-resolution association mapping. Using 21,915 SNPs we detected here a total of 52 significant SNPs in irrigation (control) and 29 in drought conditions, distributed across the six faba bean chromosomes, which collectively explained a high percentage of the total phenotypic variation. Three of these SNPs were associated with the traits evaluated both under control and drought conditions (Tables 2 and 3) and should thus not be relevant to drought stress. In control conditions the SNPs associated with morphological, physiological and yield related traits explained from 53.4% in the case of HSW to 84.6% in SP while under drought stress the R2 values ranged from 43.1% (PRO) to 78.6% (PH). No significantly associated SNPs were detected for MAT, SPAD2 and TSS in control conditions or for MAT, SP, PY, SPAD1 and TSS under stress. Interestingly, two significant SNPs accounting for high percentages of the trait variation in PP and SPAD2, correspond to uncharacterized proteins indicating the presence of novel genes associated with drought tolerance in faba bean.
To progress in our understanding and possible functions of significant genes, we investigated their involvement in water stress-responses reported from other crop species. BLAST search analysis showed that most of the significant SNP markers identified in the present study aligned with candidates, known to be involved in responses to drought stress in different crops (Table 3).
Four main drought stress response candidates were identified for PH. The first corresponds to a formamidopyrimidine-DNA glycosylase reported to initiate base excision repair at damaged sites in response to abiotic stresses (Chen et al., 2012; Wallace, 2014). The expression of many drought-induced genes is regulated at the transcriptional level and this activity can be extended to the second candidate, a B3 domain-containing protein At3g19184 candidate since in maize, the B3 domain-containing transcription factor Viviparous1 (Vp1) was induced by drought stress (Cao et al., 2007). The third major candidate identified in our study is a homolog of the telomere length regulation protein TEL2, a key regulator of cell proliferation and genome maintenance. TEL2 complexes interacts with and promotes protein kinases stability by controlling telomerase length as well as the DNA damage response (Smogorzewska and de Lange, 2004; Smogorzewska and de Lange, 2004; Sugimoto, 2018). For example, a telomere length regulation protein TEL2 homolog in rice was differentially expressed in response to salinity stress (Cotsaftis et al., 2011). Finally, the fourth candidate gene encodes a DExH-box ATP-dependent RNA helicase, which in plants has a critical role in a variety of RNA-mediated regulation of cell proliferation and abiotic stress responses (Liu and Imai, 2018). In addition, four other candidates genes detected in our work encode, respectively, a 28 kDa ribonucleoprotein, a which was recently reported in chickpea response to biotic and abiotic stresses (Vessal et al., 2020); a nuclear Y-B transcription factor that has proven to regulate resistance to drought stress in Arabidopsis, maize and soybean (Nelson et al., 2007; Sun et al., 2022); an exocyst complex component reported as a drought and salt tolerance regulator in grapevine (Wang et al., 2023), and a glutamate receptor with a signalling role in responses to abiotic stresses such as salt, cold, heat, and drought, of Arabidopsis, faba bean and rice (Lu et al., 2014; Yoshida et al., 2016; Qiu et al., 2019).
Concerning the number of pods per plant (PP), an organic cation/carnitine transporter 4, an AT-rich interactive domain-containing protein (ARID domain) and a protein ROOT HAIR DEFECTIVE 3 (RHD3) homolog 2 were the most significant annotated genes identified. In Arabidopsis, several organic cation transporters were up-regulated during drought stress suggesting a specific role in plant adaptation to environmental stress (Küfner and Koch, 2008). Likewise, the ARID domain containing proteins are transcription factors implicated in a wide variety of roles, including chromatin remodelling, transcription, and cell growth (Wilsker et al., 2002). In a proteomics study of sugarcane response, (Salvato et al., 2019) showed that different types of transcriptional regulators, including ARID domains proteins were differentially accumulated in response to drought stress. RHD3 was also required for regulation of cell expansion and root hair development. Thus, Wong et al. (2018) reported that the ectopic expression of a Musa acuminata RHD3 gene enhanced drought tolerance in Arabidopsis. Moreover, a root transcriptomic analysis of contrasting Gossypium herbaceum genotypes revealed a higher expression of RHD3 genes in tolerant lines, highlighting the key involvement of these genes in root length development and plasticity under drought stress conditions (Ranjan et al., 2012).
Three main QTLs were associated with hundred seed weight (HSW): Protein TIC 56 participates at the inner chloroplast envelope membrane to form a channel for plastid protein import (Kikuchi et al., 2013), a BTB/POZ domain-containing protein with potential roles in developmental programs such as promotion of leaf and floral meristem fate and determinacy, as well as in defence and abiotic stress response (Guan et al., 2018). Both genes (Protein TIC 56 and BTB/POZ domain) were significant both under control and drought conditions. The next, candidate is the nuclear pore complex (NPC) protein NUP88. Diverse mechanisms have been proposed to explain the role of NPC family components in responses to different stresses such as cold, abscisic acid (ABA), drought, and biotic stress (Yang et al., 2017). Further candidates associated with HSW in drought conditions include the lipid-transfer protein (LTP) DIR1, the transcription termination factor MTEF1 and a xyloglucan endotransglucosylase/hydrolase protein. LTPs are thought to be involved in plant defense responses (Safi et al., 2015) and their expression is induced by biotic and abiotic stresses, including disease, salinity, temperature and drought (Safi et al., 2015; Akhiyarova et al., 2021; Duo et al., 2021; Zhao et al., 2021). It is also well established that drought tolerance is regulated by the mitochondrial transcription termination factors (MTERFs). A recent analysis of mterf mutants supports aa role for plant MTERFs in abiotic stress response (Quesada, 2016). Similarly, the xyloglucan endotransglucosylase/hydrolases are inducible by a broad spectrum of abiotic stresses and have been shown to enhanced tolerance to salt and drought stresses in tomato (Choi et al., 2011).
Concerning the physiological trait SPAD2, only three of the six significant SNPs were annotated, indicating the presence of three novel candidates associated with drought tolerance in faba bean. The first of the annotated candidates, a CLIP-associated protein (CLASPs), correspond to an evolutionarily conserved family of regulatory factors that control microtubule dynamics and the organization of microtubule networks. Although little is known about their function in plants, in Arabidopsis, CLASP is involved in both cell division and cell expansion by linking microtubules and auxin transport (Ambrose et al., 2007). The second candidate gene encodes an ubiquitin-conjugating enzyme that has shown to enhance drought and salt tolerance in Arabidopsis and melon, as well as in different legume crops such as soybean, peanut or mung bean (Zhou et al., 2010; Baloglu and Patir, 2014; Wang et al., 2016; Chen et al., 2020). Finally, carboxylesterases are known to play important roles in plant growth, development and resistance to stresses (Prinsi et al., 2018; Arisha et al., 2020; Rui et al., 2022).
The two candidates related to proline content (PRO) were the beta-glucosidase BoGH3B and the mitogen-activated protein kinase 20. Plant β-glucosidases are involved in cell wall biogenesis which protects plants against external stresses (Moradi Tarnabi et al., 2020). Different b-glucosidase homologs were shown to be involved in the response to dehydration and NaCl stress in Arabidopsis (Xu et al., 2012) and drought stress in soybean roots (Wang et al., 2017). Finally, mitogen-activated protein kinase (MAPK) genes are involved in many cell activities including growth, differentiation and proliferation, as well as environmental stress responses. MAPKs activation is a common defense response of plants to a range of abiotic stressors (Komis et al., 2018; Muhammad et al., 2019; Kim et al., 2021). Because drought stress leads simultaneously to osmotic and oxidative stress (Zhu, 2002), osmotic stress activates several protein kinases including MAPKs, which mediate osmotic homeostasis and/or detoxification responses.
Osmotic adaptation is a major component of drought resistance in different crops (Sánchez et al., 1998; Bajji et al., 2001). Proline and soluble sugar accumulation are common physiological responses in many plants during water-deficit stress, to protect cellular components and to restore the osmotic balance (Chen and Murata, 2002; Guo et al., 2018). Accordingly, PRO and TSS increased under drought stress (Table 1). Severe drought stress also inhibits the photosynthesis of plants by causing a decrease in chlorophyll content (Ommen et al., 1999). Our results reveal that four weeks after the onset of stress, the mean chlorophyll content (SPAD2) was highly reduced mainly due to damage in chloroplasts caused by reactive oxygen species (Smirnoff, 1995).
The wide range of candidates functionally annotated and significantly associated with drought stress component traits evidences that drought responses are complex and that each induction phase may be controlled by different signalling mechanisms and transcription factors (Shinozaki et al., 2003) classified the products of stress-inducible genes identified in microarray experiments into two groups, one includes molecules such as late embryogenesis abundant (LEA) proteins, osmotin, key enzymes for osmolyte biosynthesis, water channel proteins, sugar and proline transporters, and various proteases, while the second group consists of regulators of intracellular signalling and stress-inducible gene expression (e.g. protein kinases such as MAP kinases, phosphatases, phospholipid metabolic enzymes, and various types of transcription factors). A mitogen-activated protein kinase and a plastidial pyruvate kinase were associated with PRO and PP respectively, while two transcription factors were significantly associated with PP and HSW. Receptor kinases are considered as key regulators of plant architecture and growth, but they also function in defence and stress responses (Marshall et al., 2012). In fact, some serine/threonine-protein kinases are known to play a role in signal transduction and were shown to improve drought tolerance in Arabidopsis, rice, soja and bamboo (Xie et al., 2014; Liu et al., 2022). On the other hand, it is well known that transcription factors synchronise signal transduction and expression of drought tolerance regulatory genes, enabling plants to withstand stress conditions (Joshi et al., 2016; Hrmova and Hussain, 2021). For these reasons, they are considered as potential candidates with broad applications in crop breeding. These results show that the approach applied to this faba bean collection could lead to the efficient identification of candidate genes that are relevant to faba bean drought tolerance.
In summary, our study demonstrates the feasibility of GWAS analysis with a diverse germplasm collection and a high-density array chip, for the identification of drought tolerance-related traits in faba bean. Under stress conditions, 29 SNP markers that were significantly correlated to these traits have been identified, mostly clustered in chromosomes 1 and 2. Interestingly, all of them were directly or indirectly involved in responses to drought stress, thus establishing a solid foundation for further research. The identification of a number of stress-inducible signal transducers provides valuable information on the putative faba bean response mechanisms against drought stress. Nevertheless, a validation of the identified markers in a larger size or bi-parental population, using tissue and stage specific gene expression data from RNA-Seq, would be reasonable before embarking on a broad breeding program. The results from this study will contribute to a better understanding of the genetic architecture governing drought tolerance in faba bean and provide a foundation for marker-assisted breeding in this crop.
Data availability statement
The original contributions presented in the study are included in the article/Supplementary Material. Further inquiries can be directed to the corresponding author.
Author contributions
AT and NG selected and multiplied the seeds for the experiments and devised the project. CB planned and carried out the drought evaluations and measurements. MP designed and supervised the statistical analysis. NG processed the experimental data and performed the GWAS analysis. AT and NG wrote the manuscript in consultation with MP and CB. All authors contributed to the article and approved the submitted version.
Acknowledgments
This project has received funding from the European Union’s Horizon 2020 Programme for Research & Innovation under grant agreement n°727312 (EUCLEG Project) and RTA2020-007 co-financed by ERDF. We thank the seed companies and institutes that provided us with faba bean seeds of their accessions: INRA, Dijon (Jean-Bernard Magnin-Robert), ICARDA (Fouad Maalouf) and IFAPA. The technical staff of IFAPA, centro Alameda del Obispo, is thanked for their deep investment to multiply accessions and collect leaves for genotyping. The authors are grateful to Dr. A. Di Pietro for critical reading of the manuscript.
Conflict of interest
The authors declare that the research was conducted in the absence of any commercial or financial relationships that could be construed as a potential conflict of interest.
Publisher’s note
All claims expressed in this article are solely those of the authors and do not necessarily represent those of their affiliated organizations, or those of the publisher, the editors and the reviewers. Any product that may be evaluated in this article, or claim that may be made by its manufacturer, is not guaranteed or endorsed by the publisher.
Supplementary material
The Supplementary Material for this article can be found online at: https://www.frontiersin.org/articles/10.3389/fpls.2023.1091875/full#supplementary-material
Footnotes
- ^ https://projects.au.dk/fabagenome/genomics-data
- ^ https://www.geneious.com
- ^ www.blast.ncbi.nlm.nih.gov/Blast.cgi
- ^ www.ncbi.nlm.nih.gov/genome/gdv/
References
Abid, G., Muhovski, Y., Mingeot, D., Watillon, B., Toussaint, A., Mergeai, G., et al. (2015). Identification and characterization of drought stress responsive genes in faba bean (Vicia faba l.) by suppression subtractive hybridization. Plant Cell Tiss. Organ Cult. 121, 367–379. doi: 10.1007/s11240-014-0707-x
Akhiyarova, G. R., Ivanov, R. S., Ivanov, I. I., Finkina, E. I., Melnikova, D. N., Bogdanov, I. V., et al. (2021). Effects of salinity and abscisic acid on lipid transfer protein accumulation, suberin deposition and hydraulic conductance in pea roots. Membranes (Basel) 11, 762. doi: 10.3390/membranes11100762
Alderfasi, A. A., Alghamdi, S. S. (2010). Integrated water supply with nutrient requirements on growth, photosynthesis productivity, chemical status and seed yield of faba bean. American-Eurasian J. Agron. 3, 8–17.
Ali, M. B. M., Welna, G. C., Sallam, A., Martsch, R., Balko, C., Gebser, B., et al. (2016). Association analyses to genetically improve drought and freezing tolerance of faba bean (Vicia faba l.). Crop Sci. 56, 1036–1048. doi: 10.2135/cropsci2015.08.0503
Ambrose, J. C., Shoji, T., Kotzer, A. M., Pighin, J. A., Wasteneys, G. O. (2007). The arabidopsis CLASP gene encodes a microtubule-associated protein involved in cell expansion and division. Plant Cell 19, 2763–2775. doi: 10.1105/tpc.107.053777
Amede, T., Schubert, S., Stahr, K. (2003). Mechanisms of drought resistance in grain legumes I: Osmotic adjustment. SEJS 26 (1), 37–46. doi: 10.4314/sinet.v26i1.18198
Ammar, M. H., Anwar, F., El-Harty, E. H., Migdadi, H. M., Abdel-Khalik, S. M., Al-Faifi, S. A., et al. (2015). Physiological and yield responses of faba bean (Vicia faba l.) to drought stress in managed and open field environments. J. Agro. Crop Sci. 201, 280–287. doi: 10.1111/jac.12112
Annicchiarico, P., Iannucci, A. (2008). Breeding strategy for faba bean in southern Europe based on cultivar responses across climatically contrasting environments. Crop Sci. 48, 983. doi: 10.2135/cropsci2007.09.0501
Arisha, M. H., Ahmad, M. Q., Tang, W., Liu, Y., Yan, H., Kou, M., et al. (2020). RNA-Sequencing analysis revealed genes associated drought stress responses of different durations in hexaploid sweet potato. Sci. Rep. 10, 12573. doi: 10.1038/s41598-020-69232-3
Bajji, M., Lutts, S., Kinet, J. M. (2001). Water deficit effects on solute contribution to osmotic adjustment as a function of leaf ageing in three durum wheat (Triticum durum desf.) cultivars performing differently in arid conditions. Plant Sci. 160, 669–681. doi: 10.1016/S0168-9452(00)00443-X
Balko, C. (2005). “Physiological parameters of drought tolerance in relation to yield and yield stability in faba beans,” in The 2nd international conference on integrated approaches to sustain and improve plant protection under drought stress (Rome: INTERDROUGHT-II).
Balko, C., Stelling, D., Larher, F., Sedding, S., Kittlittz, E., Jürgens, H. U. (1995). Investigations into selection for drought tolerance in vicia faba l. Ed. Belhassen, E. (Montpelier: ENSA-INRA).
Balko, C., Torres, A. M., Gutierrez, N. (2003). Variability in drought stress response in a panel of 100 faba bean genotypes (submitted).
Baloglu, M. C., Patir, M. G. (2014). Molecular characterization, 3D model analysis, and expression pattern of the CmUBC gene encoding the melon ubiquitin-conjugating enzyme under drought and salt stress conditions. Biochem. Genet. 52, 90–105. doi: 10.1007/s10528-013-9630-9
Bates, L. S., Waldren, R. P., Teare, I. D. (1973). Rapid determination of free proline for water-stress studies. Plant Soil 39, 205–207. doi: 10.1007/BF00018060
Bonnafous, F., Duhnen, A., Gody, L., Guillaume, O., Mangin, B., Pegot-Espagnet, P., et al. (2019). Mlmm.gwas: Pipeline for GWAS using MLMM. https://CRAN.Rproject.org/package=mlmm.gwas. r package version 1.0.6.
Cantet, R. J. C., Birchmeier, A. N., Canaza Cayo, A. W., Fioretti, C. (2005). Semiparametric animal models via penalized splines as alternatives to models with contemporary groups. J. Anim. Sci. 83, 2482–2494. doi: 10.2527/2005.83112482x
Cao, X., Costa, L. M., Biderre-Petit, C., Kbhaya, B., Dey, N., Perez, P., et al. (2007). Abscisic acid and stress signals induce Viviparous1 expression in seed and vegetative tissues of maize. Plant Physiol. 143, 720–731. doi: 10.1104/pp.106.091454
Cappa, E. P., Cantet, R. J. C. (2007). Bayesian Estimation of a surface to account for a spatial trend using penalized splines in an individual-tree mixed model. Can. J. For. Res. 37, 2677–2688. doi: 10.1139/X07-116
Cappa, E. P., Muñoz, F., Sanchez, L., Cantet, R. J. C. (2015). A novel individual-tree mixed model to account for competition and environmental heterogeneity: a Bayesian approach. Tree Genet. Genomes 11, 120. doi: 10.1007/s11295-015-0917-3
Chen, H., Chu, P., Zhou, Y., Li, Y., Liu, J., Ding, Y., et al. (2012). Overexpression of AtOGG1, a DNA glycosylase/AP lyase, enhances seed longevity and abiotic stress tolerance in arabidopsis. J. Exp. Bot. 63, 4107–4121. doi: 10.1093/jxb/ers093
Chen, T. H. H., Murata, N. (2002). Enhancement of tolerance of abiotic stress by metabolic engineering of betaines and other compatible solutes. Curr. Opin. Plant Biol. 5, 250–257. doi: 10.1016/S1369-5266(02)00255-8
Chen, K., Tang, W.-S., Zhou, Y.-B., Xu, Z.-S., Chen, J., Ma, Y.-Z., et al. (2020). Overexpression of gmubc9 gene enhances plant drought resistance and affects flowering time via histone H2B monoubiquitination. Front. Plant Sci. 11. doi: 10.3389/fpls.2020.555794
Choi, J. Y., Seo, Y. S., Kim, S. J., Kim, W. T., Shin, J. S. (2011). Constitutive expression of CaXTH3, a hot pepper xyloglucan endotransglucosylase/hydrolase, enhanced tolerance to salt and drought stresses without phenotypic defects in tomato plants (Solanum lycopersicum cv. dotaerang). Plant Cell Rep. 30, 867–877. doi: 10.1007/s00299-010-0989-3
Choudhary, S., Isobe, S., Chahota, R. K. (2022). Elucidation of drought tolerance potential of horsegram (Macrotyloma uniflorum var.) germplasm using genome wide association studies. Gene 819, 146241. doi: 10.1016/j.gene.2022.146241
Cotsaftis, O., Plett, D., Johnson, A. A. T., Walia, H., Wilson, C., Ismail, A. M., et al. (2011). Root-specific transcript profiling of contrasting rice genotypes in response to salinity stress. Mol. Plant 4, 25–41. doi: 10.1093/mp/ssq056
Daryanto, S., Wang, L., Jacinthe, P.-A. (2015). Global synthesis of drought effects on food legume production. PloS One 10, e0127401. doi: 10.1371/journal.pone.0127401
Dossa, K., Li, D., Zhou, R., Yu, J., Wang, L., Zhang, Y., et al. (2019). The genetic basis of drought tolerance in the high oil crop sesamum indicum. Plant Biotechnol. J. 17, 1788–1803. doi: 10.1111/pbi.13100
Dramadri, I. O., Nkalubo, S. T., Kramer, D. M., Kelly, J. D. (2021). Genome wide association analysis of drought adaptive traits in common bean. Crop Sci 61, 3232–3253. doi: 10.1002/csc2.20484
Duo, J., Xiong, H., Wu, X., Li, Y., Si, J., Zhang, C., et al. (2021). Genome-wide identification and expression profile under abiotic stress of the barley non-specific lipid transfer protein gene family and its qingke orthologues. BMC Genomics 22, 674. doi: 10.1186/s12864-021-07958-8
FAOSTAT (2020) FAOSTAT (FAOSTAT). Available at: http://www.fao.org/faostat/en/#data (Accessed June 17, 2021).
Guan, L., Haider, M. S., Khan, N., Nasim, M., Jiu, S., Fiaz, M., et al. (2018). Transcriptome sequence analysis elaborates a complex defensive mechanism of grapevine (Vitis vinifera l.) in response to salt stress. Int. J. Mol. Sci. 19, 4010. doi: 10.3390/ijms19124019
Guo, R., Shi, L., Jiao, Y., Li, M., Zhong, X., Gu, F., et al. (2018). Metabolic responses to drought stress in the tissues of drought-tolerant and drought-sensitive wheat genotype seedlings. AoB Plants 10, ply016. doi: 10.1093/aobpla/ply016
Hoyos-Villegas, V., Song, Q., Kelly, J. D. (2017). Genome-wide association analysis for drought tolerance and associated traits in common bean. Plant Genome 10, 1–17. doi: 10.3835/plantgenome2015.12.0122
Hrmova, M., Hussain, S. S. (2021). Plant transcription factors involved in drought and associated stresses. Int. J. Mol. Sci. 22 (11), 5662. doi: 10.3390/ijms22115662
Jayakodi, M., Golicz, A. A., Kreplak, J., Fechete, L. I., Angra, D., Bednar, P., et al. (2022). The giant diploid faba genome unlocks variation in a global protein crop. BioRxiv. doi: 10.1101/2022.09.23.509015
Joshi, R., Wani, S. H., Singh, B., Bohra, A., Dar, Z. A., Lone, A. A., et al. (2016). Transcription factors and plants response to drought stress: current understanding and future directions. Front. Plant Sci. 7. doi: 10.3389/fpls.2016.01029
Kassambara, A., Mundt, F. (2020). Factoextra: Extract and Visualize the Results of Multivariate Data Analyses. R package version 1.0.7. https://CRAN.R-project.org/package=factoextra.
Kaur, S., Kimber, R. B. E., Cogan, N. O. I., Materne, M., Forster, J. W., Paull, J. G. (2014). SNP discovery and high-density genetic mapping in faba bean (Vicia faba l.) permits identification of QTLs for ascochyta blight resistance. Plant Sci. 217–218, 47–55. doi: 10.1016/j.plantsci.2013.11.014
Khan, H., Link, W., Hocking, T. J., Stoddard, F. L. (2007). Evaluation of physiological traits for improving drought tolerance in faba bean (Vicia faba l.). Plant Soil 292, 205–217. doi: 10.1007/s11104-007-9217-5
Khan, H. R., Paull, J. G., Siddique, K. H. M., Stoddard, F. L. (2010). Faba bean breeding for drought-affected environments: A physiological and agronomic perspective. Field Crops Res. 115, 279–286. doi: 10.1016/j.fcr.2009.09.003
Khazaei, H., O’Sullivan, D. M., Sillanpää, M. J., Stoddard, F. L. (2014). Use of synteny to identify candidate genes underlying QTL controlling stomatal traits in faba bean (Vicia faba l.). Theor. Appl. Genet. 127, 2371–2385. doi: 10.1007/s00122-014-2383-y
Khazaei, H., O’Sullivan, D. M., Stoddard, F. L., Adhikari, K. N., Paull, J. G., Schulman, A. H., et al. (2021). Recent advances in faba bean genetic and genomic tools for crop improvement. Legume Sci. 3, e75. doi: 10.1002/leg3.75
Kikuchi, S., Bédard, J., Hirano, M., Hirabayashi, Y., Oishi, M., Imai, M., et al. (2013). Uncovering the protein translocon at the chloroplast inner envelope membrane. Science 339, 571–574. doi: 10.1126/science.1229262
Kim, M., Jeong, S., Lim, C. W., Lee, S. C. (2021). Mitogen-activated protein kinase CaDIMK1 functions as a positive regulator of drought stress response and abscisic acid signaling in capsicum annuum. Front. Plant Sci. 12. doi: 10.3389/fpls.2021.646707
Komis, G., Šamajová, O., Ovečka, M., Šamaj, J. (2018). Cell and developmental biology of plant mitogen-activated protein kinases. Annu. Rev. Plant Biol. 69, 237–265. doi: 10.1146/annurev-arplant-042817-040314
Küfner, I., Koch, W. (2008). Stress regulated members of the plant organic cation transporter family are localized to the vacuolar membrane. BMC Res. Notes 1, 43. doi: 10.1186/1756-0500-1-43
Lafitte, R., Blum, A., Atlin, G. (2003)Using secundary traits to help identify drought-tolerant genotypes. In: Breeding rice for drought-prone enviroments (Phillipines: International Rice Research Institute). Available at: https://www.researchgate.net/publication/259885067_Using_secondary_traits_to_help_identify_drought-tolerant_genotypes (Accessed May 30, 2022).
Liu, Y., Imai, R. (2018). Function of plant DExD/H-box RNA helicases associated with ribosomal RNA biogenesis. Front. Plant Sci. 9. doi: 10.3389/fpls.2018.00125
Liu, R., Vasupalli, N., Hou, D., Stalin, A., Wei, H., Zhang, H., et al (2022). Genome-wide identification and evolution of WNK kinases in Bambusoideae and transcriptional profiling during abiotic stress in Phyllostachys edulis. PeerJ 10, e12718. doi: 10.7717/peerj.12718
Lu, G., Wang, X., Liu, J., Yu, K., Gao, Y., Liu, H., et al. (2014). Application of T-DNA activation tagging to identify glutamate receptor-like genes that enhance drought tolerance in plants. Plant Cell Rep. 33, 617–631. doi: 10.1007/s00299-014-1586-7
Marshall, A., Aalen, R. B., Audenaert, D., Beeckman, T., Broadley, M. R., Butenko, M. A., et al. (2012). Tackling drought stress: receptor-like kinases present new approaches. Plant Cell 24, 2262–2278. doi: 10.1105/tpc.112.096677
Meuwissen, T. H., Hayes, B. J., Goddard, M. E. (2001). Prediction of total genetic value using genome-wide dense marker maps. Genetics 157, 1819–1829. doi: 10.1093/genetics/157.4.1819
Moradi Tarnabi, Z., Iranbakhsh, A., Mehregan, I., Ahmadvand, R. (2020). Impact of arbuscular mycorrhizal fungi (AMF) on gene expression of some cell wall and membrane elements of wheat (Triticum aestivum l.) under water deficit using transcriptome analysis. Physiol. Mol. Biol. Plants 26, 143–162. doi: 10.1007/s12298-019-00727-8
Muhammad, T., Zhang, J., Ma, Y., Li, Y., Zhang, F., Zhang, Y., et al. (2019). Overexpression of a mitogen-activated protein kinase SlMAPK3 positively regulates tomato tolerance to cadmium and drought stress. Molecules 24 (3), 556. doi: 10.3390/molecules24030556
Muktadir, M. A., Adhikari, K. N., Merchant, A., Belachew, K. Y., Vandenberg, A., Stoddard, F. L., et al. (2020). Physiological and biochemical basis of faba bean breeding for drought adaptation–a review. Agronomy 10, 1345. doi: 10.3390/agronomy10091345
Muñoz, F., Sanchez, L. (2022)BreedR. In: Statistical methods for forest genetic resources analysts. Available at: https://github.com/famuvie/breedR (Accessed March 9, 2022).
Nadeem, M., Li, J., Yahya, M., Sher, A., Ma, C., Wang, X., et al. (2019). Research progress and perspective on drought stress in legumes: A review. Int. J. Mol. Sci. 20 (10), 1–32. doi: 10.3390/ijms20102541
Nelson, D. E., Repetti, P. P., Adams, T. R., Creelman, R. A., Wu, J., Warner, D. C., et al. (2007). Plant nuclear factor y (NF-y) b subunits confer drought tolerance and lead to improved corn yields on water-limited acres. Proc. Natl. Acad. Sci. U.S.A. 104, 16450–16455. doi: 10.1073/pnas.0707193104
Nemecek, T., von Richthofen, J.-S., Dubois, G., Casta, P., Charles, R., Pahl, H. (2008). Environmental impacts of introducing grain legumes into European crop rotations. Eur. J. Agron. 28, 380–393. doi: 10.1016/j.eja.2007.11.004
Ocaña, S., Seoane, P., Bautista, R., Palomino, C., Claros, G. M., Torres, A. M., et al. (2015). Large-Scale transcriptome analysis in faba bean (Vicia faba l.) under ascochyta fabae infection. PloS One 10, e0135143. doi: 10.1371/journal.pone.0135143
Ommen, O. E., Donnelly, A., Vanhoutvin, S., van Oijen, M., Manderscheid, R. (1999). Chlorophyll content of spring wheat flag leaves grown under elevated CO2 concentrations and other environmental stresses within the ‘ESPACE-wheat’ project. Eur J Agron. 10, 197–203. doi: 10.1016/S1161-0301(99)00011-8
O’Sullivan, D. M., Angra, D., Harvie, T., Tagkouli, V., Warsame, A. (2019). “A genetic toolbox for vicia faba improvement,” in : International conference on legume genetics and genomics (Dijon: ICLGG).
Prinsi, B., Negri, A. S., Failla, O., Scienza, A., Espen, L. (2018). Root proteomic and metabolic analyses reveal specific responses to drought stress in differently tolerant grapevine rootstocks. BMC Plant Biol. 18, 126. doi: 10.1186/s12870-018-1343-0
Qiu, X.-M., Sun, Y.-Y., Ye, X.-Y., Li, Z.-G. (2019). Signaling role of glutamate in plants. Front. Plant Sci. 10. doi: 10.3389/fpls.2019.01743
Quesada, V. (2016). The roles of mitochondrial transcription termination factors (MTERFs) in plants. Physiol. Plant 157, 389–399. doi: 10.1111/ppl.12416
Raj, A., Stephens, M., Pritchard, J. K. (2014). astSTRUCTURE: variational inference of population structure in large SNP data sets. Genetics 197, 573–589. doi: 10.1534/genetics.114.164350
Ranjan, A., Pandey, N., Lakhwani, D., Dubey, N. K., Pathre, U. V., Sawant, S. V. (2012). Comparative transcriptomic analysis of roots of contrasting gossypium herbaceum genotypes revealing adaptation to drought. BMC Genomics 13, 680. doi: 10.1186/1471-2164-13-680
Ravelombola, W., Shi, A., Huynh, B.-L. (2021). Loci discovery, network-guided approach, and genomic prediction for drought tolerance index in a multi-parent advanced generation intercross (MAGIC) cowpea population. Hortic. Res. 8, 24. doi: 10.1038/s41438-021-00462-w
Ricciardi, L., Polignano, G. B., De Giovanni, C. (2001). Genotypic response of faba bean to water stress. Euphytica. 118, 39–46. doi: 10.1023/a:1004078017159
Richards, R. A. (2006). Physiological traits used in the breeding of new cultivars for water-scarce environments. Agric. Water Manage. 80, 197–211. doi: 10.1016/j.agwat.2005.07.013
Rui, C., Peng, F., Fan, Y., Zhang, Y., Zhang, Z., Xu, N., et al. (2022). Genome-wide expression analysis of carboxylesterase (CXE) gene family implies GBCXE49 functional responding to alkaline stress in cotton. BMC Plant Biol. 22, 194. doi: 10.1186/s12870-022-03579-9
Safi, H., Saibi, W., Alaoui, M. M., Hmyene, A., Masmoudi, K., Hanin, M., et al. (2015). A wheat lipid transfer protein (TdLTP4) promotes tolerance to abiotic and biotic stress in arabidopsis thaliana. Plant Physiol. Biochem. 89, 64–75. doi: 10.1016/j.plaphy.2015.02.008
Salvato, F., Loziuk, P., Kiyota, E., Daneluzzi, G. S., Araújo, P., Muddiman, D. C., et al. (2019). Label-free quantitative proteomics of enriched nuclei from sugarcane (Saccharum ssp) stems in response to drought stress. Proteomics 19, e01900004. doi: 10.1002/pmic.201900004
Sánchez, F. J., Manzanares, M., de Andres, E. F., Tenorio, J. L., Ayerbe, L. (1998). Turgor maintenance, osmotic adjustment and soluble sugar and proline accumulation in 49 pea cultivars in response to water stress. Field Crops Res. 59, 225–235. doi: 10.1016/S0378-4290(98)00125-7
Segura, V., Vilhjálmsson, B. J., Platt, A., Korte, A., Seren, Ü., Long, Q., et al. (2012). An efficient multi-locus mixed-model approach for genome-wide association studies in structured populations. Nat. Genet. 44, 825–830. doi: 10.1038/ng.2314
Shinozaki, K., Yamaguchi-Shinozaki, K., Seki, M. (2003). Regulatory network of gene expression in the drought and cold stress responses. Curr. Opin. Plant Biol. 6, 410–417. doi: 10.1016/S1369-5266(03)00092-X
Siddiqui, M. H., Al-Khaishany, M. Y., Al-Qutami, M. A., Al-Whaibi, M. H., Grover, A., Ali, H. M., et al. (2015). Response of different genotypes of faba bean plant to drought stress. Int. J. Mol. Sci. 16, 10214–10227. doi: 10.3390/ijms160510214
Skovbjerg, C. K. K., Angra, D., Robertson-Shersby-Harvie, T., Kreplak, J., Ecke, W., Windhorst, A., et al. (2022). Genetic analysis of global faba bean germplasm maps agronomic traits and identifies strong selection signatures for geographical origin. BioRxiv. doi: 10.1101/2022.07.18.500421
Smirnoff, N. (1995). “Antioxidant systems and plant response to the environment,” in Environment and plant metabolism: Flexibility and acclimation. Ed. Smirnoff, V. (Oxford: BIOS Scientific Publishers), 217–243.
Smogorzewska, A., de Lange, T. (2004). Regulation of telomerase by telomeric proteins. Annu. Rev. Biochem. 73, 177–208. doi: 10.1146/annurev.biochem.73.071403.160049
Stoddard, F. L., Balko, C., Erskine, W., Khan, H. R., Link, W., Sarker, A. (2006). Screening techniques and sources of resistance to abiotic stresses in cool-season food legumes. Euphytica 147, 167–186. doi: 10.1007/s10681-006-4723-8
Sugimoto, K. (2018). Branching the Tel2 pathway for exact fit on phosphatidylinositol 3-kinase-related kinases. Curr. Genet. 64, 965–970. doi: 10.1007/s00294-018-0817-9
Sun, M., Li, Y., Zheng, J., Wu, D., Li, C., Li, Z., et al. (2022). A nuclear factor y-b transcription factor, GmNFYB17, regulates resistance to drought stress in soybean. Int. J. Mol. Sci. 23(13):7242. doi: 10.3390/ijms23137242
Valdisser, P. A. M. R., Müller, B. S. F., de Almeida Filho, J. E., Morais Júnior, O. P., Guimarães, C. M., Borba, T. C. O., et al. (2020). Genome-wide association studies detect multiple QTLs for productivity in mesoamerican diversity panel of common bean under drought stress. Front. Plant Sci. 11. doi: 10.3389/fpls.2020.574674
VanRaden, P. M. (2008). Efficient methods to compute genomic predictions. J. Dairy Sci. 91, 4414–4423. doi: 10.3168/jds.2007-0980
Vessal, S., Arefian, M., Siddique, K. H. M. (2020). Proteomic responses to progressive dehydration stress in leaves of chickpea seedlings. BMC Genomics 21, 523. doi: 10.1186/s12864-020-06930-2
Wallace, S. S. (2014). Base excision repair: a critical player in many games. DNA Repair (Amst) 19, 14–26. doi: 10.1016/j.dnarep.2014.03.030
Wang, X., Khodadadi, E., Fakheri, B., Komatsu, S. (2017). Organ-specific proteomics of soybean seedlings under flooding and drought stresses. J. Proteomics 162, 62–72. doi: 10.1016/j.jprot.2017.04.012
Wang, N., Liu, Y., Cong, Y., Wang, T., Zhong, X., Yang, S., et al. (2016). Genome-wide identification of soybean U-box E3 ubiquitin ligases and roles of GmPUB8 in negative regulation of drought stress response in arabidopsis. Plant Cell Physiol. 57, 1189–1209. doi: 10.1093/pcp/pcw068
Wang, L., Zhang, X., Tang, Y., Zhao, T., Huang, C., Li, Y., et al. (2023). Exocyst subunit VviExo70B is degraded by ubiquitin ligase VviPUB19 and they regulate drought and salt tolerance in grapevine. Environ. Exp. Bot. 206, 105175. doi: 10.1016/j.envexpbot.2022.105175
Webb, A., Cottage, A., Wood, T., Khamassi, K., Hobbs, D., Gostkiewicz, K., et al. (2016). A SNP-based consensus genetic map for synteny-based trait targeting in faba bean (Vicia faba l.). Plant Biotechnol. J. 14, 177–185. doi: 10.1111/pbi.12371
Whittaker, J. C., Thompson, R., Denham, M. C. (2000). Marker-assisted selection using ridge regression. Genet. Res. 75, 249–252. doi: 10.1017/S0016672399004462
Wilsker, D., Patsialou, A., Dallas, P. B., Moran, E. (2002). ARID proteins: a diverse family of DNA binding proteins implicated in the control of cell growth, differentiation, and development. Cell Growth Differ. 13, 95–106.
Wong, G. R., Mazumdar, P., Lau, S.-E., Harikrishna, J. A. (2018). Ectopic expression of a musa acuminata root hair defective 3 (MaRHD3) in arabidopsis enhances drought tolerance. J. Plant Physiol. 231, 219–233. doi: 10.1016/j.jplph.2018.09.018
Wu, X., Sun, T., Xu, W., Sun, Y., Wang, B., Wang, Y., et al. (2021). Unraveling the genetic architecture of two complex, stomata-related drought-responsive traits by high-throughput physiological phenotyping and GWAS in cowpea (Vigna. unguiculata l. walp). Front. Genet. 12. doi: 10.3389/fgene.2021.743758
Xie, M., Wu, D., Duan, G., Wang, L., He, R., Li, X., et al (2014). AtWNK9 is regulated by ABA and dehydration and is involved in drought tolerance in Arabidopsis. Plant Physiol. Biochem. 77, 73–83. doi: 10.1016/j.plaphy.2014.01.022
Xu, Z.-Y., Lee, K. H., Dong, T., Jeong, J. C., Jin, J. B., Kanno, Y., et al. (2012). A vacuolar β-glucosidase homolog that possesses glucose-conjugated abscisic acid hydrolyzing activity plays an important role in osmotic stress responses in arabidopsis. Plant Cell 24, 2184–2199. doi: 10.1105/tpc.112.095935
Yang, Y., Wang, W., Chu, Z., Zhu, J.-K., Zhang, H. (2017). Roles of nuclear pores and nucleo-cytoplasmic trafficking in plant stress responses. Front. Plant Sci. 8. doi: 10.3389/fpls.2017.00574
Yemm, E. W., Willis, A. J. (1954). The estimation of carbohydrates in plant extracts by anthrone. Biochem. J. 57, 508–514. doi: 10.1042/bj0570508
Yoshida, R., Mori, I. C., Kamizono, N., Shichiri, Y., Shimatani, T., Miyata, F., et al. (2016). Glutamate functions in stomatal closure in arabidopsis and fava bean. J. Plant Res. 129, 39–49. doi: 10.1007/s10265-015-0757-0
Zhao, J., Bi, W., Zhao, S., Su, J., Li, M., Ma, L., et al. (2021). Wheat apoplast-localized lipid transfer protein TaLTP3 enhances defense responses against puccinia triticina. Front. Plant Sci. 12. doi: 10.3389/fpls.2021.771806
Zhou, G.-A., Chang, R.-Z., Qiu, L.-J. (2010). Overexpression of soybean ubiquitin-conjugating enzyme gene GmUBC2 confers enhanced drought and salt tolerance through modulating abiotic stress-responsive gene expression in arabidopsis. Plant Mol. Biol. 72, 357–367. doi: 10.1007/s11103-009-9575-x
Zhu, J.-K. (2002). Salt and drought stress signal transduction in plants. Annu. Rev. Plant Biol. 53, 247–273. doi: 10.1146/annurev.arplant.53.091401.143329
Zhu, C., Gore, M., Buckler, E. S., Yu, J. (2008). Status and prospects of association mapping in plants. Plant Genome J. 1, 5. doi: 10.3835/plantgenome2008.02.0089
Keywords: drought stress, GWAS, genetic diversity, faba bean, PCA, heritability, SNPs markers, candidate genes
Citation: Gutiérrez N, Pégard M, Balko C and Torres AM (2023) Genome-wide association analysis for drought tolerance and associated traits in faba bean (Vicia faba L.). Front. Plant Sci. 14:1091875. doi: 10.3389/fpls.2023.1091875
Received: 07 November 2022; Accepted: 16 January 2023;
Published: 01 February 2023.
Edited by:
Leif Skot, Aberystwyth University, United KingdomReviewed by:
Mohammed Ali Abd Elhammed Abd Allah, Desert Research Center, EgyptFouad Maalouf, International Center for Agricultural Research in the Dry Areas, Lebanon
Copyright © 2023 Gutiérrez, Pégard, Balko and Torres. This is an open-access article distributed under the terms of the Creative Commons Attribution License (CC BY). The use, distribution or reproduction in other forums is permitted, provided the original author(s) and the copyright owner(s) are credited and that the original publication in this journal is cited, in accordance with accepted academic practice. No use, distribution or reproduction is permitted which does not comply with these terms.
*Correspondence: Natalia Gutiérrez, bmF0YWxpYS5ndXRpZXJyZXoubGVpdmFAanVudGFkZWFuZGFsdWNpYS5lcw==