 Marcelo Rodrigues Barbosa Júnior1,2*†
 Bruno Rafael de Almeida Moreira1†
 Romário Porto de Oliveira1
 Luciano Shozo Shiratsuchi2
 Rouverson Pereira da Silva1
- 1Department of Engineering and Mathematical Sciences, School of Agricultural and Veterinarian Sciences, São Paulo State University (Unesp), São Paulo, Brazil
- 2AgCenter, School of Plant, Environmental and Soil Sciences, Louisiana State University, Baton Rouge, LA, United States
Predicting sugarcane yield by quality allows stakeholders from research centers to industries to decide on the precise time and place to harvest a product on the field; hence, it can streamline workflow while leveling up the cost-effectiveness of full-scale production. °Brix and Purity can offer significant and reliable indicators of high-quality raw material for industrial processing for food and fuel. However, their analysis in a relevant laboratory can be costly, time-consuming, and not scalable. We, therefore, analyzed whether merging multispectral images and machine learning (ML) algorithms can develop a non-invasive, predictive framework to map canopy reflectance to °Brix and Purity. We acquired multispectral images data of a sugarcane-producing area via unmanned aerial vehicle (UAV) while determining °Brix and analytical Purity from juice in a routine laboratory. We then tested a suite of ML algorithms, namely multiple linear regression (MLR), random forest (RF), decision tree (DT), and support vector machine (SVM) for adequacy and complexity in predicting °Brix and Purity upon single spectral bands, vegetation indices (VIs), and growing degree days (GDD). We obtained evidence for biophysical functions accurately predicting °Brix and Purity. Those can bring at least 80% of adequacy to the modeling. Therefore, our study represents progress in assessing and monitoring sugarcane on an industrial scale. Our insights can offer stakeholders possibilities to develop prescriptive harvesting and resource-effective, high-performance manufacturing lines for by-products.
1 Introduction
Sugarcane (Saccharum spp.) is a semi-perennial grassy crop. Such a crop offers the global agriculture and bioeconomy sector possibilities to fabricate food, fuel, and feed (Barbosa Júnior et al., 2022a). It is a world-leading source of sugar for human consumption. In addition, it represents one of the most relevant renewable resources for bioenergy production, making it strategic for sustainable development (Yang et al., 2021). Full-scale fields across sugarcane-producing countries often yield 55 tons of stalk per hectare. Approximately 10–20% of its proximate composition is sucrose, while fiber contributes 10–15%, depending on technology and management (Hithamani et al., 2018; Sreedevi et al., 2018; Yang et al., 2019).
As sugarcane grows, it synthesizes and stores sugars throughout its structure to maintain physiological functions and overcome stresses (e.g., drought, salinity, and heat) under harsher conditions. however, it can significantly accumulate photo-assimilates only at maturity, which occurs between 10 and 18 months after planting, depending on genotype-environment interactions (Hithamani et al., 2018; Sreedevi et al., 2018; Yang et al., 2019). A mature plant can reflect the maximum incident solar radiation through the canopy, allowing its monitoring by a reflectance sensor. However, if it is over-mature or at flowering, its respiration increases. As a result, net photosynthesis and available sucrose in the stalk decrease, driving the need to determine an optimal time to harvest cost-effective material for industrial processing (Khan et al., 2022; Misra et al., 2022).
Chlorophylls are primary light-harvesting pigments. They can provide reliable indicators of the physiological conditions of a crop, such as sugarcane (Barbosa Júnior et al., 2022b). Therefore, evaluating them for fluorescence or measuring canopy reflectance can offer stakeholders possibilities to map and monitor the conversion of radiant energy to sucrose during ripening (Khan et al., 2022; Misra et al., 2022). In regular mechanical harvesting plans, staff estimates the degree of maturity by measuring °Brix and Purity. Such an intervention is effective; however, it can be costly, laborious, and time-consuming. In addition, it can be invasive, as it requires collecting stalks for juice extraction and technological analysis. An alternative to conventional sampling would be remote sensing. The technology can accurately and realistically capture spectral information without subjectiveness and destruction (Barbosa Júnior et al., 2022b).
By reviewing the literature on remotely sensing sugarcane, the system-level study by Bégué et al. (2010) can provide valuable information about the technical viability of forecasting sugarcane yield and sugar content upon imagery data. The authors integrated biometric measures and satellite time series into a framework. Then they tested its ability to model the spatio-temporal variability of those variables. Stages as late as maturation offered better phenological conditions to acquire multispectral images on the field than sprouting and tillering; hence, they allowed the most accurate forecasting of biomass yield and sugar content upon normalized difference vegetation index (NDVI). They developed other applicable predictors than NDVI, such as R, G, B, NIR, and SWIR. More importantly, they enhanced the performance of such single spectral bands and (VIs) by combining them with the leaf area index (LAI), supporting their hypothesis. However, their approach can require extensive radiometric inter-calibration to function. In addition, the remote sensing platform they employed to acquire data depends on the weather, driving the need to research a low-altitude crop-sensing device with a higher revisiting capacity.
Chea et al. (2020) analyzed whether an unmanned aerial vehicle (UAV) could acquire aerial remote sensing data to predict °Brix, Pol, and fiber. The authors mounted a multispectral sensor (R, G, B, NIR, and RedEdge) onboard equipment to develop a more detailed mission and calculate a suit of VIs, such as green normalized difference vegetation index (GNDVI), ratio vegetation index (RVI), chlorophyll index–green (CIG), chlorophyll index–rededge (CIRE), and simple ratio pigment index (SRPI), as alternatives to NDVI since it is sensitive to environmental noises (e.g., background brightness). Moreover, they added information about drought-tolerant and flood-tolerant genotypes to the biophysical modeling to improve the addressability of their approach. Models involving CIRE predicted °Brix and Pol most accurately (0.7< R2< 0.85). They could work better on processing data from a tolerant-drought field. However, they could not predict °Brix and Pol upon imagery data on a flood-tolerant area as accurately as those functions containing SRPI.
In a more recent publication, Chea et al. (2022) demonstrated the significance of machine learning (ML) algorithms to improve predicting °Brix on multiple-source data (i.e., agronomic, climatic, and spectral). The authors brought further information about the crop (i.e., size and age) and weather (i.e., precipitation) into the biophysical modeling to advance their research. Gradient boosting (GB) outperformed lasso, support vector machine (SVM), and random forest (RF) in describing °Brix upon spectral modifications in the canopy. It developed 70% accuracy and 3.3°Brix precision at processing only VIs, such as CIRE, green leaf index (GLI), and photosynthetic vigor ratio (PVR). However, combining these spectral predictors with agronomic and climate data could optimize its robustness (0.8< R2< 0.9; RMSE = 2.8°Brix). Therefore, UAV and ML could be enablers in soluble solids (SS) as indicators of maturity in sugarcane. However, Purity could offer a more reliable marker than °Brix in mapping and monitoring saccharification. It describes the proportion of sucrose the juice contains and is an indicator of raw material degradation during the cut-to-crush time and industrial processing efficiency.
Therefore, we analyzed whether ML algorithms could predict °Brix and Purity upon multispectral UAV imagery data for precision mechanical harvesting of material with higher quality.
2 Material and methods
2.1 Site description and field data collection
We carried out our study in a sugarcane field located near the city of Jaboticabal, São Paulo, Brazil (Figure 1). The region has an Oxisol type soil with low slope (0 - 8%). The climate of the region is of type Aw with a summer dry season. Annually, rainfall reaches about 1460 mm and the average temperature is 22.6°C. We conducted our study with the cultivar RB 97-5201 in sixth ratoon. We performed 8 samplings throughout the maturity stage of the crop (beginning February 28 and ending May 8, 2022) with an interval between samplings of 15 days. In each analysis, data were collected at 30 sample points regularly distributed (9 x 9 m grid) and spaced 2 m apart (Figure 1). On evaluation days we captured images with UAV and randomly collected 4 stalks at each sample point. In total, our dataset was composed of 240 samples (30 samples x 8 dates). The images were processed and the stalks were sent to the laboratory for analysis of °Brix and Purity contents. Additionally, we included growing degree days (GDD) information to establish functional relationships with crop phenology.
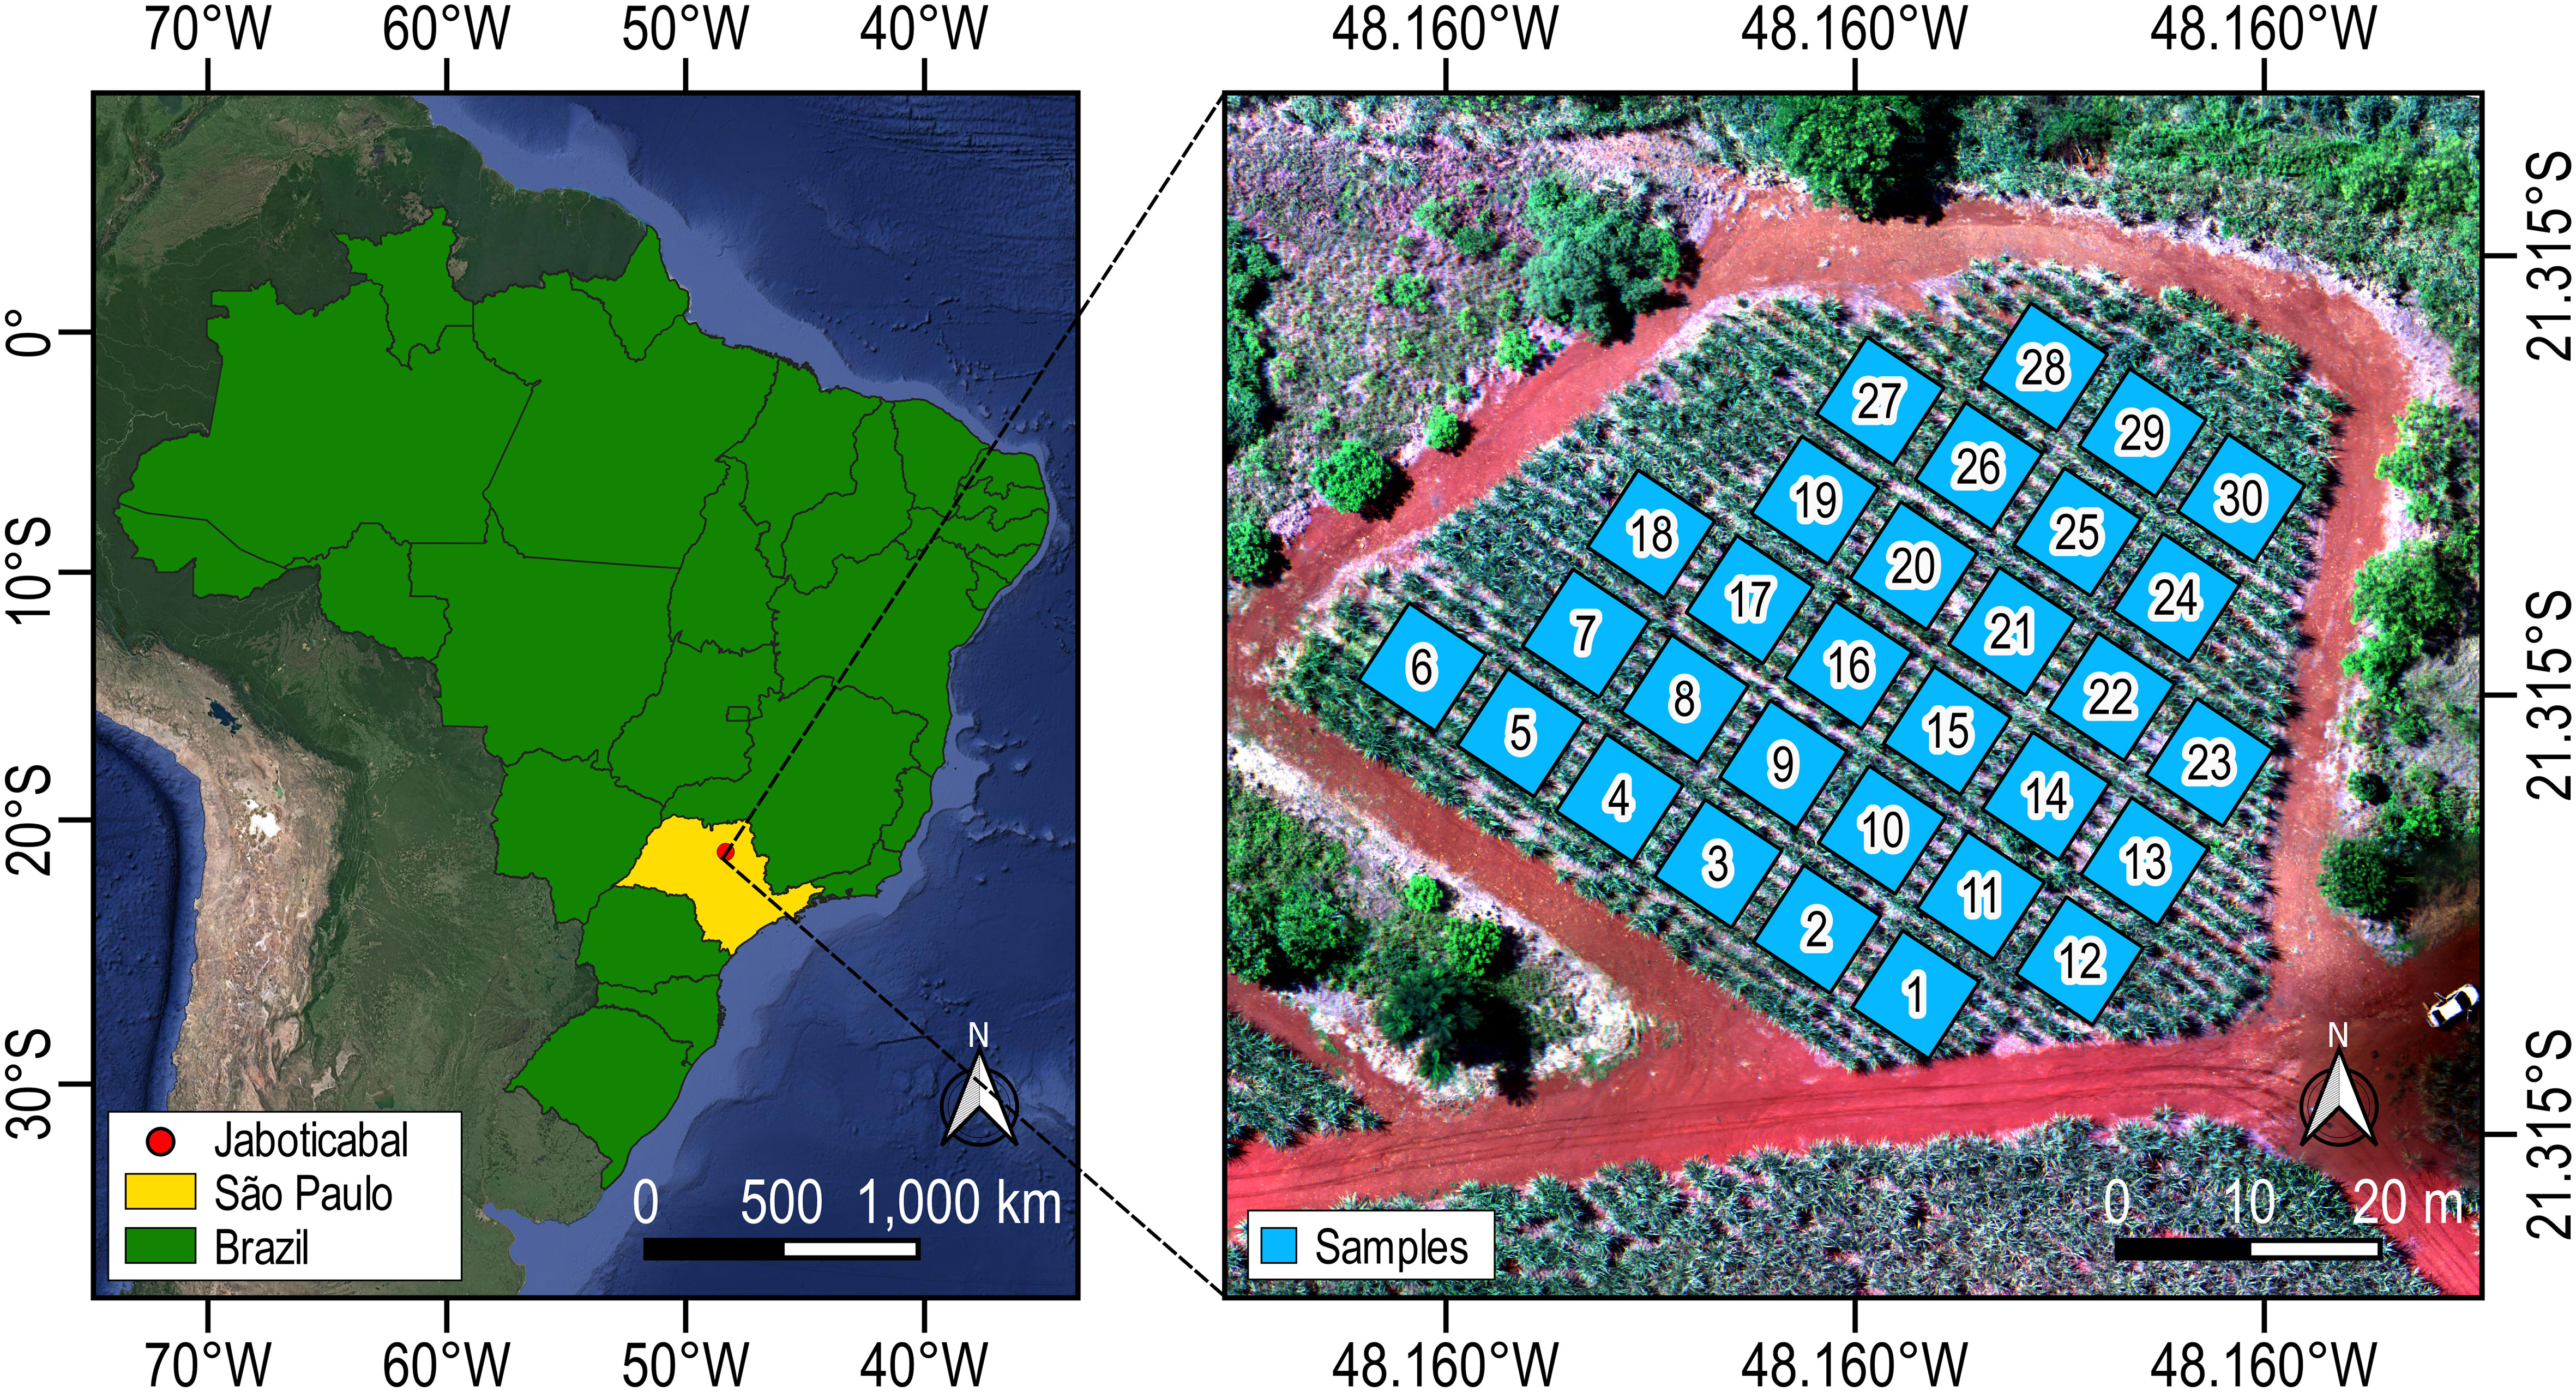
Figure 1 Brazil map highlighting the study region (left). UAV orthomosaic of the study field with sample plots for field and spectral data collection (right).
2.2 Flight campaign and spectral features collection
A multirotor UAV (DJI Phantom 4 Multispectral RTK, Shenzhen, China) was used as the remote sensing platform in this study. The UAV is equipped with a multispectral camera that has five spectral bands, namely Blue (450 nm ± 16 nm), Green (560 nm ± 16 nm), Red (650 nm ± 16 nm), RedEdge (730 nm ± 16 nm), and NIR (840 nm ± 26 nm). The UAV has a sunlight sensor on top to compensate for incident solar radiation during flight and ensure that spectral data are consistent. In addition, it is equipped with a multi-frequency GNSS receiver (DJI D-RTK2 base Station, Shenzhen, China) able to receiver signals from constellation namely GPS, GLONASS, BeiDou, and Galileo, ensuring centimeter positional accuracy, making it possible to acquire temporal data from the same point. The flight missions were performed automatically by application (DJI GS Pro, Shenzhen, China). Flight settings and parameters are described in Table 1.
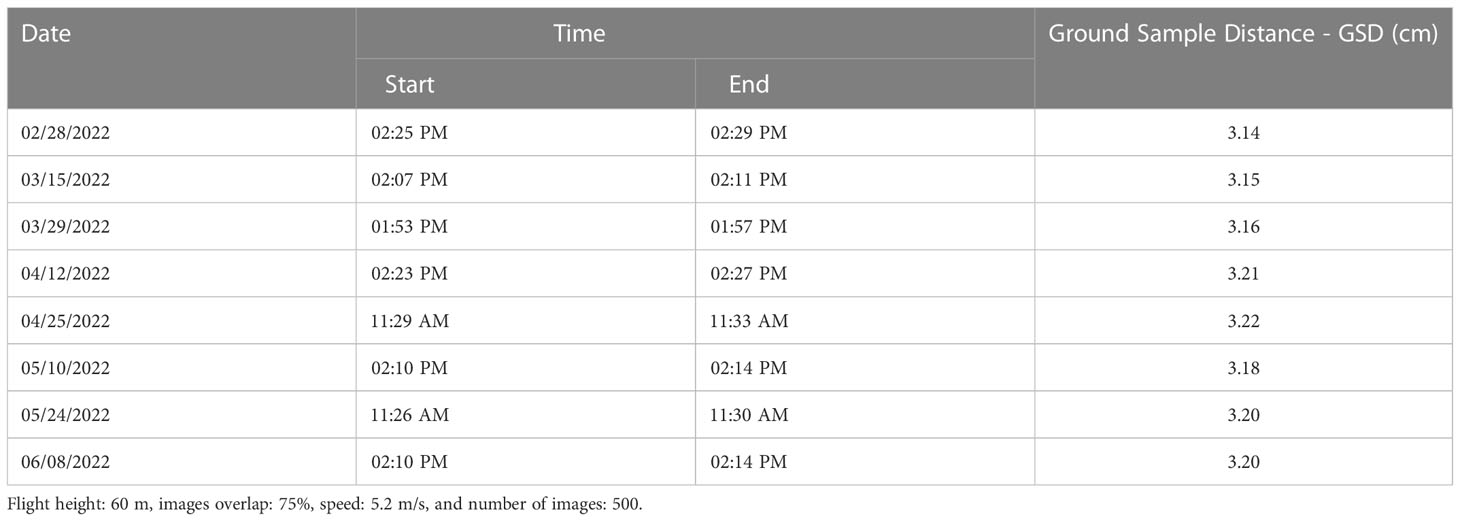
Table 1 Flight guideline and specifications.
The images were stitched using Structure from Motion (SfM) software (Agisoft Metashape Professional 1.5.5, Agisoft, St. Petersburg, Russian) to generate 8 multispectral orthomosaics. To extract the spectral information and calculate the vegetation indices (Table 2) we used the open-source package “FIELDimageR” (Matias et al., 2020); in the programming language R (version 4.1.0).
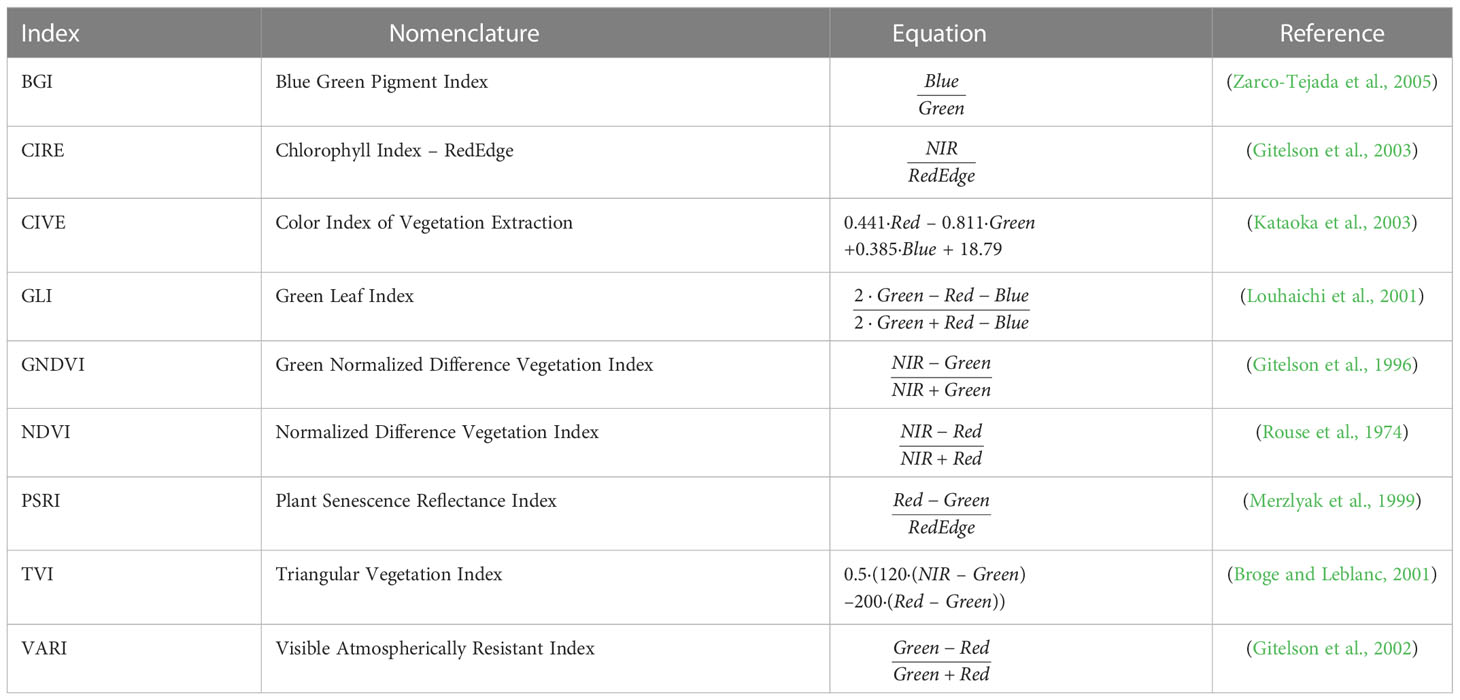
Table 2 Vegetation indices used in this study.
2.3 Laboratory analysis
After the collection of stalks in the field, they were properly identified and taken to the laboratory to determine the quality parameters °Brix and Purity. Initially, the stalks from each sample point were processed individually in a hydraulic press for juice extraction. We used the juice to measure the °Brix content by digital refractometer (ABBE, Atago Pal-1, Tokyo, Japan) and recorded the value corrected to a temperature of 20°C. To measure Purity, we followed the methodology proposed by Consecana (2006). We diluted 10g of clarifying substance based on aluminum chloride in 200 mL of juice. The solution was filtered and the measured value was recorded using a polarimeter (Anton Paar, Bremen, Germany). To determine purity we used Equations 1, 2, and 3.
Where, LPb is the polarimetric reading equivalent to lead subacetate, LAI is the polarimetric reading with aluminum chloride, and %Pol is the apparent sucrose content.
2.4 Data analysis
2.4.1 Data curation
A total of 15 independent variables (including GDD, five spectral bands and nine VIs) were used as input to the °Brix and Purity prediction models. For the data to faithfully represent the field truth, we applied the interquartile range method to remove outliers from the dataset. Thus, the length of our dataset was reduced from 240 to 223. Then the dataset was randomly divided into subsets with 70% (156) and 30% (67) for train and test, respectively. Since we constructed our dataset with 15 predictor variables for °Brix and Purity, we decided to apply the best subsets regression function from the open-source package “olsrr” (Neter et al., 1996), in the programming language R (version 4.1.0), to select the best features for predicting °Brix and Purity. The best subsets regression is a selection approach that consists of testing all possible combinations of the predictor variables and then selecting the best among them to constitute a future model. This technique can effectively select the independent variables that contribute significantly to the change in a dependent variable. The features selection was done based on the coefficient of determination (R²) and mean squared error of prediction (MSEP).
2.4.2 Machine learning algorithms
To model the contents of °Brix and Purity we chose 4 ML regression algorithms, namely multiple linear regression (MLR), random forest (RF), decision tree (DT) and support vector machine (SVM). These algorithms are widely used because they produce high accuracy results, solve problems on relatively small database sizes and handle a large number of input features. All analyses were performed in the programming language R (version 4.1.0) using the packages “stats” (Wilkinson and Rogers, 1973), “randomForest” (Breiman, 2001), “rpart” (Breiman et al., 1984); and “e1071” (Rong-En et al., 2005); for the algorithms described above, respectively. Hyperparameters are described in Supplementary Table 1.
2.4.3 Model evaluation and validation
The fit of the models was evaluated according to the coefficient of determination (R²), root mean square error (RMSE) and mean absolute error (MAE) applied to the test dataset. The closer the R² value is to 1, the more precise. In contrast, the closer the RMSE and MAE values are to 0, the more accurate the model.
3 Results
3.1 Spatio-temporal evolution of °Brix and Purity
We mapped the dynamic ripening on biometric data (Figures 2 and 3). As the crop ripened, it accumulated SS in the stalk; hence, the °Brix (Figure 2) and Purity (Figure 3) of analytical juice increased temporally and spatially. For instance, °Brix initially was 12.8 ± 2.5. Such a measure of SS then rose to 14 ± 1.7 at the 2nd evaluation. Additionally, we measured 14.4 ± 2.1°Brix from samples of the 3rd collection, supporting a field at early maturity and still unsuitable for cost-effective harvesting. As the elongation occurred, however, the °Brix increased significantly. Therefore, its values for the 4th and 5th survey-level evaluations were 16.9 ± 2.1 and 17.9 ± 1.6, respectively. Summarily, sugarcane developed the highest °Brix of 19.7 ± 0.9 at the 7th evaluation.
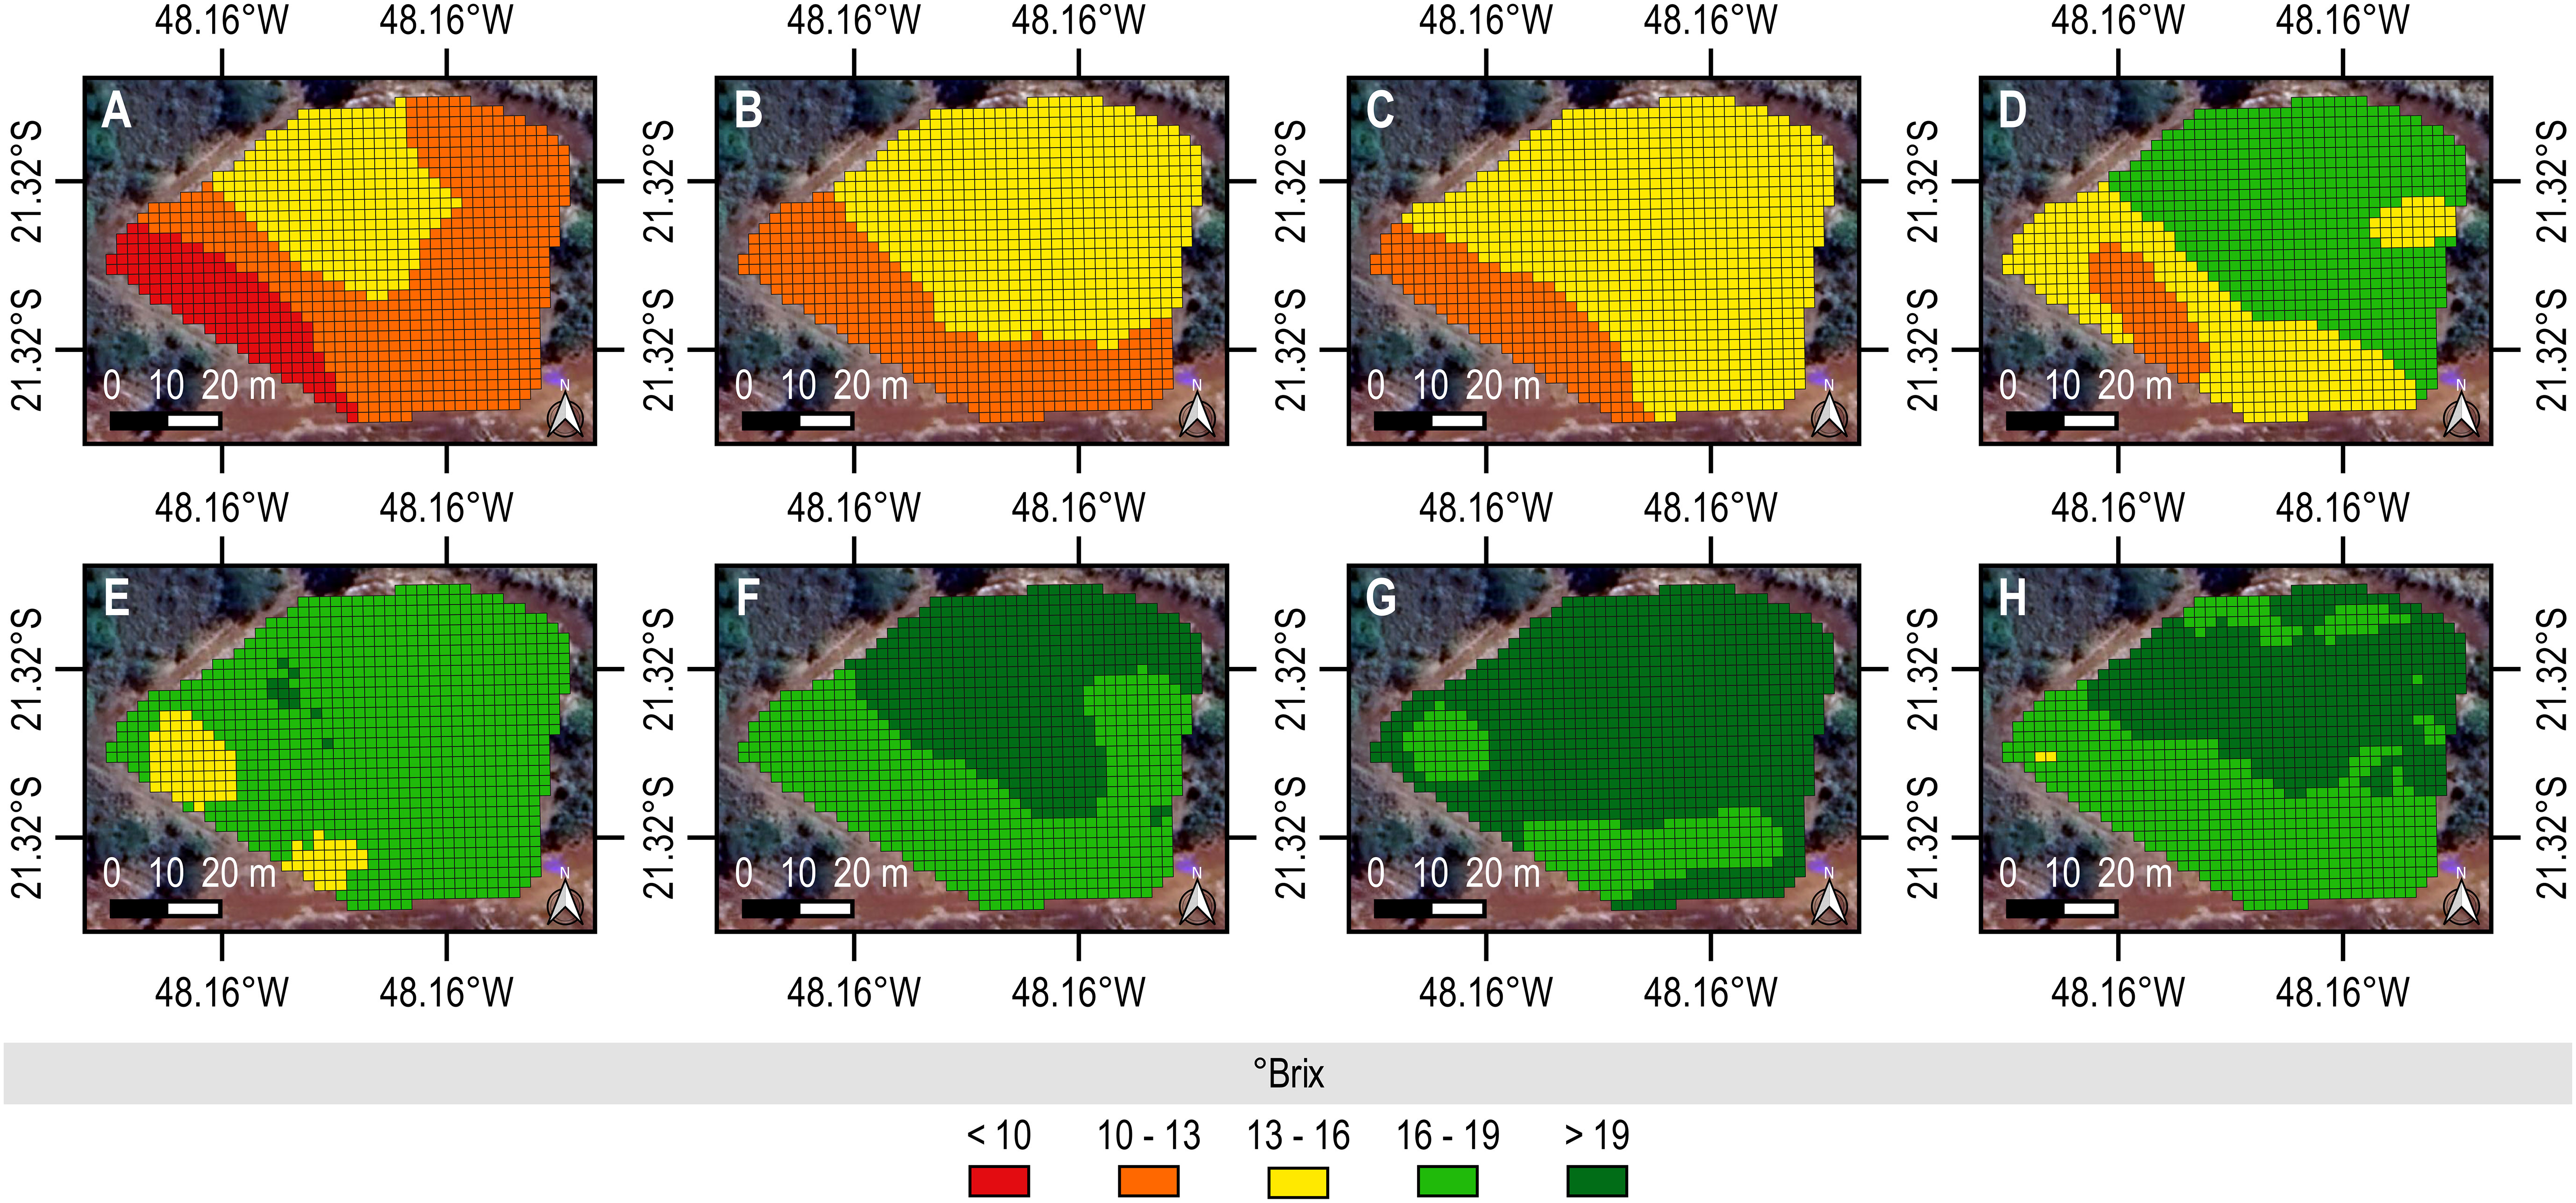
Figure 2 Spatio-temporal mapping of °Brix from ground-level biometric data. The values upscale as the color changes from scarlet to emerald. In addition, sublevel charts provide digital representations of sampling dates. (A) was the first data collection and (H) was the last data collection. The reference data set was used to construct the maps by the ordinary kriging interpolation method (2 x 2 m) performed in the QGIS (version 3.22.5) using the “Smart-Map” plugin (Pereira et al., 2022).
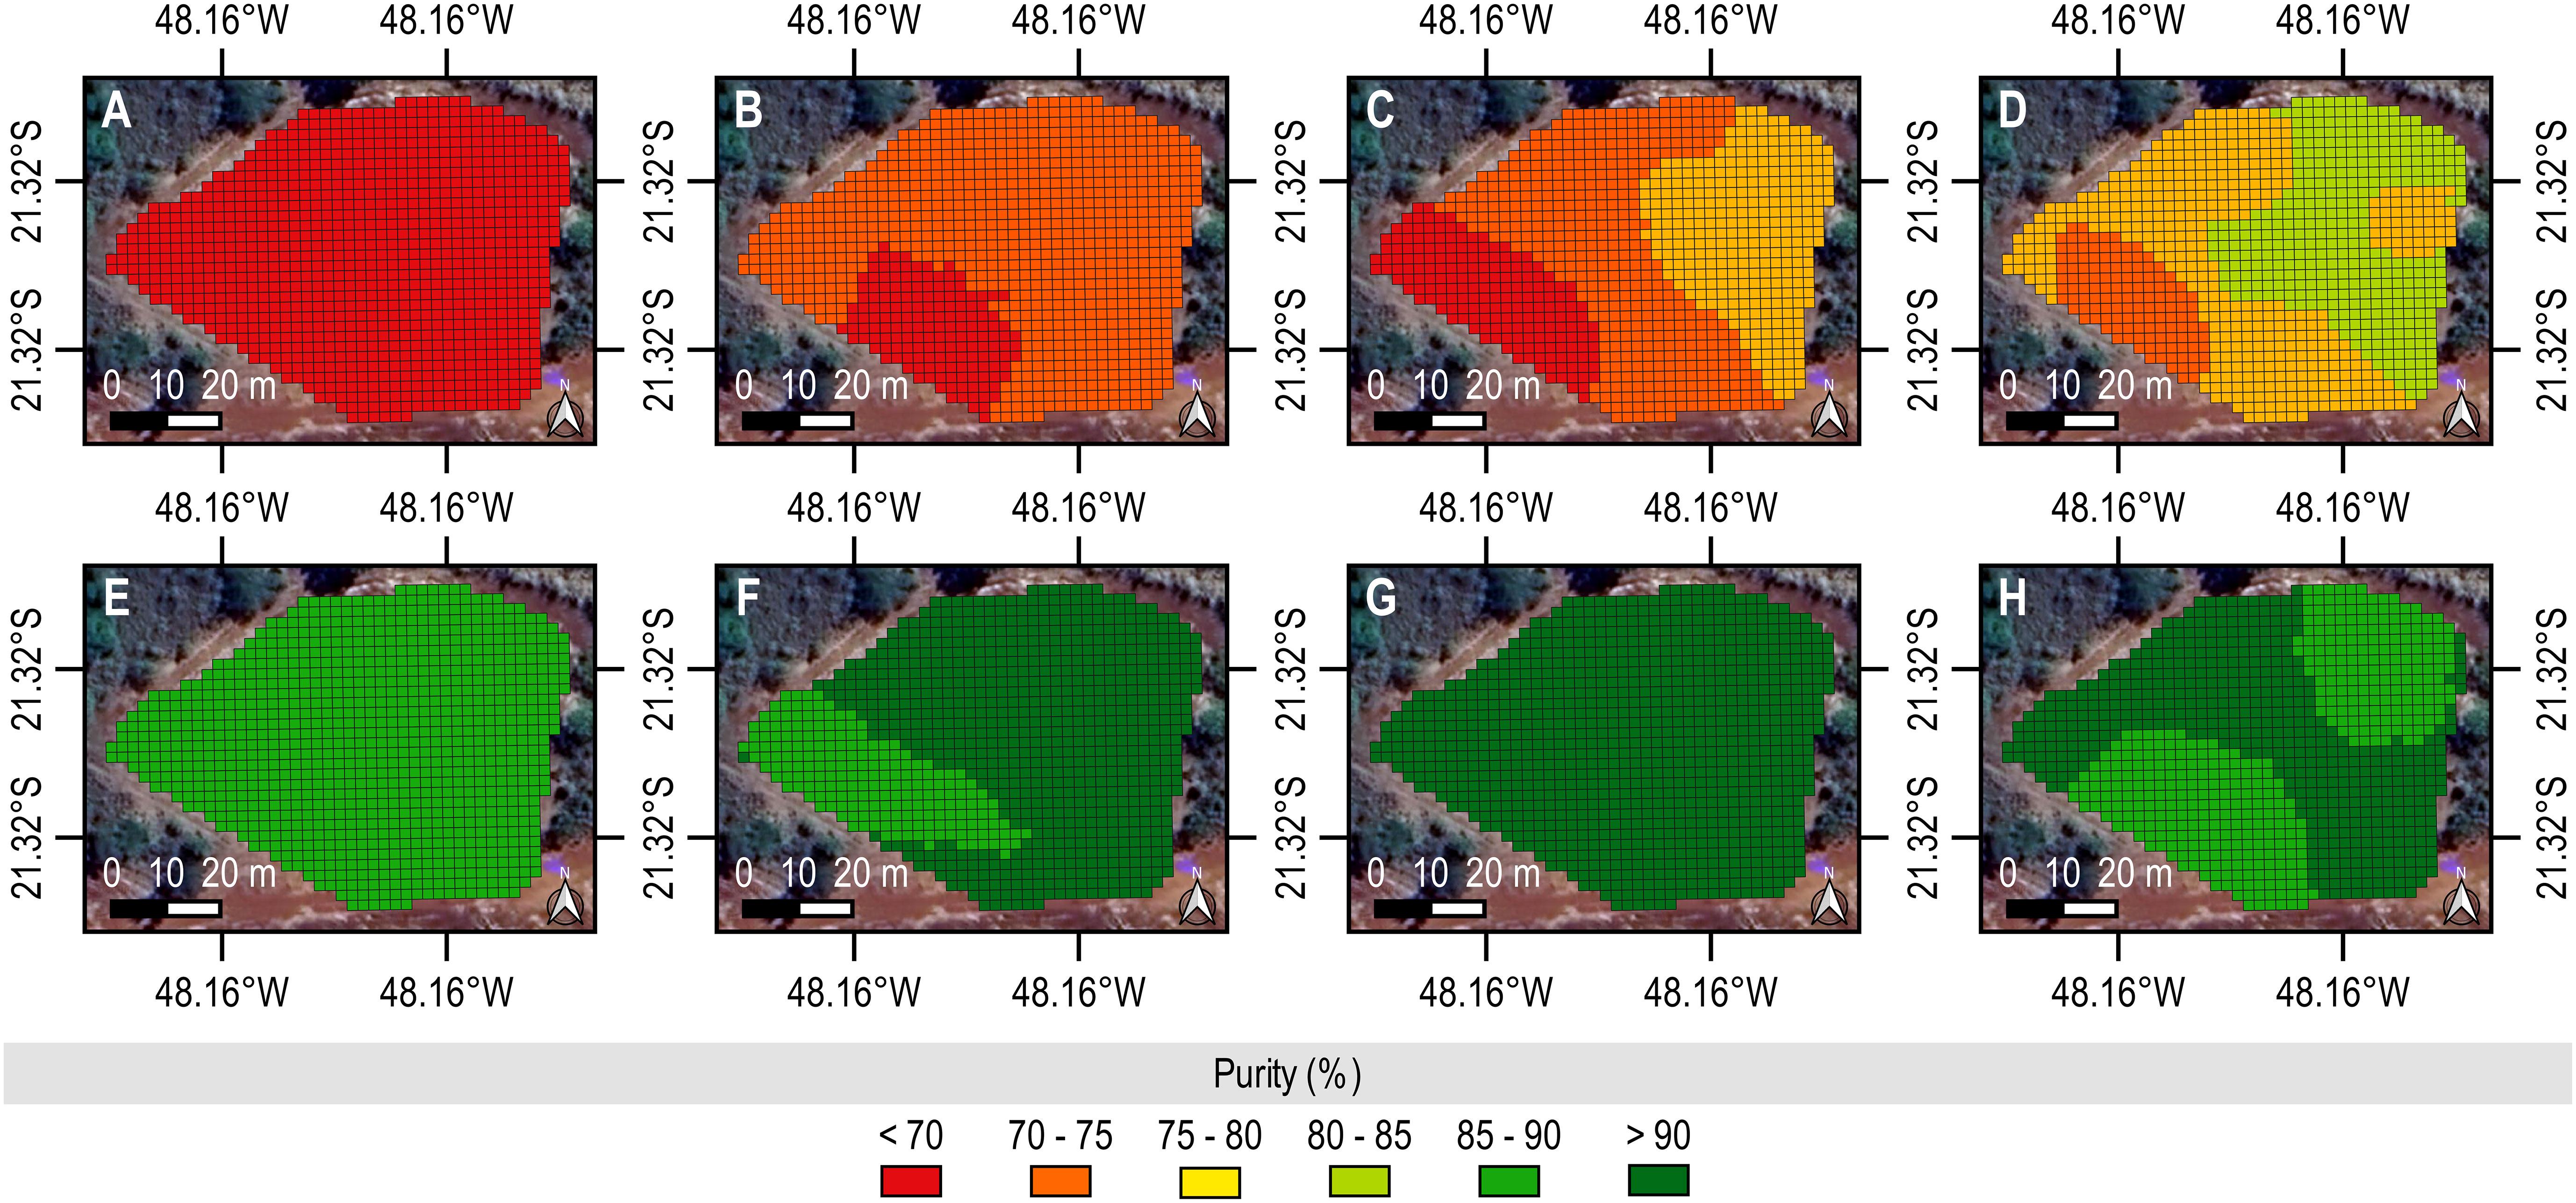
Figure 3 Spatio-temporal mapping of Purity from ground-level biometric data. The values upscale as the color changes from scarlet to emerald. In addition, sublevel charts provide digital representations of sampling dates. (A) was the first data collection and (H) was the last data collection. The reference data set was used to construct the maps by the ordinary kriging interpolation method (2 x 2 m) performed in the QGIS (version 3.22.5) using the “Smart-Map” plugin (Pereira et al., 2022).
We identified a similar trend to Purity. The crop produced 80–85% pure juice until the 4th evaluation. Later, in the 7th evaluation, however, the measure for this technological feature exceeded 90%, supporting an optimal Pol/SS ratio for high-quality harvesting. More importantly, its distribution throughout the field was homogeneous, further supporting the suitability of such a phenological stage for standard operation and precision crop management. A decreasing proportion of the area with the highest °Brix and Purity at the 8th evaluation could make the recovery of adequate raw material (sucrose) for industrial processing difficult, driving the need to determine the most reliable time to intervene in the field. Therefore, by analyzing the spatio-temporal variability of such indicators of qualitative yield, we must plan to harvest the sugarcane at the 7th evaluation. However, we could act earlier since 50–70% of the area produced a raw material with 18–19°Brix and 85–90% purity at the 6th evaluation.
3.2 Selecting spectral predictors of °Brix and Purity
We selected spectral features to predict °Brix and Purity by applying regression analysis to remote sensing data (Figure 4). A spectral band or VI capable of predicting °Brix could not provide an accurate predictor of Purity and vice versa, supporting structural input-to-output dependencies and particularities of such indicators of qualitative yield. For instance, Blue, Red, and NIR contributed to developing an adequate ten-input predictive model for °Brix. However, they could not function as accurately as Green and PSRI in predicting Purity through a topologically less complex function consisting of seven predictors (Table 3). Such a single band and VI contributed to bringing an R2 of 0.85 into the biophysical modeling for Purity, while the adequacy for those above at predicting °Brix was 0.65, making them less accurate.

Figure 4 Best Subsets Regression performance to predict °Brix and Purity (%).
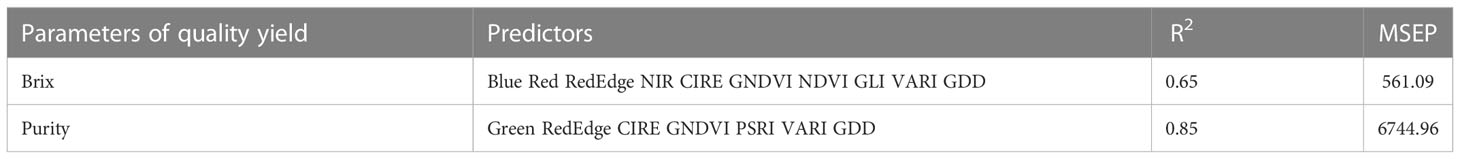
Table 3 Best predictors of °Brix and Purity upon imagery data.
By analyzing MSEP, however, we could recognize a lower predictive error from such a brix-fitting model, making it more precise. In addition, the more inputs, the higher the accuracy and precision of a polynomial function (Figure 4); however, its complexity can increase, potentially forcing an ML algorithm to misfit data through either underfitting or overfitting a trend. A higher number of inputs usually implies a higher degree of freedom; hence, a model becomes more robust and probable to reject a false hypothesis and produce significant output. However, further increasing the number of predictors could not increase precision (Supplementary Table 2 and 3), supporting the occurrence of multicollinearity or correlation between them (Supplementary Figure 1). Mutual relationships commonly reduce predictive performance in statistical modeling, driving the need to re-design or exclude part of them (Lindner et al., 2022). However, if stakeholders understand the role of independent variables, constraining them in an ML model to reduce multicollinearity is unnecessary. In such a case, it can neither determine exactness and generalization nor result in misinterpretation and misinformation (Lindner et al., 2022). Therefore, balancing adequacy and complexity is significant in addressing the biophysical modeling of °Brix and Purity upon imagery data without computational unfeasibility.
3.3 Performance of machine learning models at predicting °Brix and Purity upon imagery data
Machine-learning models effectively estimated °Brix (Figure 5) and Purity (Figure 6) by processing biometric and remote sensing data. They were as precise as accurate, allowing the selection of a non-linear function to best describe qualitative yield, logically, irrespective of the indicator. Random forest brought the highest R2 into the biophysical modeling for °Brix; hence, it qualified as the most accurate algorithm. In addition, SVM estimated such a measure of SS as accurately and precisely as RF, outperforming both MLR and DT. These approaches developed the least accuracy and precision as ten-input regressors.
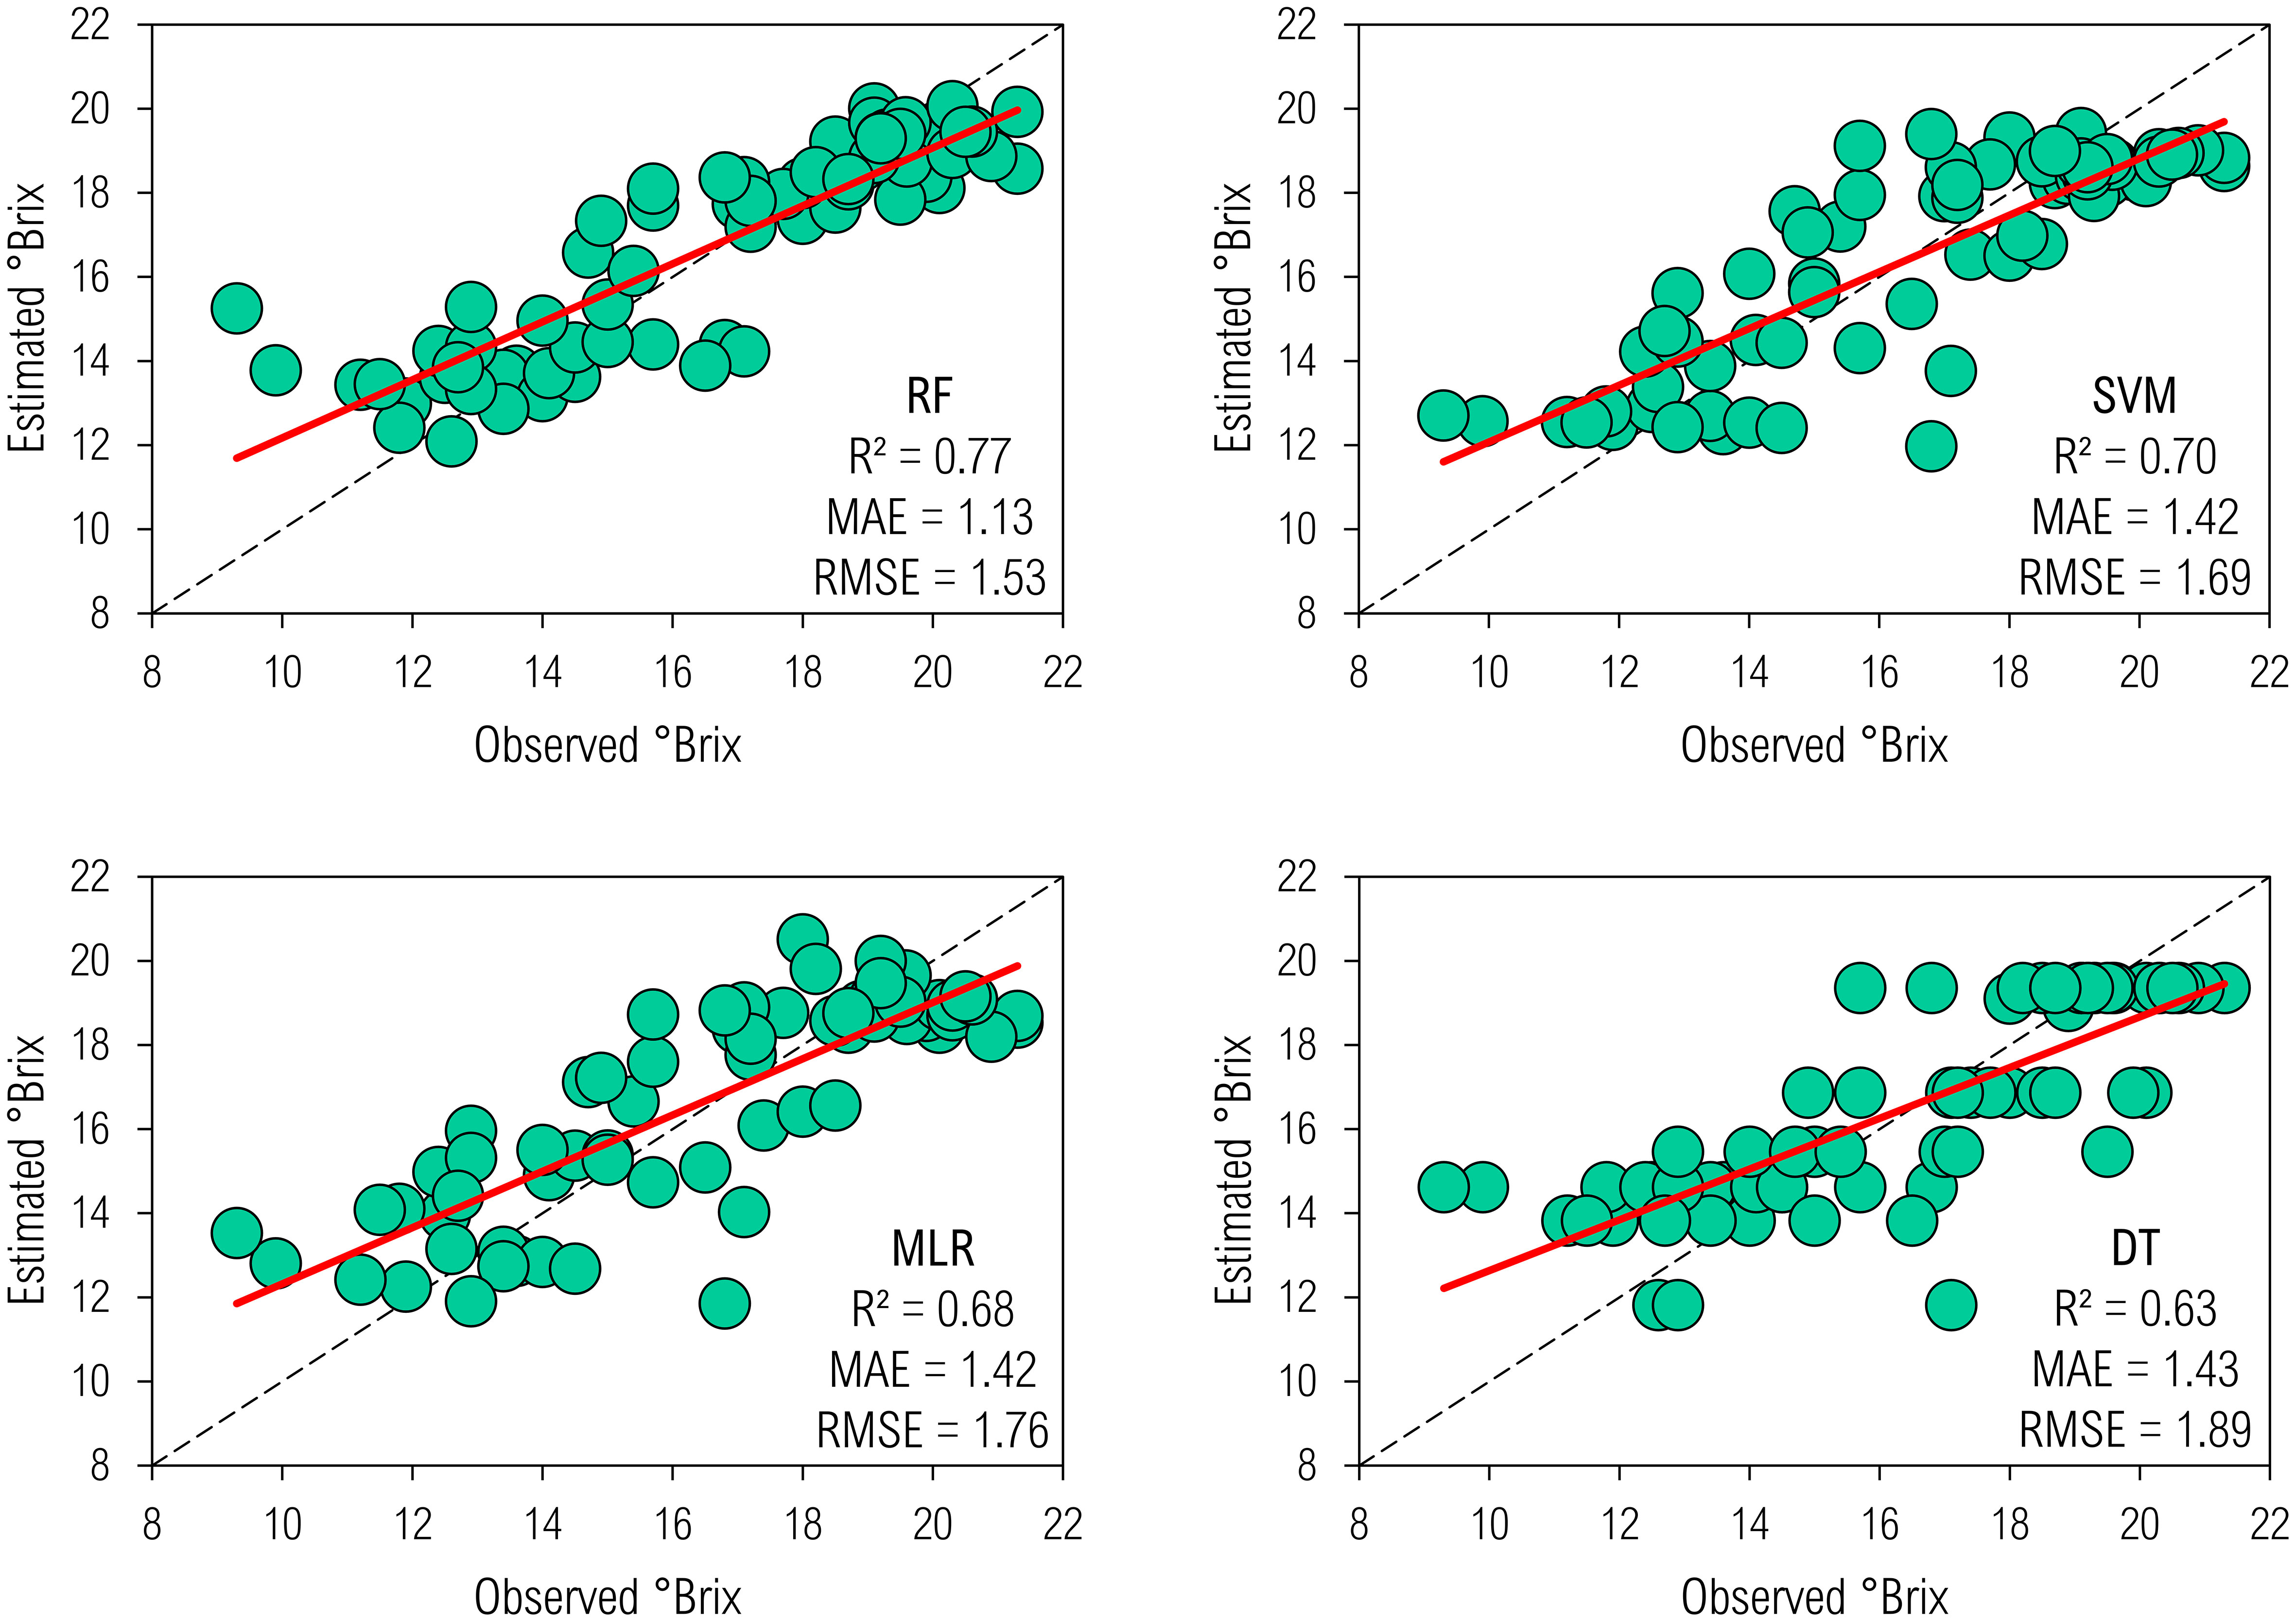
Figure 5 Biophysical modeling of °Brix by machine-learning regressors.
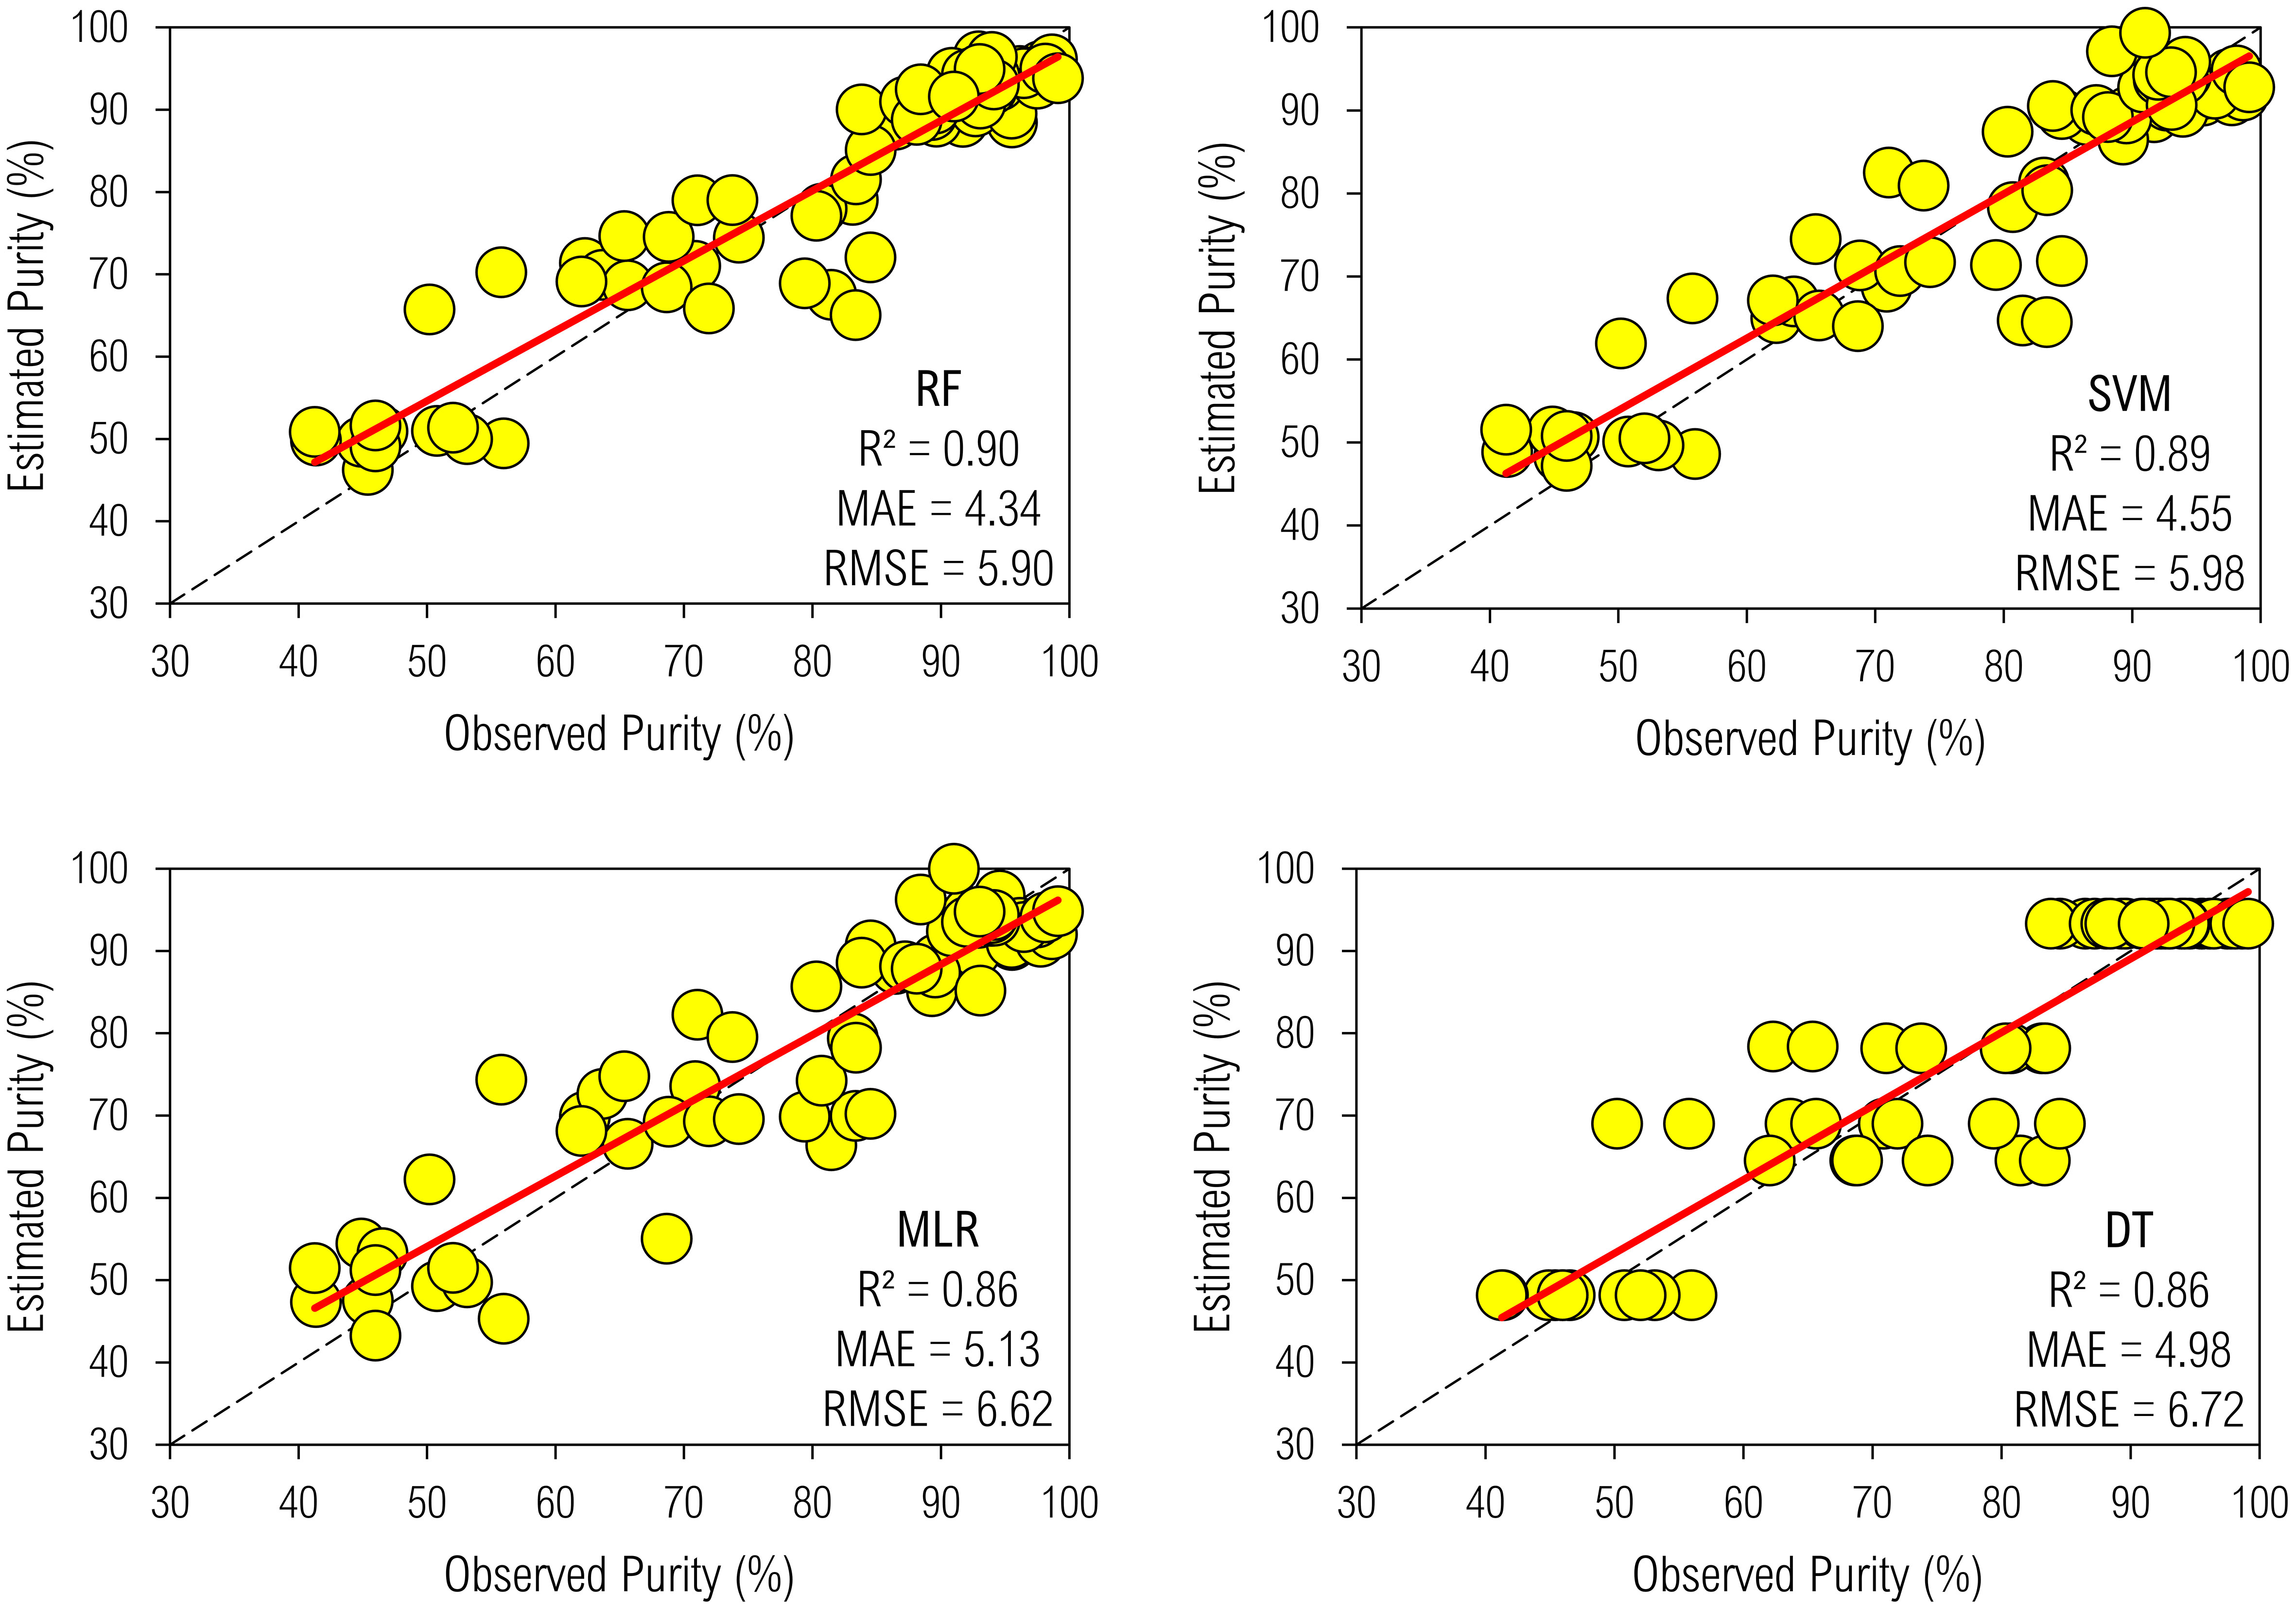
Figure 6 Biophysical modeling of Purity by machine-learning regressors.
We obtained mathematical descriptions with higher precision for Purity since estimates of R², MAE, and RMSE were 0.85–0.9, 4.3–5.1%, and 5.9–6.7%, respectively; the ranges of these metrics for ML models predicting °Brix were 0.6–0.8, 1.1–1.4%, and 1.5–1.9%, respectively. Therefore, compared to Purity, such an indicator of the technological quality of juice added more systematic errors in the modeling, reducing exactness; however, it could not necessarily decrease correctness, which is another part of robustness. Random forest most accurately and precisely predicted not only °Brix but also Purity, further supporting its outperformance at learning on spatio-temporal data to map a series of spectral inputs to an agronomic output. Its predictive metrics were 0.9 R², 4.6% MAE, and 6% RMSE. Additionally, MLR and DT described the Purity at an equal level of adequacy. However, DT outperformed the MLR in supporting a seven-input model to predict Purity.
4 Discussion
4.1 Spatio-temporal evolution of °Brix and Purity and its implications to precision harvesting
As sugarcane ripens, it accumulates sugars in organs throughout its structure, such as leaves, stalks, and roots. However, as it grows and develops vegetatively and reproductively, it significantly consumes them to sustain its physiological functions (Khan et al., 2022). In advanced phenological stages, it transports photoassimilates from older (or senescent) leaves to younger parts, such as the stalk in its parenchymal cells and vacuoles (Misra et al., 2022). While these compartments act as sucrose reservoirs in a mature plant, the flowering can manifest as a sink in an over-mature plant, decreasing its content. We could reproduce and visualize these dynamics on maps of °Brix (Figure 2) and Purity (Figure 3). We quantified the highest quantity of SS from samples of the 7th evaluation; hence, they produced the purest juice. However, °Brix and Purity decreased as the field started flowering at the 8th evaluation. In addition, stalks became more fibrous, supporting “isoporization” (Morais et al., 2015). Such a phenomenon indicates a reduction in water and sugar, making harvesting inefficient and costly (Poltroniere et al., 2021). By monitoring the field and mapping °Brix and Purity, we can offer stakeholders possibilities to optimize their on-farm management and agribusiness models.
Stakeholders usually rely on sugary substrates to recover sugarcane from the field cost-effectively. °Brix provides a reliable measure of SS in material, while Purity indicates the portion of sugar it contains. Therefore, both are significant technological features for farmers and sugar-energy plants to decide on activities and processes. Raw material with high °Brix and Purity is desirable for commercialization. However, if it excessively consists of minerals and sugars other than sucrose, such as glucose and fructose, its Purity becomes lower than usual, making harvesting and industrial processing challenging. Relevant standardization bodies of the sugar-energy sector in Brazil and abroad set °Brix and Purity to be higher than 18 and 85%, respectively, for economically sustainable mechanical harvesting. Sugarcane can develop such optimal values before or at physiological maturity. However, as it is a semi-perennial grass, it continues to vegetate during ripening; hence, these indicators of qualitative yield decrease nonlinearly over time and spatially, as evidenced by our prescriptive maps (Figures 2 and 3). Prospective producers who search for precision farming support systems can ground their analytical (not empirical) decisions and actions in these digital representations of an experimental field. Perhaps, they harvest material for making food and fuel with higher accuracy and better quality while optimizing workflow.
4.2 Relationships between spectral features and indicators of qualitative yield
Spectral features offer stakeholders reliable markers to monitor and map crops. They respond to modifications in nutritional composition (Shendryk et al., 2020), accumulation of biomass (Abebe et al., 2022), and physiological events of maturation (Chea et al., 2020). Single bands and their mathematical combinations into VIs allow for collecting significant imagery data on agroecosystems, whether to make decisions on operations from implementation (e.g., seeding and planting) to harvesting. Researchers often exploit them in remotely assessing the agronomic performance of sugarcane for biomass (Wang et al., 2022), quantitative yield (Sumesh et al., 2021), and standard biometric variables, such as leaf area and height of an individual (Oliveira et al., 2022). However, they still have not emphasized applying ML to UAV imagery data to predict °Brix and Purity as we focus on. Therefore, our AI-intensive approach is innovative. It can realistically monitor saccharification on canopy reflectance during ripening, as photosynthetically active leaves determine stalk sugar concentration (Khan et al., 2022). In addition, it can offer accurate and precise biophysical models to establish functional relationships between spectral features and indicators of technological quality (Table 3).
We obtained evidence for Red and NIR improving the robustness of brix-predicting models. Wavelengths occurring in the electromagnetic radiation spectrum around 680 nm and above visible red light between 780 nm and 1 mm can manifest as exciters to chlorophylls, inducing them to emit either photon (reflectance) in a specific spectral band or fluorescence within a region (Jensen, 2009; Zhao et al., 2010; Stein et al., 2014; Silva Junior et al., 2018; Rodrigues et al., 2020; Barbosa Júnior et al., 2022b). Moreover, they can correlate with the concentration of nutrients (e.g., sugars and minerals) in parts of a plant, such as a stalk (Rodrigues et al., 2022), supporting the ability of our models to predict °Brix and Purity upon imagery data. However, Red and NIR could not estimate Purity as accurately and precisely as Green and RedEdge. As sugarcane grows, its photosynthetic activity intensifies, triggering chemical modifications to chloroplasts. The accumulation of sugars from leaves in the stalk further contributes to physiological reactions in these membrane-bound organelles, altering the balance of chlorophylls and the “greenness” of a plant (Chea et al., 2022). hence, we can acquire significant spectral data from a canopy to predict Purity, which provides a measure of available sucrose in SS.
4.3 Machine learning models for predicting °Brix and Purity upon imagery data
Predictive data analytics can develop knowledge for advancing agriculture. However, conventional models can be statistically complex and demand considerable computational processing, making their implementation challenging. Even though fundamental approaches, such as correlational or regression analysis (Chea et al., 2020; Todd et al., 2022), can determine functional relationships between spectral and agronomic features, they could not be mathematically sufficient to address problems with a high level of abstraction. Therefore, their application in complex farming systems could not be cost-effective, driving the need to develop an alternative to explain non-linear interactions.
We can train an ML algorithm on a heterogenous and “messy” dataset to learn meaningful and non-duplicative patterns to solve a task automatically, accurately, and unbiasedly. Some applications of ML for sugarcane research and development available from earlier independent studies include predicting or forecasting chlorophyll content (Narmilan et al., 2022), standard morphophysiological variables (Oliveira et al., 2022), production of biomass (Wang et al., 2022), and classify cultivation (Nihar et al., 2022). We developed a new pathway by mapping spectral features to °Brix and Purity; hence we can fulfill a gap in analyzing qualitative yield while improving the addressability of a UAV for scalable aerial remote sensing. Our models are accurate and precise, especially RF and SVM. RF performs an independent prediction by processing data through multiple decision trees (Breiman, 2001). Support vector machine maps inputs to output as a classifier rather than as a regressor (Cristianini and Shawe-Taylor, 2000). As RF provides more parameters and higher overfitting prevention capability for ML, it can outperform SVM in predictive analysis (Yuan et al., 2022), supporting our trends.
Decision tree and MLR could be options for RF and SVM in predicting °Brix and Purity. However, they could develop a lower level of accuracy or precision, driving the need for improvement. The DT consists of an advanced problem-solving and computation-performing procedure. It splits a dataset into multiple branches to establish relationships hierarchically (Ghosh et al., 2022). However, such an algorithm has an inherent flaw, causing it to be less effective. Therefore, implementing a flawless filter could be necessary to increase its accuracy and precision in processing data with significant fluctuations. Even though MLR is topologically and operationally more basic than other ML algorithms, it can develop a highly accurate predictive model for Purity. Such a technique can work well on linear imagery data; hence, it can offer a reliable estimate of quantitative variables, such as productivity, upon VIs (Todd and Johnson, 2021; Krupavathi et al., 2022). However, it could not predict °Brix as accurately as RF and SVM, supporting a non-linear dataset. By introducing GDD into the model, however, we can optimize its predictive performance. Sugarcane’s GDD varies proportionally to its growth and development, acting as a source of constant propagation to MLR.
4.4 Advantages, trade-offs, and implications
We demonstrated the technical viability of ML algorithms in predicting °Brix and Purity upon UAV imagery data. Our approach is still at an early stage of research and development. However, it is consistent and can offer stakeholders possibilities to address precision harvesting for cost-effective production. Such an operation is costly (Banchi et al., 2019) and determines the quantity and quality of material for industrial processing (Martins et al., 2021). Therefore, prospective stakeholders across researcher centers and industries who search for decision-making support systems can benefit from our AI-intensive biophysical models to predict the optimal time for harvesting. As sugarcane fulfills approximately 80% of global sugar production (FAOSTAT, 2020), recovering material with the highest quality possible from the field at the precise time and place can be significant to develop a thriving and responsive sugar-energy sector.
Acquiring imagery data by a multispectral sensor onboard UAV allows the development of accurate and precise biophysical modeling of qualitative yield. Our predictive frameworks can be technically comparable with those functions available in independent studies by Bégué et al. (2010), Chea et al. (2020); and Chea et al. (2022). However, they can offer farmers further information to monitor dynamic ripening and map regions of high °Brix and Purity for “smart” harvesting. In addition, our approach can work by processing only remote sensing data, not depending on a conventional ground-level survey to collect biometric measures. Therefore, such an advantage can save farmland staff time and labor, streamline workflow, and ultimately level up the cost-effectiveness of production. Furthermore, while our approach can predict qualitative yield, it can be part of a high-throughput phenotyping program to select early-maturity genotypes. Stakeholders often rely on passive sensors to monitor and assess breeding fields, opening the opportunity to investigate active devices for this purpose.
5 Conclusion
We predicted °Brix and Purity by applying machine learning to multispectral imagery data from a UAV. We optimized the biophysical modeling by implementing a random forest algorithm. The most accurate spectral predictors of °Brix were Red and NIR, while those of Purity Green and RedEdge. We, therefore, developed an AI-intensive solution to model qualitative yield, advancing the field of aerial remote sugarcane mapping and monitoring. Our approach offers the global sugar-energy sector a strategy to harvest high-quality feedstock for industrial processing while streamlining fieldwork and addressing a pressing prescriptive and analytical agriculture for sustainable development. Additionally, it provides knowledge to develop a resource-effective, self-evolving framework to select sugar-dense material objectively and non-invasively, which is not an assumption of conventional phenotyping.
Data availability statement
The raw data supporting the conclusions of this article will be made available by the authors, without undue reservation.
Author contributions
MBJ: conceptualization, methodology, validation, formal analysis, investigation, data curation, writing – original draft preparation, writing – review and editing, and visualization. BM: methodology, formal analysis, investigation, writing – original draft preparation, writing – review and editing, and visualization. RO: investigation, writing – review and editing, and visualization. LS: writing – review and editing, visualization, and supervision. RS: conceptualization, methodology, writing – review and editing, visualization, supervision, and project administration. All authors contributed to the article and approved the submitted version.
Acknowledgments
We would like to acknowledge the Coordination for the Improvement of Higher Education Personnel (Capes), for the scholarship (code 001) to the first author; the Laboratory of Machinery and Agricultural Mechanization (LAMMA) of the Department of Engineering and Mathematical Sciences for the infrastructural support; The Industrial Process Laboratory of the Faculty of Technology (Fatec Jaboticabal) for the laboratory analysis of sugarcane.
Conflict of interest
The authors declare that the research was conducted in the absence of any commercial or financial relationships that could be construed as a potential conflict of interest.
Publisher’s note
All claims expressed in this article are solely those of the authors and do not necessarily represent those of their affiliated organizations, or those of the publisher, the editors and the reviewers. Any product that may be evaluated in this article, or claim that may be made by its manufacturer, is not guaranteed or endorsed by the publisher.
Supplementary material
The Supplementary Material for this article can be found online at: https://www.frontiersin.org/articles/10.3389/fpls.2023.1114852/full#supplementary-material
Abbreviations
BGI, blue green pigment index; CIG, chlorophyll index – Green; CIRE, chlorophyll index – RedEdge; CIVE, color index of vegetation extraction; DT, decision tree; GB, gradient boosting; GDD, growing degree days; GLI, green leaf index; GNDVI, green normalized difference vegetation index; LAI, leaf area index; MAE, mean absolute error; ML, machine learning; MLR, multiple linear regression; MSEP, mean square error of prediction; NDVI, normalized difference vegetation index; PSRI, plant senescence reflectance index; PVR, photosynthetic vigor ratio; RF, random forest; RMSE, root mean square error; RVI, ratio vegetation index; SfM, structure from motion; SRPI, simple ratio pigment index; SVM, support vector machine; TVI, triangular vegetation index; UAV, unmanned aerial vehicle; VARI, visible atmospherically resistant index; VIs, vegetation indices.
References
Abebe, G., Tadesse, T., Gessesse, B. (2022). Estimating leaf area index and biomass of sugarcane based on Gaussian process regression using landsat 8 and sentinel 1A observations. Int. J. Image Data Fusion, 1–31. doi: 10.1080/19479832.2022.2055157
Banchi, Â.D., Garcia, A. P., Grespan, A., Albiero, D., Favarin, L. G. A., Galvão, C. B. (2019). Operating cost of sugarcane harvester in function of agricultural productivity and harvester age. Rev. Bras. Eng. Agrícola e Ambient. 23, 552–557. doi: 10.1590/1807-1929/agriambi.v23n7p552-557
Barbosa Júnior, M. R., de A. Moreira, B. R., de Brito Filho, A. L., Tedesco, D., Shiratsuchi, L. S., da Silva, R. P. (2022a). UAVs to monitor and manage sugarcane: Integrative review. Agronomy 12, 661. doi: 10.3390/agronomy12030661
Barbosa Júnior, M. R., Tedesco, D., Carreira, V. D. S., Pinto, A. A., Moreira, B. R., de, A., et al. (2022b). The time of day is key to discriminate cultivars of sugarcane upon imagery data from unmanned aerial vehicle. Drones 6, 1–12. doi: 10.3390/drones6050112
Bégué, A., Lebourgeois, V., Bappel, E., Todoroff, P., Pellegrino, A., Baillarin, F., et al. (2010). Spatio-temporal variability of sugarcane fields and recommendations for yield forecast using NDVI. Int. J. Remote Sens. 31, 5391–5407. doi: 10.1080/01431160903349057
Breiman, L., Friedman, J. H., Olshen, R. A., Stone, C. J. (1984). Classification and regression trees (Monterey, California, USA: Wadsworth. Inc).
Broge, N., Leblanc, E. (2001). Comparing prediction power and stability of broadband and hyperspectral vegetation indices for estimation of green leaf area index and canopy chlorophyll density. Remote Sens. Environ. 76, 156–172. doi: 10.1016/S0034-4257(00)00197-8
Chea, C., Saengprachatanarug, K., Posom, J., Saikaew, K., Wongphati, M., Taira, E. (2022). Optimal models under multiple resource types for brix content prediction in sugarcane fields using machine learning. Remote Sens. Appl. Soc Environ. 26, 100718. doi: 10.1016/j.rsase.2022.100718
Chea, C., Saengprachatanarug, K., Posom, J., Wongphati, M., Taira, E. (2020). Sugar yield parameters and fiber prediction in sugarcane fields using a multispectral camera mounted on a small unmanned aerial system (UAS). Sugar Tech 22, 605–621. doi: 10.1007/s12355-020-00802-5
Consecana (2006). Manual de Instruções: Conselho dos Produtores de Cana-de-Açúcar, Açúcar e Álcool do Estado de São Paulo. Piracicaba - SP: CONSECANA, 112.
Cristianini, N., Shawe-Taylor, J. (2000). An introduction to support vector machines and other kernel-based learning methods (Cambridge: Cambridge university press).
FAOSTAT (2020) FAOSTAT. crop. livest. prod. food agric. organ. united nations. Available at: http://www.fao.org/faostat/en/.
Ghosh, A., Dey, P., Ghosh, T. (2022). Integration of RS-GIS with frequency ratio, fuzzy logic, logistic regression and decision tree models for flood susceptibility prediction in lower gangetic plain: A study on malda district of West Bengal, India. J. Indian Soc Remote Sens. 50, 1725–1745. doi: 10.1007/s12524-022-01560-5
Gitelson, A. A., Gritz, Y., Merzlyak, M. N. (2003). Relationships between leaf chlorophyll content and spectral reflectance and algorithms for non-destructive chlorophyll assessment in higher plant leaves. J. Plant Physiol. 160, 271–282. doi: 10.1078/0176-1617-00887
Gitelson, A. A., Kaufman, Y. J., Merzlyak, M. N. (1996). Use of a green channel in remote sensing of global vegetation from EOS- MODIS. Remote Sens. Environ. 58, 289–298. doi: 10.1016/S0034-4257(96)00072-7
Gitelson, A. A., Kaufman, Y. J., Stark, R., Rundquist, D. (2002). Novel algorithms for remote estimation of vegetation fraction. Remote Sens. Environ. 80, 76–87. doi: 10.1016/S0034-4257(01)00289-9
Hithamani, G., Medappa, H., Chakkaravarthi, A., Ramalakshmi, K., Raghavarao, K. S. M. S. (2018). Effect of adsorbent and acidulants on enzymatic browning of sugarcane juice. J. Food Sci. Technol. 55, 4356–4362. doi: 10.1007/s13197-018-3350-4
Jensen, J. R. (2009). “Remote sensing of the environment: An earth resource perspective 2/e,” in Pearson Education(India: Department of Geology University of Puerto Rico at Mayaguez), 518.
Kataoka, T., Kaneko, T., Okamoto, H., Hata, S. (2003). “Crop growth estimation system using machine vision,” in Proceedings 2003 IEEE/ASME International Conference on Advanced Intelligent Mechatronics (AIM 2003). (Kobe, Japan: IEEE b1079) b1079–b1083. doi: 10.1109/AIM.2003.1225492
Khan, Q., Qin, Y., Guo, D.-J., Zeng, X.-P., Chen, J.-Y., Huang, Y.-Y., et al. (2022). Morphological, agronomical, physiological and molecular characterization of a high sugar mutant of sugarcane in comparison to mother variety. PloS One 17, e0264990. doi: 10.1371/journal.pone.0264990
Krupavathi, K., Raghubabu, M., Mani, A., Parasad, P. R. K., Edukondalu, L. (2022). Field-scale estimation and comparison of the sugarcane yield from remote sensing data: A machine learning approach. J. Indian Soc Remote Sens. 50, 299–312. doi: 10.1007/s12524-021-01448-w
Lindner, T., Puck, J., Verbeke, A. (2022). Beyond addressing multicollinearity: Robust quantitative analysis and machine learning in international business research. J. Int. Bus. Stud. 53, 1307–1314. doi: 10.1057/s41267-022-00549-z
Louhaichi, M., Borman, M. M., Johnson, D. E. (2001). Spatially located platform and aerial photography for documentation of grazing impacts on wheat. Geocarto Int. 16, 65–70. doi: 10.1080/10106040108542184
Martins, M. B., Filho, A. C. M., Drudi, F. S., Bortolheiro, F. P., de, A. P., Vendruscolo, E. P., et al. (2021). Economic efficiency of mechanized harvesting of sugarcane at different operating speeds. Sugar Tech 23, 428–432. doi: 10.1007/s12355-020-00910-2
Matias, F. I., Caraza-Harter, M. V., Endelman, J. B. (2020). FIELDimageR: An r package to analyze orthomosaic images from agricultural field trials. Plant Phenome J. 3, 1–6. doi: 10.1002/ppj2.20005
Merzlyak, M. N., Gitelson, A. A., Chivkunova, O. B., Rakitin, V. Y. (1999). Non-destructive optical detection of pigment changes during leaf senescence and fruit ripening. Physiol. Plant 106, 135–141. doi: 10.1034/j.1399-3054.1999.106119.x
Misra, V., Mall, A. K., Ansari, S. A., Ansari, M. I. (2022). Sugar transporters, sugar-metabolizing enzymes, and their interaction with phytohormones in sugarcane. J. Plant Growth Regul. doi: 10.1007/s00344-022-10778-z
Morais, L. K., Aguiar, M. S., Albuquerque e Silva, P., Câmara, T. M. M., Cursi, D. E., Fernandes Júnior, A. R., et al. (2015). “Breeding of sugarcane,” in Industrial crops: Breeding for BioEnergy and bioproducts. Eds. Cruz, V. M. V., Dierig, D. A. (New York: NY: Springer New York), 29–42. doi: 10.1007/978-1-4939-1447-0_2
Narmilan, A., Gonzalez, F., Salgadoe, A. S. A., Kumarasiri, U. W. L. M., Weerasinghe, H. A. S., Kulasekara, B. R. (2022). Predicting canopy chlorophyll content in sugarcane crops using machine learning algorithms and spectral vegetation indices derived from UAV multispectral imagery. Remote Sens. 14, 1140. doi: 10.3390/rs14051140
Neter, J., Kutner, M. H., Nachtsheim, C. J., Wasserman, W. (1996). Applied linear statistical models. McGraw‐Hill/Irwin, 318
Nihar, A., Patel, N. R., Pokhariyal, S., Danodia, A. (2022). Sugarcane crop type discrimination and area mapping at field scale using sentinel images and machine learning methods. J. Indian Soc Remote Sens. 50, 217–225. doi: 10.1007/s12524-021-01444-0
Oliveira, R. P., Barbosa Júnior, M. R., Pinto, A. A., Oliveira, J. L. P., Zerbato, C., Furlani, C. E. A. (2022). Predicting sugarcane biometric parameters by UAV multispectral images and machine learning. Agronomy 12, 1992. doi: 10.3390/agronomy12091992
Pereira, G. W., Valente, D. S. M., Queiroz, D. M., de F, de, Coelho, A. L., Costa, M. M., et al. (2022). Smart-map: An open-source QGIS plugin for digital mapping using machine learning techniques and ordinary kriging. Agronomy 12, 1350. doi: 10.3390/agronomy12061350
Poltroniere, S. C., Aliano Filho, A., Caversan, A. S., Balbo, A. R., de O Florentino, H. (2021). Integrated planning for planting and harvesting sugarcane and energy-cane for the production of sucrose and energy. Comput. Electron. Agric. 184, 105956. doi: 10.1016/j.compag.2020.105956
Rodrigues, M., Cezar, E., Abrantes dos Santos, G. L. A., Reis, A. S., Furlanetto, R. H., de Oliveira, R. B., et al. (2022). Estimating technological parameters and stem productivity of sugarcane treated with rock powder using a proximal spectroradiometer vis-NIR-SWIR. Ind. Crops Prod. 186, 115278. doi: 10.1016/j.indcrop.2022.115278
Rodrigues, M., Nanni, M. R., Cezar, E., dos Santos, G. L. A. A., Reis, A. S., de Oliveira, K. M., et al. (2020). Vis–NIR spectroscopy: From leaf dry mass production estimate to the prediction of macro- and micronutrients in soybean crops. J. Appl. Remote Sens. 14, 1–20. doi: 10.1117/1.JRS.14.044505
Rong-En, F., Pai-Hsuen, C., Chih-Jen, L. (2005). Working set selection using second order information for training support vector machines. J. Mach. Learn. Res. 6, 1889–1918.
Rouse, J. C.OMMAJ.R.X.X.X, Haas, R., Deering, D., Schell, J., Harlan, J. (1974). Monitoring the vernal advancement and retrogradation (Green wave effect) of natural vegetation (Texas: NTRS - NASA Technical Reports Server).
Shendryk, Y., Sofonia, J., Garrard, R., Rist, Y., Skocaj, D., Thorburn, P. (2020). Fine-scale prediction of biomass and leaf nitrogen content in sugarcane using UAV LiDAR and multispectral imaging. Int. J. Appl. Earth Obs. Geoinf. 92, 102177. doi: 10.1016/j.jag.2020.102177
Silva Junior, C. A., Nanni, M. R., Shakir, M., Teodoro, P. E., Oliveira-Júnior, J. F., Cezar, E., et al. (2018). Soybean varieties discrimination using non-imaging hyperspectral sensor. Infrared Phys. Technol. 89, 338–350. doi: 10.1016/j.infrared.2018.01.027
Sreedevi, P., Jayachandran, L. E., Rao, P. S. (2018). Browning and bioactive composition of sugarcane juice (Saccharum officinarum) as affected by high hydrostatic pressure processing. J. Food Meas. Charact. 12, 1962–1971. doi: 10.1007/s11694-018-9811-7
Stein, B. R., Thomas, V. A., Lorentz, L. J., Strahm, B. D. (2014). Predicting macronutrient concentrations from loblolly pine leaf reflectance across local and regional scales. GIScience Remote Sens. 51, 269–287. doi: 10.1080/15481603.2014.912875
Sumesh, K. C., Ninsawat, S., Som-ard, J. (2021). Integration of RGB-based vegetation index, crop surface model and object-based image analysis approach for sugarcane yield estimation using unmanned aerial vehicle. Comput. Electron. Agric. 180, 105903. doi: 10.1016/j.compag.2020.105903
Todd, J., Johnson, R. (2021). Prediction of ratoon sugarcane family yield and selection using remote imagery. Agronomy 11, 1273. doi: 10.3390/agronomy11071273
Todd, J., Johnson, R., Verdun, D., Richard, K. (2022). Identification of selection preferences and predicting yield related traits in sugarcane seedling families using RGB spectral indices. Agriculture 12, 1313. doi: 10.3390/agriculture12091313
Wang, Z., Lu, Y., Zhao, G., Sun, C., Zhang, F., He, S. (2022). Sugarcane biomass prediction with multi-mode remote sensing data using deep archetypal analysis and integrated learning. Remote Sens. 14, 4944. doi: 10.3390/rs14194944
Wilkinson, G. N., Rogers, C. E. (1973). Symbolic description of factorial models for analysis of variance. Appl. Stat. 22, 392. doi: 10.2307/2346786
Yang, J., Ching, Y. C., Chuah, C. H. (2019). Applications of lignocellulosic fibers and lignin in bioplastics: A review. Polymers (Basel). 11, 1–26. doi: 10.3390/polym11050751
Yang, L., Deng, Y., Wang, X., Zhang, W., Shi, X., Chen, X., et al. (2021). Global direct nitrous oxide emissions from the bioenergy crop sugarcane (Saccharum spp. inter-specific hybrids). Sci. Total Environ. 752, 141795. doi: 10.1016/j.scitotenv.2020.141795
Yuan, Y., Wang, X., Shi, M., Wang, P. (2022). Performance comparison of RGB and multispectral vegetation indices based on machine learning for estimating hopea hainanensis SPAD values under different shade conditions. Front. Plant Sci. 13. doi: 10.3389/fpls.2022.928953
Zarco-Tejada, P., Berjón, A., López-Lozano, R., Miller, J. R., Martín, P., Cachorro, V., et al. (2005). Assessing vineyard condition with hyperspectral indices: Leaf and canopy reflectance simulation in a row-structured discontinuous canopy. Remote Sens. Environ. 99, 271–287. doi: 10.1016/j.rse.2005.09.002
Keywords: remote sensing, brix, sucrose, ripening, Saccharum spp., smart harvest
Citation: Barbosa Júnior MR, Moreira BRA, de Oliveira RP, Shiratsuchi LS and da Silva RP (2023) UAV imagery data and machine learning: A driving merger for predictive analysis of qualitative yield in sugarcane. Front. Plant Sci. 14:1114852. doi: 10.3389/fpls.2023.1114852
Received: 03 December 2022; Accepted: 18 January 2023;
Published: 26 January 2023.
Edited by:
Vanessa Martos Núñez, University of Granada, SpainReviewed by:
Salvador Gutiérrez, University of Granada, SpainJosé Emilio Guerrero Ginel, University of Cordoba, Spain
Copyright © 2023 Barbosa Júnior, Moreira, de Oliveira, Shiratsuchi and da Silva. This is an open-access article distributed under the terms of the Creative Commons Attribution License (CC BY). The use, distribution or reproduction in other forums is permitted, provided the original author(s) and the copyright owner(s) are credited and that the original publication in this journal is cited, in accordance with accepted academic practice. No use, distribution or reproduction is permitted which does not comply with these terms.
*Correspondence: Marcelo Rodrigues Barbosa Júnior, bWFyY2Vsby5qdW5pb3JAdW5lc3AuYnI=
†These authors have contributed equally to this work and share first authorship