 Jianming Fu
 Robert L. Bowden
 S. V. Krishna Jagadish3
 P. V. Vara Prasad
- 1Department of Agronomy, 2004 Throckmorton Plant Sciences Center, Kansas State University, Manhattan, KS, United States
- 2USDA–ARS Hard Winter Wheat Genetics Research Unit, 4008 Throckmorton Plant Sciences Center, Kansas State University, Manhattan, KS, United States
- 3Department of Plant & Soil Science, Texas Tech University, Lubbock, TX, United States
In many regions worldwide wheat (Triticum aestivum L.) plants experience terminal high temperature stress during the grain filling stage, which is a leading cause for single seed weight decrease and consequently for grain yield reduction. An approach to mitigate high temperature damage is to develop tolerant cultivars using the conventional breeding approach which involves identifying tolerant lines and then incorporating the tolerant traits in commercial varieties. In this study, we evaluated the terminal heat stress tolerance of 304 diverse elite winter wheat lines from wheat breeding programs in the US, Australia, and Serbia in controlled environmental conditions. Chlorophyll content and yield traits were measured and calculated as the percentage of non-stress control. The results showed that there was significant genetic variation for chlorophyll retention and seed weight under heat stress conditions. The positive correlation between the percent of chlorophyll content and the percent of single seed weight was significant. Two possible mechanisms of heat tolerance during grain filling were proposed. One represented by wheat line OK05723W might be mainly through the current photosynthesis since the high percentage of single seed weight was accompanied with high percentages of chlorophyll content and high shoot dry weight, and the other represented by wheat Line TX04M410164 might be mainly through the relocation of reserves since the high percentage of single seed weight was accompanied with low percentages of chlorophyll content and low shoot dry weight under heat stress. The tolerant genotypes identified in this study should be useful for breeding programs after further validation.
Introduction
Wheat (Triticum aestivum L.) is a major staple food crop and provides a significant portion of proteins and calories for the human population worldwide (FAO, 2012; Mishra et al., 2021). The world population growth requires wheat production increases. However, this demand is seriously challenged by high temperature stress in the wheat growing season, particularly in the grain filling stage, the terminal heat stress. Wheat originated in the Fertile Crescent area, a temperate region (Heun et al., 1997; Feldman and Levy, 2015), and is highly susceptible to high temperatures. Heat stress is often defined as the rise in temperature, usually 10–15 °C, beyond a threshold for a period of time sufficient to cause irreversible damage to plant growth and development (Wahid et al., 2007). Heat stress damages wheat plants in a number of different ways. At the molecular level, heat stress reduces the activities of enzymes, such as Rubisco activase and soluble starch synthase, which participate in the photosynthesis and starch biosynthesis (Keeling et al., 1993; Jenner, 1994; Mathur et al., 2014), changes membrane protein structural conformation, lipid composition, the timing and the abundance of gene expression that regulates grain development (Anderson and DuPont, 2003; Altenbach and Kothari, 2004; Wan et al., 2008), promotes the production of reactive oxygen species (ROS) and ethylene, and enhances the activities of enzymes, such as chlorophyllase, which participate in chlorophyll degradation (Todorov et al., 2003; Almeselmani et al., 2006; Hays et al., 2007). Heat stress reduces green (photosynthetic) area, accelerates senescence, shortens grain filling duration, increases photorespiration (Kuroyanagi and Paulsen, 1985; Cossani and Reynolds, 2012; Fu et al., 2012; Jagadish et al., 2016), causes male sterility (Anjum et al., 2008; Kaur and Behl, 2010), and increases the number of structurally abnormal and nonfunctional florets (Hedhly et al., 2009). Ultimately, these changes detrimentally affect yield components, such as reducing single grain weight or seed number. Wiegand and Cuellar (1981) reported that wheat grain filling duration shortened 3.1 days and single seed weight decreased 2.8 mg per degree Celsius increase in mean daily air temperature during grain filling period.
Based on the accumulated field yield data and weather data, detrimental effects of high temperature on wheat productivity were quantified at regional scales. A one degree Celsius temperature increase in mean air temperature was estimated to reduce wheat yield 3-17% in the Indo-Gangetic Plains in South Asia (Tiwari et al., 2013). Every 1°C increase in growing season temperature decreased wheat yield 3-10% in China (You et al., 2009). Every 1°C increase in average night temperature decreased wheat yield 10% in Mexico (Lobell et al., 2005). A 1°C increase in mean temperature was associated with a predicted decrease in wheat yield of 21% in Kansas USA (Barkley et al., 2013). Wheat yield could be reduced up to 50% when growing season temperature was two degrees Celsius higher than the average in Australia based on a simulation model study (Asseng et al., 2011). As climate change progresses and the Earth surface temperature gradually increases, heat episodes are also predicted to increase in frequency, length, severity and peak temperature (Intergovernmental Panel on Climate Change, 2015). Thus, the negative effects of high temperatures on the productivity of wheat and other crops will become more detrimental (Semenov and Halford, 2009; Lobell et al., 2011). Globally, wheat grain yield is estimated to be reduced by 6% for each degree Celsius of temperature increase (Asseng et al., 2015).
A sustainable way for mitigating heat stress damage is to develop tolerant varieties. Although several approaches, such as mutagenesis (Mullarkey and Jones, 2000), synthetics (Ratteya et al., 2011; Sareen et al., 2012) and transgenics (Fu et al., 2008), have been used in attempts to develop tolerant varieties, conventional breeding remains the most important approach which involves screening germplasm lines for identifying tolerant lines and then transferring the tolerance traits into commercial lines. Identifying lines with significant tolerance may require evaluating large numbers of germplasm lines in environment- and developmental stage-precisely controlled conditions. We have developed a protocol for such purposes, and recently we reported genetic variation of heat tolerance in a spring wheat diversity panel (254 lines) (Fu et al., 2022). The objectives of this work were to (1) investigate genetic variation and correlations of chlorophyll retention and yield components, and (2) identify genotypes with high retention of chlorophylls and/or seed weight in winter wheat under terminal heat stress conditions.
Materials and methods
Plant materials
The plant materials used in this study consisted of 304 winter wheat lines (Supplemental Table 1). Entries 1 to 301, 303 were Triticeae Coordinated Agricultural Project (TCAP) winter wheat lines from wheat breeding programs of public universities and private sectors across the United States of America. The origin information can be found at the T3 (The Triticeae Toolbox) site: https://wheat.triticeaetoolbox.org/. Entries 302 and 304 were from Serbia and Australia, respectively, and were previously reported to have capability of delayed chlorophyll degradation under terminal heat stress conditions (Alkhatib and Paulsen, 1990; Ristic et al., 2007).
Plant growth conditions and heat stress treatment
Two experiments, Exp. 1 and Exp. 2, were conducted in the controlled environmental research facility at Kansas State University and USDA/ARS/Hard Winter Wheat Genetics Research Unit, Manhattan KS. In Exp. 1, seeds of 304 winter wheat lines were placed on wetted germination papers in plastic germination boxes and vernalized at 4°C for eight weeks. Six seedlings from each line were planted in pots containing Metro Mix 200 potting soil (Hummert International). One seedling was transplanted per pot. The pot diameter and the height was 7 and 25 cm, respectively. The plants were grown in the greenhouse. The greenhouse conditions were previously described (Fu et al., 2015). Briefly, plants were grown in a greenhouse at day/night temperature settings of 25/20°C with a photoperiod of 16 h. Natural light was supplemented with high pressure sodium lights to maintain the photoperiod and light levels. Humidity was not controlled nor monitored in the greenhouse. The control group was maintained under these conditions in the greenhouse for the duration of the experiment. Miracle Gro Fertilizer (Stern’s Miracle-Gro Products, Inc., Port Washington, NY) 24-8-16 (N-P-K) at a concentration of 0.5 g dry weight per liter was applied at the rate of 100 ml per pot once a week for the duration of the experiment, as previously described (Ristic et al., 2009). Insecticide Marathon 1% Granular (Imidacloprid, OHP, Inc., Bluffton, SC, USA) was applied once at the tillering stage to the soil mix according to manufacturer's instructions to control aphids and thrips. Elemental sulfur (99%) was applied in a sulfur vaporizer for two hours each night when powdery mildew was detected on plants. At anthesis each plant was tagged. Ten days after anthesis, three pots randomly selected from each genotype were moved to a Conviron Model E-36 growth chamber and exposed to heat stress for 16 d (36°C day, 30°C night, ± 1°C; RH 90 to 100%; photoperiod 16 h; PPFD of 480 μmol m-2 s-1). This greenhouse condition and the heating chamber condition were used based on the previous work that these conditions were previously successfully used for identifying heat tolerant wheat lines (Ristic et al., 2007; Fu et al., 2017; Fu et al., 2022). Pots were placed randomly in the growth chamber. To minimize dehydration of the leaf tissue during the heat treatment, pots were placed in trays containing standing water with an approximate depth of 1 cm. Following the heat stress treatment, plants were transferred back to the greenhouse until maturity for harvesting. The Conviron Model E-36 growth chamber had an internal floor dimension of 137 cm x 246 cm. Because this diversity wheat panel had a wide range of flowering time, one chamber had enough space for the heat treatment for 16 days for each plant.
Based on the data collected from Exp. 1, 10 heat tolerant lines and 3 susceptible lines (Supplemental Table 2) were selected for further validation before making crosses for developing mapping populations for genetic studies and before providing the tolerant lines to breeding programs. Our Exp. 1 was an individual pots- and heating chamber-based effort for evaluating more than 300 wheat lines for the terminal heat stress tolerance, and was very labor-intensive, particularly during the heat treatment time period. In Exp. 2, the 13 wheat lines selected based on the results from Exp. 1 were used (Supplemental Table 2). The experimental procedures and conditions including the heat treatment were the same as those in Exp. 1 except that ten plants of each line were grown in a growth chamber (25°C day, 20°C night, ± 1°C; RH 70%; photoperiod 16 h; PPFD of 480 μmol m-2 s-1) and half of them were used for heat treatment.
Measurement of chlorophyll content
Chlorophyll content was measured using a self-calibrating SPAD chlorophyll meter (Model 502, Spectrum Technologies, Plainfield, IL) as described by Ristic et al. (2008) with modifications. Briefly, three readings were taken in the middle of the flag leaf of the primary tiller of each plant and averaged for every pot. The measurements were conducted at Days 0, 4, 8, 12, and 16 during the heat stress treatment.
Harvesting and yield data
At maturity, plant parts above the soil surface were harvested. Spikes from all tillers were threshed, grains from all spikes were counted and weighed, and all tiller shoots were oven-dried at 65°C for 7 days and weighed, as previously described (Ristic et al., 2009).
Statistical analysis
To compensate for innate differences in trait components, heat tolerance was quantified using the percentage of the control for each genotype. Pots were considered to be the experimental units. For each pot in the heat stress treatment, the chlorophyll retention at 4, 8, 12 or 16 days was expressed as a percentage of Day 0 (control). The rationale for using chlorophyll content at Day 0 as the control was previously described in Ristic et al. (2008), and this method was later on used by Sharma et al. (2017) and Fu et al. (2022). Briefly, the rationale stood on the observations that during the first 26 days after flowering the chlorophyll contents were not significantly changed under the control condition for hexaploid common wheat, tetraploid wheat and maize (Ristic et al., 2008). The rationale for using percentage of control rather than heat susceptibility index (HSI, Fischer and Maurer, 1978) was given in Fu et al. (2015), and this method was later on used by Fu et al. (2022); Fu et al. (2017). Briefly, the rationale stood on the facts including (1) that percent of control is always non-negative and a HSI can be negative in some cases and a negative number can cause problems in some statistical analyses such as PROC GLIMMIX which lacks convergence for a negative number, and (2) percent of control for each accession is more intuitive and is unaffected by the group of accessions under evaluation and, in contrast, HSI is the opposite (Fu et al., 2015). For the yield traits, percentage of control was calculated as follows: Percent of Control = 100 x (Yh/Yc).
where Yh is the value for each experimental unit in the heat stress treatment and Yc is the average value for the corresponding experimental units in the non-stress control condition. Higher mean percentage of control indicates greater heat tolerance. The experiment was analyzed as a completely randomized design. Data were obtained for two runs of the experiment (Exp. 1 and Exp. 2). Each experiment was analyzed separately. Genotype was analyzed as a fixed effect. Analysis of variance was performed with SAS 9.4 (SAS Institute, 2010) PROC GLIMMIX. The Gaussian (normal), Poisson, lognormal, and negative binomial distributions were tested for best fit on the basis of standard fit statistics and examination of the residuals. For each variable, the negative binomial distribution was used because it had the best fit. Least squares means for genotypes (lines) were back-transformed for presentation using the ilink function of GLIMMIX. Least squares means of genotypes were compared with an F test, and then separated using the Tukey-Kramer multiple comparison test. Correlations were calculated using SAS PROC CORR.
Results
Chlorophyll content
The percent of control for chlorophyll content at Day 4 of heat treatment among the winter wheat lines was significantly different in both Exp. 1 (F = 4.00, P < 0.0001) and Exp. 2 (F = 9.17, P < 0.0001). Similarly, the percent of control for chlorophyll content at Day 8, 12 and 16 of heat treatment among the winter wheat lines was significantly different in both Exp. 1 (F = 3.55 to 3.67, P < 0.0001) and Exp. 2 (F = 18.59 to 23.01, P < 0.0001) as well (Table 1). These results demonstrate that the genetic variation of the stay-green traits studied under the heat stress conditions among the winter wheat lines was significant. The percent of control for chlorophyll content at Day 16 (the last day) of heat treatment was used to determine the heat stress tolerance or susceptibility of each wheat line, and was subjected to multiple comparisons of the least square means using a conservative Tukey-Kramer method. The results were presented in Supplemental Table 3 for Exp. 1 and the mean of all 304 lines was 26.4. The multiple comparison results for Exp. 2 were presented in Supplemental Table 4. The mean of all thirteen lines in Exp. 2 was 41.2. The mean of ten tolerant lines was 49.8, and the mean of three susceptible lines was 12.3. An example of one tolerant line (Line 26, OK05723W) and one susceptible line (Line 175, TX04M410164), in terms of percent for chlorophyll retention, was shown in Figure 1. Lines 26 and 175 showed 69.4% and 14.6% in Exp. 1 and 71% and 10.2% in Exp. 2 after 16 days of heat stress, respectively.
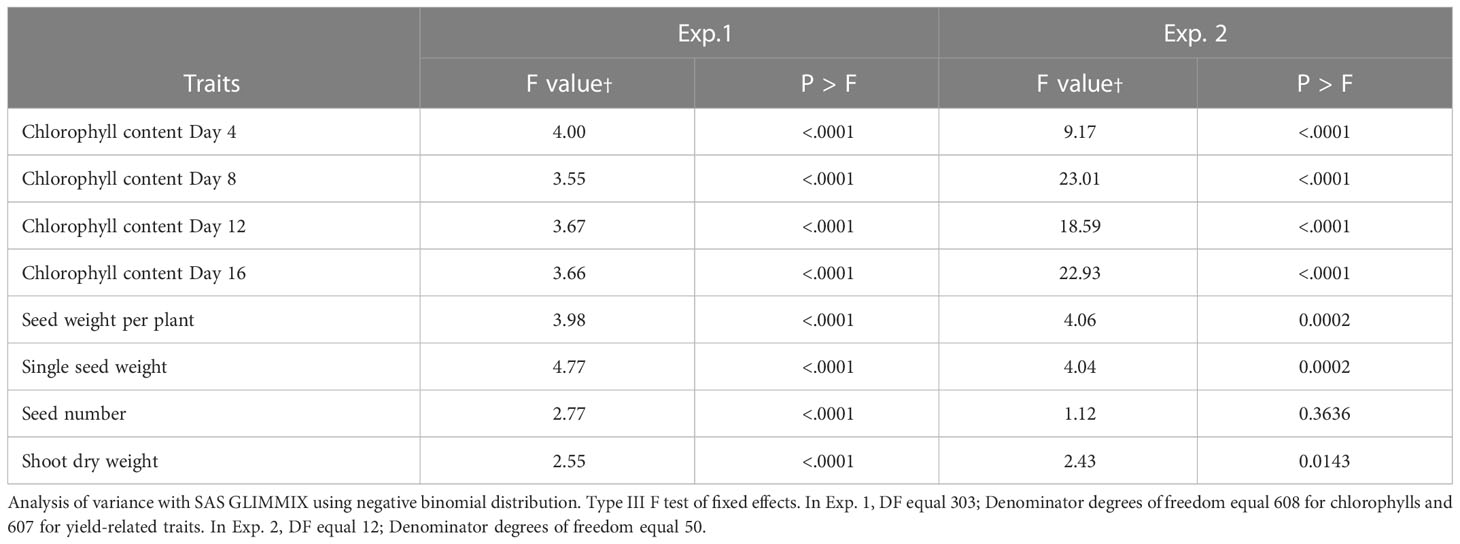
Table 1 Genotypic variation of percentage of control for stay-green and yield traits in winter wheat.

Figure 1 Chlorophyll retention rates in two contrasting genotypes. Tolerant Line 26 (OK05723W), with high chlorophyll retention and susceptible Line 175 (TX04M410164) with extremely low chlorophyll retention. (A) Exp. 1. (B) Exp. 2.
Seed weight per plant
The F values for the percent of control for seed weight per plant among the winter wheat lines were significant in both Exp. 1 (F = 3.98, P < 0.0001) and Exp. 2 (F = 4.06, P = 0.0002) (Table 1). Multiple comparisons for the percent of control for seed weight per plant were presented in Supplemental Table 5 for Exp. 1. The mean across all 304 lines was 25% of the control. Multiple comparisons for the percent of control for seed weight per plant were presented in Supplemental Table 6 for Exp. 2. The mean of all lines in Exp. 2 was 43.7% of the control. Line 175 was ranked second in both Exp. 1 (61.7% of control) and Exp. 2 (50.4%).
Single seed weight
Similar to the seed weight per plant, the F values for the percent of control for single seed weight among the winter wheat lines were significant in both Exp. 1 (F = 4.77, P < 0.0001) and Exp. 2 (F = 4.04, P = 0.0002) (Table 1). Multiple comparisons for the percent of control for single seed weights were presented in Supplemental Table 7 for Exp. 1. The mean across all 304 lines was 35.3% of the control. Line 175 (77.2% of the control) was ranked first in the top of the multiple comparisons. Multiple comparisons for the percent of control for single seed weights for Exp. 2 were presented in Supplemental Table 8. The mean of all thirteen lines was 52.3.3% of the control. The top two tolerant lines were Line 175 (64.4% of the control) and Line 15 (64.4%). Interestingly, Line 175 had low percent of control for chlorophyll content as illustrated earlier in Figure 1.
Seed number
The analysis of variance revealed significant effects for genotypes for grain number per plant under heat stress expressed as a percentage of control in Exp. 1 (F = 2.77, P < 0.0001) (Table 1). Average grain number per plant under heat stress expressed as percentage across 304 lines in Exp. 1 was 68.8% (Supplemental Table 9). The F value for the percent of control for thirteen lines in Exp. 2 was not significant (F = 1.12, P = 0.3636) (Table 1).
Shoot dry weight
Similar to the seed weight per plant and single grain weight, the Glimmix F values for the percent of control for shoot dry weights among the winter wheat lines were significant in both Exp. 1 (F = 2.55, P < 0.0001) and Exp. 2 (F = 2.43, P = 0.0143) (Table 1). The results of Tukey-Kramer multiple comparisons were shown and the means across all lines in Exp. 1 and Exp. 2 were 87.3% and 93.5% (Supplemental Tables 10, 11), respectively.
Correlations
Correlation between traits
The correlations among the studied traits of chlorophyll content and yield components were presented in Table 2. Correlations of the percent of control for chlorophyll content among Days 4, 8, 12 and 16 were significant in both Exp. 1 (r = 0.2685 to 0.7215, P < 0.0001) and Exp. 2 (r = 0.4651 to 0.8477, P < 0.0001). Correlations for the percent of control between single seed weight and chlorophyll content at Day 4, 8 and 12 were significant in both Exp. 1 and Exp. 2. Correlations for the percent of control between shoot dry weight and seed weight per plant and seed number were significant in both Exp. 1 and Exp. 2. As expected, correlations among single seed weight, seed number and seed weight per plant were significant in both Exp. 1 and Exp. 2.
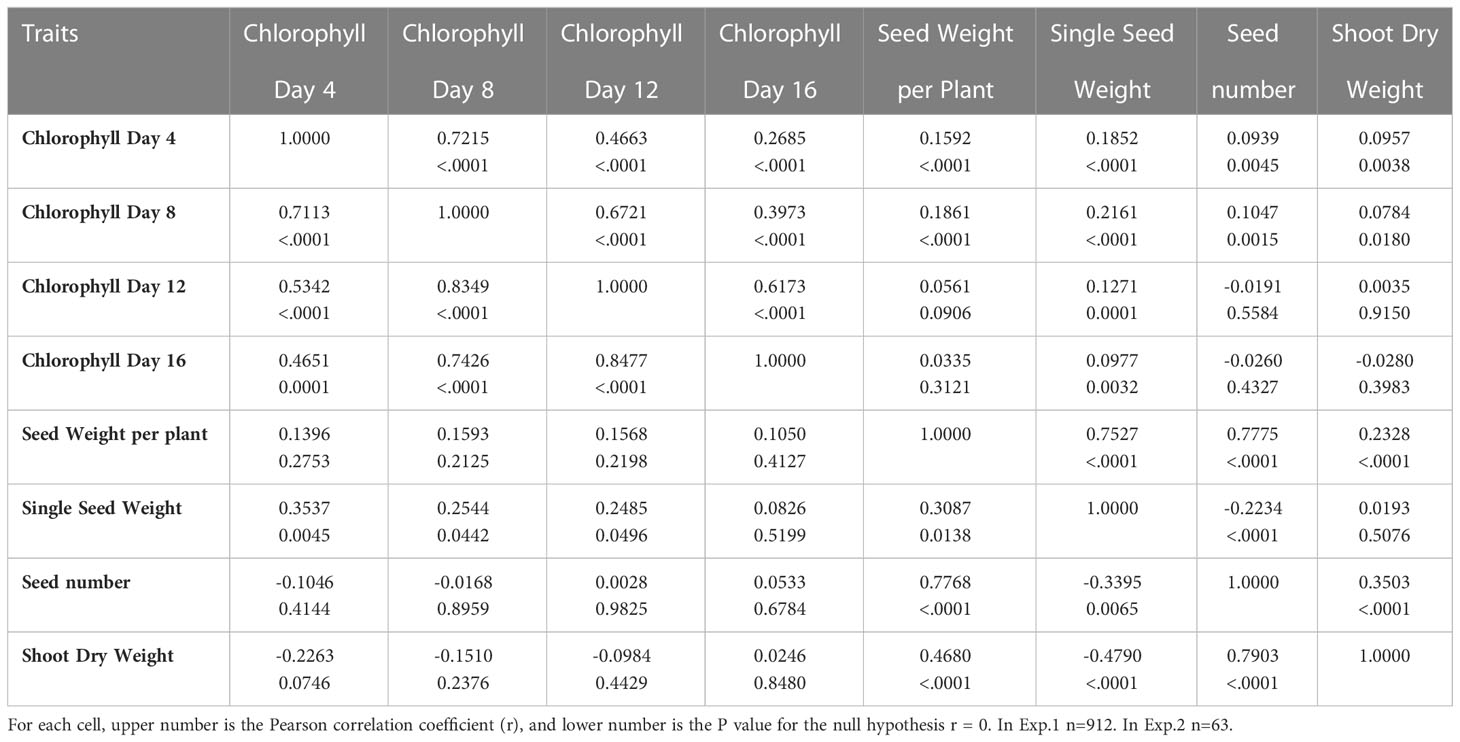
Table 2 Correlations among percentage of control for chlorophyll content, seed weight per plant, single kernel weight, seed number, and total shoot weight for Exp. 1 (above diagonal) and Exp. 2 (below diagonal).
Correlation between two experiments
Correlations between Exp. 1 and Exp. 2 were significant for traits chlorophyll content at Days 4, 8, 12 and 16, seed weight per plant, single seed weight and shoot dry weight (Figure 2), indicating that the performances of these traits were consistent between the two experiments. However, the correlation of seed number between Exp. 1 and Exp. 2 was not significant (Figure 2).
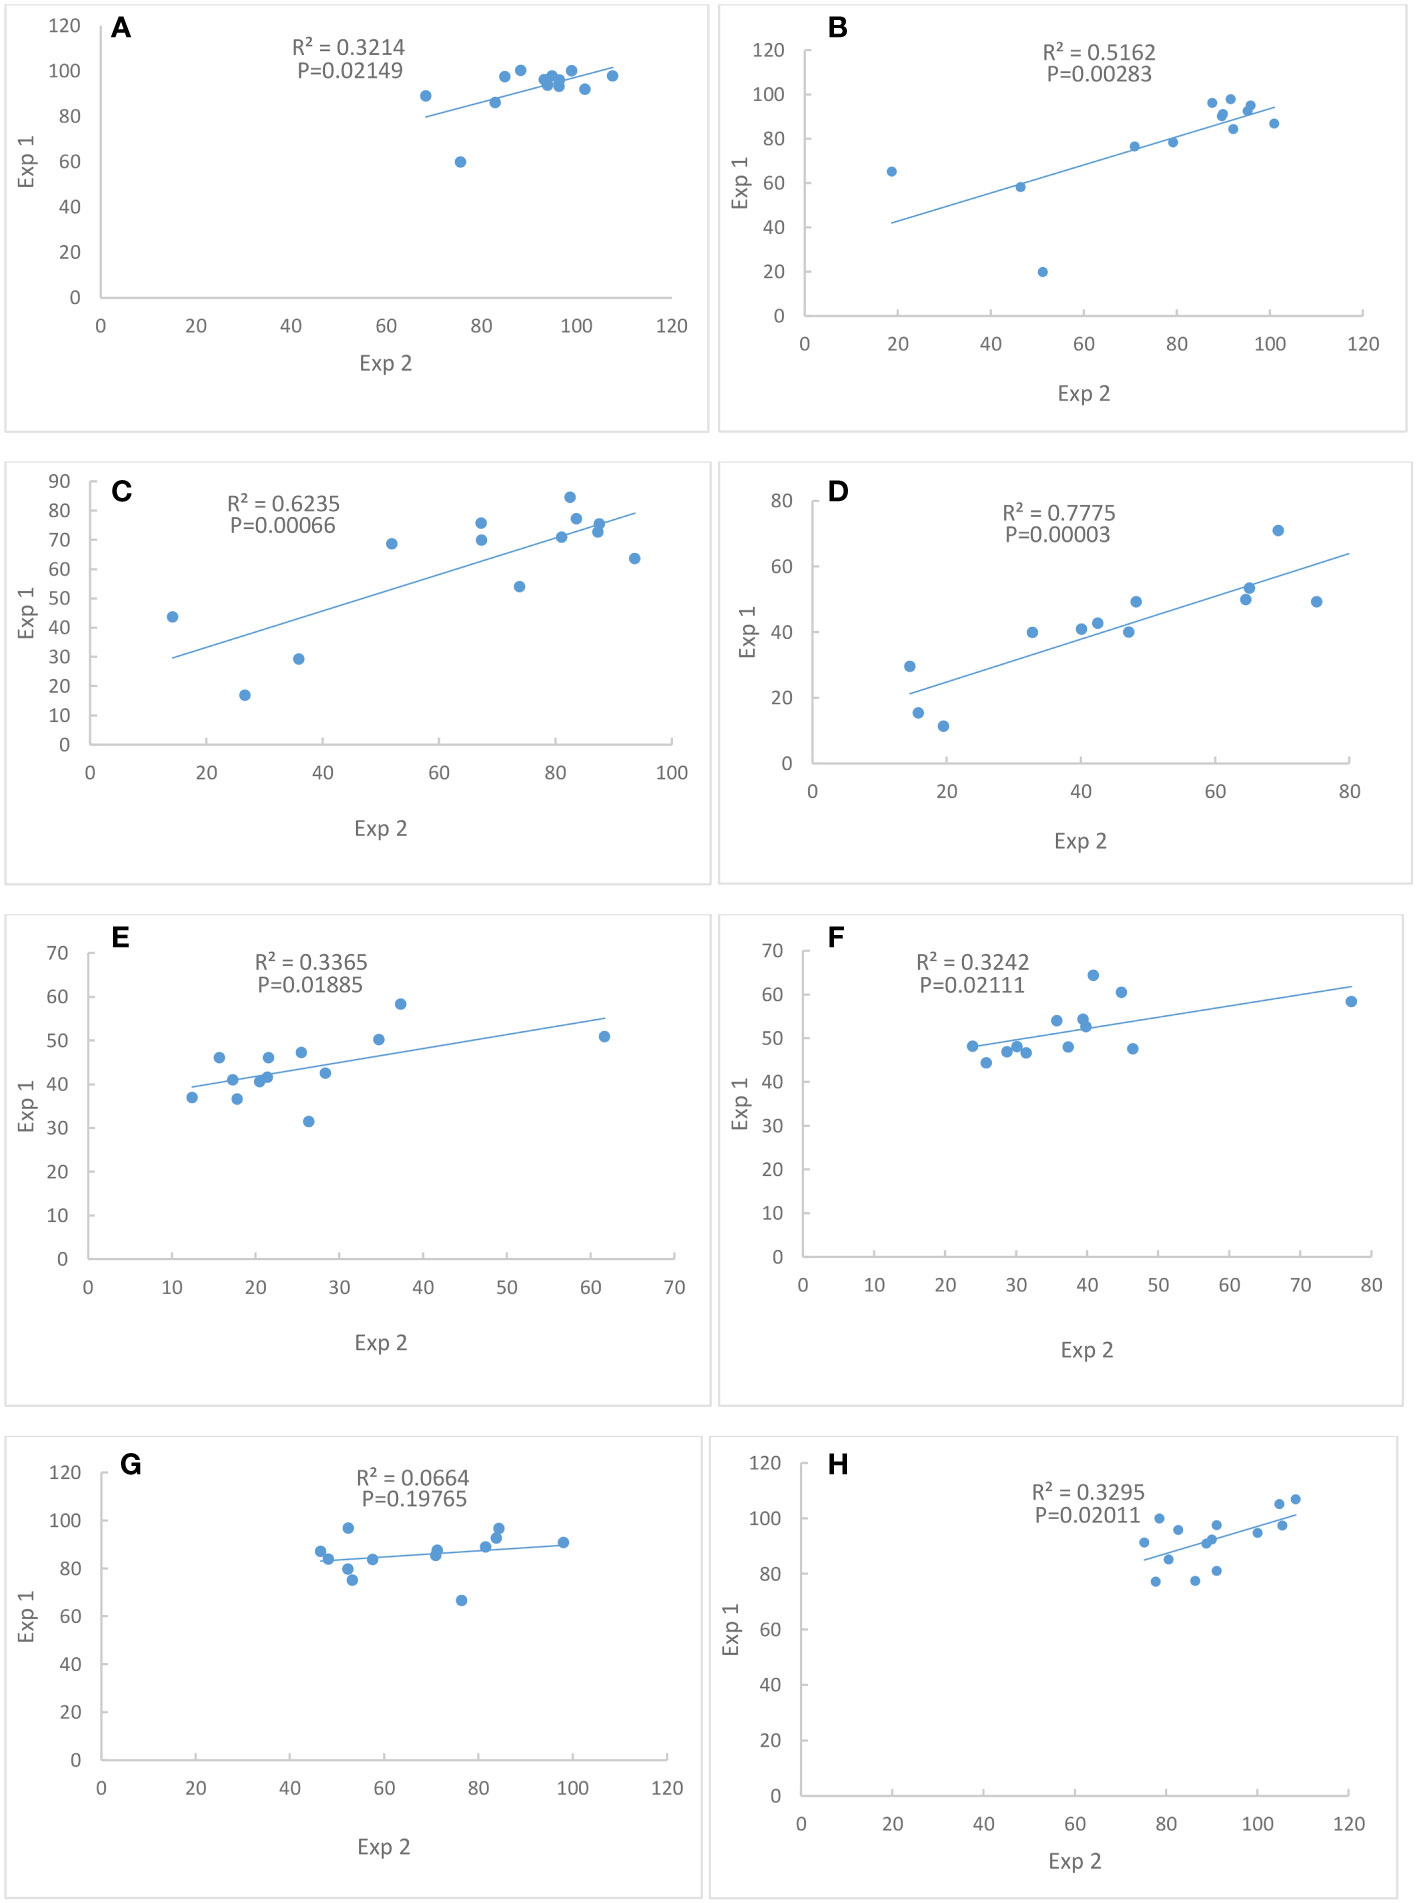
Figure 2 Correlations of percent of control between Exp. 1 and Exp. 2. (A) Chlorophyll content at Day 4. (B) Chlorophyll content at Day 8. (C) Chlorophyll content at Day 12. (D) Chlorophyll content at Day 16. (E) Seed weight per plant. (F) Single seed weight. (G) Seed number. (H) Shoot dry weight. N = 13.
Discussion
Heat stress, particularly terminal heat stress, damages many different aspects of wheat plants, and consequently reduces the grain yield. Using conventional breeding to develop tolerant varieties remains the best way to mitigate heat damage. Identifying genotypes (lines) with tolerance traits is required for breeding programs. Growth chamber-based and field-based efforts for identifying tolerant genotypes were previously reported (Asana and Williams, 1965; Wardlaw, 1994; Dias and Lidon, 2009; Banyai et al., 2014; Bergkamp et al., 2018; Rezaei et al., 2018; Sebela et al., 2020). However, in the chamber-based studies on the terminal stress only a relatively small number of genotypes were typically evaluated. One drawback of such efforts is that the tolerant genotypes selected may have limited tolerance due to a small pool of genotypes available for the selection. In the field-based studies although a large number of genotypes can be planted there are a number of problems. First, a large panel of diverse genotypes is intrinsically associated with a large variation of phenological traits, e.g., flowering time, and it is almost impossible to compare chlorophyll contents at the same development stage under the same environmental conditions among genotypes. Second, the instability of heat stress imposition under field conditions would lead to errors in phenotypic data and later translated the errors into genetic analysis. Third, it may be difficult or impossible to separate effects of heat stress from other stresses, such as drought when sufficient irrigation capability is lacking. Thus, there are advantages to testing a large genetically diverse germplasm collection under precisely controlled conditions. Our protocol has the capability to evaluate more than 300 wheat lines for terminal heat stress tolerance in chamber-based conditions, thus overcoming the problems under field conditions.
In this study we evaluated the terminal heat stress tolerance of a diversity panel consisting of 304 winter wheat lines. The results showed that genetic variation for chlorophyll retention and grain weights were significant, and the correlation between the percent of chlorophyll content and the percent of single seed weight was significant as well. Some genotypes, such as Line 26, with high percent of single seed weight, also had high percent of chlorophyll retention and high percent of shoot dry weight. This might be explained by grain filling being mainly contributed from the current photosynthetic products. However, some genotypes, such as Line 175, with high percent of single seed weight, had low percent of chlorophyll retention during the grain filling stage and low percent of shoot dry weight. This might be explained by grain filling being mainly contributed from the relocation of soluble sugars in the stem reserve. These two proposed scenarios represent two different grain filling mechanisms, and after further confirmation and validation introgression of different grain filling mechanisms into the same variety may substantially reduce wheat grain yield loss under heat stress conditions.
Our findings are in agreement with several previous studies which reported that stay-green was significantly correlated with the grain yield under heat stress environmental conditions in wheat (Hede et al., 1999; Kumar et al., 2010; Lopes and Reynolds, 2012; Nawaz et al., 2013; Kumari et al., 2013). The significant correlation between the stay-green and the grain yield under heat stress conditions is the rationale for selecting functional stay-green genotypes to develop heat-tolerant varieties. The importance of stem reserve remobilization for grain filling for some wheat genotypes under heat stress conditions was reported previously (Blum et al., 1994; Blum, 1998), and thus introgression of this trait may improve wheat grain yield under heat stress conditions.
In this work, although the percent retention of chlorophyll and the percent of single seed weight were significantly correlated, the correlation was low. One possible cause for the low correlation was that heat stress damages sink (grain filling) components. For example, heat stress decreases starch synthase activity, and consequently limits starch synthesis and grain growth in wheat (Keeling et al., 1993). Another cause might be that for some genotypes grain filling was mainly contributed from the remobilization of stem reserves under heat stress conditions (Blum et al., 1994; Blum, 1998; Gebbing and Schnyder, 1999). The third cause might be that for some genotypes only small portion of current photosynthetic products was transported (partitioned) to the developing grains under heat stress conditions. The fourth cause might be that for some genotypes stay-green might be non-functional or partly functional. In this study, we did not measure the starch synthase activity, nor the photosynthesis of green tissues in heat stress, nor the actual remobilization of stem reserve in heat stress, and so these questions remain to be answered, and deserve separate investigations in the future. Interestingly, it appears that the correlations between the percent of control for single seed weight and the percent of chlorophyll retention were greater at the early stages of the heat stress than at the later stages of the heat stress. This may indicate that the current photosynthates might be transported to the developing grains more efficiently at the early stages of the heat stress than at the later stages of the heat stress. Although the correlation between the seed weight/plant and the single seed weight was lower (r = 0.3087, P < 0.0138) than the correlation between the seed weight/plant and the seed number (r = 0.7768, P < 0.0001) in Exp. 2, they were very similar (r = 0.7775, P < 0.0001; r = 0.7527, P < 0.0001) in Exp. 1. It is unclear whether the different panel composition or different experimental conditions during grain filling might account for the difference.
In conclusion, significant genetic variation for chlorophyll retention and grain yield-related traits exists under heat stress conditions in winter wheat. Heat-tolerant genotypes were identified and two possible grain filling mechanisms were proposed. Tolerant lines identified in this study were provided to breeding programs for developing heat-tolerant varieties and used for developing mapping populations for QTL mapping and fine mapping to locate genes responsible for heat tolerance.
Data availability statement
The original contributions presented in the study are included in the article/Supplementary Material. Further inquiries can be directed to the corresponding author.
Author contributions
JF, RB and PP designed experiments. JF conducted experiments and collected data. JF and RB did data analysis. JF prepared the manuscript. RB, SJ and PP reviewed and edited the manuscript. All authors contributed to the article and approved the submitted version.
Funding
This work was funded through Non-assistance Cooperative Agreement 3020-21000-011-022-S between USDA-ARS and Kansas State University.
Acknowledgments
Mention of trade names or commercial products in this publication is solely for the purpose of providing specific information and does not imply recommendation or endorsement by the U.S. Department of Agriculture. USDA is an equal opportunity provider and employer. Contribution number 23-005-J from the Kansas Agricultural Experiment Station.
Conflict of interest
The authors declare that the research was conducted in the absence of any commercial or financial relationships that could be construed as a potential conflict of interest.
Publisher’s note
All claims expressed in this article are solely those of the authors and do not necessarily represent those of their affiliated organizations, or those of the publisher, the editors and the reviewers. Any product that may be evaluated in this article, or claim that may be made by its manufacturer, is not guaranteed or endorsed by the publisher.
Supplementary material
The Supplementary Material for this article can be found online at: https://www.frontiersin.org/articles/10.3389/fpls.2023.1132108/full#supplementary-material
References
Alkhatib, K., Paulsen, G. M. (1990). Photosynthesis and productivity during high temperature stress of wheat genotypes from major world regions. Crop Sci. 30, 1127–1132. doi: 10.2135/cropsci1990.0011183X003000050034x
Almeselmani, M., Deshmukh, P. S., Sairam, R. K., Kushwaha, S. R., Singh, T. P. (2006). Protective role of antioxidant enzymes under high temperature stress. Plant Sci. 171, 382–388. doi: 10.1016/j.plantsci.2006.04.009
Altenbach, S. B., Kothari, K. M. (2004). Transcript profiles of genes expressed in endosperm tissue are altered by high temperature during wheat grain development. J. Cereal Sci. 40, 115–126. doi: 10.1016/j.jcs.2004.05.004
Anderson, O. D., DuPont, F. M. (2003). Effect of temperature on expression of genes encoding enzymes for starch biosynthesis in developing wheat endosperm. Plant Sci. 164, 873–881. doi: 10.1016/S0168-9452(03)00076-1
Anjum, F., Wahid, A., Javed, F., Arshad, M. (2008). Influence of foliar applied thiourea on flag leaf gas exchange and yield parameters of bread wheat (Triticum aestivum) cultivars under salinity and heat stresses. Int. J. Agric. Biol. 10, 619–626.
Asana, R. D., Williams, R. F. (1965). The effect of temperature stress on grain development in wheat. Aust. J. Agric. Res. 16, 1–13. doi: 10.1071/AR9650001
Asseng, S. F., Ewert, P., Martre, R. P., Rötter, D. B., Lobell, D., Cammarano, B. A., et al. (2015). Rising temperatures reduce global wheat production. Nat. Climate Change 5, 143–147. doi: 10.1038/nclimate2470
Asseng, S., Foster, I. A. N., Turner, N. C. (2011). The impact of temperature variability on wheat yields. Glob. Change Biol. 17, 997–1012. doi: 10.1111/j.1365-2486.2010.02262.x
Banyai, J., Karsai, I., Kiss, T., Bedo, Z., Lang, L. (2014). Heat stress response of wheat cultivars with different ecological adaptation. Cereal Res. Commun. 42, 413–425. doi: 10.1556/CRC.42.2014.3.5
Barkley, A., Tack, J., Nalley, L. L., Bergtold, J., Bowden, R., Fritz, A. (2013). Weather, disease, and wheat breeding effects on Kansas wheat varietal yields 1985 to 2011. Agron. J. 106, 227–235. doi: 10.2134/agronj2013.0388
Bergkamp, B., Impa, S. M., Asebedo, A. R., Frit, A. K., Jagadish, S. V. K. (2018). Prominent winter wheat varieties response to post-flowering heat stress under controlled chambers and field based heat tents. Field Crops Res. 222, 143–152. doi: 10.1016/j.fcr.2018.03.009
Blum, A. (1998). Improving wheat grain filling under stress by stem reserve mobilization. Euphytica 100, 77–83. doi: 10.1023/A:1018303922482
Blum, A., Sinmena, B., Golan, J., G. and Shpiler, L. (1994). Stem reserve mobilisation supports wheat-grain filling under heat stress. Aust. J. Plant Physiol. 21, 771–781. doi: 10.1071/PP9940771
Cossani, C. M., Reynolds, M. P. (2012). Physiological traits for improving heat tolerance in wheat. Plant Physiol. 160, 1710–1718. doi: 10.1104/pp.112.207753
Dias, A. S., Lidon, F. C. (2009). Evaluation of grain filling rate and duration in bread and durum wheat, under heat stress after anthesis. J. Agron. Crop Sci. 195, 137–147. doi: 10.1111/j.1439-037X.2008.00347.x
FAO (2012). “Feeding the world: Trends in the crop sector,” in FAO statistical yearbook 2012 world food and agriculture (Rome, Italy: FAO), 182–197.
Feldman, M., Levy, A. A. (2015). “Origin and evolution of wheat and related triticeae species,” in Alien introgression in wheat. Eds. Molnár-Láng, M., Ceoloni, C., Doležel, J. (Cham: Springer), 21–76. doi: 10.1007/978-3-319-23494-6_2
Fischer, R., Maurer, R. (1978). Drought resistance in spring wheat cultivars. i. grain yield responses. Aust. J. Agric. Res. 29, 897–912. doi: 10.1071/AR9780897
Fu, J., Bowden, R., Jagadish, K. S. V. (2022). Effects of post-flowering heat stress on chlorophyll content and yield components of a spring wheat diversity panel. Crop Sci. 62, 1926–1936. doi: 10.1002/csc2.20778
Fu, J., Bowden, R., Jagadish, K. S. V., Gill, B. (2017). Genetic variation for tolerance to heat stress in Dasypyrum villosum. Crop Sci. 57, 2626–2632. doi: 10.2135/cropsci2016.12.0978
Fu, J., Bowden, R. L., Prasad, P. V. V., Ibrahim, A. M. H. (2015). Genetic variation for heat tolerance in primitive cultivated subspecies of Triticum turgidum l. J. Crop Improv. 29, 565–580. doi: 10.1080/15427528.2015.1060915
Fu, J., Momcilovic, I., Clemente, T. E., Nersesian, N., Trick, H. N., Ristic, Z. (2008). Heterologous expression of a plastid EF-tu reduces protein thermal aggregation and enhances CO2 fixation in wheat (Triticum aestivum) following heat stress. Plant Mol. Biol. 68, 277–288. doi: 10.1007/s11103-008-9369-6
Fu, J., Momcilovic, I., Prasad., P. V. V. (2012). “Molecular bases and improvement of heat tolerance in crop plants,” in Heat stress: Causes, prevention and treatments, vol. 185–214 . Eds. Josipovic, S., Ludwig, E. (New York: Nova Science Publishers).
Gebbing, T., Schnyder, H. (1999). Pre-anthesis reserve utilization for protein and carbohydrate synthesis in grains of wheat. Plant Physiol. 121, 871–878. doi: 10.1104/pp.121.3.871
Hays, D. B., Do, J. H., Mason, R. E., Morgan, G., Finlayson, S. A. (2007). Heat stress induced ethylene production in developing wheat grains induces kernel abortion and increased maturation in a susceptible cultivar. J. Plant Sci. 172, 1113–1123. doi: 10.1016/j.plantsci.2007.03.004
Hede, A. R., Skoymand, B., Reynolds, M. P., Crossa, J., Vilhelmsen, A. L., Stølen, O. (1999). Evaluating genetic diversity for heat tolerance traits in Mexican wheat landraces. Genet. Resour. Crop Evol. 46, 37–45. doi: 10.1023/A:1008684615643
Hedhly, A., Hormaza, J. I., Herrero, M. (2009). Global warming and sexual plant reproduction. Trends Plant Sci. 14, 30–36. doi: 10.1016/j.tplants.2008.11.001
Heun, M., Schafer-Pregl, R., Klawan, D., Castagna, R., Accerbi, M., Borghi, B., et al. (1997). Site of einkorn wheat domestication identified by DNA fingerprinting. Science. 278, 1312–1314. doi: 10.1126/science.278.5341.1312
Intergovernmental Panel on Climate Change (2015). Climate change 2014: Mitigation of climate change: Working group III contribution to the IPCC fifth assessment report (Cambridge: Cambridge University Press). doi: 10.1017/CBO9781107415416
Jagadish, S. V. K., Bahuguna, R. N., Djanaguiraman, M., Gamuyao, R., Prasad, P. V. V., Craufurd, P. Q. (2016). Implications of high temperature and elevated CO2 on flowering time in plants. Front. Plant Sci. 7. doi: 10.3389/fpls.2016.00913
Jenner, C. F. (1994). Starch synthesis in the kernel of wheat under high temperature conditions. funct. Plant Biol. 21, 791–806. doi: 10.1071/PP9940791
Kaur, V., Behl, R. K. (2010). Grain yield in wheat as affected by short periods of high temperature, drought and their interaction during pre- and post-flowering stages. Cereal Res. Commun. 38, 514–520. doi: 10.1556/CRC.38.2010.4.8
Keeling, P. L., Bacon, P. J., Holt, D. C. (1993). Elevated temperature reduces starch deposition in wheat endosperm by reducing the activity of soluble starch synthase. Planta 191, 342–348. doi: 10.1007/BF00195691
Kumari, M., Pudake, R. N., Singh, V. P., Joshi, A. K. (2013). Association of staygreen trait with canopy temperature depression and yield traits under terminal heat stress in wheat (Triticum aestivum l.). Euphytica 190, 87–97. doi: 10.1007/s10681-012-0780-3
Kumar, U., Joshi, A. K., Kumari, M., Paliwal, R., Kumar, S., Roder, M. S. (2010). Identification of QTLs for stay green trait in wheat (Triticum aestivum l.) in the 'Chirya 3' x 'Sonalika' population. Euphytica 190, 437–445. doi: 10.1007/sl0681-010-0155-6
Kuroyanagi, T., Paulsen, G. M. (1985). Mode of high temperature injury to wheat II. comparisons of wheat and rice with and without inflorescence. Physiol. Plant 65, 203–208. doi: 10.1111/j.1399-3054.1985.tb02383.x
Lobell, D. B., Oritz-Monasterio, J. I., Asner, G. P., Matson, P. A., Naylor, R. L., Falcon, W. P. (2005). Analysis of wheat yield and climatic trends in Mexico. Field Crops Res. 94, 250–256. doi: 10.1016/j.fcr.2005.01.007
Lobell, D. B., Schlenker, W., Costa-Roberts, J. (2011). Climate trends and global crop production since 1980. Science. 333, 616–620. doi: 10.1126/science.1204531
Lopes, M. S., Reynolds, ,. M. P. (2012). Stay-green in spring wheat can be determined by spectral reflectance measurements (normalized difference vegetation index) independently from phenology. J. Exp. Bot. 63, 3789–3798. doi: 10.1093/jxb/ers071
Mathur, S., Agrawal, D., Jajoo, A. (2014). Photosynthesis: response to high temperature stress. J. Photochem. Photobiol. B Biol. 137, 116–126. doi: 10.1016/j.jphotobiol.2014.01.010
Mishra, D., Shekhar, S., Chakraborty, S., Chakraborty, N. (2021). High temperature stress responses and wheat impacts and alleviation strategies. Environ. Exp. Bot. 190, 104589. doi: 10.1016/j.envexpbot.2021.104589
Mullarkey, M., Jones, P. (2000). Isolation and analysis of thermotolerant mutants of wheat. J. Exp. Bot. 51, 139–146. doi: 10.1093/jxb/51.342.139
Nawaz, A., Farooq, M., Cheema, S. A., Wahid, A. (2013). Differential response of wheat cultivars to terminal heat stress. Int. J. Agric. Biol. 15, 1354–1358.
Ratteya, A., Shorter, R. ,. R., Chapmana, S. C. (2011). Evaluation of CIMMYT conventional and synthetic spring wheat germplasm in rainfed sub-tropical environments. II. grain yield components and physiological traits. Field Crops Res. 124, 195–204. doi: 10.1016/j.fcr.2011.02.006
Rezaei, E., Siebert, S., Manderscheid, R., Müller, J., Mahrookashani, A., Ehrenpfordt, B., et al. (2018). Quantifying the response of wheat yields to heat stress. the role of the experimental setup. Field Crops Res. 217, 93–103. doi: 10.1016/j.fcr.2017.12.015
Ristic, Z., Bukovnik, U., Prasad, P. V. V., West, M. (2008). A model for prediction of heat stability of photosynthetic membranes. Crop Sci. 48, 1513–1522. doi: 10.2135/cropsci2007.11.0648
Ristic, Z., Momcilovic, I., Bukovnik, U., Prasad, P. V. V., Fu, J., DeRidder, B. P. (2009). Rubisco activase and wheat productivity under heat-stress conditions. J. Exp. Bot. 60, 4003–4014. doi: 10.1093/jxb/erp241
Ristic, Z., Momcilovic, I., Fu, J., Callegari, E., DeRidder, B. (2007). Chloroplast protein synthesis elongation factor, EF-tu, reduces thermal aggregation of rubisco activase. J. Plant Physiol. 164, 1564–1571. doi: 10.1016/j.jplph.2007.07.008
Sareen, S., Tyagi, B. S., Tiwari, V., Sharma, I. (2012). Response estimation of wheat synthetic lines to terminal heat stress using stress indices. J. Agric. Sci. 4, 97–104. doi: 10.5539/jas.v4n10p97
Sebela, D., Bergkamp, B., Impa, S. M., Fritz, A. K., Jagadish, S. V. K. (2020). Impact of post-flowering heat stress on spike and flag leaf senescence in wheat tracked through optical signals. Agron. J. 112, 3993–4006. doi: 10.1002/agj2.20360
Semenov, M. A., Halford, N. G. (2009). Identifying target traits and molecular mechanisms for wheat breeding under a changing climate. J. Exp. Bot. 60, 2791–2804. doi: 10.1093/jxb/erp164
Sharma, D. K., Torp, A. M., Rosenqvist, E., Ottosen, C. O., Andersen, S. B. (2017). QTLs and potential candidate genes for heat stress tolerance identified from the mapping populations specifically segregating for Fv/Fm in wheat. Front. Plant Sci. 8, e1668. doi: 10.3389/fpls.2017.01668
Tiwari, C., Wallwork, H., Kumar, U., Dhari, R., Arun, B., Mishra, V. K., et al. (2013). Molecular mapping of high temperature tolerance in bread wheat adapted to the Eastern gangetic plain region of India. Field Crops Res. 154, 201–210. doi: 10.1016/j.fcr.2013.08.004
Todorov, D., Karanov, E., Smith, A. R., Hall, M. A. (2003). Chlorophyllase activity and chlorophyll content in wild and mutant plants of arabidopsis thaliana. Biol. Plant 46, 125–127. doi: 10.1023/A:1022355525907
Wahid, A., Gelani, S., Ashraf, M., Foolad, M. R. (2007). Heat tolerance in plants: An overview. Environ. Exp. Bot. 61, 199–223. doi: 10.1016/j.envexpbot.2007.05.011
Wan, Y., Poole, R. L., Huttly, A. K., Toscano-Underwood, C., Feeney, K., Welham, S., et al. (2008). Transcriptome analysis of grain development in hexaploid wheat. BMC Genom. 9, e121. doi: 10.1186/1471-2164-9-121
Wardlaw, I. F. (1994). The effect of high temperature on kernel development in wheat: Variability relating to pre-heading and post-anthesis conditions. Aust. J. Plant Physiol. 21, 731–739. doi: 10.1071/PP9940731
Wiegand, C. L., Cuellar, J. A. (1981). Duration of grain filling and kernel weight of wheat as affected by temperature. Crop Sci. 21, 95–101. doi: 10.2135/cropsci1981.0011183X001100010027x
Keywords: heat stress, wheat, chlorophyll, yield components, controlled environment
Citation: Fu J, Bowden RL, Jagadish SVK and Prasad PVV (2023) Genetic variation for terminal heat stress tolerance in winter wheat. Front. Plant Sci. 14:1132108. doi: 10.3389/fpls.2023.1132108
Received: 26 December 2022; Accepted: 23 January 2023;
Published: 22 February 2023.
Edited by:
Yang Gao, Farmland Irrigation Research Institute (CAAS), ChinaReviewed by:
Milan Mirosavljević, Institute of Field and Vegetable Crops, SerbiaQingwu Xue, Texas A&M AgriLife Research, United States
Copyright © 2023 Fu, Bowden, Jagadish and Prasad. This is an open-access article distributed under the terms of the Creative Commons Attribution License (CC BY). The use, distribution or reproduction in other forums is permitted, provided the original author(s) and the copyright owner(s) are credited and that the original publication in this journal is cited, in accordance with accepted academic practice. No use, distribution or reproduction is permitted which does not comply with these terms.
*Correspondence: Jianming Fu, amlhbm1pbmdAa3N1LmVkdQ==