 Ningyi Zhang1*
 Sarah R. Berman1
 Dominique Joubert2Silvere Vialet-Chabrand1
 Leo F. M. Marcelis1
 Elias Kaiser1*
- 1Horticulture and Product Physiology, Department of Plant Sciences, Wageningen University & Research, Wageningen, Netherlands
- 2Biometris, Department of Mathematical and Statistical Methods, Wageningen University & Research, Wageningen, Netherlands
A Corrigendum on
Variation of photosynthetic induction in major horticultural crops is mostly driven by differences in stomatal traits
by Zhang N, Berman SR, Joubert D, Vialet-Chabrand S, Marcelis LFM and Kaiser E (2022). Front. Plant Sci. 13:860229. doi: 10.3389/fpls.2022.860229
In the published article, there was an error in Table 2 as published. Stomatal size should have been calculated as π × stomatal length × stomatal width/4, therefore, all stomatal size values reported in this table (i.e. SSab and SSad) should have been divided by four. The corrected Table 2 and its caption “Definition, unit, maximum, minimum, mean and coefficient of variation (CV) for dynamic, steady-state, anatomical and physiological traits across 19 horticultural genotypes. Maximum and minimum values are average values of 6-9 replicates” appears below.
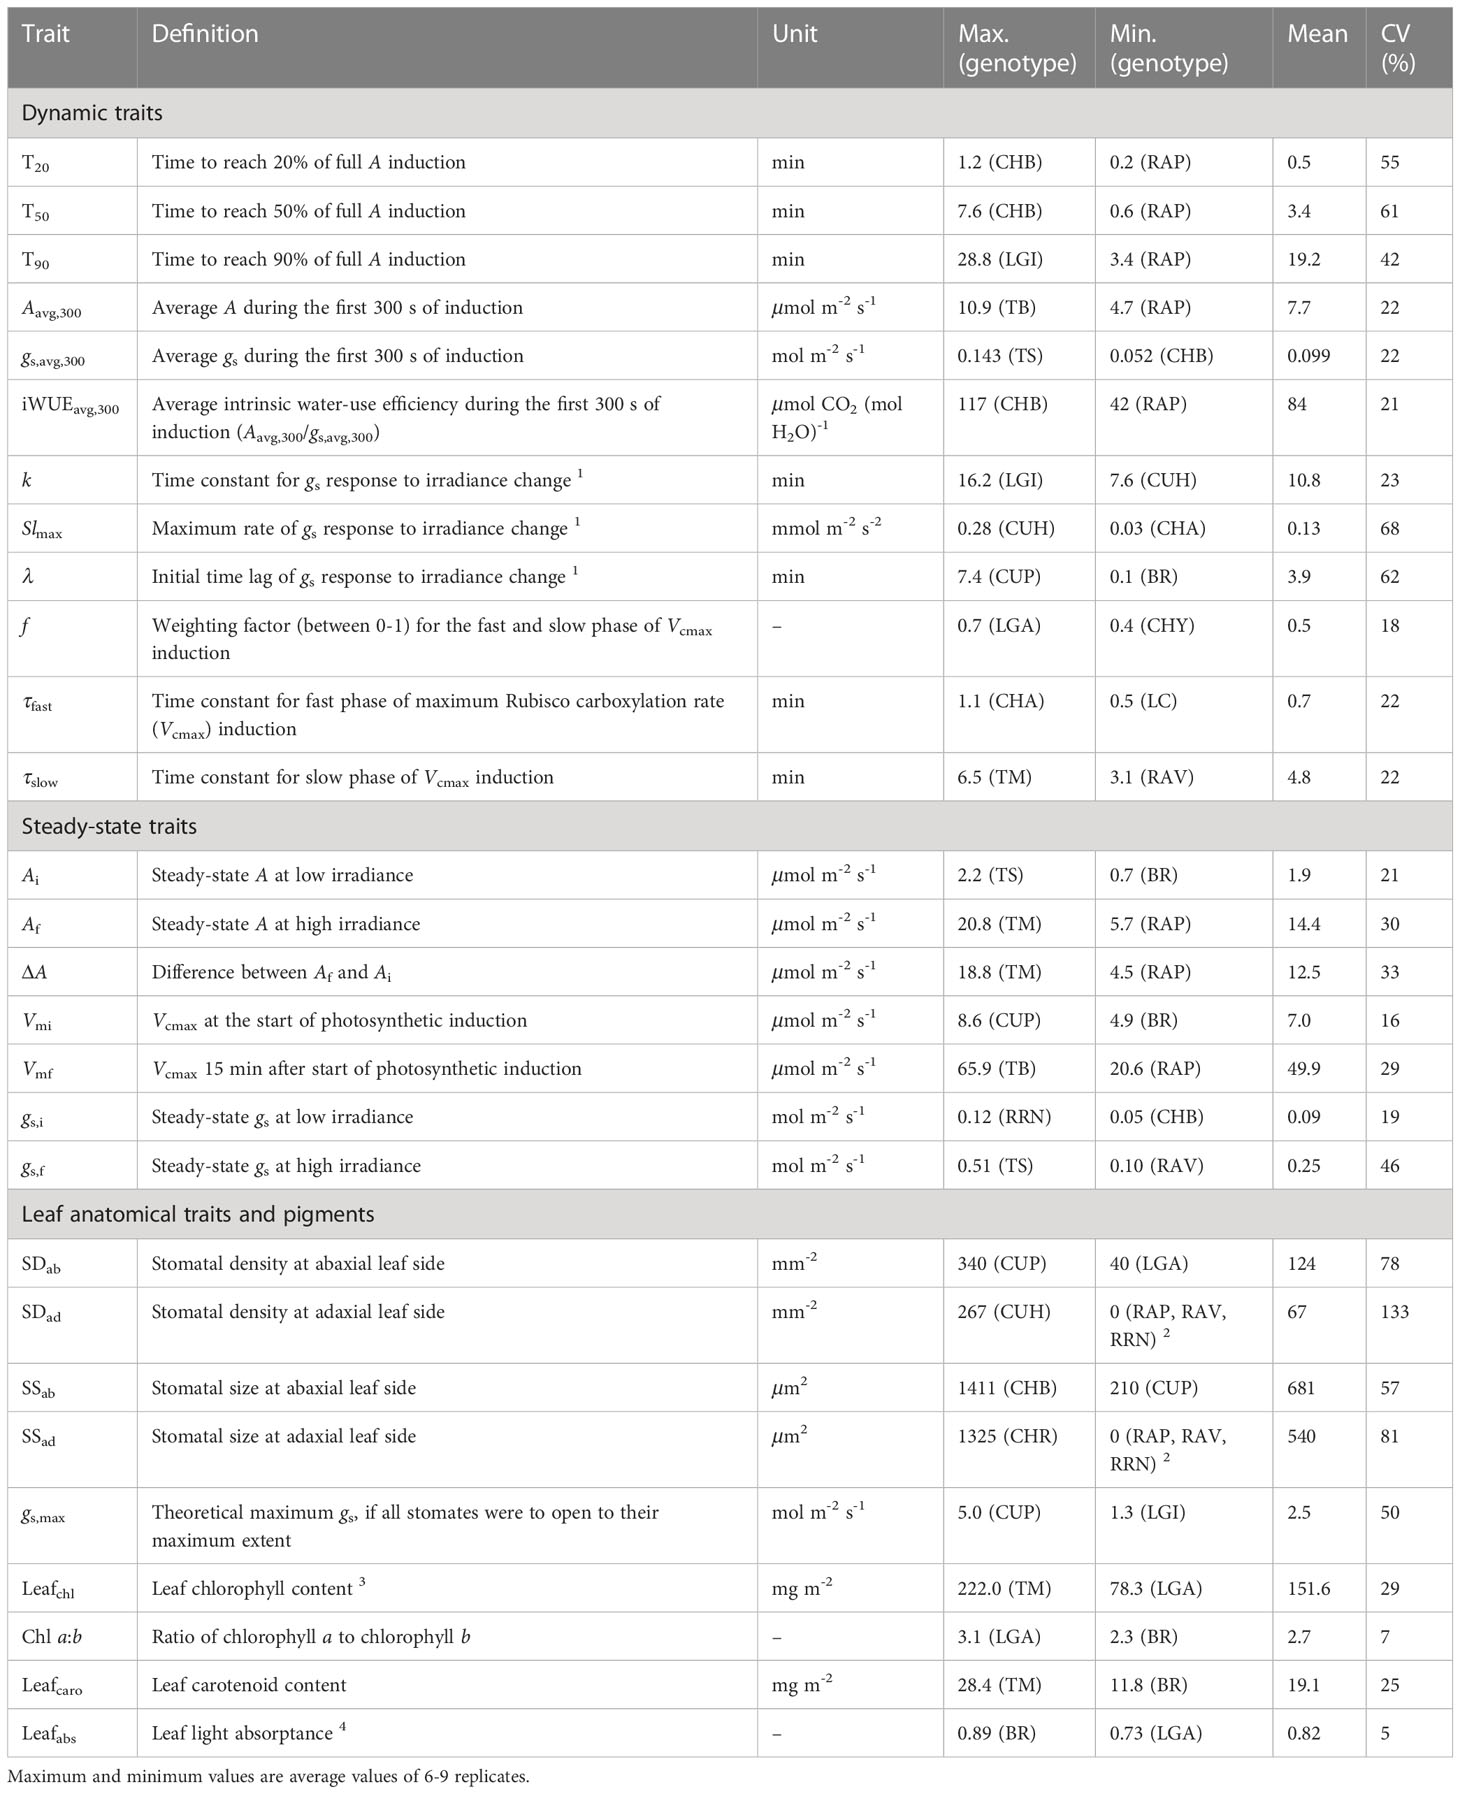
Table 2 Definition, unit, maximum, minimum, mean and coefficient of variation (CV) for dynamic, steady-state, anatomical and physiological traits across 19 horticultural genotypes.
In the published article, there was an error in Figure 5 as published. Stomatal size should have been calculated as π × stomatal length × stomatal width/4, therefore, the numbers shown in Figure 5A should have been divided by four. The corrected Figure 5 and its caption “Stomatal size (A; SSab) and density (B; SDab) at the abaxial leaf side, and theoretical maximum stomatal conductance (C; gs,max) of all 19 horticultural genotypes. Colours indicate crop species. Bars show means ± s.e. (n = 7-9). Letters indicate significant differences (p < 0.05). Statistical test results of SSab, SDab and gs,max were based on log transformation of the data. See Table 1 for full genotype names” appears below.
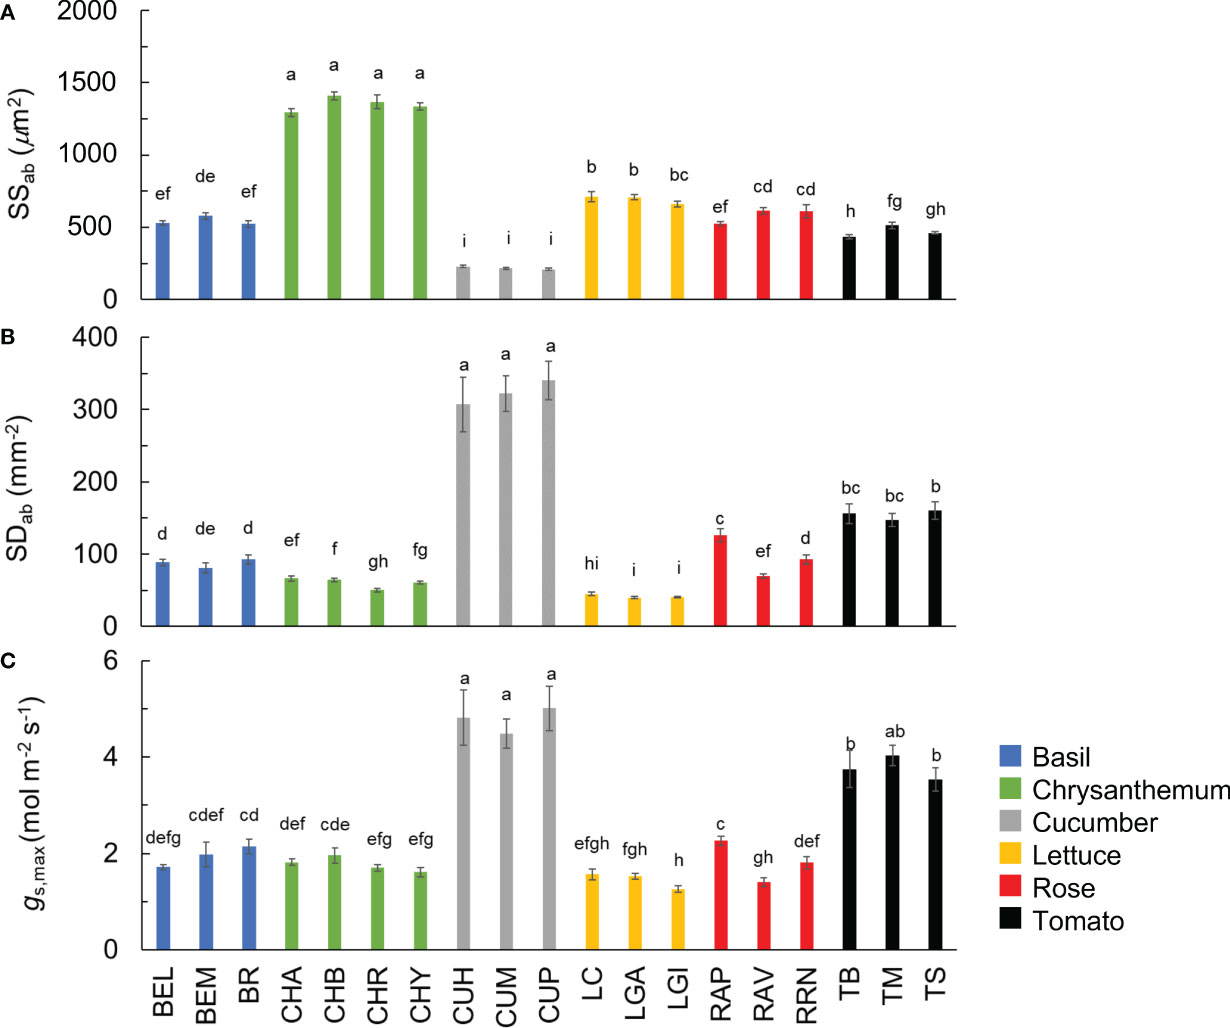
Figure 5 Stomatal size (A; SSab) and density (B; SDab) at the abaxial leaf side, and theoretical maximum stomatal conductance (C; gs,max) of all 19 horticultural genotypes. Colours indicate crop species. Bars show means ± s.e. (n = 7-9). Letters indicate significant differences (p < 0.05). Statistical test results of SSab, SDab and gs,max were based on log transformation of the data. See Table 1 for full genotype names.
The authors apologize for this error and state that this does not change the scientific conclusions of the article in any way. The original article has been updated.
In the published article, there was an error in Supplementary Data Sheet 1. All numbers along the x-axis of Figure S7A-E and along the y-axis of Figure S7E (i.e. stomatal size, which should have been calculated as π × stomatal length × stomatal width/4) in Supplementary Data Sheet 1 should have been divided by four. The correct material statement appears below.
Publisher’s note
All claims expressed in this article are solely those of the authors and do not necessarily represent those of their affiliated organizations, or those of the publisher, the editors and the reviewers. Any product that may be evaluated in this article, or claim that may be made by its manufacturer, is not guaranteed or endorsed by the publisher.
Keywords: induction, genotypic variation, light fluctuations, modeling, photosynthesis, Rubisco activation, stomatal opening
Citation: Zhang N, Berman SR, Joubert D, Vialet-Chabrand S, Marcelis LFM and Kaiser E (2023) Corrigendum: Variation of photosynthetic induction in major horticultural crops is mostly driven by differences in stomatal traits. Front. Plant Sci. 14:1252101. doi: 10.3389/fpls.2023.1252101
Received: 03 July 2023; Accepted: 18 July 2023;
Published: 02 August 2023.
Edited and Reviewed by:
Ivan A. Paponov, Aarhus University, DenmarkCopyright © 2023 Zhang, Berman, Joubert, Vialet-Chabrand, Marcelis and Kaiser. This is an open-access article distributed under the terms of the Creative Commons Attribution License (CC BY). The use, distribution or reproduction in other forums is permitted, provided the original author(s) and the copyright owner(s) are credited and that the original publication in this journal is cited, in accordance with accepted academic practice. No use, distribution or reproduction is permitted which does not comply with these terms.
*Correspondence: Ningyi Zhang, bmluZ3lpLnpoYW5nQG5qYXUuZWR1LmNu; Elias Kaiser, ZWxpYXMua2Fpc2VyQHd1ci5ubA==