 Guoping Shu1*†
 Aifang Wang1†
 Xingchuan Wang2,3†
 Ruijie Chen2,3Fei Gao2,3Aifen Wang2,3Ting Li1Yibo Wang2,3*
- 1Center of Biotechnology, Beijing Lantron Seed, LongPing High-tech Corp., Zhengzhou, Henan, China
- 22Experiment Station, Henan LongPing-Lantron AgriScience and Technology Co., LTD, Zhengzhou, Henan, China
- 3LongPing High-tech Corp., Zhengzhou, Henan, China
Plant height (PH) and ear height (EH) are important traits associated with biomass, lodging resistance, and grain yield in maize. There were strong effects of genotype x environment interaction (GEI) on plant height and ear height of maize. In this study, 203 maize inbred lines were grown at five locations across China’s Spring and Summer corn belts, and plant height (PH) and ear height (EH) phenotype data were collected and grouped using GGE biplot. Five locations fell into two distinct groups (or mega environments) that coincide with two corn ecological zones called Summer Corn Belt and Spring Corn Belt. In total, 73,174 SNPs collected using GBS sequencing platform were used as genotype data and a recently released multi-environment GWAS software package IIIVmrMLM was employed to identify QTNs and QTN x environment (corn belt) interaction (QEIs); 12 and 11 statistically significant QEIs for PH and EH were detected respectively and their phenotypic effects were further partitioned into Add*E and Dom*E components. There were 28 and 25 corn-belt-specific QTNs for PH and EH identified, respectively. The result shows that there are a large number of genetic loci underlying the PH and EH GEIs and IIIVmrMLM is a powerful tool in discovering QTNs that have significant QTN-by-Environment interaction. PH and EH candidate genes were annotated based on transcriptomic analysis and haplotype analysis. EH related-QEI S10_135 (Zm00001d025947, saur76, small auxin up RNA76) and PH related-QEI S4_4 (Zm00001d049692, mads32, encoding MADS-transcription factor 32), and corn-belt specific QTNs including S10_4 (Zm00001d023333, sdg127, set domain gene127) and S7_1 (Zm00001d018614, GLR3.4, and glutamate receptor 3.4 or Zm00001d018616, DDRGK domain-containing protein) were reported, and the relationship among GEIs, QEIs and phenotypic plasticity and their biological and breeding implications were discussed.
Introduction
Maize is a cereal plant of the grass family (Poaceae) and its domesticated form, the grain corn, is one of the most important crop for food, feed, energy, and industrial materials in the world. China is the second largest grain corn producer after USA and Summer corn belt (33%) and Spring corn belt (47%) are ecological regions that contribute 80% of China’s total corn grain output (Shu et al., 2021; Dai et al., 2010). Plant height and ear height are two important maize traits that affect biomass, lodging resistance, and corn grain yield. Enhancing yield and yield stability through genetically controlling plant height and ear height have been important goals in maize genetics and corn breeding. A large number of QTL and QTN loci in maize that associated with plant height and ear height have been identified and reported by quantitative trait loci (QTL) mapping and genome-wide association studies (GWAS) and verified by genetic fine mapping, transcriptomic analyses, and functional genetic analysis (Bai et al., 2010; Zhang et al., 2011; Li et al., 2016; Zheng et al., 2016; Ding et al., 2017; Si et al., 2020; Wang et al., 2023; Jin et al., 2023; Napier et al., 2023; Zhou et al., 2023); among them, Dwarf 8, Dwarf 9 encodes maize DELLA proteins (Lawit et al., 2010), Ga3ox2 encodes a GA3 b-hydroxylase (Teng et al., 2013), ZmTE1, likely regulates auxin signaling, cell division, and cell elongation (Wang et al., 2022a), ZmRPH1 that regulate both plant height and ear height, encodes a microtubule-associated protein (Li et al., 2020), ZmDLE1 is associated with a candidate gene that effectively regulate maize plant height and ear height (Zhou et al., 2023), and a set of growth regulating factors genes (ZmGRF) that co-express with a large set of plant height and ear height loci (Si et al., 2020). In the classic Brachytic2 locus (Multani et al., 2003), a number of different alleles or genetic variants have been reported that show various degree of phenotype effect on plant height and ear height and that differentially regulate downstream genes involved in gibberellin and brassinosteroid biosynthesis, auxin transport and cellulose synthesis (Xing et al., 2015; Wei et al., 2018).
Phenotypic plasticity is the property of a given genotype to produce different phenotypes in response to distinct environmental conditions (Pigliucci, 2001) or the ability of a single genotype to produce different phenotypes in response to environmental stimuli (Napier et al., 2023) and it is a joint result of overall environmental effect and genetic effects across environments (Li et al., 2018; Liu et al., 2020b). Genotype x Environment Interaction (GEI) is a special case of environmental plasticity where the two genotypes respond in opposite directions to the changes in the environment (Mather and Caligari, 1974; Laitinen and Nikoloski, 2019). Genotype x Environment Interaction (GEI) on corn yield and agronomic traits has been a major goal of the USA Maize Genomes to Fields Initiative (Alkhalifah et al., 2018; Rogers et al., 2021). Phenotypic plasticity and GEI in maize and other crops have been well-known in plant height and ear height (Wallace et al., 2016; Perrier et al., 2017; Mu et al., 2022). Some environmental factors, such as the difference between day and night temperature (also referred to as DIF) have been shown to influence internode length and plant height (Myster and Moe, 1995). Corn inbred lines with tropical germplasm introgression have been shown to respond to daylength or photoperiod (Coles et al., 2010; Lin et al., 2021; Su et al., 2021; Fei et al., 2022; Osnato et al., 2022). Explaining and predicting phenotypes requires the holistic examination of genomes, environments, and their interaction throughout the spatial and temporal dimensions of an organism’s life cycle (Li et al., 2021; Schneider, 2022). In traditional G x E studies, a genotype is treated as a black box of the entire genome, and various statistical models were developed to understand the pattern and mechanism of GEI (Mather and Caligari, 1974; Shu and Fan, 1986; Cooper and DeLacy, 1994; Malosetti et al., 2013). Further partitioning Genome x Environmental interaction or GEI into QTN x E (QEI) or Gene x E (GEI)) is a breakthrough and only becomes feasible in recent years with the availability of whole genome sequencing technology, transcriptomic technology, the availability of abundant DNA polymorphic markers such as SNP and SSR, and improved GWAS methodologies (Xiao et al., 2017; Laitinen and Nikoloski, 2019; Li et al., 2022a; Li et al., 2022b; Jin et al., 2023; Napier et al., 2023).
In this study, we have conducted a multi-environment GWAS using the newly released GWAS software package developed by Li et al. (2022a); Li et al. (2022b) called IIIVmrMLM with the objective of detecting QEIs and QTNs, and estimating their additive-by-environment (add*E) and dominance-by-environment (dom*E) interaction effects of QEIs, and additive effects(add) and dominant effects(dom) of corn-belt specific QTNs. Candidate genes in the surrounding chromosomal regions of these QEIs and QTNs are mined and verified by transcriptomic analysis and haplotype analysis, and their implications to understanding the GEI, and phenotypic plasticity of PH and EH were discussed.
Materials and methods
Germplasm and phenotype evaluation
A diversity panel of 490 inbred lines from Shu et al. (2021) was used for this study, 203 inbred lines (accessions) that grow and seed well in both the Summer Corn Belt and Spring Corn Belt were elected for phenotyping in 2013. Five locations or environments with different latitudes across the Summer and Spring Corn Belt that produce over 80% of China’s grain corn were selected for phenotyping, which include a location at the southern end of the Summer Corn Belt, Dancheng (DC, latitude 33.645°N, and longitude 115.177°E) and a location at the northern end of China’s Spring Corn Belt, Binxian (BX, latitude 45.759°N, and longitude 127.486°E), and three locations in between: Zhengzhou (ZZ, latitude 34.859°N, and longitude 113.368°E, Summer Corn Belt), Ningjin (NJ, latitude 37.652°N, and longitude 116.800°E, Summer Corn Belt), and Tieling (TL, latitude 42.547°N, and longitude 124.159°E, Spring Corn Belt). At all five locations, the same set of 203 inbreds were planted in the same three-row plots in a complete randomized design (Niu et al., 2013) and five individuals were randomly sampled from each plot to measure plant height and ear height.
Phenotype and environment analysis
The mean values of each inbred for PH and EH in each location (Table S1) were used in the summary statistics, correlation analysis, GGE biplot, and Two-way ANOVA. Summary statistics were obtained by R package ‘pastecs’, and correlation analysis and plots between different environments for plant height and ear height were completed by R package ‘PerformanceAnalytics’. Mega-environments were identified by GGE biplot using the GGEBiplotGUI_1.0-9 package (Frutos et al., 2014) in RStudio software (RStudio, PBC, Boston, MA, USA). Relationships between PH and EH in each location were examined using Pearson correlation coefficients by R. The mean values of plant height and ear height in each mega-environment group were used as phenotype values to identify the significant QTN-by-environment interactions (QEIs). Two-way ANOVA was carried out using the SAS 9.3 (SAS Institute Inc., Cary, NC, USA).
DNA sequencing, genotyping, linkage disequilibrium and population structure
Leaf sample from each inbred line was used for DNA extraction with a CTAB procedure. DNA sequencing follows a protocol of Elshire et al. (2011). Genomic DNA was digested with the restriction enzyme ApeK1. Genotyping-by-Sequencing or GBS libraries were constructed in 96-plex and sequenced on Illumina HiSeq 2000. SNP calling was performed using the TASSEL-GBS pipeline (Glaubitz et al., 2014) and B73 RefGen V2.0 as the reference genome. Initially, 876,297 SNP was filtered with minor allele frequency (MAF) > 5%, missing rate < 20% (Shu et al., 2021; Shu et al., 2023), and data for 73,174 high-quality SNP loci was kept for genome-wide association studies (GWAS). Minor allele frequency (MAF) and proportion heterozygous of filtered SNPs (73,174 SNPs) was calculated by TASSEL 5.2.25. The percentage of SNP with different Minor allele frequency (MAF) and proportion heterozygous was counted and shown in a bar chart (Figure S1).
Linkage disequilibrium (LD) analysis was carried out by TASSEL 5.2.25 (https://www.maizegenetics.net/tassel, Bradbury et al., 2007) with LD window size 50 for all filtered SNP on each chromosome. Structure 2.3.4 (Hubisz et al., 2009) was used to detect the population structure among all 203 maize inbred lines using 7296 Tag-SNP extracted from 73175 SNPs by Haploview 4.2 (Barrett et al., 2005). Burn-in period and Monte Carlo Markov Chain (MCMC) replication number were set as 5,000 and 50,000 respectively for each run. Seven independent runs were performed with subpopulation number k= 3 to 9. The delta K values were estimated and output by Structure 2.3.4.
Genome wide association studies by IIIVmrMLM
IIIVmrMLM, A software package that implements the 3VmrMLM model (Li et al., 2022a; Li et al., 2022b) was employed for genome-wide association studies (GWAS). In the single-locus module, 3VmrMLM includes two steps: 1) genome-scanning was employed, and SNP loci that were significant (p < 0.01) in Wald test were kept for the following analysis. A midresult file is output after step 1; 2) all the loci identified in step 1 were incorporated into the Multi-locus Model, all the effects were estimated by empirical Bayes, and the loci with LOD score larger than 3.0 of likelihood ratio test were outputted.
In this study, 73,174 filtered SNPs were used as genotype data, the Q matrix was calculated by the Structure 2.3.4 software under the best K value, the parameter “method” was set to “Multi_env” mode, other parameters were set as default values. The critical P-value and LOD score were set as 0.05/m and 3.0, respectively, for significant and suggested QTNs and QEIs, where m is the number of markers (Li et al., 2022b).
To identify QEIs, the phenotype data from five locations were grouped into the summer corn belt group (E1) containing data from three locations (Dancheng, Zhengzhou, Ningjin) and the spring corn belt group (E2, containing data from Tieling and Binxian), the mean value of all locations within each corn-belt group was calculated for each genotype and used as input data to IIIVmrMLM software under “Multi_env” module. The additive-by-environment (add*E) and dominance-by-environment (dom*E) interaction effects of QEIs were estimated and outputted in the final result.
To identify summer corn belt specific QTNs, the trait phenotype data of a genotype from three locations within the Summer Corn Belt was used, and the phenotype value at each location was used as input data for the IIIVmrMLM software under “Multi_env” module. Similarly, phenotype data from two locations within the spring corn belt was used to identify spring corn belt specific QTNs. The additive effects(add) and dominant effects(dom) of corn-belt specific QTNs were estimated and outputted in the final results of Summer and Spring Corn Belt.
Candidate gene annotations of QEIs and QTNs, and patterns of QTN x E interaction
The fasta sequences containing significant QEIs and QTNs identified by IIIVmrMLM were re-aligned to the B73 v4 reference genome using NCBI BLAST-2.12.0+ (Camacho et al., 2009) to obtain a more accurate physical position for better gene annotations (https://www.maizegdb.org/gbrowse). To identify candidate genes that are associated with a QEI or QTN, we first conducted a primary screening within the chromosomal region 100kb up and down the significant QEI or QTN, then software ANOVAR was used for further screening; ANOVAR only output a candidate that meets the following criteria: the significant QTN or QEI is located within the transcriptional sequence of the candidate (further categorized as in Exon (synonymous or non-synonymous), Intron,3′-UTR, and 5′-UTR or within 1kb upstream or downstream of the candidate. The patterns of key QEIs were visualized by line chart.
Candidate gene identification and tissue-specific expression analysis
The polymorphic SNPs surrounding key significant QEIs and QTNs and their PH and EH phenotype association from the midresult file and the relationship between SNPs and gene structures was studied using scatter and gene structure diagram. For each candidate gene, transcriptomic databases at MaizeGDB (MaizeGDB, https://www.maizegdb.org/) were searched for its expression profiles in different organs and tissues across different developmental stages. Haplotype analysis was used to verify the phenotype effect of important QTNs.
Results
Phenotypic analyses and mega-environment grouping
The descriptive statistics for PH and EH at five locations or growth environments are presented in Table 1. Variation of PH, measured by CV ranges from 12% to 15% within each location. The range and the degree of variation in PH in the Spring Corn Belts is larger than in the Summer Corn Belt. The absolute values of kurtosis and skewness were all less than 1 (Table 1), indicating that the phenotype data do not significantly depart from a normal distribution and are suitable for GWAS. Variation of EH measured by CV ranges from 19.3% to 29.6% within each location, Which is larger than PH. The range of variation in EH in the Spring Corn Belt is much larger than in the Summer Corn Belts.
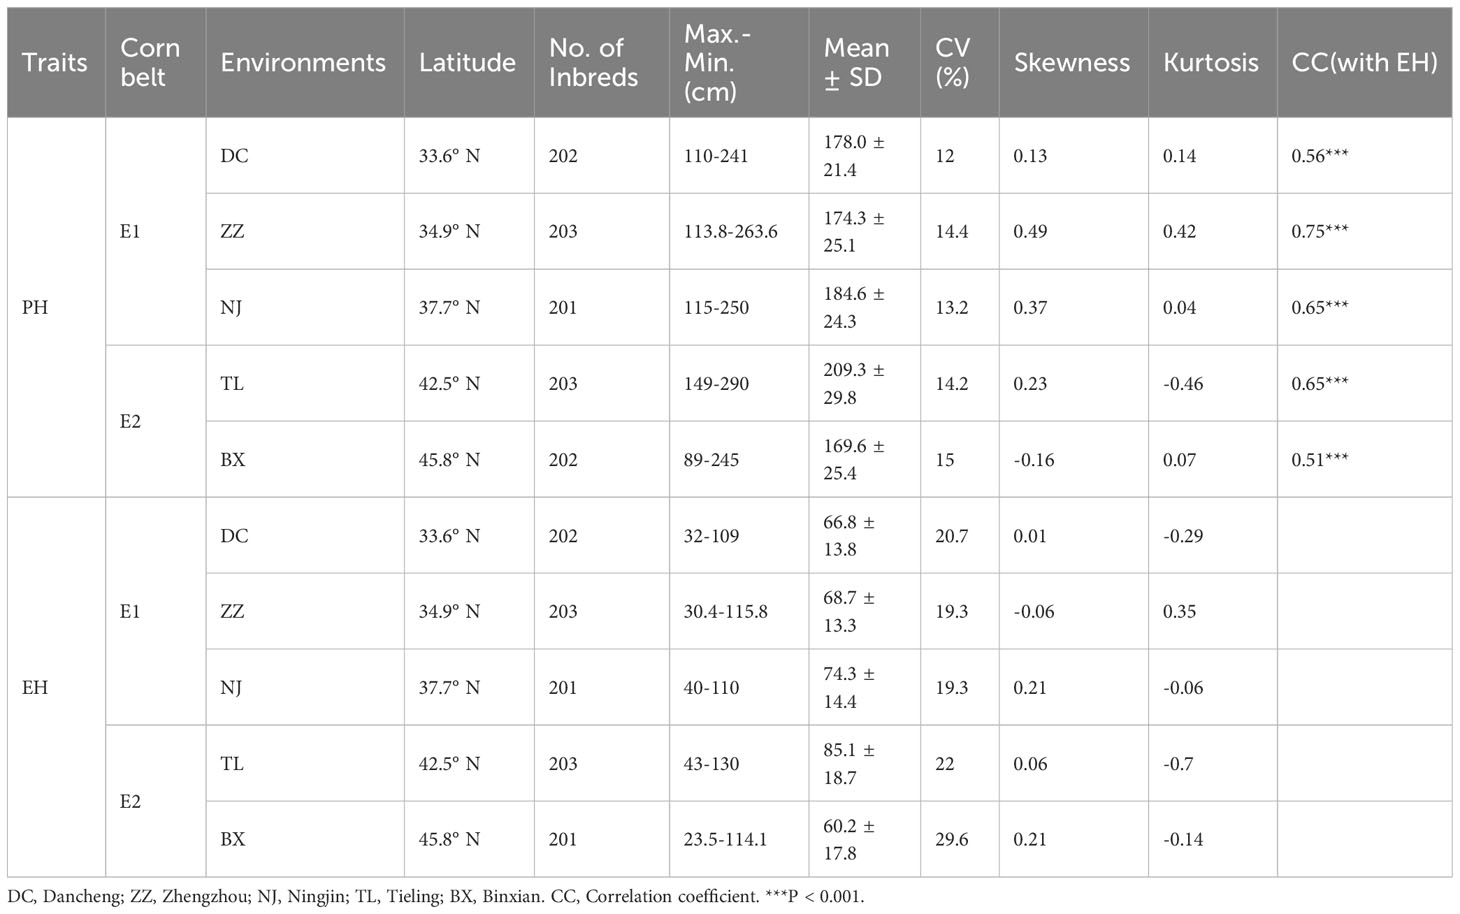
Table 1 Descriptive statistics for PH, EH among 203 accessions across five environments.
The phenotypic correlation between each environment-pair for PH and EH among three Summer Corn Belt locations [Dancheng (DC), Zhengzhou (ZZ), and Ningjin (NJ)] and between two Spring Corn Belt locations Tieling (TL) and Binxian (BX), are shown in Figures 1A and C. As the scatter plot and correlation coefficients in Figure 1A show, the within-corn belt location-pair correlation coefficients (PH*PH) are 0.77, 0.77, and 0.66 for three Summer Corn Belt locations and 0.66 for two Spring Corn Belt locations for PH, which are significant at 0.01 level. Whereas, the six between-corn belt correlation coefficients are from 0.03 to 0.12, which are not significant at the 0.05 level. The same pattern was observed for EH (Figure 1C), suggesting a high location-location correlation within each corn belt and nearly zero location-location correlation between the two corn belts. The lack of phenotypic correlation between the two corn belts was also revealed by biplot for PH (Figure 1B) and EH (Figure 1D), which shows that the location vectors within the same corn belts form tight bundles, and the two vector bundles form a nearly vertical angle. Thus, GGE biplot groups the five locations into two mega environments which fit well with the assignment of five locations into two corn belts widely adopted by maize breeders and grain corn growers. The above analyses revealed the high similarity in a growth environment and in PH and EH phenotype within a corn belt and large divergences in growth environment and PH and EH phenotype between the two corn belts. The correlation coefficients between PH and EH (PH*EH) within each location range from 0.51 to 0.75 (Table 1), which is significant at 0.001 level.
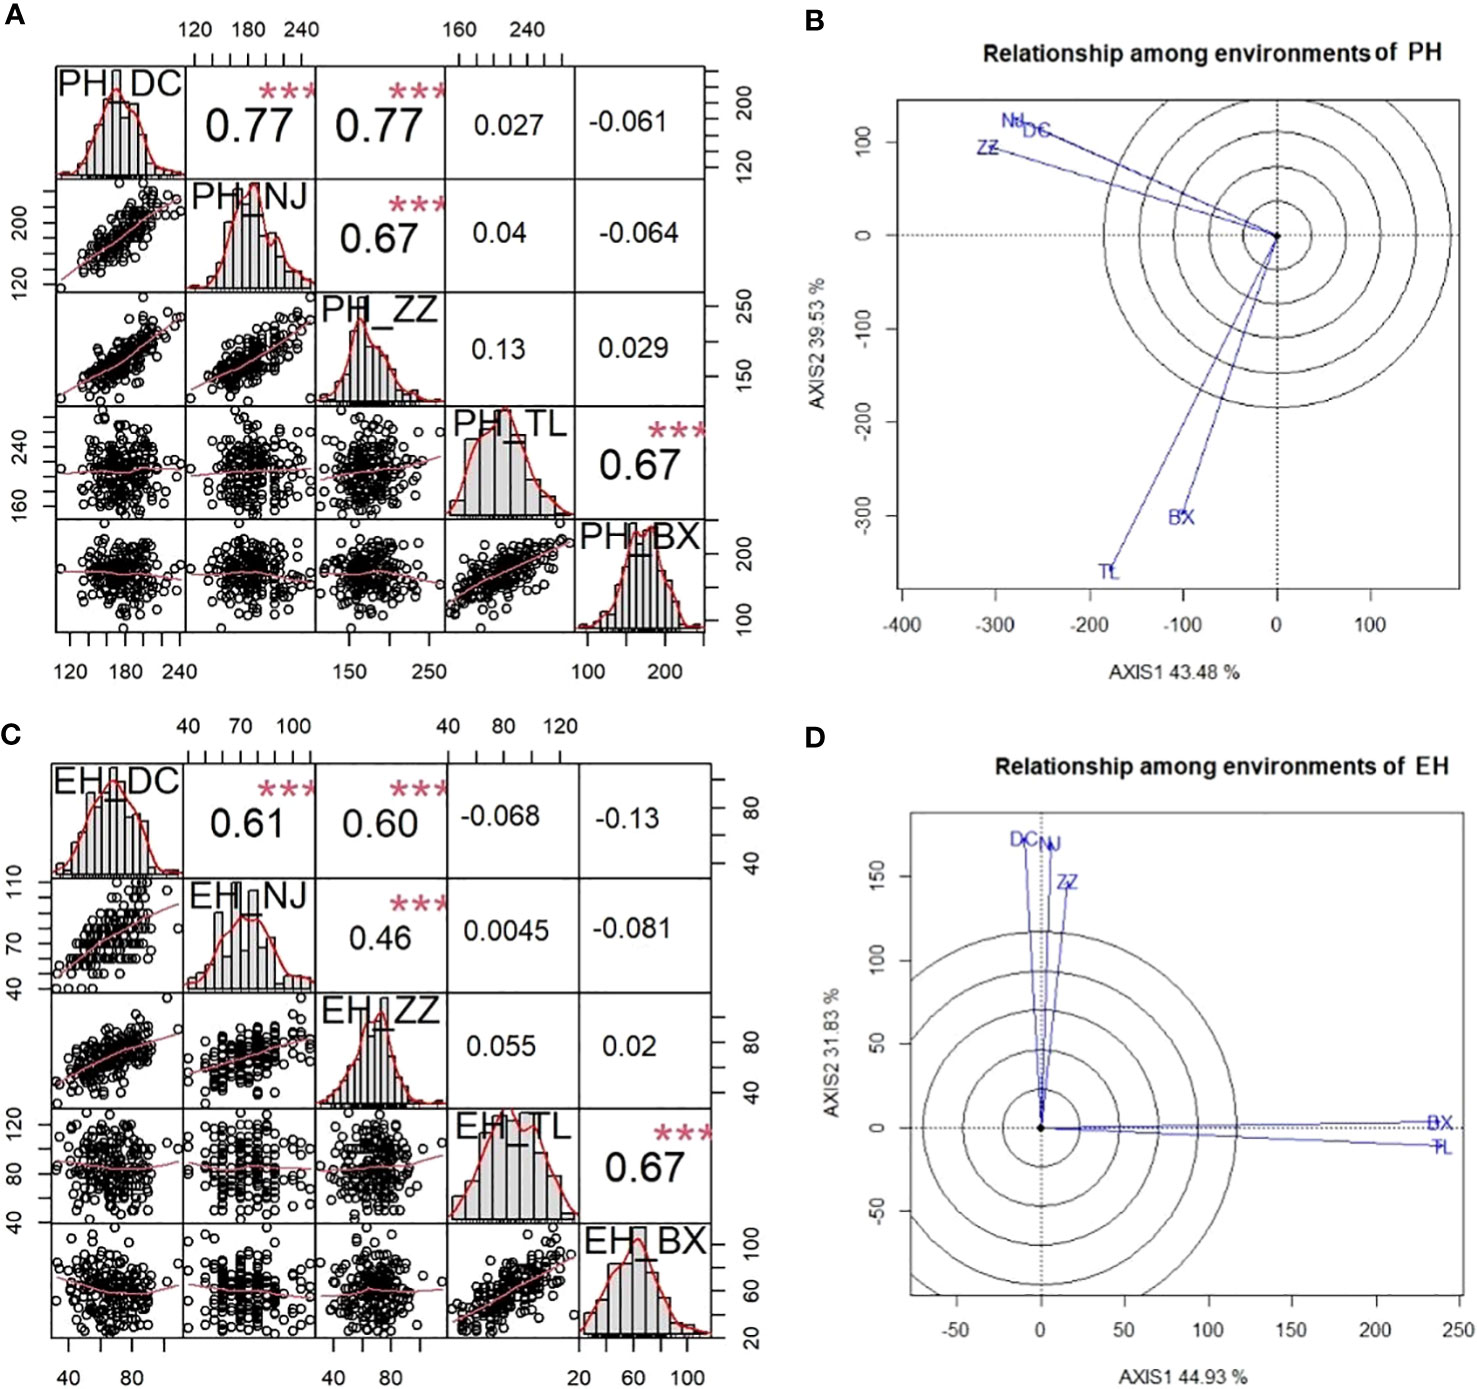
Figure 1 Phenotypic correlations between five environments within and between two corn belts viewed by correlation matrix and GGE biplot for PH and EH. (A) and (C) are correlation matrix among five environments for PH (A) and EH (C); (B) and (D) are GGE biplots for PH (B) and EH (D). ***P < 0.001.
To verify the results of environmental grouping, variance analysis was conducted to reveal the differences between mega environments (Table S2). The results showed that there were significant genotype x mega environment interactions in both PH and EH. Genotype x mega environments accounted for 30.7% and 31.2% of the total variance for PH and EH respectively. Whereas genotype variance accounted for 32.2% and 29.2% of the total variance for PH and EH, respectively. Therefore, genotype x mega environments interaction is a very important factor in determining the phenotypic plasticity observed in PH and EH.
Characteristics of genotype data, linkage disequilibrium and population structure
Among the 876,297 SNPs collected from 203 inbred lines, 73,174 high-quality SNP loci after a filtering procedure (see Material and Methods) were kept for all analyses in this project. The minor allele frequency (MAF) distribution (see Figure S1A) indicates the existence of abundant allelic polymorphism for genome-wide marker-trait association. About 60% of SNPs with heterozygosity less than 5% are only suitable to additive allelic effect analysis (see Figure S1B), the other 40% of SNPs with heterozygosity higher than 5% are suitable to both additive and dominant allelic effect analysis. The LD decay across all 10 chromosomes reached down to r2 = 0.1 when the distance between two adjacent SNP increased up to 60 kb (Figure S2A). The population structure analysis showed that the delta K value reached the peak at K=3, indicating that this diversity panel of 203 inbreds can be divided into three subgroups (Figure S2B), namely, M-Reid+P, SS+Iodent+Lan, and LRC+TSPT, respectively (Figure S2C).
Identification of significant QEIs and the patterns of QTN x E interactions
12 significant QEIs for PH and 11 significant QEIs for EH were identified and reported in Table 2 and they are visualized as pink dots on the Manhattan plots (Figure S3A, B), 9 of 12 QEIs for PH and 8 of 11 QEIs for EH are QEIs with additive effect as a key effect, whereas 3 of 12 QEIs for PH and 3 of 11 QEIs for EH are QEIs with dominant effect as a key effect. S3_224 and S10_135 are two QEIs for EH with the largest LOD (QE) and variance.
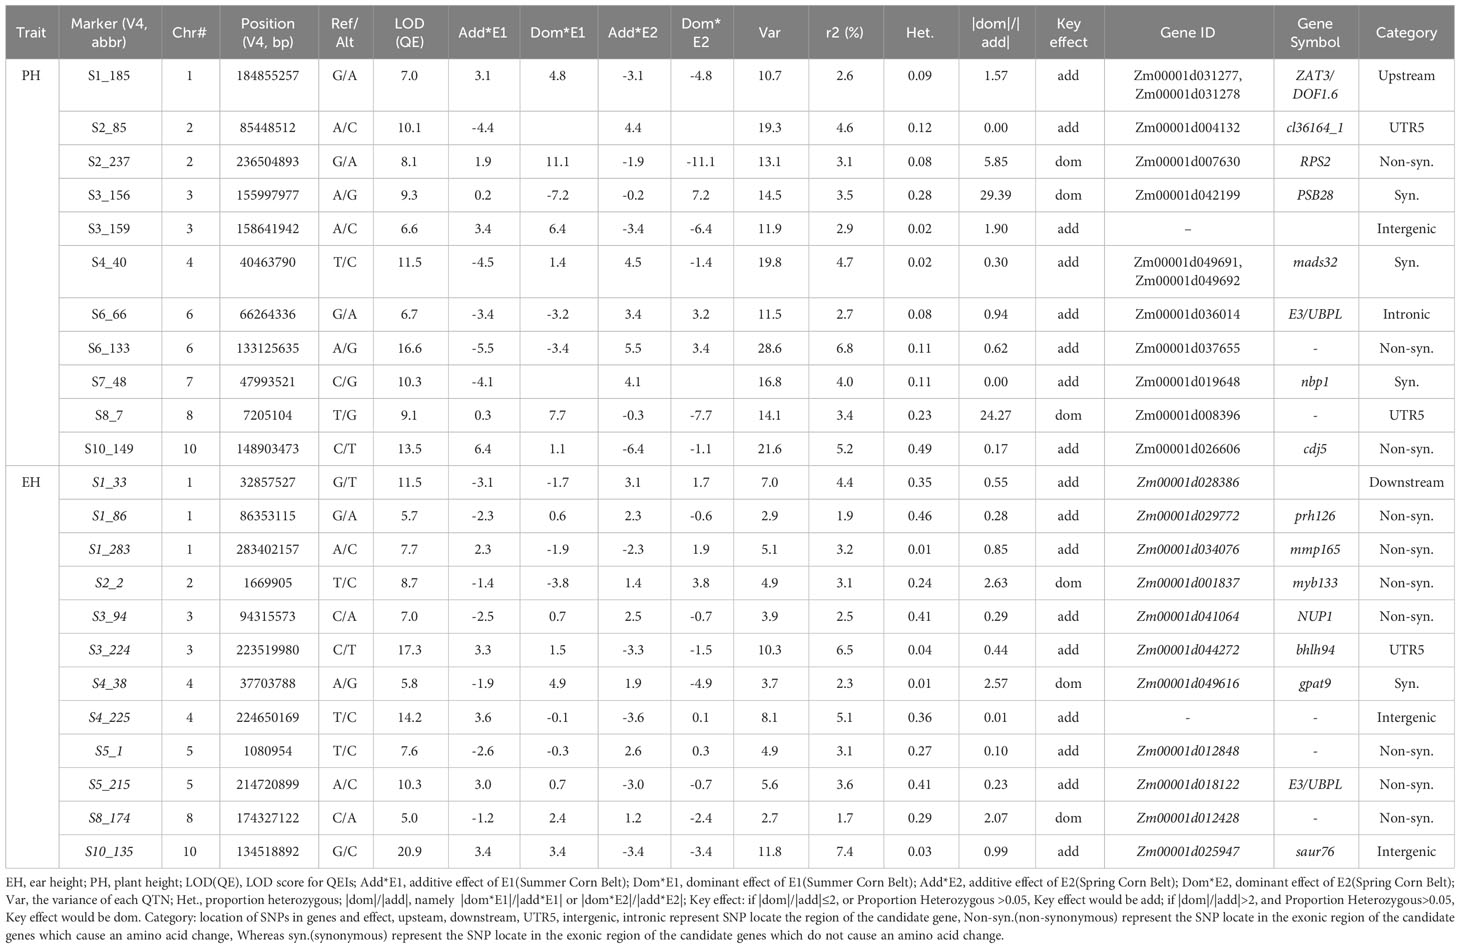
Table 2 QEIs between two mega-environmental groups and associated candidate genes for PH and EH.
To visualize and verify the QTN x environment interaction in QEIs identified from IIIVmrMLM graphically, the patterns of QTN x environment interaction of five QEIs from Table 2 were shown by line chart (Figure 2). The QTN x environment interaction was further partitioned into add*E and dom*E as shown in Table 2. S3_156 is a QEI for PH with large negative dom (dominance)*E1 interaction (-7.2) at E1(Summer Corn Belt) locations and large positive dom (dominance)*E2 interaction (7.2) at E2 (Spring Corn Belt) locations, and with an absolute dom/add ratio of 29.39, Figure 2A illustrates the interaction pattern of its three genotypes and shows that heterozygotic AG genotype has significantly shorter PH than both “AA” and “GG” genotype at Summer Corn Belt (E1), but has much taller PH at Spring Corn Belt (E2). Another QEI with a dominant effect as key effect is S8_7 for PH (Figures 2C), with a high absolute dom/add ratio of 24.27. The QEIs S4_40 for PH and S3_224 for EH are QEIs with additive effect as key effect and absolute dom/add ratio of 0.3 and 0.44, respectively (Table 2), the genotype CC and TT show opposite phenotype performance in the Summer and Spring Corn Belts (Figures 2B, D). The QEI S10_135 has an absolute dom/add ratio of 0.99 (Table 2), indicating a nearly equal amount of dom*E and add*E interaction (Table 2; Figure 2E). The candidate genes for S3_224 and S10_135 are Zm00001d044272 (bhlh94, bHLH-transcription factor 94) and Zm00001d025947 (saur76, small auxin up RNA76), respectively. The candidate genes for S4_40 are Zm00001d049691(SDH6, Succinate dehydrogenase subunit 6 mitochondrial) and Zm00001d049692 (MADS32, MADS-transcription factor 32), likely an important QEI for PH.

Figure 2 Patterns of QTN x E interaction in Summer and Spring Corn Belts for PH and EH. (A–C) three QEIs S3_156 (A), S4_40 (B) and S8_7 (C) for PH; (D, E) two QEIs S3_224 (D) and S10_135 (E) for EH.
Identification of significant corn-belt-specific QTNs and annotations
28 and 23 QTNs for PH and EH respectively were identified from Summer Corn Belt data, thus are called summer-corn-belt-specific QTNs (Table S3; Figure 3). 25 and 26 QTNs for PH and EH respectively were identified within the Spring Corn Belt, and thus are called spring corn belt specific QTNs. Among the total 102 corn-belt specific QTNs reported in Table S3, 56 QTNs show an additive effect as key effect (|dom/add|<2.0) and 46 QTNs show a dominant effect as key effect (|dom/add|>2.0).
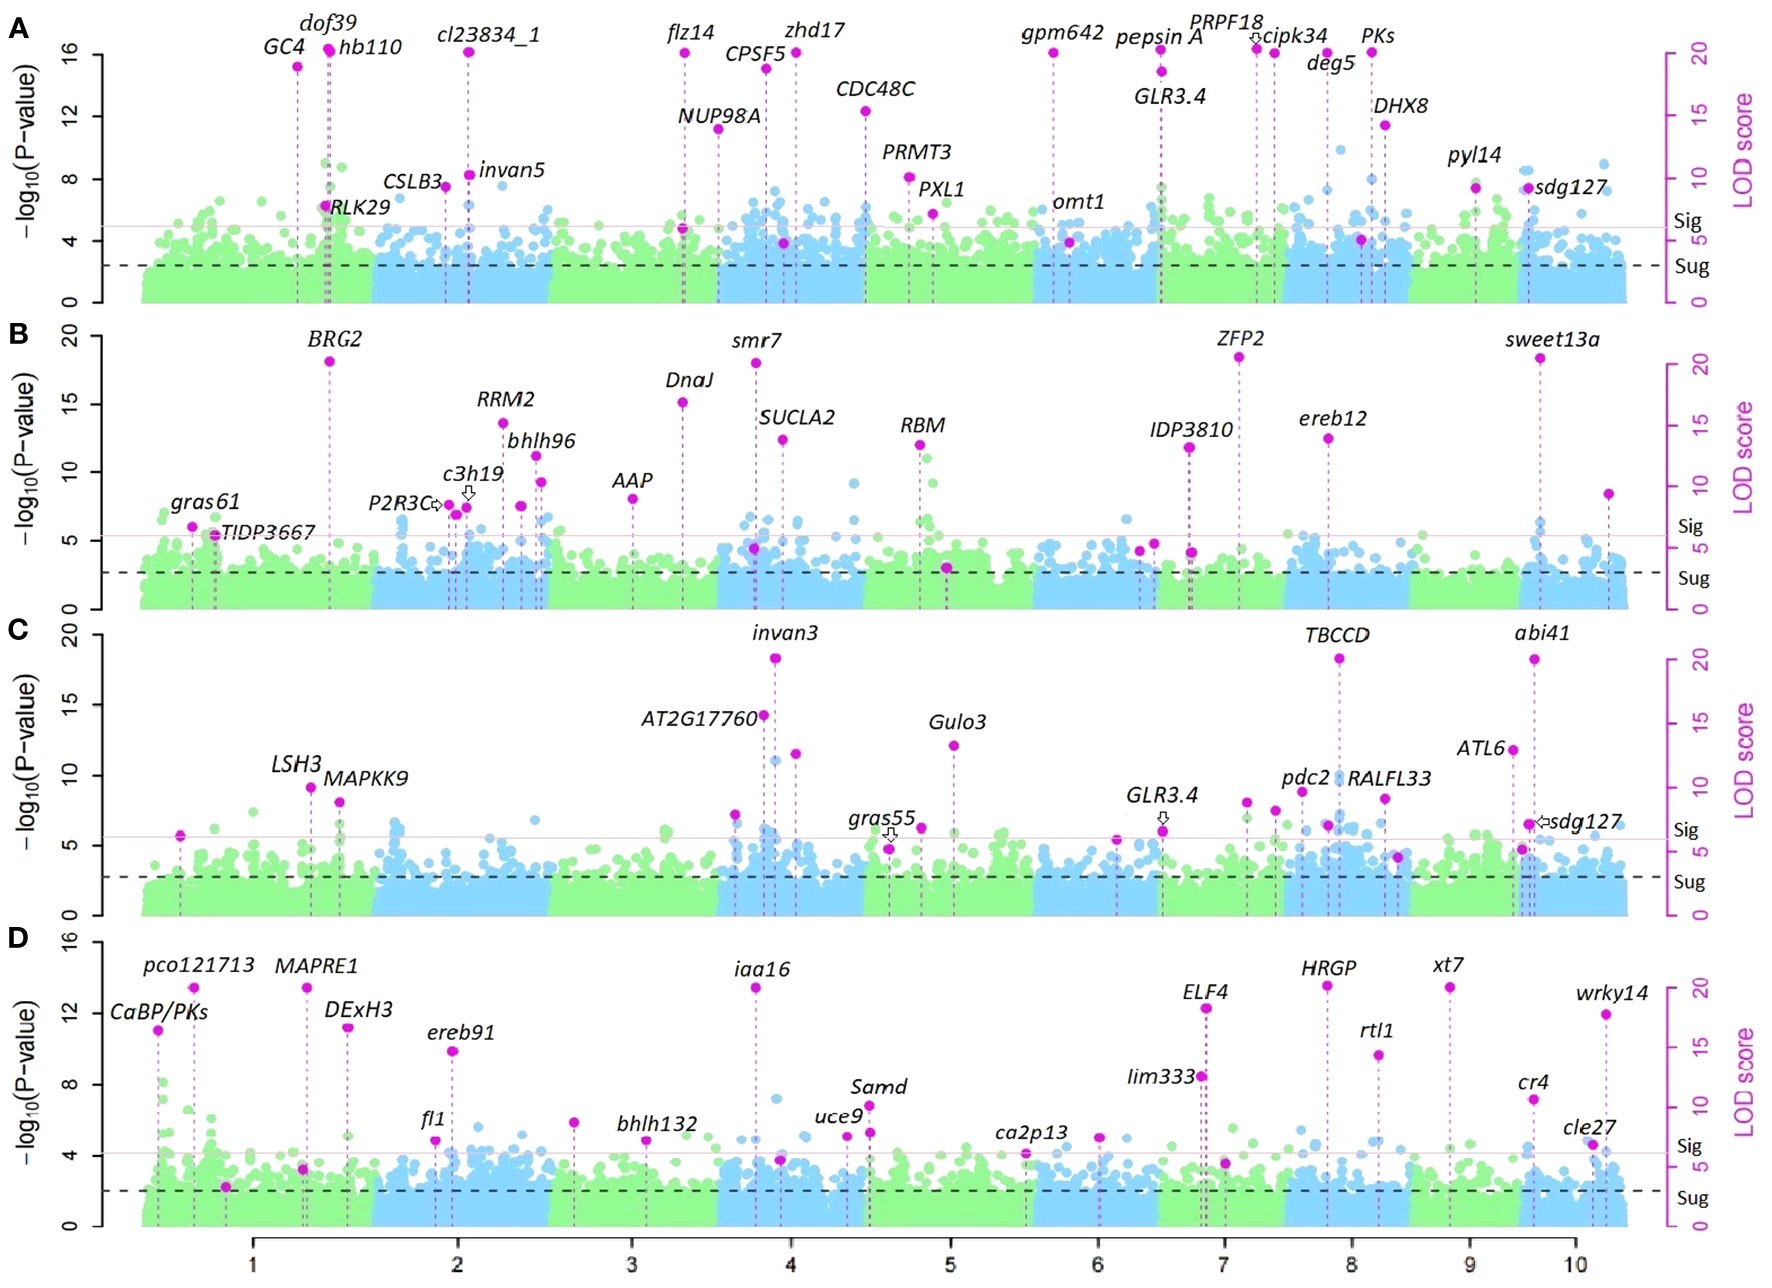
Figure 3 Manhattan plots of corn-belt-specific QTNs for PH and EH in Summer and Spring Corn Belt. (A,B) corn-belt-specific QTNs and candidate genes for PH in Summer Corn Belt (A) and Spring Corn Belt (B); (C, D) corn-belt-specific QTNs and candidate genes for EH in Summer Corn Belt (C) and Spring Corn Belt (D).
QTN S10_4 (Zm00001d023333, sdg127, set domain gene127) and S7_1 (Zm00001d018614, GLR3.4: glutamate receptor 3.4 or Zm00001d018616, DDRGK domain-containing protein) are two significant summer corn belt specific QTNs for both PH and EH (Tables 3, S3). There are a set of candidate genes located within 7.0 Mb region of chromosome 1, near the three summer corn belt specific QTNs S1_255, S1_259, and S1_262; Zm00001d033319 (V4:chr1:258878226:258879592, Auxin-responsive protein IAA4) is located 200kb from S1_259 (V4:chr1:259066746) and Zm00001d033369 (V4:chr1:260633725:260634703, Gibberellin-regulated protein 1) is located between S1_259 and S1_262 (Teale et al., 2006; Wang et al., 2017; Luo et al., 2018; Wang and Wang, 2022b; Wu et al., 2023). Another spring corn belt specific QTN, S1_263 (V4: chr1:262565751) is also located in this region. QTN S1_255, S1_259, and S1_262 have additive effects as key effects in the Summer Corn Belt, and the QTN S1_263 has a dominant effect as key effect in the Spring Corn Belt (Tables 3, S3).
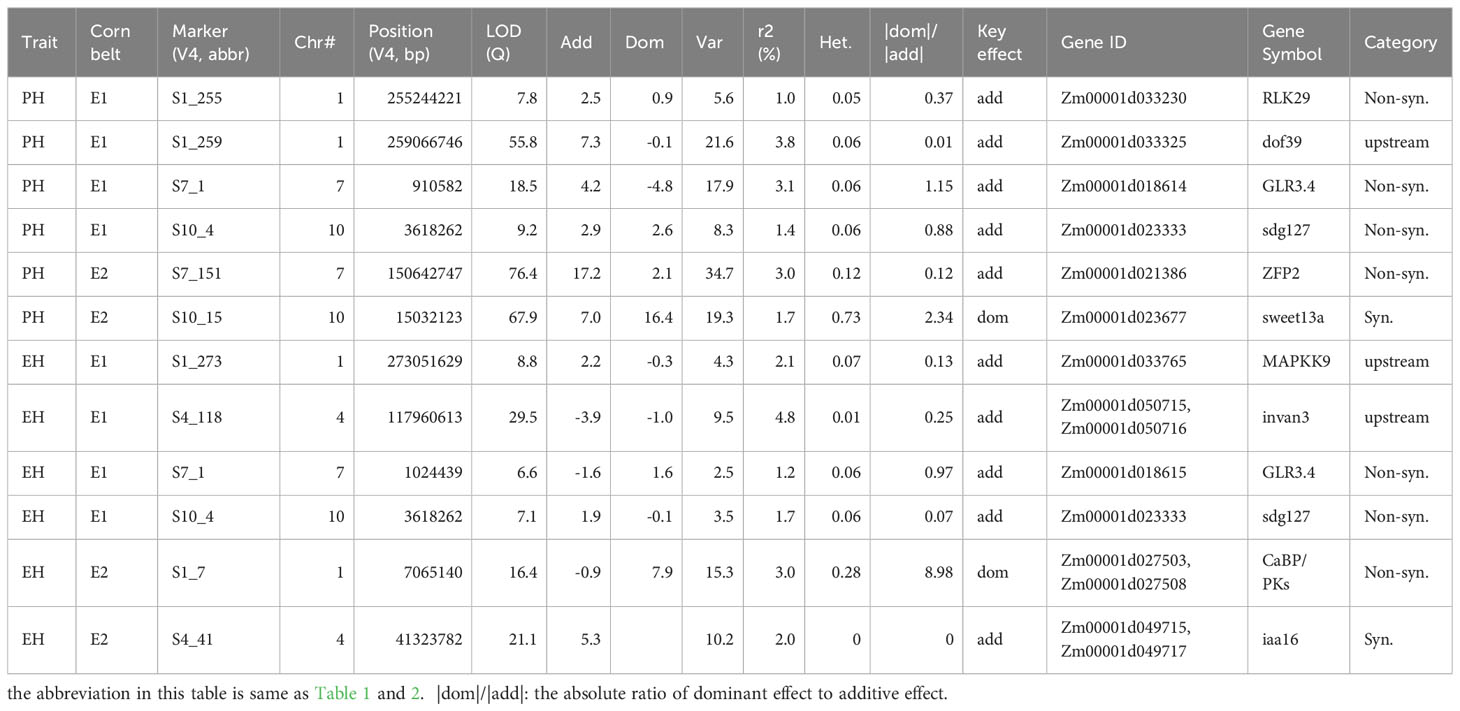
Table 3 Corn-belt-specific QTNs for PH and EH in Summer and Spring Corn Belt.
Candidate genes association mapping and tissue-specific expression analysis
Candidate gene search has found that the significant QEI S3_224 identified by 3VmrMLM is located on the 5’UTR region of Zm00001d044272 (bhlh94), its gene structure is shown in Figure S4. Another QEI, S4_40 (full ID: S4_40463790, V4: chr4:40463790) is on the exon of two partially overlapping candidate genes Zm00001d049691(V4:chr4:40460274 - 40464504) and Zm00001d049692 (chr4:40462578 - 40464305) (Figure 4. Tables 2, S4). Tissue-specific expression analysis shows Zm00001d049691(SDH6) expresses in stems, leaves, embryos, roots, spikelets, and silks, Zm00001d049692 (MADS32) expresses in stems, splikelets, and silks, and Zm00001d049690 (CY P89A2) only expresses in roots (Figure S5). SDH encodes succinate dehydrogenase, which is activated by salt stress (Fedorin et al., 2023) and is also regulated by light (Eprintsev et al., 2016). Another MADS-transcription factors, ZmMADS4 and ZmMADS67 both increase leaf number and delayed flowering, indicating that they promote the floral transition (Sun et al., 2020) and overexpression of ZmMADS69 causes early flowering (Liang et al., 2019).
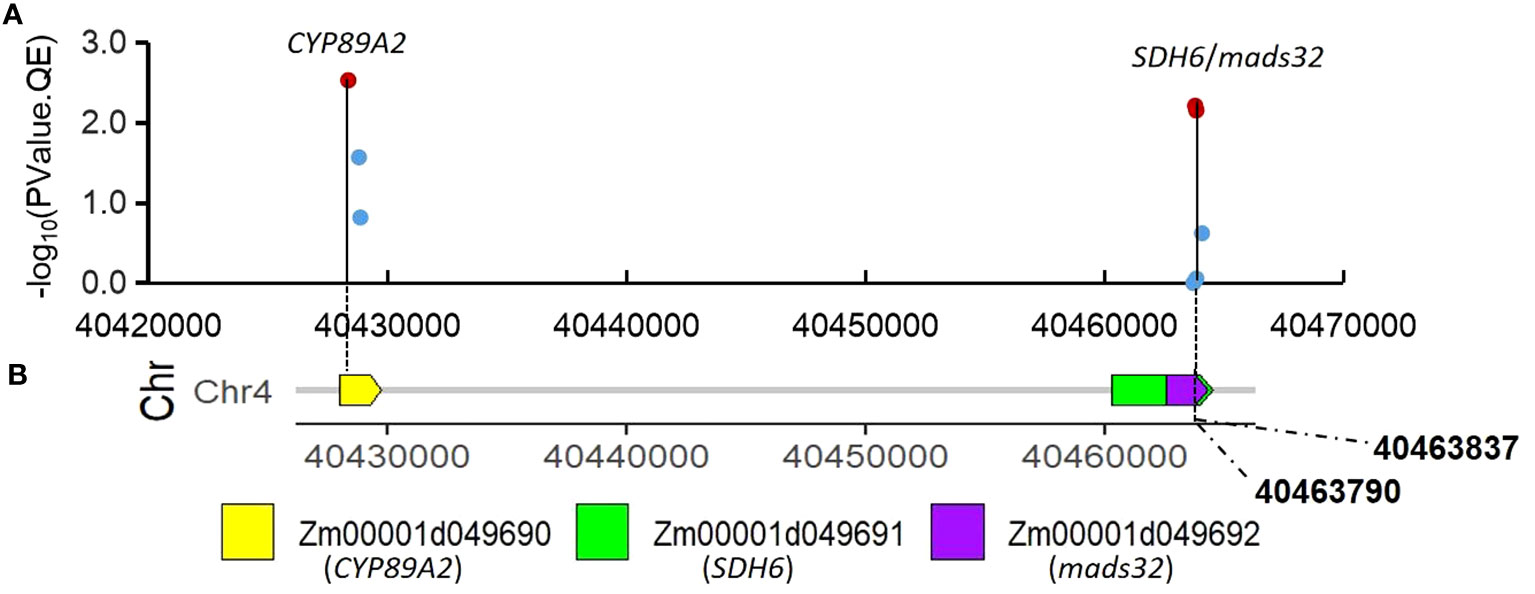
Figure 4 Association of SNPs surrounding significant QEI S4_40 with candidate genes. (A) associations of the twelve SNPs using mean value of PH in Summer and Spring Corn Belt; (B) gene distribution around S4_40(V4:chr4:40463790).
Three SNPs surrounding QTN S10_4 located in Zm00001d023333 are significant at 0.01 level (-log10-P >2) for PH and EH in the Summer Corn Belt (Figures 5A, B). Two of them: the S10_3620568 and S10_3620675 are located on 5’UTR and the S10_3618266 is located on CDS (Figures 5C, D). Zm00001d023333 (Chr10:3606398-3621010, sdg127, SET domain gene127) encodes a histone-lysine N-methyltransferase ATXR7. Another two SET domain family genes, SET domain group 8 (SDG 8) in Arabidopsis thaliana (Zhao et al., 2005) and SDG712 in rice (Zhang et al., 2021) could delay flowering by repressing the expression of FLOWERING LOCUS C (FLC) and florigen genes, respectively. The above research findings suggest that Zm00001d023333 we identified in this study might affect PH and EH by delaying flowering time and lengthening vegetative growth. Haplotype analysis has shown that the three SNPs can form six haplotypes (Hap0, Hap1, Hap2, Hap3, Hap4, Hap5) (Figure 5E). Hap 1 (ATA) and Hap 4(GCC) are the major haplotypes, with 36 and 32 inbreds, respectively. Hap 1 (ATA) is higher than Hap 4(GCC) in terms of both PH and EH (Figures 5F, G).
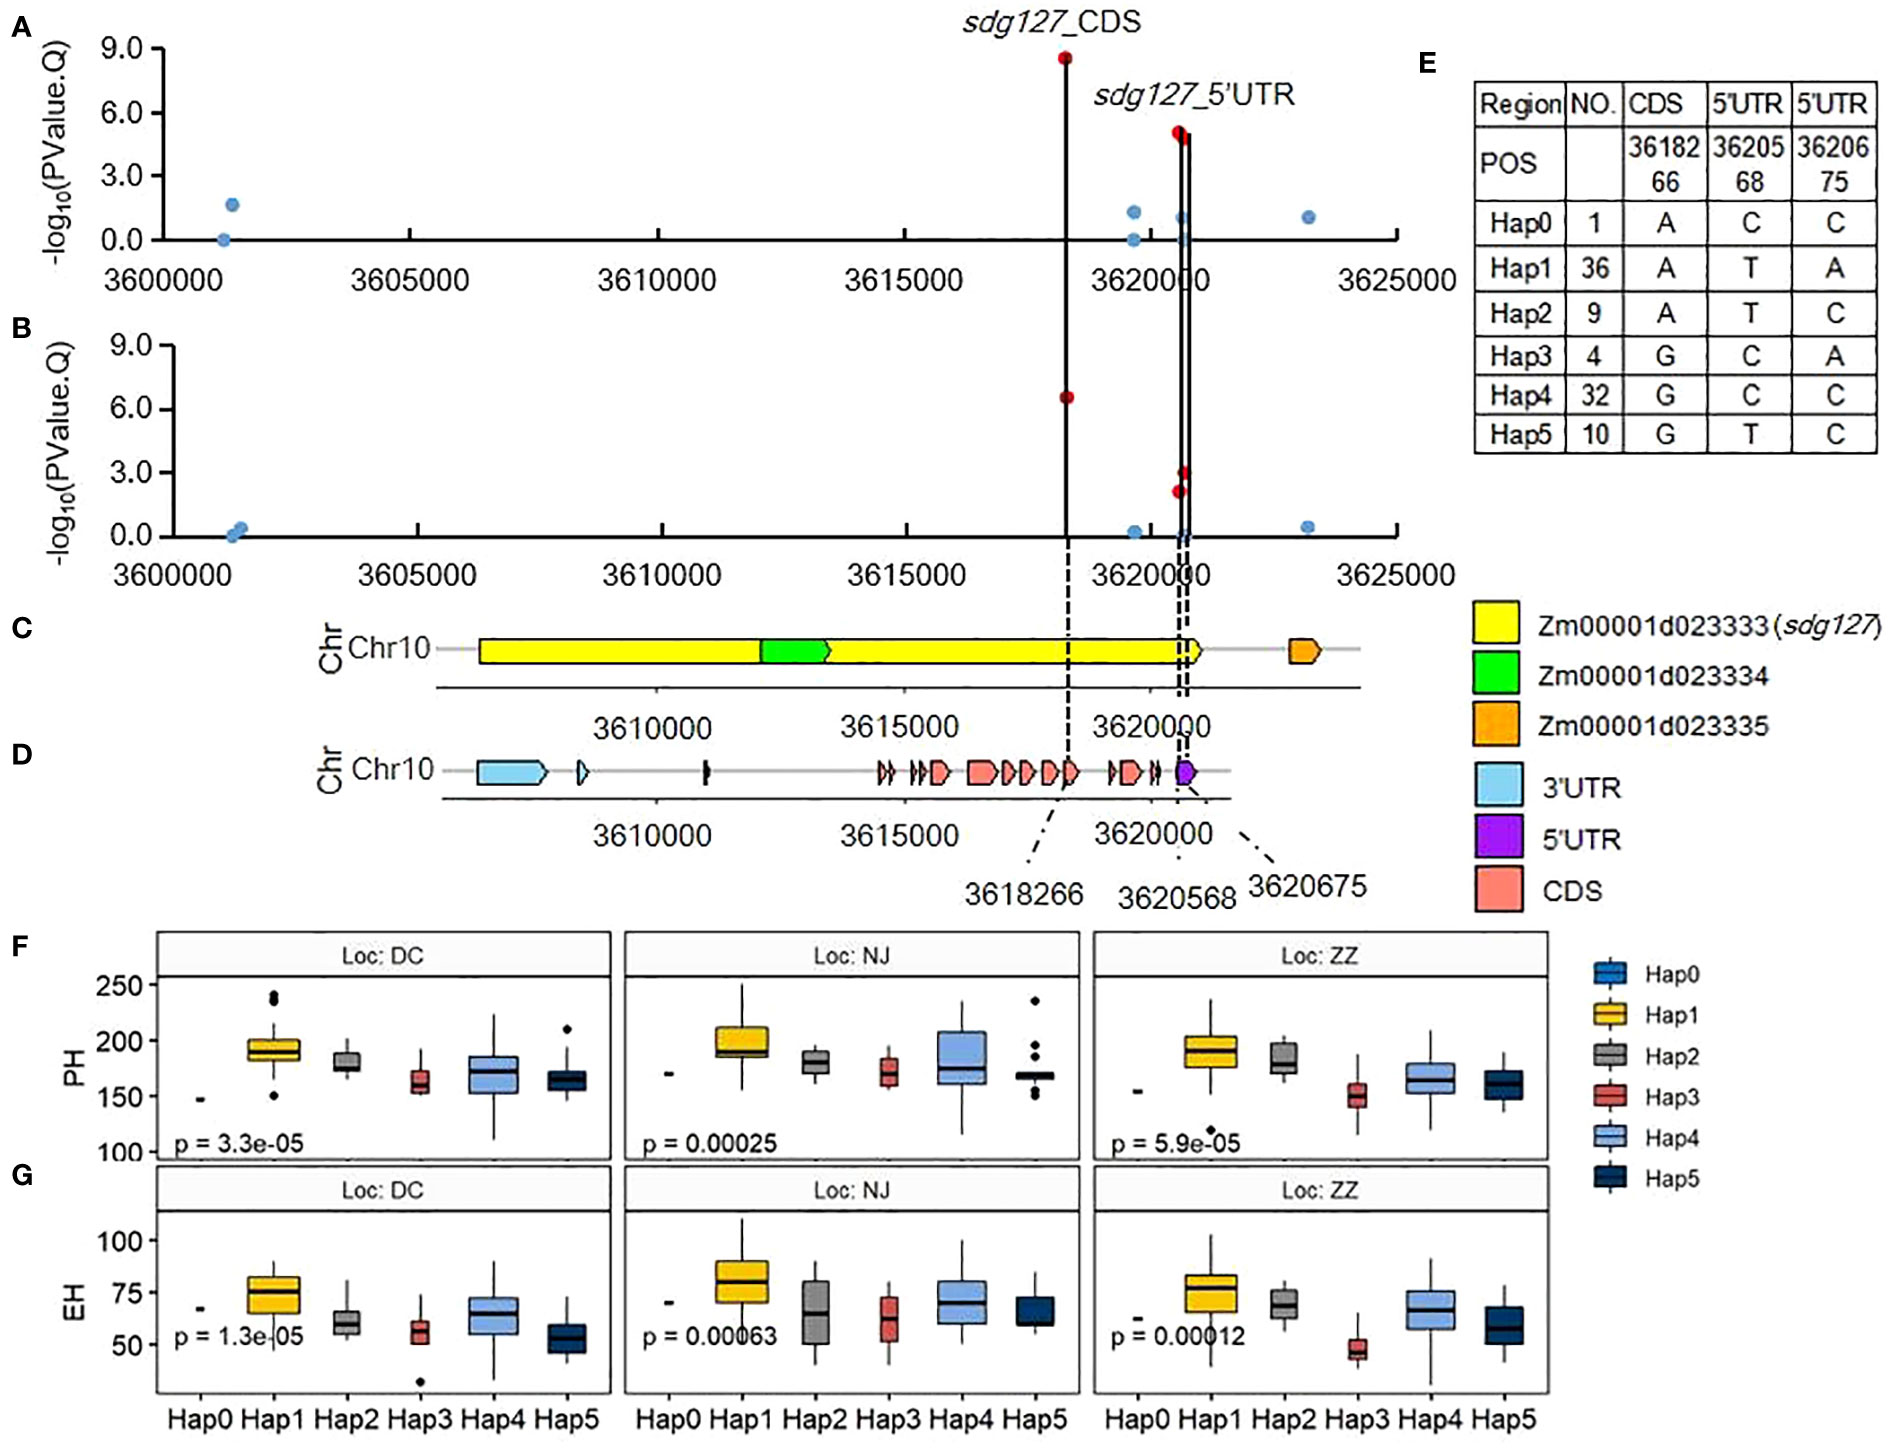
Figure 5 Association of SNPs surrounding significant QTN S10_4 with candidate genes and their haplotype Effects. (A, B) associations of the 11 SNPs with PH (A) and EH (B) in Summer Corn Belt. The dot is red with the threshold of -log10(PValue)>2; (C) gene distribution around QTN S10_4(V4:chr10:3618266); (D) gene structure of Zm00001d023333; (E) haplotypes of the three significant SNPs; (F, G) boxplots of haplotypes for PH (F) and EH (G) in Summer Corn Belt.
Several SNPs significantly associated with PH and EH are identified surrounding QTN locus S7_1. Some of them are located on the CDS of the two candidate genes Zm00001d018614 and Zm00001d018616. Expression of Zm00001d018616 (about 30 FPKM) at the mRNA level is ten times higher than Zm00001d018614 (about 3 FPKM) in the stem (Figure S6). Zm00001d018614 and Zm00001d018615 are genes encoding glutamate receptor, which are involved in seed germination inhibition and seedling heat tolerance (Kong et al., 2015; Li et al., 2019). Another candidate gene, Zm00001d018617 (ga2ox12, gibberellin 2-oxidase12, Chr7:1105512-1106576), is a member of gibberellin oxidase gene family which might affect PH (Paciorek et al., 2022), but its expression is not detected in stem tissues of maize (Figure S6).
Three SNPs associated with PH are identified surrounding QTN S10_15, a spring-corn belt specific QTN and they are all located in the CDS region of candidate gene Zm00001d023677 (sweet13a, V4:chr10:15030181-15032801) (Figure S7); two SNPs, S10_15032123 and S10_15032153, are synonymous SNV whereas the third SNP, S10_15032160, is nonsynonymous SNV which causes an amino acid change (Table S5). Haplotype analysis has shown that the three SNPs can form four haplotypes (H1, H2, H3, H4). The PH of heterozygous haplotype H2 (CG/CG/TG) is significantly higher than that of the homozygous haplotype H2 (CC/GG/GG) (Figure S7). The candidate gene Zm00001d023677 (sweet13a) encodes a SWEET protein of the MtN3/saliva family (Xuan et al., 2013). Another SWEET protein coding gene CmSWEET17, has been reported to be involved in the process of sucrose-induced axillary bud outgrowth in strawberry (C. morifolium), possibly via the auxin transport pathway (Liu et al., 2020a).
Discussion
Mega environment, phenotypic plasticity, and mega-environmental GEI and QEI
Partitioning multi-environments into a set of environment clusters or mega environments has been well-studied in which, the multi-environments were grouped using PCA, clustering, and GGE biplot (Shu and Fan, 1986; Yan and Kang, 2003). Yan (2015) defined a mega-environment as a group of geographical environments that share the same (sets of) genotypes consistently across years. Other researchers have defined a mega-environment as a group of growing environments that are similar in terms of genotype response and that show a repeatable relative performance of a set of crop genotypes across years (Yan and Rajcan, 2002). Mega-environments are often identified through the analysis of multiple-environment trial data for a set of genotypes. The purpose of the mega-environment analysis is to understand the nature of environmental variation across experimental locations, whether there is structure or segmentation among the locations. Our result shows that there is significant segmentation among the 5 locations and they can be divided into two mega-environments, there is very little variation among locations within a mega environment and the two segments fall right into the two corn belts that have been widely adopted by breeders and corn growers. Our results also show that the GGE model, with a biplot display, is an effective tool for displaying environment structure and segmentation which explain why it has become popular in analyzing multiple-environment trial data to determine environment cluster (Yan and Kang, 2003; Yan et al., 2011; Yan, 2015; Dai et al., 2010).
Understanding the genetic basis of phenotypic plasticity in general and the genotype x environment interaction (GEI) in particular is of primary importance in traditional crop genetics and plant breeding, and a large body of literature on models and strategies is available (Shu and Fan, 1986; Cooper and DeLacy, 1994; Malosetti et al., 2013; Li et al., 2018; Liu et al., 2020b; Schneider, 2022). The genetic bases of genotype x environment interaction (GEI) for PH and EH are difficult to study due to environment structure and segmentation among experiment locations and the multi-locus nature of their genetic control. In this study, we deal with multi-environmental segmentation by grouping multiple locations into mega-environments using GGE biplot and deal with multi-locus nature by dissecting it into QTN x environment interaction or QEIs using multi-environmental GWAS. Our results show that genotype x mega environment interaction (GEI) accounted for about 30% of the total variation for both PH and EH, almost equal to the genotypic variation among 203 inbred lines in proportion (which is also about 30%). Therefore, genotype x mega environments interaction has a significant contribution to the phenotypic plasticity observed in PH and EH.
Understanding the molecular mechanism underlying the detected pattern of phenotypic plasticity in general and G x E, in particular, has been a major effort in the last decade. QTL mapping and genome-wide association studies (GWAS) have been shown effective means in identifying a large number of QTL/QTN and QEIs (Xiao et al., 2017; Jin et al., 2023; Napier et al., 2023) and transcriptomic analysis and functional genomics have been shown as important ways to identify candidate genes and verify their biological functions (Seyfferth et al., 2021; Han et al., 2023; Napier et al., 2023; Wang et al., 2023). Various statistical models and bioinformatic algorithms have been proposed to improve the effectiveness of GWAS but no significant progress has been made on GWAS that can partition GEI and identify QEIs. We have shown that the 3VmrMLM GWAS models and the IIIVmrMLM software package recently released can effectively identify QEIs. The software package has also been applied to data from rice, soybean, and other crops to identify QEIs and hunt candidate genes underlying QEIs (Zhang et al., 2022; Zuo et al., 2022; Zhao et al., 2023). We have shown that by employing 3VmrMLM multi-environment GWAS models, we were able to go beyond the traditional G x E interaction analysis and were able to identify and annotate a set of QEIs for PH and EH.
Among the candidate genes annotated by transcriptomic analysis, Zm00001d049692 (MADS32) surrounding QEI S4_40, might affect PH in different ecological zones by both increasing leaf number, delay flowering time, and lengthen vegetative growth period, similar to ZmMADS4 and ZmMADS67 (Sun et al., 2020). Zm00001d044272 (bhlh94) surrounding QEI S3_224 might be involved in low-temperature responsiveness, MeJA-responsiveness, abscisic acid responsiveness because of its cis-regulatory elements and affect root growth and elongation in response to stressful conditions as the manner of RICE SALT SENSITIVE3 (RSS3) in rice (Toda et al., 2013). These findings will facilitate the understanding of the molecular basis of the G x E observed in PH and EH.
Corn belt-specific QTNs
As has been partly described in the Material and Method section, the summer corn-belt average and spring corn-belt average were used to identify QEI, which is defined as the QTN that shows significant QTN x corn-belt interaction by IIIVmrMLM. When QTN x environment interaction is significant, the significant positive and negative genotype effects were canceled out during averaging, therefore the QTN main effects become less meaningful. We obtain corn belt specific QTNs by feeding the IIIVmrMLM software with multi-location data within a corn belt. A corn belt specific QTN is a QTN that shows a significant genotype effect within either summer or spring corn belt data. QEIs explain the phenotypic plasticity across different corn belts and are frequently the targets to select against by breeders seeking stress tolerance and trait stability whereas corn-belt specific QTNs expain the genetic variation within a corn-belt and are frequently targets to select for by breeders seeking genetic gain and stable phenotypic performance in the corresponding corn belt.
We have identified a set of main effect QTNs or corn belt specific QTNs. In the Summer Corn Belt, four candidate genes Zm00001d018614, Zm00001d018615, Zm00001d018616, and Zm00001d018617 are identified surrounding QTNs S7_1 (Figures 6, S6). Zm00001d018617 is also identified by Zhang et al. (2019) as a candidate gene for PH. Zm00001d033230 surrounding QTN S1_255 (V4:chr1: 255244221, Tables 3, S3; Figure 3) is associated with PH in the Summer Corn Belt in our study, which is also identified as a candidate gene associated with PH in Zmdle1, a dwarf and low ear maize mutant (Zhou et al., 2023). Zm00001d049715 (IAA25) surrounding QTN S4_41 is associated with EH in the Spring Corn Belt, which is also identified as a candidate gene for PH by Zheng et al. (2016) through meta-QTL analysis.
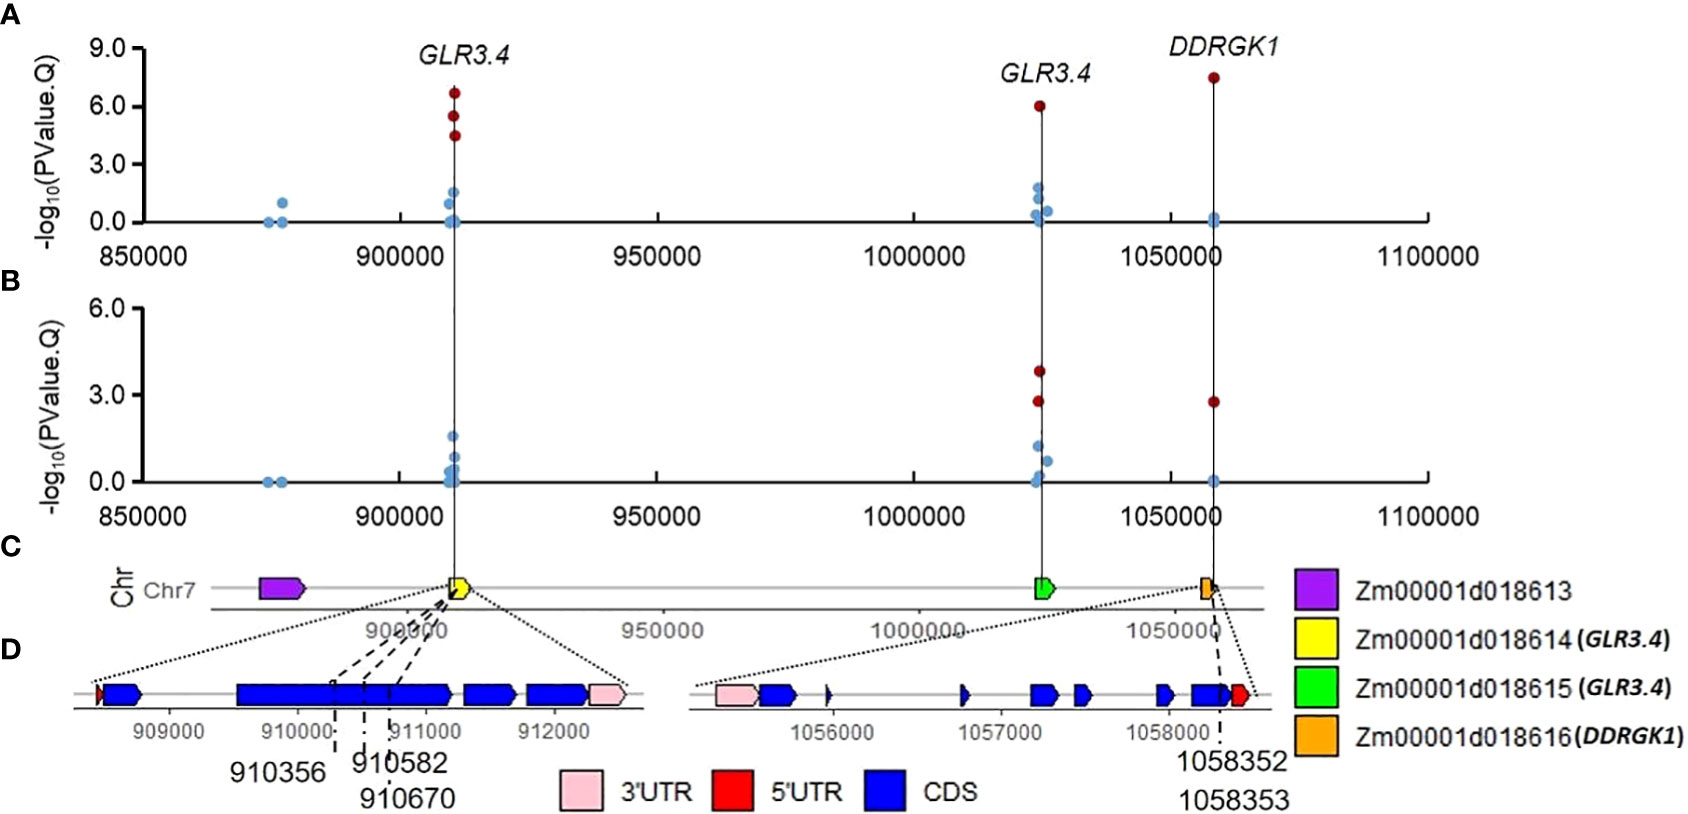
Figure 6 Significant QTN S7_1 and associated SNPs on candidate gene Zm00001d018614 (GLR3.4) and Zm00001d018616 (DDRGK domain-containing protein). (A, B) associations of the 28 SNPs for PH (A) and EH (B) in Summer Corn Belt; (C) gene distribution around S7_1 (V4:chr7:910582); (D, E) gene structure of Zm00001d018614 (D) and Zm00001d018616 (E).
3VmrMLM multi-environment GWAS models
The selection of appropriate statistical models to detect and measure association is critical to the success of GWAS. The models should be able to deal with various features of phenotypic and genotype data, such as continuity and normality of phenotypic data, population structure and kinship in genotype data, and various confoundings from other covariables in a model. The R software package provided by Zhang’s group, IIIVmrMLM V1.0 (Li et al., 2022a; Li et al., 2022b), is a GWAS model that fits the data of strong G x E. Under the framework of a compressed variance component mixed model, each marker on the maize chromosome was first scanned for statistical significance and a less stringent Banforroni correction was adopted in the statistical test and the significant marker loci identified were then incorporated into a new multi-locus genetic model and their effects were estimated by Empirical Bays and all non-zero effects were further evaluated by the likelihood ratio test. Another feature of the 3VmrMLM model is that it can take advantage of heterozygosity discovered in genomic sequence data. Heterozygosity has been detected in many DNA sequence projects in corn inbred lines that have been selfed for 6-10 generations, Traditionally, this so-called residual heterozygosity is treated as sequencing errors, or as missing data and is filtered out and ignored. The recent hi-fi sequencing technology has shown this heterozygosity is not a sequencing error and is instead a true variation in inbred lines. The 3VmrMLM model can utilize this important information to reveal QTN x QTN and QTN x environment interaction.
Data availability statement
The datasets presented in this study can be found in online repositories. The names of the repository/repositories and accession number(s) can be found below: European Variation Archive (EVA) at EMBL-EBI, accession number is PRJEB64281 (The European Bioinformatics Institute< EMBL-EBI).
Author contributions
GS: Writing – original draft, Writing – review & editing. AifangW: Writing – review & editing. XW: Data curation, Investigation, Writing – original draft. RC: Validation, Writing – review & editing. FG: Validation, Writing – review & editing. AifenW: Writing – review & editing. TL: Data curation, Writing – review & editing. YW: Funding acquisition, Supervision, Writing – review & editing.
Funding
The author(s) declare that no financial support was received for the research, authorship, and/or publication of this article.
Conflict of interest
Authors GS, AifangW, and TL were employed by Beijing Lantron Seed, LongPing High-tech Corp. Authors XW, RC, FG, AifenW and YW were employed by Henan LongPing-Lantron AgriScience and Technology Co., LTD.
The remaining author declares that the research was conducted in the absence of any commercial or financial relationships that could be construed as a potential conflict of interest.
Publisher’s note
All claims expressed in this article are solely those of the authors and do not necessarily represent those of their affiliated organizations, or those of the publisher, the editors and the reviewers. Any product that may be evaluated in this article, or claim that may be made by its manufacturer, is not guaranteed or endorsed by the publisher.
Supplementary material
The Supplementary Material for this article can be found online at: https://www.frontiersin.org/articles/10.3389/fpls.2023.1284403/full#supplementary-material
Supplementary Figure 1 | Frequency distribution of minor allele and proportion of heterozygous genotypes in 203 maize inbred lines based on 73175 SNPs dataset. (A) minor allele frequency; (B) proportion of heterozygous genotypes.
Supplementary Figure 2 | Linkage disequilibrium decay and genetic diversity in the genome-wide association study (GWAS) panel. (A) linkage disequilibrium decay across all 10 maize chromosomes; (B) the plot of delta K; (C) population structure of the 203 lines at K = 3.
Supplementary Figure 3 | Manhattan Plot of QEIs and associated known candidate genes. (A) QEIs and their associated genes for PH identified from mean values of PH in Summer Corn Belt (E1) and Spring Corn Belt (E2). (B) QEIs and their associated genes for EH from mean values of EH in Summer Corn Belt (E1) and Spring Corn Belt (E2).
Supplementary Figure 4 | Association of SNPs surrounding significant QEI S3_224 with candidate genes. (A) associations of the fourteen SNPs using mean values of EH in Summer Corn Belt (E1) and Spring Corn Belt (E2). (B) gene structure of Zm00001d044272(bhlh94).
Supplementary Figure 5 | Tissue-specific expression profiles of candidate genes around QTN S10_4 retrieved from maizeGDB.(A) Zm00001d049690 (B) Zm00001d049691 (C) Zm00001d049692.
Supplementary Figure 6 | Tissue-specific expression profiles of candidate genes around QTN S7_1 retrieved from maizeGDB. (A) Zm00001d018614 (B) Zm00001d018615 (C) Zm00001d018616 (D) Zm00001d018617.
Supplementary Figure 7 | Association of SNPs surrounding significant QTN S10_15 with candidate genes and their haplotype Effects. (A) associations of the SNPs surrounding S10_15 for PH in Spring Corn Belt. (B) proportion of heterozygous genotypes of the SNPs surrounding S10_15. (C) gene structure of Zm00001d023677. (D) haplotypes of the three significant SNPs. (E) boxplots of haplotypes for PH in five locations.
Abbreviations
QEI, QTN that shows QTN-by-environment interaction; GWAS, genome-wide association study.
References
Alkhalifah, N., Campbell, D. A., Falcon, C. M., Gardiner, J. M., Miller, N. D., Romay, M. C., et al. (2018). Maize genomes to fields: 2014 and 2015 field season genotype, phenotype, environment, and inbred ear image datasets. BMC Res. Notes. 11 (1), 452. doi: 10.1186/s13104-018-3508-1
Bai, W., Zhang, H., Zhang, Z., Teng, F., Wang, L., Tao, Y., et al. (2010). The evidence for non-additive effect as the main genetic component of plant height and ear height in maize using introgression line populations. Plant Breed. 129 (4), 376–384. doi: 10.1111/j.1439-0523.2009.01709.x
Barrett, J. C., Fry, B., Maller, J., Daly, M. J. (2005). Haploview: Analysis and visualization of LD and haplotype maps. Bioinformatics 21, 263–265. doi: 10.1093/bioinformatics/bth457
Bradbury, P. J., Zhang, Z., Kroon, D. E., Casstevens, T. M., Ramdoss, Y., Buckler, E. S. (2007). TASSEL: software for association mapping of complex traits in diverse samples. Bioinformatics 23 (19), 2633–2635. doi: 10.1093/bioinformatics/btm308
Camacho, C. G., Coulouris, G., Avagyan, V., Ma, N., Papadopoulos, J., Bealer, K., et al. (2009). BLAST+: architecture and applications. BMC Bioinf. 10, 421. doi: 10.1186/1471-2105-10-421
Coles, N. D., McMullen, M. D., Balint-Kurti, P. J., Pratt, R. C., Holland, J. B. (2010). Genetic control of photoperiod sensitivity in maize revealed by joint multiple population analysis. Genetics 184 (3), 799–812. doi: 10.1534/genetics.109.110304
Cooper, M., DeLacy, I. H. (1994). Relationships among analytical methods used to study genotypic variation and genotype-by-environment interaction in plant breeding multi-environment experiments. Theor. Appl. Genet. 88, 561–572. doi: 10.1007/BF01240919
Dai, M., Zhao, J., Yang, G., Wang, R. (2010). Comparison between different ecological regions on maize yield and agronomic characters. Chin. Agric. Sci. Bull. 26 (11), 127–131. doi: 10.11924/j.issn.1000-6850.2009-2795
Ding, X., Wu, X., Chen, L., Li, C., Shi, Y., Song, Y., et al. (2017). Both major and minor qtl associated with plant height can be identified using near-isogenic lines in maize. Euphytica 213 (1), 1–9. doi: 10.1007/s10681-016-1825-9
Elshire, R. J., Glaubitz, J. C., Sun, Q., Poland, J. A., Kawamoto, K., Buckler, E. S., et al. (2011). A robust, simple genotyping-by-sequencing (GBS) approach for high diversity species. PloS One 6 (5), e19379. doi: 10.1371/journal.pone.0019379
Eprintsev, A. T., Fedorin, D. N., Karabutova, L. A., Pokusina, T. A. (2016). Light regulation of succinate dehydrogenase subunit B gene SDH2-3 expression in maize leaves. Russ J. Plant Physiol. 63, 505–510. doi: 10.1134/S102144371604004X
Fedorin, D. N., Eprintsev, A. T., Florez Caro, O. J., Igamberdiev, A. U. (2023). Effect of salt stress on the activity, expression, and promoter methylation of succinate dehydrogenase and succinic semialdehyde dehydrogenase in maize (Zea mays L.) leaves. Plants 12 (1), 68. doi: 10.3390/plants12010068
Fei, J., Jiang, Q., Guo, M., Lu, J., Wang, P., Liu, S., et al. (2022). Fine mapping and functional research of key genes for photoperiod sensitivity in maize. Front. Plant Sci. 13. doi: 10.3389/fpls.2022.890780
Frutos, E., Galindo, M. P., Leiva, V. (2014). An interactive biplot implementation in R for modeling genotype-by-environment interaction. Stochastic Environ. Res. Risk Assess. 28, 1629–1641. doi: 10.1007/s00477-013-0821-z
Glaubitz, J. C., Casstevens, T. M., Lu, F., Harriman, J., Elshire, R. J., Sun, Q., et al. (2014). TASSEL-GBS: a high capacity genotyping by sequencing analysis pipeline. PloS One 9 (2), e90346. doi: 10.1371/journal.pone.0090346
Han, L., Zhong, W., Qian, J., Jin, M., Tian, P., Zhu, W., et al. (2023). A multi-omics integrative network map of maize. Nat. Genet. 55 (1), 144–153. doi: 10.1038/s41588-022-01262-1
Hubisz, M. J., Falush, D., Stephens, M., Pritchard, J. K. (2009). Inferring weak population structure with the assistance of sample group information. Mol. Ecol. Resour. 9, 1322–1332. doi: 10.1111/j.1755-0998.2009.02591.x
Jin, M., Liu, H., Liu, X., Guo, T., Guo, J., Yin, Y., et al. (2023). Complex genetic architecture underlying the plasticity of maize agronomic traits. Plant Commun. 4, 100473. doi: 10.1016/j.xplc.2022.100473
Kong, D., Ju, C., Parihar, A., Kim, S., Cho, D., Kwak, J. M. (2015). Arabidopsis glutamate receptor homolog3.5 modulates cytosolic Ca2+ level to counteract effect of abscisic acid in seed germination. Plant Physiol. 167, 1630–1642. doi: 10.1104/pp.114.251298
Laitinen, R. A. E., Nikoloski, Z. (2019). Genetic basis of plasticity in plants. J. Exp. Bot. 70 (3), 739–745. doi: 10.1093/jxb/ery404
Lawit, S. J., Wych, H. M., Xu, D., Kundu, S., Tomes, D. T. (2010). Maize DELLA proteins dwarf plant8 and dwarf plant9 as modulators of plant development. Plant Cell Physiol. 51 (11), 1854–1868. doi: 10.1093/pcp/pcq153
Li, W., Ge, F., Qiang, Z., Zhu, L., Zhang, S., Chen, L., et al. (2020). Maize ZmRPH1 encodes a microtubule-associated protein that controls plant and ear height. Plant Biotechnol. J. 18, 1345–1347. doi: 10.1111/pbi.13292
Li, X., Guo, T., Mu, Q., Li, X., Yu, J. (2018). Genomic and environmental determinants and their interplay underlying phenotypic plasticity. Proc. Natl. Acad. Sci. U.S.A. 115, 6679–6684. doi: 10.1073/pnas.1718326115
Li, X., Guo, T., Wang, J., Bekele, W. A., Sukumaran, S., Vanous, A. E., et al. (2021). An integrated framework reinstating the environmental dimension for GWAS and genomic selection in crops. Mol. Plant 14 (6), 874–887. doi: 10.1016/j.molp.2021.03.010
Li, Z. G., Ye, X. Y., Qiu, X. M. (2019). Glutamate signaling enhances the heat tolerance of maize seedlings by plant glutamate receptor-like channels-mediated calcium signaling. Protoplasma 256, 1165–1169. doi: 10.1007/s00709-019-01351-9
Li, M., Zhang, Y. W., Xiang, Y., Liu, M., Zhang, Y. M. (2022a). IIIVmrMLM: the R and C++ tools associated with 3VmrMLM, a comprehensive GWAS method for dissecting quantitative traits. Mol. Plant 15 (8), 1251–1253. doi: 10.1016/j.molp.2022.06.002
Li, M., Zhang, Y. W., Zhang, Z. C., Xiang, Y., Liu, M. H., Zhou, Y. H., et al. (2022b). A compressed variance component mixed model for detecting QTNs, and QTN-by-environment and QTN-by-QTN interactions in genome-wide association studies. Mol. Plant 15 (4), 630–650. doi: 10.1016/j.molp.2022.02.012
Li, X., Zhou, Z., Ding, J., Wu, Y., Zhou, B., Wang, R., et al. (2016). Combined linkage and association mapping reveals QTL and candidate genes for plant and ear height in maize. Front. Plant Sci. 7. doi: 10.3389/fpls.2016.00833
Liang, Y., Liu, Q., Wang, X., Huang, C., Xu, G., Hey, S., et al. (2019). ZmMADS69 functions as a flowering activator through the ZmRap2.7-ZCN8 regulatory module and contributes to maize flowering time adaptation. New Phytol. 221, 2335–2347. doi: 10.1111/nph.15512
Lin, X., Fang, C., Liu, B., Kong, F. (2021). Natural variation and artificial selection of photoperiodic flowering genes and their applications in crop adaptation. aBIOTECH 2 (2), 156–169. doi: 10.1007/s42994-021-00039-0
Liu, N., Du, Y., Warburton, M. L., Xiao, Y., Yan, J. (2020b). Phenotypic plasticity contributes to maize adaptation and heterosis. Mol. Biol. Evol. 38 (4), 1262–1275. doi: 10.1093/molbev/msaa283
Liu, W., Peng, B., Song, A., Jiang, J., Chen, F. (2020a). Sugar transporter, CmSWEET17, promotes bud outgrowth in Chrysanthemum Morifolium. Genes (Basel) 11 (1), 26. doi: 10.3390/genes11010026
Luo, J., Zhou, J., Zhang, J. (2018). Aux/IAA gene family in plants: molecular structure, regulation, and function. Int. J. Mol. Sci. 19 (1), 259. doi: 10.3390/ijms19010259
Malosetti, M., Ribaut, J.-M., Eeuwijk, F. A. V. (2013). The statistical analysis of multi-environment data: modeling genotype-by-environment interaction and its genetic basis. Front. Physiol. 4. doi: 10.3389/fphys.2013.00044
Mather, K., Caligari, P. D. S. (1974). Genotype x environment interactions. Heredity 33 (1), 43–59. doi: 10.1038/hdy.1974.63
Mu, Q., Guo, T., Li, X., Yu, J. (2022). Phenotypic plasticity in plant height shaped by interaction between genetic loci and diurnal temperature range. New Phytol. 233, 1768–1779. doi: 10.1111/nph.17904
Multani, D. S., Briggs, S. P., Chamberlin, M. A., Blakeslee, J. J., Murphy, A. S., Johal, G. S. (2003). Loss of an MDR transporter in compact stalks of maize br2 and sorghum dw3 mutants. Science 302 (5642), 81–84. doi: 10.1126/science.1086072
Myster, J., Moe, R. (1995). Effect of diurnal temperature alternations on plant morphology in some greenhouse crops-a mini review. Scientia Hortic. 62 (4), 205–215. doi: 10.1016/0304-4238(95)00783-P
Napier, J. D., Heckman, R. W., Juenger, T. E. (2023). Gene-by-environment interactions in plants: Molecular mechanisms, environmental drivers, and adaptive plasticity. THE Plant Cell 35, 109–124. doi: 10.1093/plcell/koac322
Niu, Y., Xu, Y., Liu, X., Yang, S., Wei, S., Xie, F., et al. (2013). Association mapping for seed size and shape traits in soybean cultivars. Mol. Breed. 31 (4), 785–794. doi: 10.1007/s11032-012-9833-5
Osnato, M., Cota, I., Nebhnani, P., Cereijo, U., Pelaz, S. (2022). Photoperiod control of plant growth: flowering time genes beyond flowering. Front. Plant Sci. 12. doi: 10.3389/fpls.2021.805635
Paciorek, T., Chiapelli, B. J., Wang, J. Y., Paciorek, M., Yang, H. P., Sant, A., et al. (2022). Targeted suppression of gibberellin biosynthetic genes ZmGA20ox3 and ZmGA20ox5 produces a short staturemaize ideotype. Plant Biotechnol. J. 20, 1140–1153. doi: 10.1111/pbi.13797
Perrier, L., Rouan, L., Jaffuel, S., Clement-vidal, A., Roques, S., Soutiras, A., et al. (2017). Plasticity of sorghum stem biomass accumulation in response to water deficit: a multiscale analysis from internode tissue to plant level. Front. Plant Sci. 8. doi: 10.3389/fpls.2017.01516
Pigliucci, M. (2001). Phenotypic plasticity: beyond nature and nurture (Baltimore, MD, USA: John Hopkins University Press).
Rogers, A. R., Dunne, J. C., Romay, C., Bohn, M., Buckler, E. S., Ciampitti, I. A., et al. (2021). The importance of dominance and genotype-by-environment interactions on grain yield variation in a large-scale public cooperative maize experiment. G3 11 (2), 1–17. doi: 10.1093/g3journal/jkaa050
Schneider, H. M. (2022). Characterization, costs, cues and future perspectives of phenotypic plasticity. Ann. Bot. 130, 131–148. doi: 10.1093/aob/mcac087
Seyfferth, C., Renema, J., Wendrich, J., Eekhout, T., Seurinck, R., Vandamme, N., et al. (2021). Advances and opportunities in single-cell transcriptomics for plant research. Ann. Rev. Plant Biol. 72, 847–866. doi: 10.1146/annurev-arplant-081720-010120
Shu, G., Cao, G., Li, N., Wang, A., Wei, F., Li, T., et al. (2021). Genetic variation and population structure in China summer maize germplasm. Sci. Rep. 11 (1), 8012. doi: 10.1038/s41598-021-84732-6
Shu, G., Fan, L. (1986). Analysis of the genotype x environment interaction of fertility restoration in Timopheevi CMS hybrid wheat. Acta Genetica Sin. 13 (6), 437–446.
Shu, G., Wang, A., Wang, X., Ding, J., Chen, R., Gao, F., et al. (2023). Identification of southern corn rust resistance QTNs in Chinese summer maize germplasm via multi-locus GWAS and post-GWAS analysis. Front. Plant Sci. 14. doi: 10.3389/fpls.2023.1221395
Si, W., Wang, H., Dong, J., Li, L., Chen, J., Cheng, B., et al. (2020). Identification of key plant height related ZmGRF genes in maize by weighted gene co-expression network analysis. J. Maize Sci. 28 (5), 39–46. doi: 10.13597/j.cnki.maize.science.20200507
Su, H., Liang, J., Abou-Elwafa, S. F., Cheng, H., Dou, D., Ren, Z., et al. (2021). ZmCCT regulates photoperiod-dependent flowering and response to stresses in maize. BMC Plant Biol. 21 (1), 1–15. doi: 10.1186/s12870-021-03231-y
Sun, H. Y., Wang, C. L., Chen, X. Y., Liu, H. B., Huang, Y. M., Li, S. X., et al. (2020). dlf1 promotes floral transition bydirectly activating ZmMADS4 and ZmMADS67 in the maize shoot apex. New Phytol. 228 (4), 1386–1400. doi: 10.1111/nph.16772
Teale, W. D., Paponov, I. A., Palme, K. (2006). Auxin in action: signalling, transport and the control of plant growth and development. Nat. Rev. Mol. Cell Biol. 7 (11), 847–859. doi: 10.1038/nrm2020
Teng, F., Zhai, L., Liu, R., Bai, W., Wang, L., Huo, D., et al. (2013). ZmGA3ox2, a candidate gene for a major QTL, qPH3.1, for plant height in maize. Plant J. 73, 405–416. doi: 10.1111/tpj.12038
Toda, Y., Tanaka, M., Ogawa, D., Kurata, K., Takeda, S. (2013). RICE SALT SENSITIVE3 forms a ternary complex with JAZ and class-C bHLH factors and regulates jasmonate-induced gene expression and root cell elongation. Plant Cell 25 (5), 1709–1725. doi: 10.1105/tpc.113.112052
Wallace, J. G., Zhang, X., Beyene, Y., Semagn, K., Olsen, M., Prasanna, B. M., et al. (2016). Genome-wide association for plant height and flowering time across 15 tropical maize populations under managed drought stress and well-watered conditions in Sub-Saharan Africa. Crop Sci. 56 (5), 1–14. doi: 10.2135/cropsci2015.10.0632
Wang, W., Guo, W., Le, L., Yu, J., Wu, Y., Li, D., et al. (2023). Integration of high-throughput phenotyping, GWAS, and predictive models reveals the genetic architecture of plant height in maize. Mol. Plant 16 (2), 354–373. doi: 10.1016/j.molp.2022.11.016
Wang, S., Wang, Y. (2022b). Harnessing hormone gibberellin knowledge for plant height regulation. Plant Cell Rep. 41 (10), 1945–1953. doi: 10.1007/s00299-022-02904-8
Wang, F., Yu, Z., Zhang, M., Wang, M., Lu, X., Liu, X., et al. (2022a). ZmTE1 promotes plant height by regulating intercalary meristem formation and internode cell elongation in maize. Plant Biotechnol. J. 20, 526–537. doi: 10.1111/pbi.13734
Wang, Y., Zhao, J., Lu, W., Deng, D. (2017). Gibberellin in plant height control: old player, new story. Plant Cell Rep. 36 (3), 391–398. doi: 10.1007/s00299-017-2104-5
Wei, L., Zhang, X., Zhang, Z., Liu, H., Lin, Z. (2018). A new allele of the Brachytic2 gene in maize can efficiently modify plant architecture. Heredity 121, 75–86. doi: 10.1038/s41437-018-0056-3
Wu, H., Bai, B., Lu, X., Li, H. (2023). A gibberellin-deficient maize mutant exhibits altered plant height, stem strength and drought tolerance. Plant Cell Rep. 42 (10), 1687–1699. doi: 10.1007/s00299-023-03054-1
Xiao, Y., Liu, H., Wu, L., Warburton, M., Yan, J. (2017). Genome-wide association studies in maize: praise and stargaze. Mol. Plant 10, 359–374. doi: 10.1016/j.molp.2016.12.008
Xing, A., Gao, Y., Ye, L., Zhang, W., Cai, L., Ching, A., et al. (2015). A rare SNP mutation in Brachytic2 moderately reduces plant height and increases yield potential in maize. J. Exp. Bot. 66 (13), 3791–3802. doi: 10.1093/jxb/erv182
Xuan, Y. H., Hu, Y. B., Chen, L. Q., Sosso, D., Ducat, D. C., Hou, B. H., et al. (2013). Functional role of oligomerization for bacterial and plant SWEET sugar transporter family. PNAS 110 (39), E3685–E3694. doi: 10.1073/pnas.1311244110
Yan, W. (2015). Mega-environment analysis and test environment evaluation based on unbalanced multiyear data. Crop Sci. 55, 113–122. doi: 10.2135/cropsci2014.03.0203
Yan, W., Kang, M. S. (2003). GGE biplot analysis: A graphical tool for breeders, geneticists, and agronomists (Boca Raton, FL: CRC Press).
Yan, W., Pageau, D., Frégeau-Reid, J., Durand, J. (2011). Assessing the representativeness and repeatability of test environments for genotype evaluation. Crop Sci. 51, 1603–1610. doi: 10.2135/cropsci2011.01.0016
Yan, W., Rajcan, I. (2002). Biplot analysis of test sites and trait relations of soybean in Ontario. Crop Sci. 42, 11–20. doi: 10.2135/cropsci2002.0011
Zhang, S., Hao, H., Liu, X., Li, Y., Ma, X., Liu, W., et al. (2021). SDG712, a putative h3k9-specific methyltransferase encoding gene, delays flowering through repressing the expression of florigen genes in rice. Rice 14, 73. doi: 10.1186/S12284-021-00513-9
Zhang, Y., Li, Y., Wang, Y., Peng, B., Liu, C., Liu, Z., et al. (2011). Correlations and QTL detection in maize family per se and testcross progenies for plant height and ear height. Plant Breed. 130, 617–624. doi: 10.1111/j.1439-0523.2011.01878.x
Zhang, Y., Wan, J., He, L., Lan, H., Li, L. (2019). Genome-wide association analysis of plant height using the maize f1 population. Plants 8, 432. doi: 10.3390/plants8100432
Zhang, J., Wang, S., Wu, X., Han, L., Wang, Y., Wen, Y. (2022). Identification of QTNs, QTN-by environment interactions and genes for yield-related traits in rice using 3VmrMLM. Front. Plant Sci. 13. doi: 10.3389/fpls.2022.995609
Zhao, Q., Shi, X.-S., Wang, T., Chen, Y., Yang, R., Mi, J., et al. (2023). Identification of QTNs, QTN-byenvironment interactions, and their candidate genes for grain size traits in main crop and ratoon rice. Front. Plant Sci. 14. doi: 10.3389/fpls.2023.1119218
Zhao, Z., Yu, Y., Meyer, D., Wu, C., Shen, W. H. (2005). Prevention of early flowering by expression of FLOWERING LOCUS C requires methylation of histone H3 K36. Nat. Cell Biol. 7 (12), 1256–1260. doi: 10.1038/ncb1329
Zheng, L., Zhou, Y., Zeng, X., Di, H., Weng, J., Li, X., et al. (2016). QTL mapping of plant height in maize. Crops 2016 (2), 8–13. doi: 10.16035/j.issn.1001-7283.2016.02.002
Zhou, W., Zhang, H., He, H., Gong, D., Yang, Y., Liu, Z., et al. (2023). Candidate gene localization of ZmDLE1 gene regulating plant height and ear height in maize. Scientia Agricultura Sin. 56 (5), 821–837. doi: 10.3864/j.issn.0578-1752.2023.05.002
Keywords: maize, multi-environment-GWAS, plant height, ear height, QTN, QTN-by-Environment interaction (QEI)
Citation: Shu G, Wang A, Wang X, Chen R, Gao F, Wang A, Li T and Wang Y (2023) Identification of QTNs, QTN-by-environment interactions for plant height and ear height in maize multi-environment GWAS. Front. Plant Sci. 14:1284403. doi: 10.3389/fpls.2023.1284403
Received: 28 August 2023; Accepted: 01 November 2023;
Published: 29 November 2023.
Edited by:
Yuan-Ming Zhang, Huazhong Agricultural University, ChinaReviewed by:
Jian-Fang Zuo, Huazhong Agricultural University, ChinaGangqiang Cao, Zhengzhou University, China
Copyright © 2023 Shu, Wang, Wang, Chen, Gao, Wang, Li and Wang. This is an open-access article distributed under the terms of the Creative Commons Attribution License (CC BY). The use, distribution or reproduction in other forums is permitted, provided the original author(s) and the copyright owner(s) are credited and that the original publication in this journal is cited, in accordance with accepted academic practice. No use, distribution or reproduction is permitted which does not comply with these terms.
*Correspondence: Guoping Shu, eHVncDIwMTFAMTYzLmNvbQ==; Yibo Wang, Y2hpZ29odXRAMTYzLmNvbQ==
†These authors have contributed equally to this work