 Jawad Ahmed1,2
 Yasar Sajjad1
 Mansour K. Gatasheh3
 Khalid Elfaki Ibrahim4
 Muhammad Huzafa5
 Sabaz Ali Khan1Chen Situ2*
 Arshad Mehmood Abbasi6*Amjad Hassan1*
- 1Department of Biotechnology, COMSATS University Islamabad, Abbottabad, Pakistan
- 2Institute for Global Food Security, School of Biological Sciences, Queens University Belfast, Belfast, United Kingdom
- 3Department of Biochemistry, College of Science, King Saud University, Riyadh, Saudi Arabia
- 4Department of Zoology, College of Science, King Saud University, Riyadh, Saudi Arabia
- 5Department of Plant Sciences, Quaid-e-Azam University, Islamabad, Pakistan, Pakistan
- 6Department of Environmental Sciences, COMSATS University, Islamabad, Abbottabad, Pakistan
NAC transcription factors (TFs) are crucial to growth and defense responses in plants. Though NACs have been characterized for their role in several plants, comprehensive information regarding their role in Catharanthus roseus, a perennial ornamental plant, is lacking. Homology modelling was employed to identify and characterize NACs in C. roseus. In-vitro propagation of C. roseus plants was carried out using cell suspension and nodal culture and were elicited with two auxin-antagonists, 5-fluoro Indole Acetic Acid (5-F-IAA) and α-(phenyl ethyl-2-oxo)-Indole-Acetic-Acid (PEO-IAA) for the enhanced production of monoterpenoid indole alkaloids (MIAs) namely catharanthine, vindoline, and vinblastine. Analyses revealed the presence of 47 putative CrNAC genes in the C. roseus genome, primarily localized in the nucleus. Phylogenetic analysis categorized these CrNACs into eight clusters, demonstrating the highest synteny with corresponding genes in Camptotheca acuminata. Additionally, at least one defense or hormone-responsive cis-acting element was identified in the promoter region of all the putative CrNACs. Of the two elicitors, 5-F-IAA was effective at 200 µM to elicit a 3.07-fold increase in catharanthine, 2.76-fold in vindoline, and 2.4-fold in vinblastine production in nodal culture. While a relatively lower increase in MIAs was recorded in suspension culture. Validation of RNA-Seq by qRT-PCR showed upregulated expression of stress-related genes (CrNAC-07 and CrNAC-24), and downregulated expression of growth-related gene (CrNAC-25) in elicited nodal culture of C. roseus. Additionally, the expression of genes involved in the biosynthesis of MIAs was significantly upregulated upon elicitation. The current study provides the first report on the role of CrNACs in regulating the biosynthesis of MIAs.
1 Introduction
Catharanthus roseus has garnered significant attention in the past decade due to its abundant repertoire of diverse bioactive compounds. This unique characteristic has positioned it as a “model non-model” plant for alkaloid and secondary metabolite research (De Bernonville et al., 2017). The plant is best characterized for monoterpenoid indole alkaloids (MIAs) biosynthesis, of which vincristine and vinblastine possess notable antineoplastic properties (Carqueijeiro et al., 2018). These alkaloids are used in the treatment of various types of cancer including leukaemia and Hodgkin’s lymphoma (Chagas and Alisaraie, 2019). Vinblastine and vincristine inhibit mitosis by targeting microtubules during metaphase, ultimately resulting in cell death (Chi et al., 2015). Being a dimeric indole alkaloid, vinblastine is synthesized through coupling of its monomers i.e., vindoline and catharanthine (Qu et al., 2015). However, being a secondary metabolite, the exploitation of vinblastine at a commercial scale is challenging.
Elicitation has emerged as a practical approach with promising potential in improving secondary metabolite production. This method entails the activation of plant defense to modulate biochemical reactions subsequently enhancing the transcription of genes responsible for secondary metabolite biosynthesis (Golkar et al., 2019). The use of elicitors has demonstrated a significant elevation of plant secondary metabolite concentration in in-vitro cultures of various species (Ming et al., 2013; Sabater-Jara et al., 2014; Vidal-Limon et al., 2018). The response instigated by the application of elicitors does not exhibit a uniform pattern and instead varies depending on several factors including concentration, nature, and exposure time (Murthy et al., 2014). Initially, plasma membrane-localized receptors perceive elicitors resulting in the activation of several signaling pathways involving ion channels, G-proteins, and protein kinases (Ramirez-Estrada et al., 2016). Afterwards, these signaling pathways transmit the signals induced by elicitors to downstream components, resulting in a range of cellular responses. These responses include the generation of reactive oxygen species (ROS), secretion of signaling hormones, and the regulation of gene expression through the activation of specific transcription factors (TFs). Ultimately, these processes converge in the biosynthesis of secondary metabolites (Ramirez-Estrada et al., 2016).
Maintaining a delicate balance between growth and secondary metabolite production is one of the key challenges in elicitor-induced biosynthesis of secondary metabolites. Recent studies on the role of NAC (named after three genes NAM, ATAF, and CUC) transcription factors in the regulation of flower formation (Liu et al., 2023), cotyledon and embryo development (Wang et al., 2022), hormone signaling (Jensen et al., 2010), maintenance of shoot apical meristem (Takada et al., 2001), leaf senescence (Kim et al., 2016) and response to pathogen infection (Bian et al., 2021) has established their potential as regulators of multiple cellular processes. Nonetheless, the role of NACs’ regulation of monoterpenoid indole alkaloids remained to be characterized.
Previous studies report upregulated expression of several NAC TFs in response to oxidative stress (De Clercq et al., 2013; Wang et al., 2016). Interestingly, oxidative stress has been reported as a key player in the elicitor-induced biosynthesis of alkaloids (Matsuura et al., 2014). For instance, vinblastine accumulation was proportionate with the corresponding activity of peroxidases induced by polyethylene glycol (Liu et al., 2017). Based on this evidence, we hypothesized that moderate oxidative stress could positively regulate both expressions of NACs together with enhanced accumulation of MIAs. To test this hypothesis, we screened small phytohormone molecules capable of regulating the expression of NACs and genes involved in MIAs biosynthesis. Among the various phytohormones examined, auxins were well documented to antagonize the production of plant secondary metabolites by reducing the activity of peroxidases (El-Sayed and Verpoorte, 2007; Amoo and van Staden, 2013; Mekky et al., 2018). Therefore, we selected two auxin antagonists namely 5-F-IAA and PEO-IAA for their application in in-vitro cultures of C. roseus to evaluate their efficacy as elicitors of MIAs biosynthesis and inducers of NAC expression. This is the first report that aims to unravel the involvement of NACs in the regulation of gene expression associated with the biosynthesis of MIAs.
2 Materials and methods
2.1 Sequence retrieval
The protein, coding sequence (CDS), and genomic sequences of C. roseus NAC transcription factors were downloaded from Medicinal Plant Genomic Resources (MPGR, http://medicinalplantgenomics.msu.edu/4058.shtml). The HMM profile of the NAM domain (PF02365) was retrieved from the Pfam database (http://pfam.xfam.org) and was used to search NAC TFs in the C. roseus protein database using HMMER 3.0 software with an E-value setting to 1e-2. Furthermore, Arabidopsis thaliana NAC (Accession No. NP_171609.1) was also used as a query sequence to perform BLASTP (https://blast.ncbi.nlm.nih.gov/Blast.cgi) against the C. roseus protein database. The resultant proteins were screened for the presence of the NAM domain using SMART (http://smart.embl-heidelberg.de/, Schultz et al., 1998), Pfam and NCBI-CDD database (http://www.ncbi.nlm.nih.gov/cdd/, Lu et al., 2020) and the redundant proteins were manually removed.
2.2 Structure and properties of CrNAC family
The physicochemical properties of CrNACs were predicted by ExPASy (http://web.expasy.org/protparam/, Gasteiger et al., 2003). The gene structure analysis was performed using the default parameters of the gene structure display server (http://gsds.gao-lab.org/, Hu B. et al., 2015). MEME software (http://meme-suite.org/, Bailey et al., 2015) was used to predict the motifs present using default parameters, with the maximum number of motifs set at 10. The subcellular localization of CrNAC TFs was predicted through WoLF PSORT (https://wolfpsort.hgc.jp/, Horton et al., 2007). A sequence of 1500 bp upstream of each NAC gene was retrieved from MPGR and submitted to the PlantCARE database (http://bioinformatics.psb.ugent.be/webtools/plantcare/html/, Lescot et al., 2002) for predicting cis-acting elements.
2.3 Multiple sequence alignment and phylogenetic analysis
A phylogenetic tree using protein sequences of C. roseus, Arabidopsis thaliana, and Oryza sativa was constructed using sequences retrieved from Phytozome. These sequences were aligned with CrNACs using ClustalW with standard settings. Subsequently, an unrooted phylogenetic tree was established by MEGA 7 using the Maximum likelihood method with 1,000 bootstrap repeats (Kumar et al., 2018).
2.4 Chromosome localization, synteny analysis, and Ka/Ks calculation
The sizes of C. roseus chromosomes and the position of CrNAC genes on them were extracted from the NCBI C. roseus genome browser. MCScanX tool was used to analyze gene duplication events, using default parameters (Wang et al., 2012), A collinearity analysis was accomplished using genome files of C. roseus, A. thaliana, Mitragyna speciosa, Gelsemium sempervirens, and Camptotheca acuminata. The Ka/Ks ratio was calculated using TBtools (Chen et al., 2020).
2.5 Gene expression and co-expression network analysis
The available RNA-Seq data was retrieved from the CathaCyc and MPGR consortium. Previously, a detailed gene expression analysis of C. roseus performed by Van et al., 2013, (SRA030483) was used in the current study. The expression data of CrNAC TFs was analyzed in plant organs (root, stem, flower, immature leaf, and mature leaf) as well as in cell suspension cultures of C. roseus treated with methyl jasmonate (MeJ) and Yeast extract. FPKM values were normalized into log2 values and heat maps were constructed using TBtools software. A co-expression network analysis of CrNAC genes and MIA biosynthetic genes was constructed using Cytoscape V 3.8.2 (Shannon et al., 2003).
2.6 Plant material and growth conditions
C. roseus plant seeds were first sterilized and germinated on MS basal medium in an LED-based constant climate plant growth chamber (HPP750 Memmert, Germany) set at 25 °C with 16 h photoperiod, 8 h dark, and relative humidity of 50% was used for growing plants. Plantlets germinated in-vitro were shifted to the pots containing compost and placed in the plant growth room under the same conditions stated above for further growth and hardening. Two-month-old plants were used for initiating nodal and cell suspension culture. For callus induction, mature leaves of C. roseus were aseptically cut into 1 cm2 pieces. The leaf explants were placed on semi-solidified (sucrose, 3%; agar, 0.7%) MS basal medium (pH, 5.7) supplemented with different concentrations (ranging from 0 to 2.0 mg/L) of kinetin along with 2.0 mg/L 1-naphthalene acetic acid (NAA) and 2,4-dichlorophenoxyaceticacid (2,4-D). Four best-responding friable calli were screened for their MIA content. The callus with the highest concentration of MIAs was subsequently used for initiating cell suspension culture. The friable callus was chopped into small pieces and added to flasks containing liquid MS basal medium supplemented with 1.5 mg/L kinetin and 2.0 mg/L NAA. These flasks containing chopped calli were then placed on a rotary shaker (New Brunswick Innova 44) set at 110 rpm and 27 °C under white florescent light of 40 µmolm-2s-1 with a photoperiod of 16 h. The dispersed cells were sub-cultured every week to obtain a homogenous stable cell suspension culture. A completely homogenized cell suspension culture obtained was then used for elicitor application. To initiate nodal culture, nodes of approximately 1.0 cm were cut and placed on a semi-solid MS medium containing varying concentrations of 6-benzyl aminopurine (BAP) and NAA to stimulate shooting, and indole butyric acid (IBA) to stimulate rooting (Mustafa et al., 2011).
2.7 Growth measurement of cell suspension and nodal culture
The growth of plant cell suspension culture was measured by counting the viability of cells. 50 µL of cells were harvested daily and stained with Evan’s blue for 1 min and then washed with water to remove excess dye. A hemocytometer was used to count viable cells (Mustafa et al., 2011).
2.8 Application of elicitors on in-vitro cultures
The experiment employed four different concentrations (0, 50, 100, and 200 µM) each of 5-F-IAA and PEO-IAA dissolved in 0.1% Dimethyl Sulfoxide (DMSO). For cell suspension culture, the exposure time of the elicitor was 96 h which was applied during the log phase of the growth on day 6th. On the other hand, in nodal culture, one-month-old C. roseus plants were sub-cultured on a medium containing the elicitor and were harvested on the fourth week post elicitation.
2.9 Extraction and isolation of MIAs
The cells from the suspension culture and leaves from the nodal culture were dried using a freeze-dryer (Lablyo, UK) at -50 °C for three days. The freeze-dried samples were milled in a planetary ball mill (Retsch 400) at 500 rpm for 3 mins. The powder was sonicated for 60 min in 10 mL 70% methanol and extracted thrice. The mixture was centrifuged at 5000 rpm for 20 min. 10 mL water acidified with 3% HCl was added to the supernatant and washed thrice with 30 mL n-hexane. The aqueous portion was basified with ammonia, pH was adjusted to 8.5, extracted three times with 30 mL chloroform, and washed with water. The extract was dried under a nitrogen gas evaporator (TurboVap, Biotage) and redissolved in 2 mL of 70% methanol. The extracted MIAs were run on Alliance HPLC with PDA detector 2996 (Waters, Milford, UK). Pure fractions of each of the three MIAs were collected, dried in a nitrogen gas evaporator (TurboVap, Biotage), re-dissolved, and quantified on LC-MS (Gupta et al., 2005).
2.10 Quantification of MIAs by LC-MS
MIAs of C. roseus were determined by UPLC-MS coupled to a QDa mass spectrometer in which the Electrospray Ionization (ESI) source was controlled by Masslynx 4.2 (Waters, UK). Six different concentrations of each MIA standards-vinblastine, vindoline, and catharanthine were used to make a standard curve. Three ACQUITY UPLC C18 columns-BEH, HSS T3, and CSH of dimensions (150 mm × 2.1 mm, 1.8 µm) with column temperatures ranging from 25°C to 45°C were used to optimize the separation. The elution profile is given in Supplementary Table S1. Ionization was carried out in a positive mode to confirm the masses of MIAs in the samples. The sample cone and capillary voltage were 30 V and 30,000 V, respectively. Desorption Electrospray Ionization (DESI) was used to confirm the masses of daughter fragments of the parent ions. The matrix effect was assessed by spiking the standard over the analyte (De Bernonville et al., 2017).
2.11 RNA extraction, cDNA synthesis, and qRT-PCR
Snap-frozen leaves from the nodal culture weighing 100 mg were ground to powder using TissueLyser LT (Qiagen, UK). Total RNA was extracted from the powdered leaf samples using TRIzol reagent (Thermo Fischer Scientific, US) and quantified on Nanodrop 1000 (Thermo Scientific). The integrity was confirmed through gel electrophoresis using 1.5% agarose. The extracted total RNA was treated with DNase-I before the first strand of cDNA was synthesized using the WizScript™ cDNA synthesis kit (wizbiosolutions). Gene-specific primers were designed using Primer3 software (Supplementary Table S2). qRT-PCR was performed using the designed primers and 2x iTaq Universal SYBR Green super mix. Components of the reaction mixture are presented in Supplementary Table S3. The CT values obtained were used to calculate the relative expression of the genes using the formula 2-ΔΔCT developed by Livak and Schmittgen (2001).
2.12 Experimental design and statistical analysis
A completely randomized design (CRD) consisting of nine biological replicates each in cell suspension and nodal culture was adopted for the experiment. Additionally, LC-MS and qRT-PCR were performed using three technical replicates. Differences in means among treatments were assessed using analysis of variance (ANOVA) and Tukey HSD test, using IBM SPSS v.26.0 and Statistix 8.1. To find out the association between MIA production and biomass, Pearson’s correlation was performed. Graphs for in-silico analyses were constructed using TBtools (Chen et al., 2020) whereas graphs for expression and metabolite profiling were constructed using GraphPad Prism 9.0. All the data are expressed as mean ± SD.
3 Results
3.1 Identification of NAC TFs in C. roseus genome and their phylogenetic clustering
In this study, 47 NAC transcription factors were identified in the C. roseus genome based on the presence of the NAM domain. Table 1 shows the fundamental characteristics of CrNAC-01 to CrNAC-47. NAC proteins varied in length from 146 amino acids (CrNAC-45) to 607 amino acids (CrNAC-31) with molecular weight from 17.4 kDa (CrNAC-45) to 67.7 kDa (CrNAC-31). The predicted subcellular localization revealed that CrNACs were primarily localized in the nucleus followed by the cytoplasm.
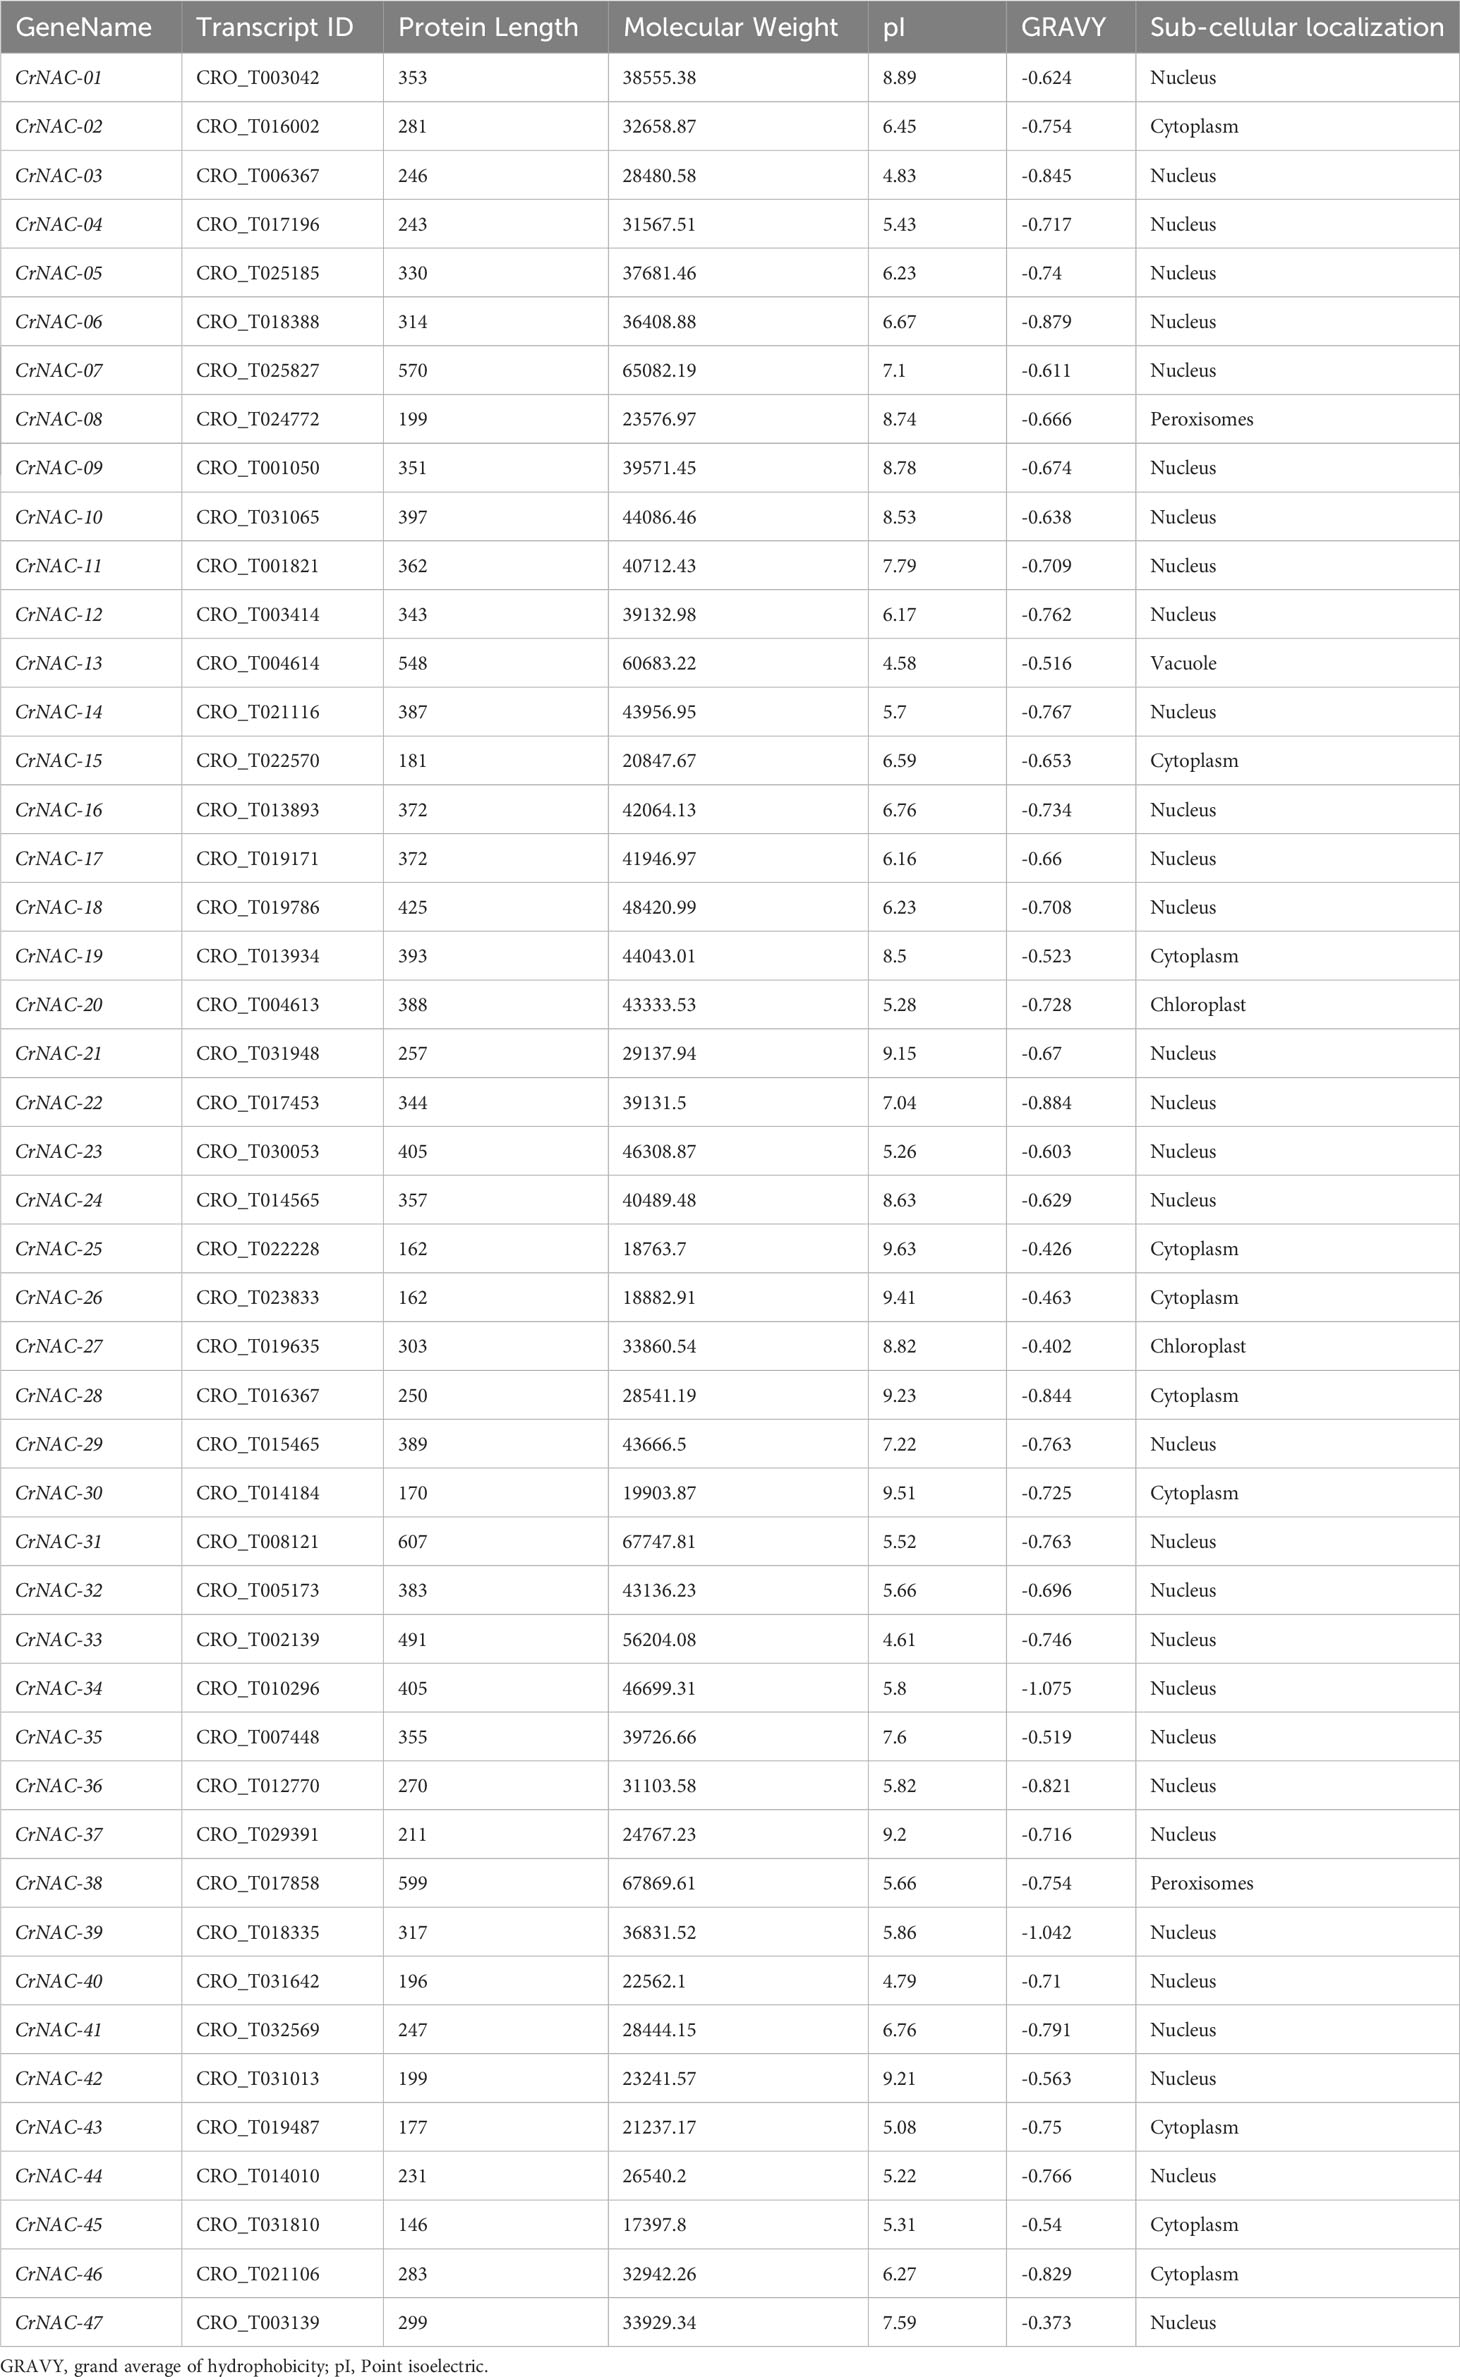
Table 1 Physiochemical properties of identified NAC TFs in C. roseus.
Clustering analysis classified CrNACs into 8 groups based on known NACs in that group. The groups were differentiated as Group-I (AtNAC3/ATAF), Group-II (SNAC), Group-III (SENU5), Group-IV (ONCA22/TERN), Group-V (OsNAC7), Group-VI (NAM/NAC7), Group-VII (ANAC11) and Group-VIII (NAC2) (Figure 1). Group-VI was the largest contained 7 CrNACs clustered together with 10 OsNACs and 8 AtNAC, making a total of 25 NAC proteins. In comparison, Group-IV was the smallest group with only 8 NAC proteins that included 6 CrNAC proteins together with 1 each of OsNAC and AtNAC. Nevertheless, the highest number of CrNAC proteins was found in Group-III which contained 12 proteins clustered with 3 OsNACs and 1 AtNAC.
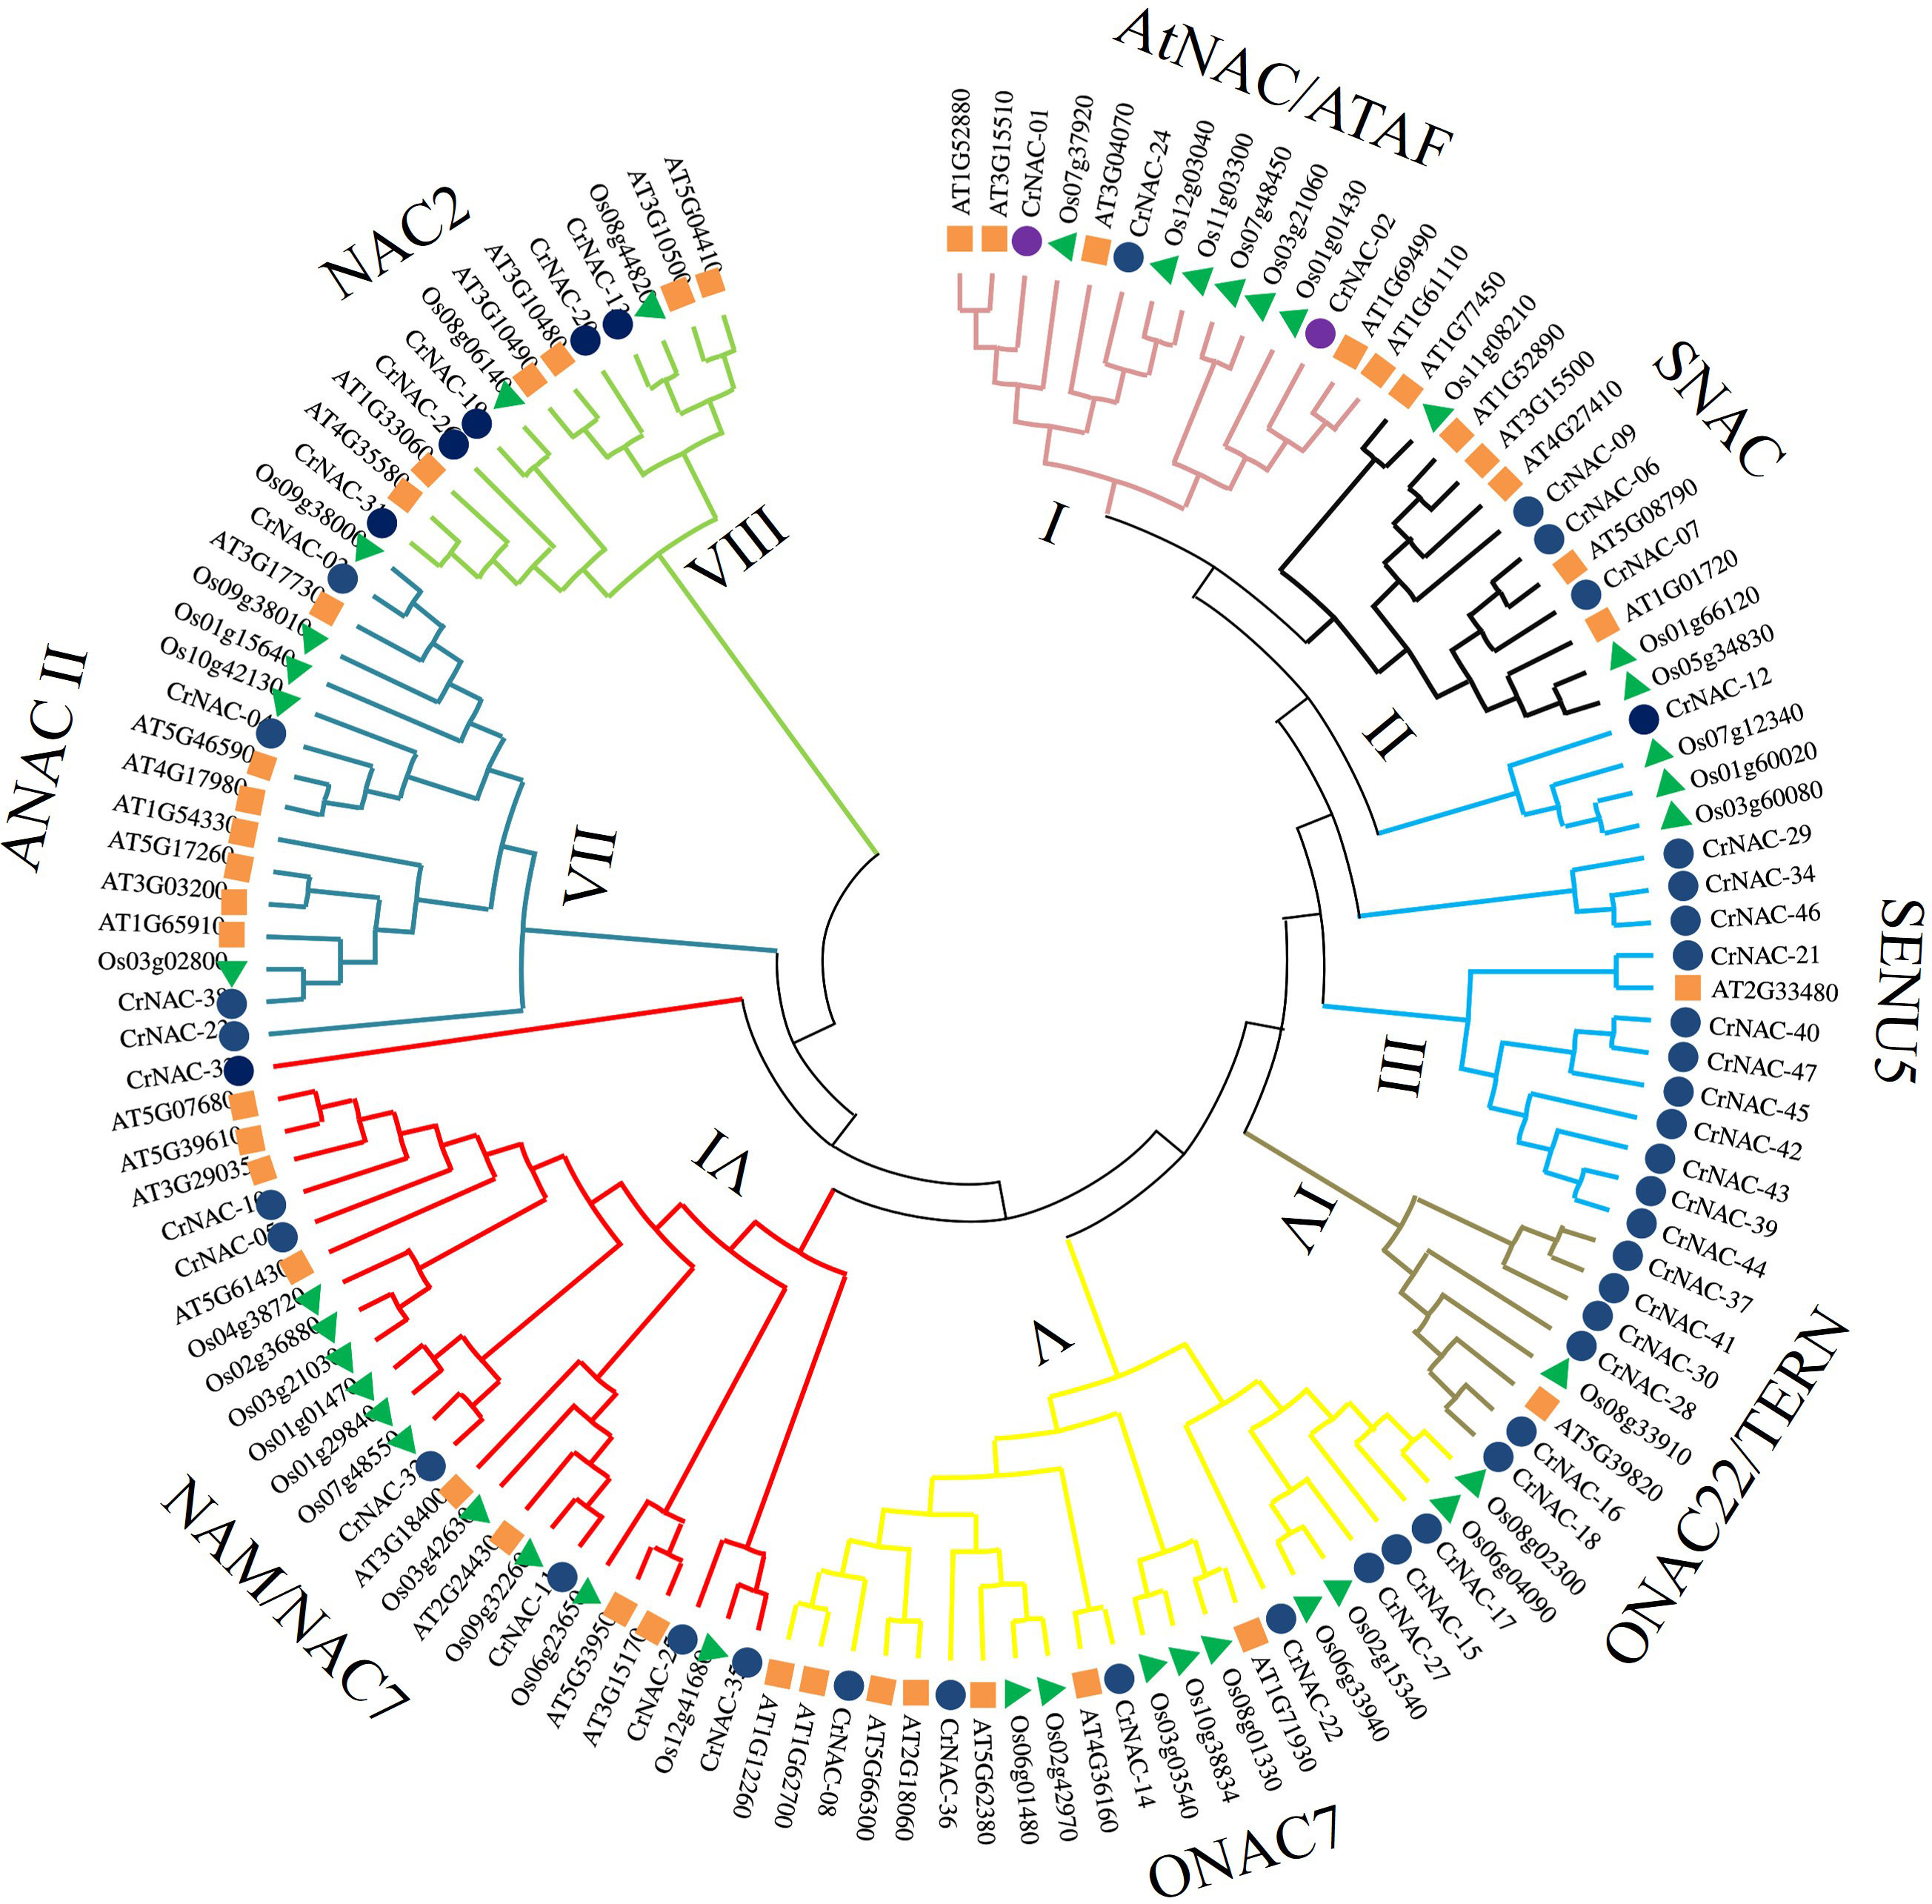
Figure 1 Maximum likelihood phylogenetic tree of NAC proteins of C. roseus, Arabidopsis thaliana, and Oryza sativa. Overall, 47 CrNAC (blue circles), 41 AtNAC (orange rhombus), and 39 OsNAC (green triangles) proteins were divided into 8 groups.
3.2 Gene structure and conserved motif analysis
The length of NAC genes in C. roseus varied greatly, ranging from 683 bp to 6813 bp. The number of exons in NAC genes ranged from 2 to 6. A majority of genes (29) had 3 exons while 5 genes contained only 2 exons. CrNAC-07 and CrNAC-31 were the largest genes each containing 6 exons (Figure 2A). A total of 10 different motifs were found in CrNACs (Figure 2B). Motifs 3 and 4 were found in all genes except CrNAC-38 and CrNAC-46. The highest number of motifs were found in genes belonging to group-III.
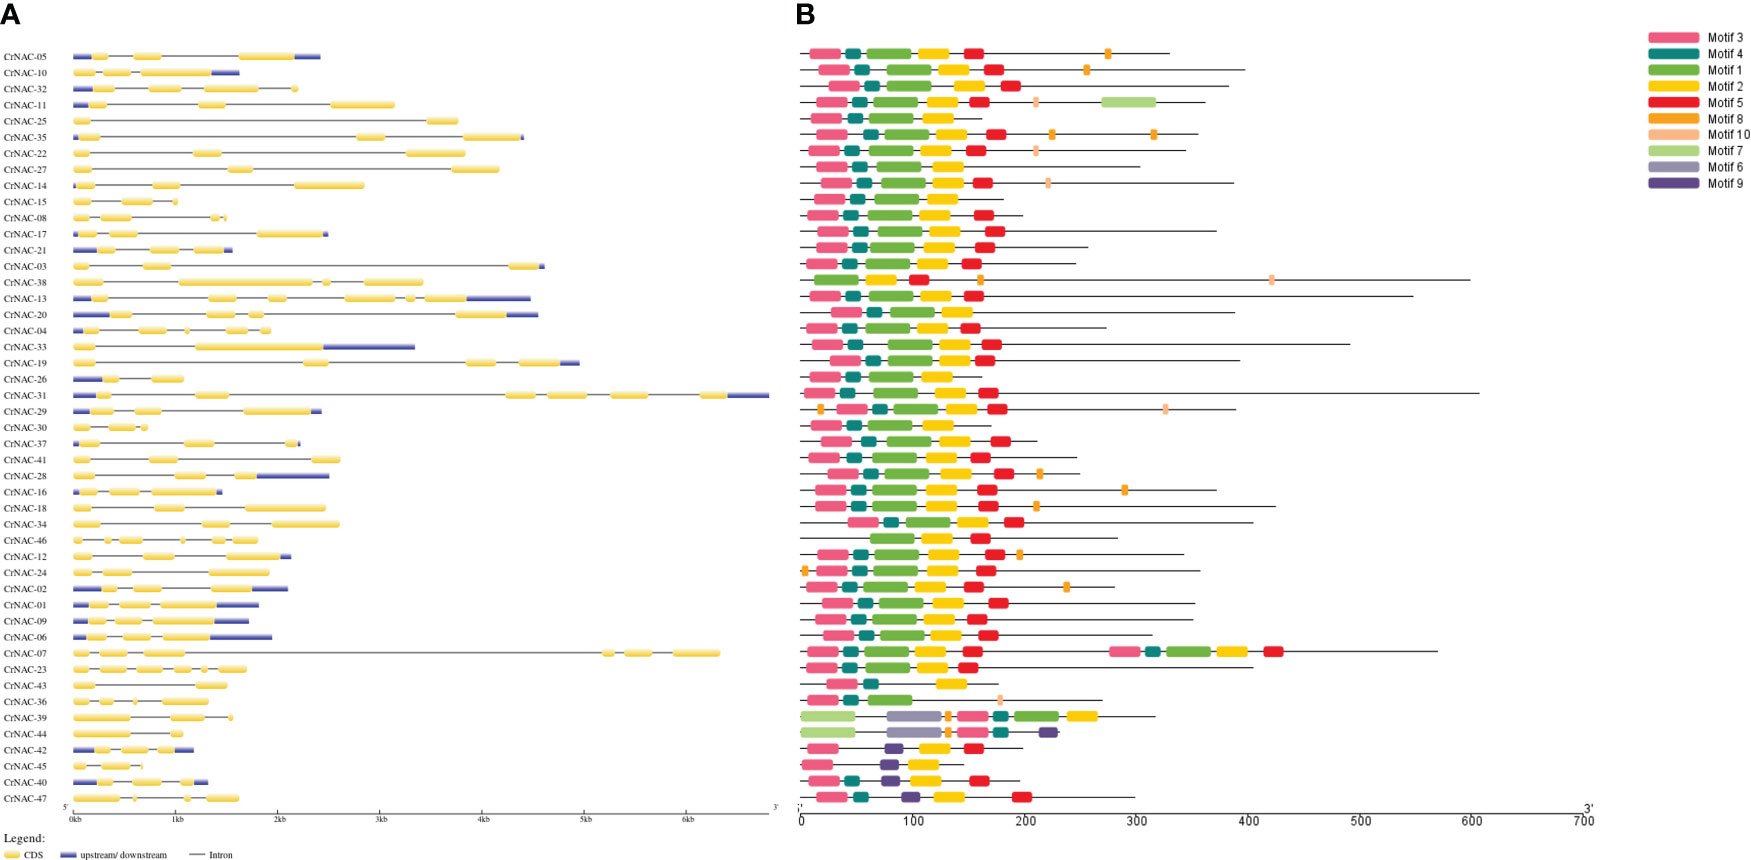
Figure 2 (A) The intron-exon structure of CrNAC proteins. Black lines indicate intron while yellow boxes represent exons. The 3´ and 5´ UTRs are shown by blue boxes. (B) Conserved motifs identified in CrNAC genes are represented by a different color.
3.3 Location on chromosome, duplication, and synteny analysis
Chromosomal location analysis showed that 47 NAC genes were unevenly distributed on all eight chromosomes in C. roseus. The highest number of CrNAC genes (12) were found on chromosome 3 followed by 6 on chromosome 8. Similarly, chromosomes 2, 4, and 6 contained 5 CrNAC genes each while chromosomes 1 and 7 contained 4 each (Figure 3). Gene duplication analysis predicted fourteen CrNAC gene pairs in the C. roseus genome making a total of 28 duplicated genes, four of which appeared tandemly duplicated (CrNAC-06/CrNAC-07, CrNAC-13/CrNAC-20, CrNAC-26/CrNAC-31 and CrNAC-39/CrNAC-44) while the remaining ten gene pairs were segmentally duplicated (Figure 4A). Table 2 shows ka/ks <1 for duplicated gene pairs which was maximum for CrNAC-34/CrNAC-46 gene pair (0.39). Figure 4B shows different syntenic relationships of CrNACs with their counterparts in C. acuminata (4), G. sempervirens (4), M. speciosa (3) and A. thaliana (0).
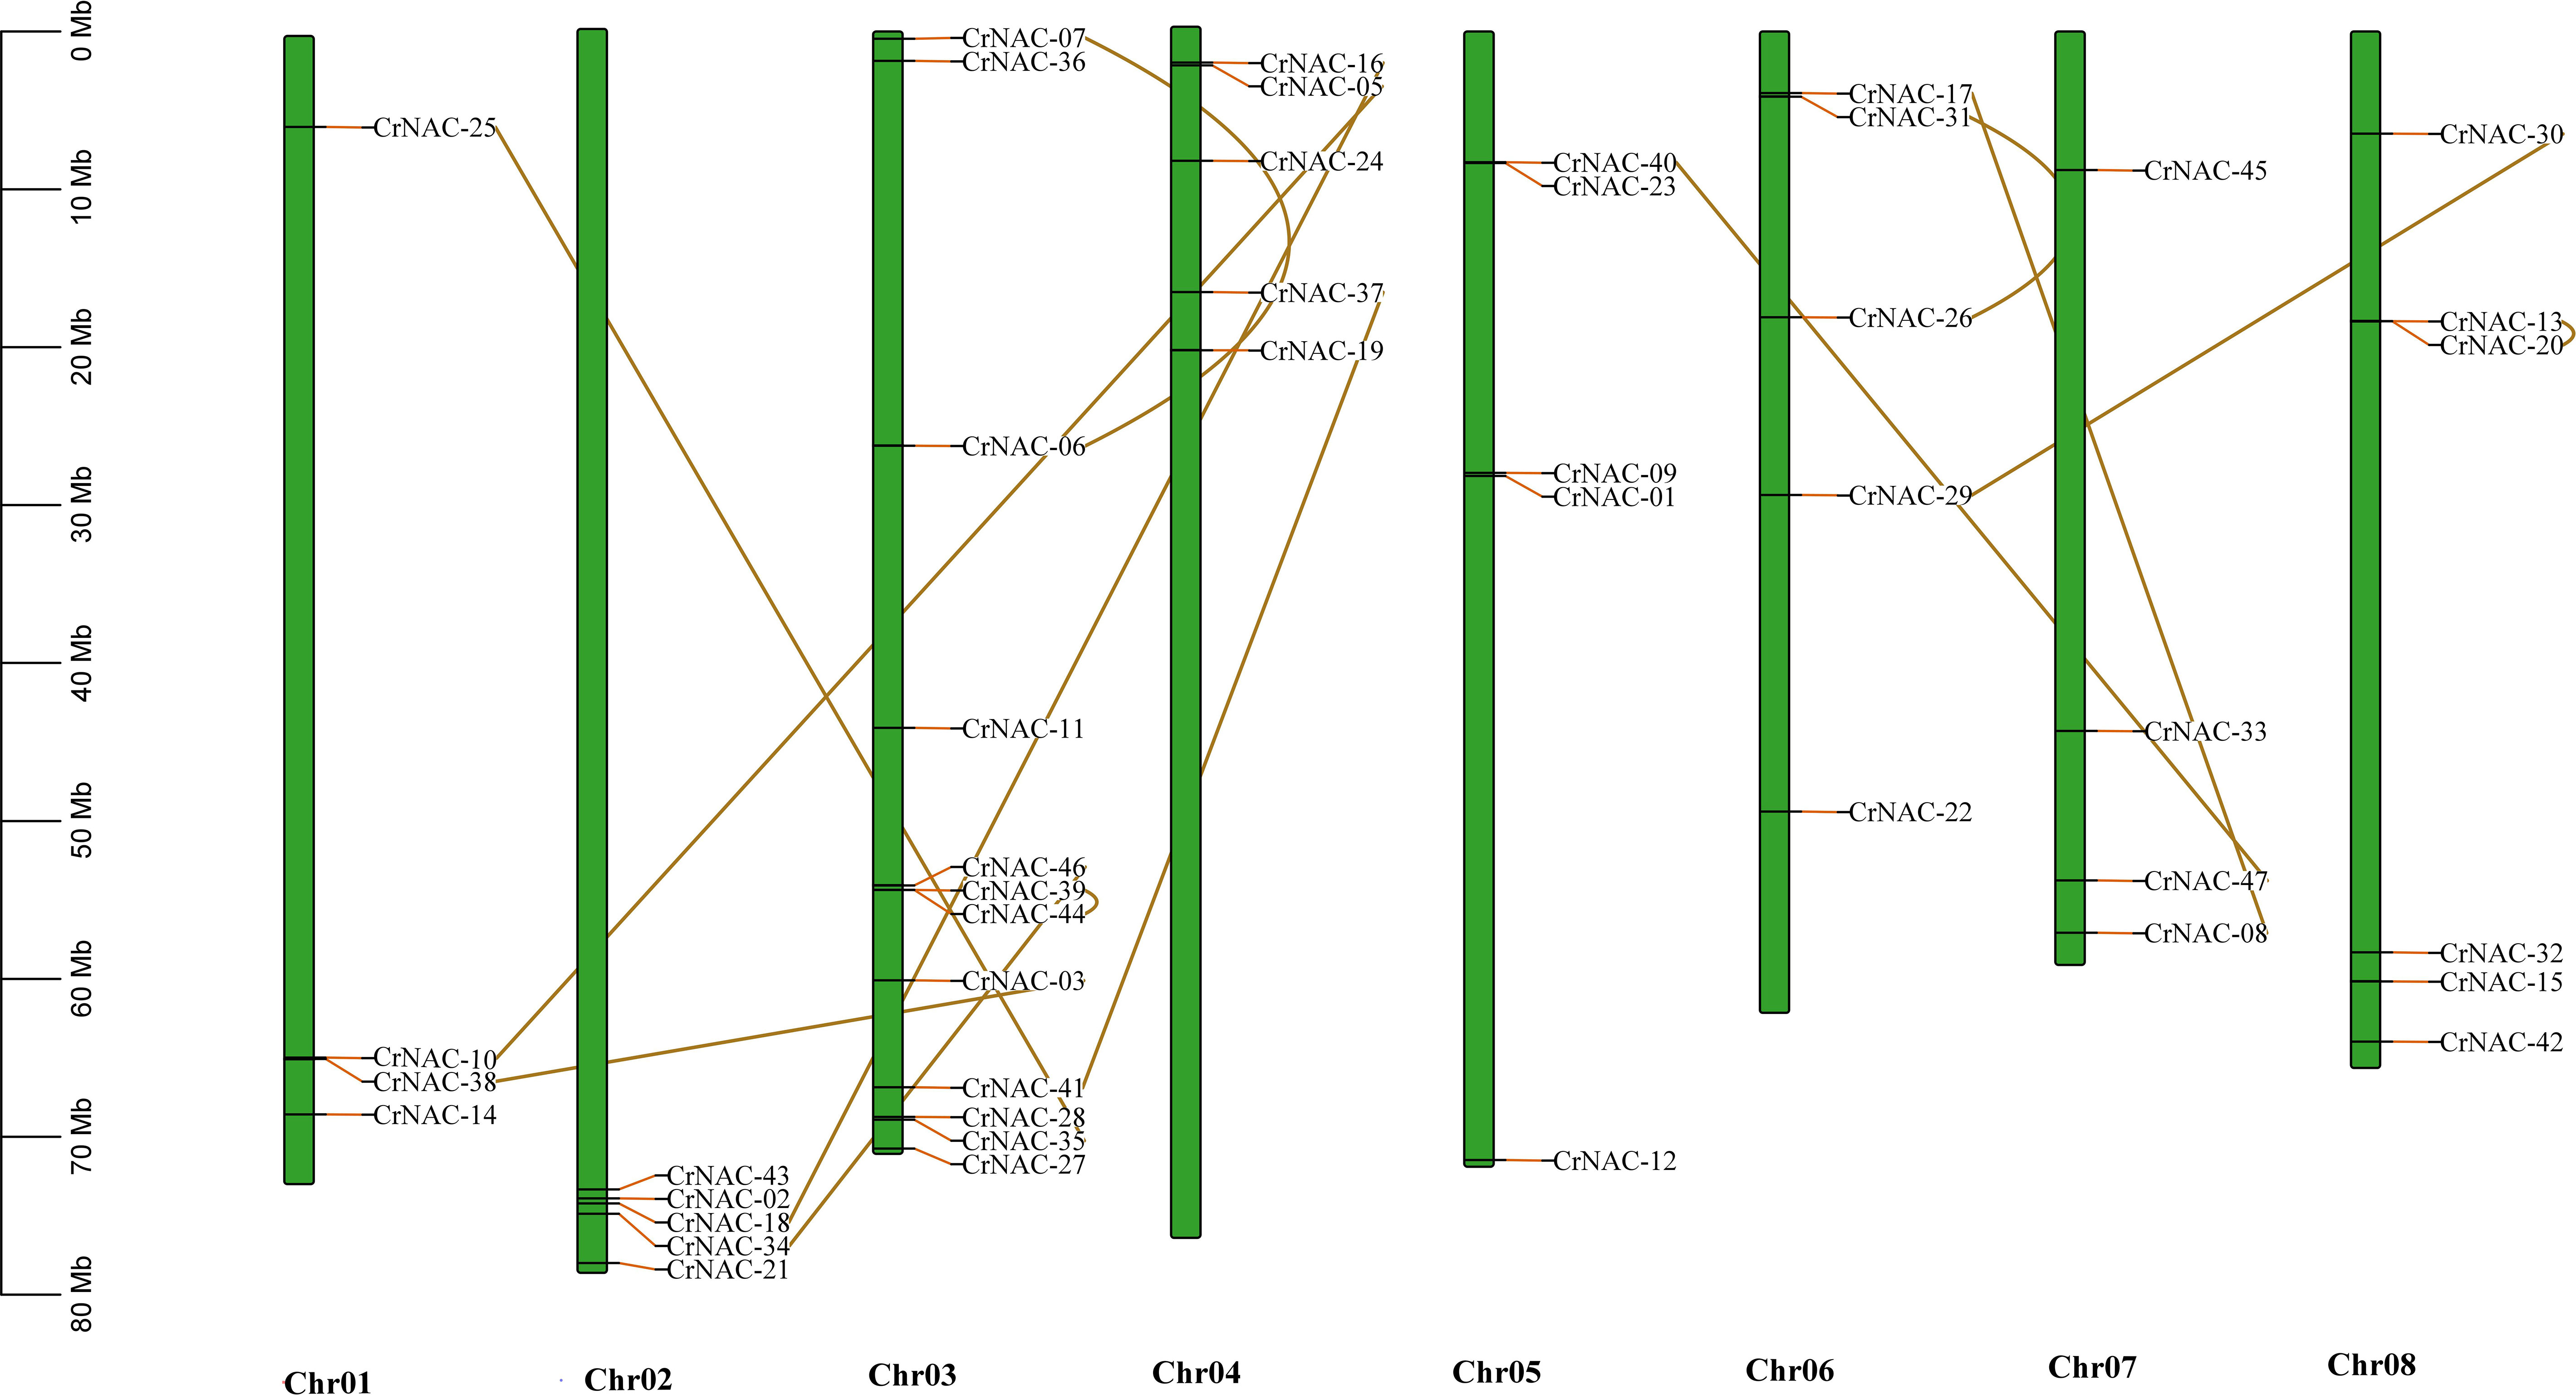
Figure 3 Chromosomal location of CrNAC genes across eight chromosomes of C. roseus. The chromosome number is indicated at the bottom. The scale in megabases (Mb) on the left side represents chromosomal distance while duplication of CrNAC genes is indicated by line.
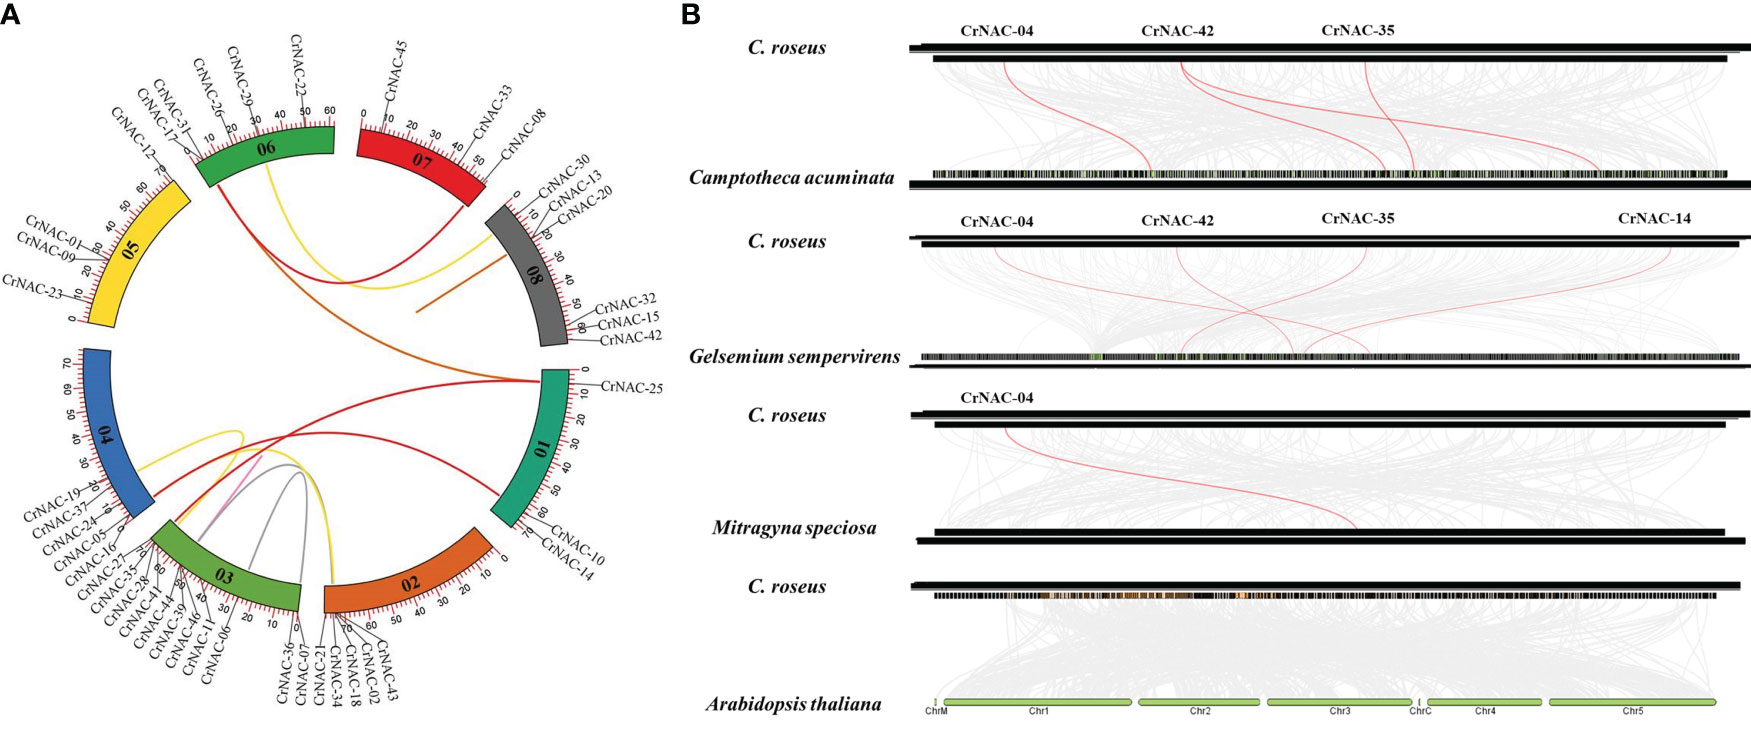
Figure 4 (A) Chromosomal locations of CrNAC genes and their synteny are illustrated by the circos diagram. Colored lines indicate duplication events. (B) Synteny analysis of NAC gene family between C. roseus, C. acuminata, G. sempervirens, and A. thaliana..
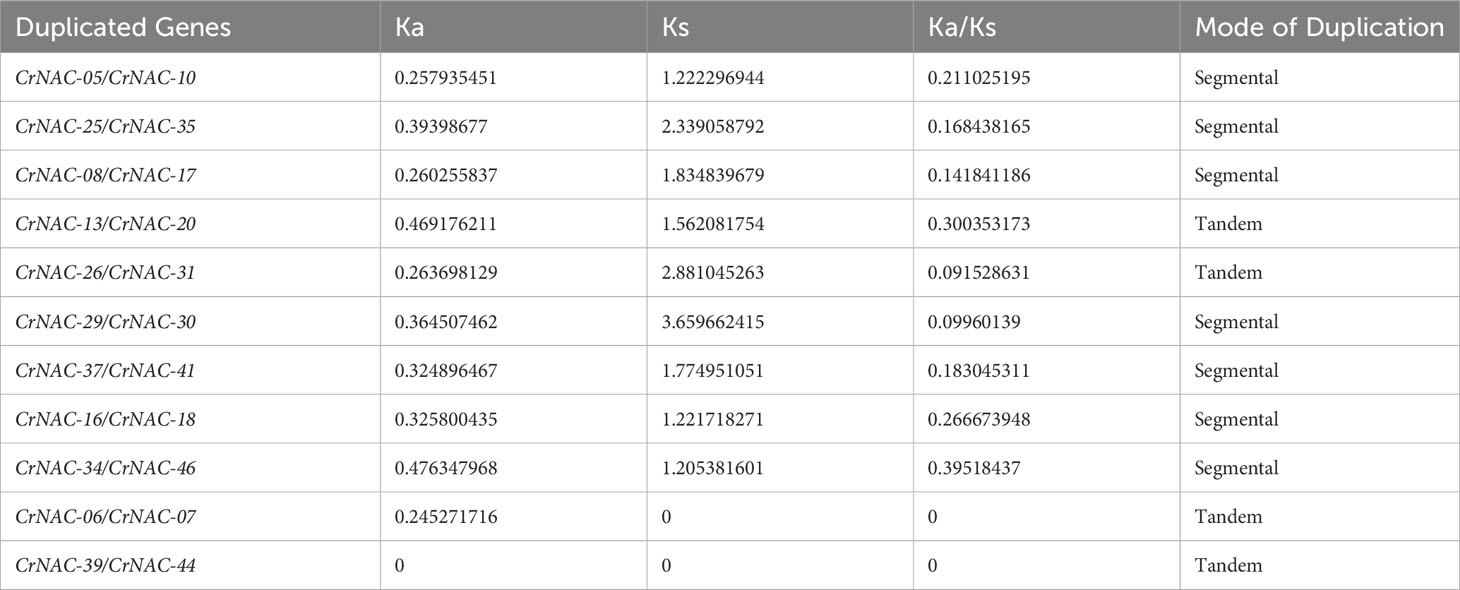
Table 2 Duplicated gene pairs, non-synonymous substitution rate (Ka), synonymous substitution rate (Ks), Ka/Ks ratio, and mode of gene duplication.
3.4 Cis-acting regulatory element analysis of CrNAC genes
The promoter region of CrNAC genes showed many cis-acting elements, falling into six major categories that included core promoter elements, stress-responsive, light-responsive, binding sites, development-related and hormone-responsive elements. The distribution of stress and hormone-responsive elements;’’ of CrNAC genes are shown in Figure 5.
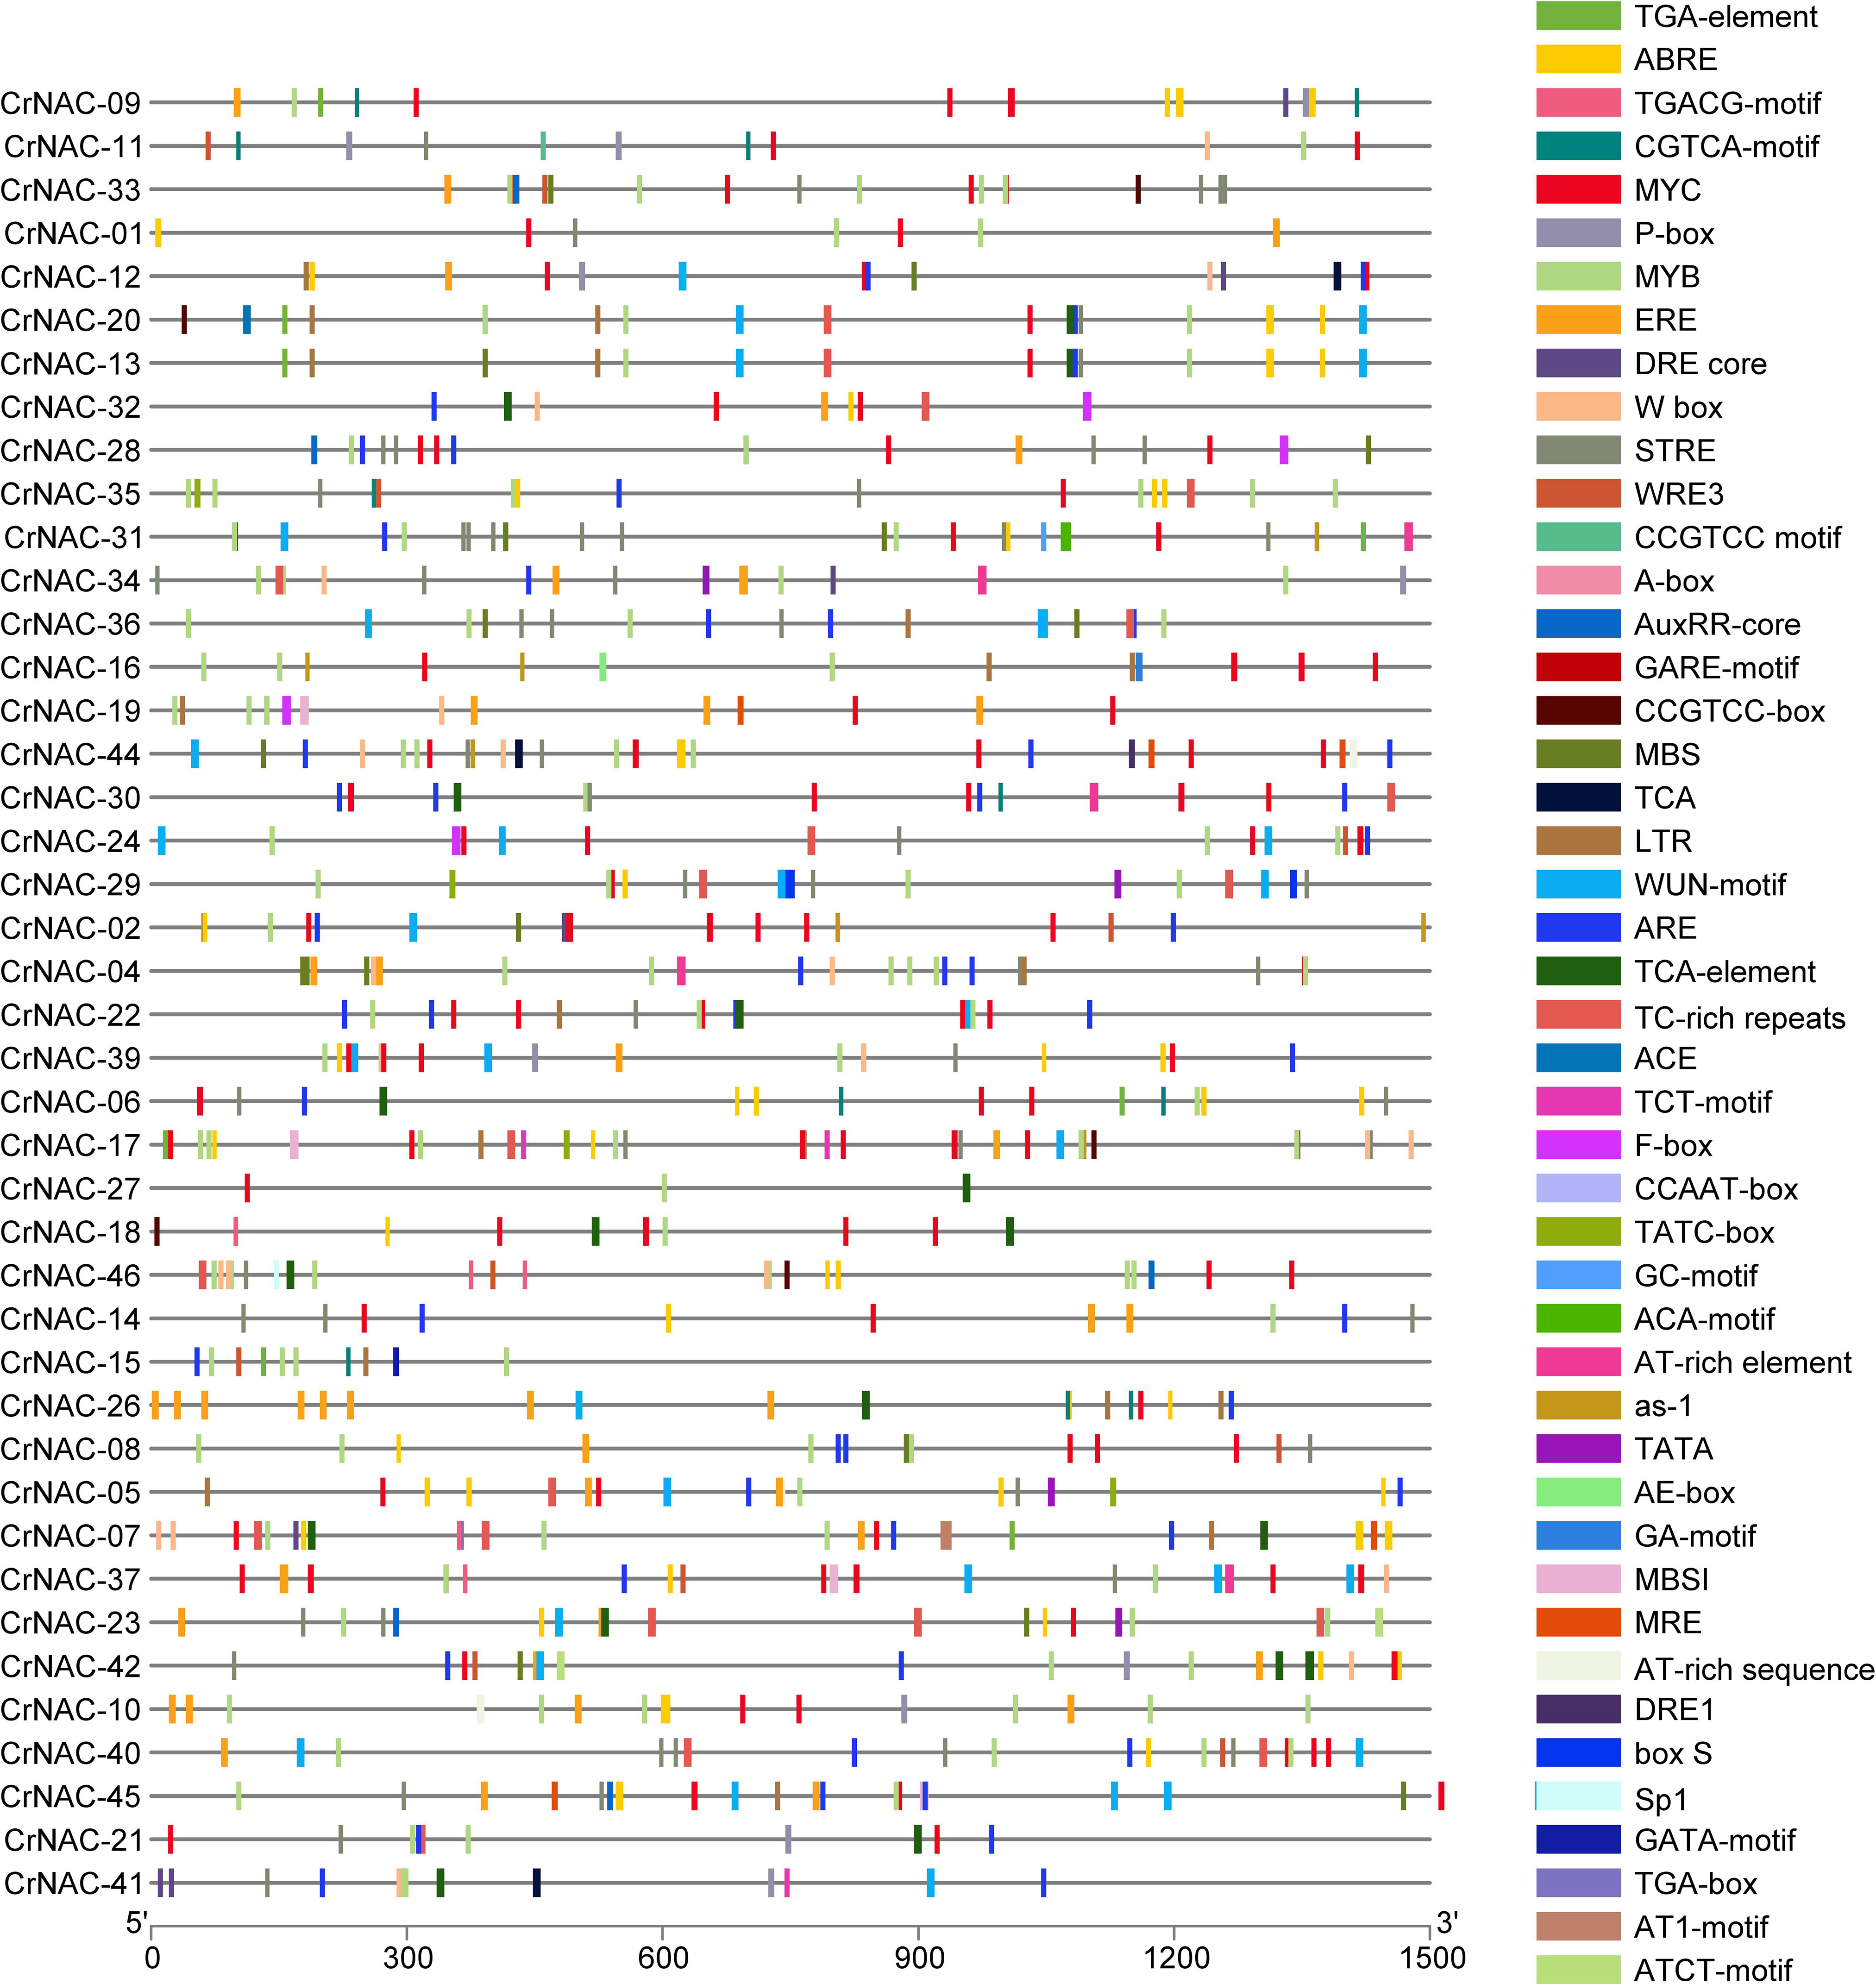
Figure 5 Distribution of cis-acting elements in the promoter region of CrNAC genes. Boxes represent specific cis-acting elements.
3.5 Gene expression and co-expression network analysis
The available RNA-Seq data showed that most CrNAC genes were expressed in all four tissues indicating their roles in regulating plant growth and development. However, few NAC genes showed tissue-specific expression patterns suggesting their role in tissue-specific physiological processes. For example, CrNAC-01, CrNAC-23 and CrNAC-35 were specifically expressed in flowers. (Figure 6A). Furthermore, the RNA-Seq available on Methyl Jasmonate (MeJ) treated C. roseus seedling, cell suspension, and hairy root culture were analyzed for transcript abundance of CrNAC genes. (Figure 6B). At the seedling stage, MeJ treatment positively induced the expression of 24 CrNACs while 13 were downregulated. In suspension culture, MeJ treatment (100 µM) for 12 h was found most effective in upregulating the expression of most CrNAC genes compared to 6 h and 72 h treatments. In hairy root cultures, 22 CrNAC genes were downregulated by MeJ treatment while 16 NAC genes were upregulated, and expression of 11 NAC genes remained unchanged in both control and MeJ-treated samples. The expression pattern of NAC genes in suspension cultures treated with yeast extract is shown in Figure 6B. Out of 47 genes, 10 NAC genes showed no expression in any treated sample while CrNAC-24 and CrNAC-42 expressed only in 0.3 mg/ml yeast extract after 6 h in suspension culture. Figure 6C shows a predicted co-expression network between putative CrNACs and rate-limiting genes of MIAs biosynthesis. Among 17 MIA biosynthesis genes, 5 showed a positive correlation with most of the CrNACs. On the other hand, a single CrNAC showed positive interaction with one set of CrNACs while negative interaction with others. For instance, CrGES showed a positive correlation with CrNAC-20 whereas a negative correlation with CrNAC-02 and CrNAC-19. These findings suggested a complex regulatory network working between CrNACss and MIA biosynthesis genes, with certain CrNACss showing a strong positive correlation with multiple biosynthesis genes, while others exhibited negative or no correlation.
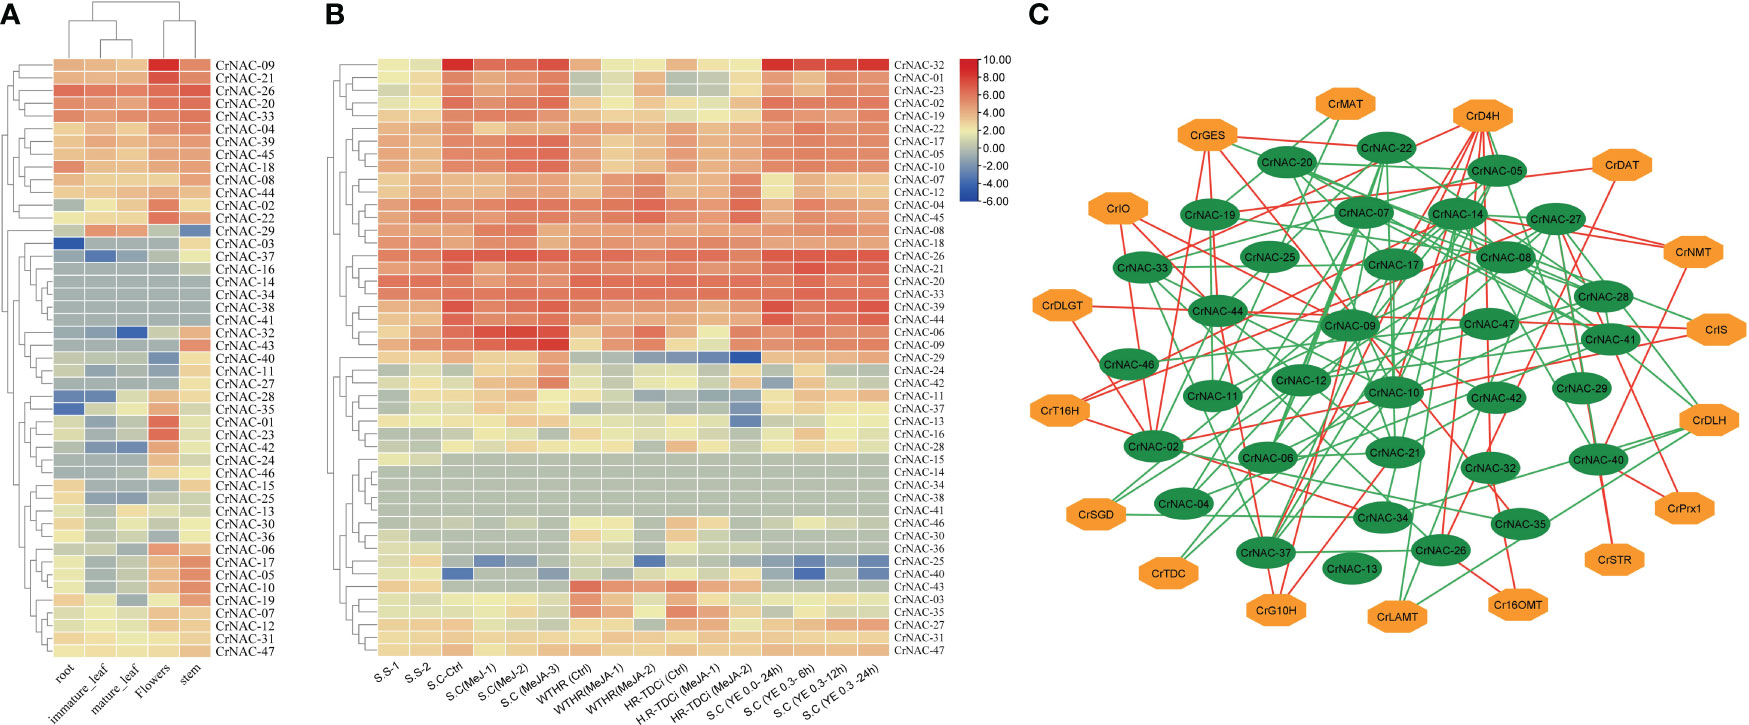
Figure 6 (A) Heat map showing the expression pattern of CrNAC genes in roots, immature leaf, mature leaf, flowers, and stem. (B) Heat map showing the expression pattern of CrNAC genes in various cultures and response to methyl jasmonate and yeast extract. (C) Co-expression network showing a correlation between CrNACs and MIAs biosynthesis genes. Green lines represent a positive whereas red lines show a negative correlation.
3.6 Effect of elicitors on MIA production in in-vitro cultures
Tukey test for the multiple comparisons of means showed that 200 µM of 5-F-IAA was the optimum concentration for significantly highest production of catharanthine in both nodal (3.74 µg/mg DW) as well as cell suspension culture (0.89 µg/mg DW) (Figure 7A). On the other hand, 100 µM of PEO-IAA produced maximum catharanthine (2.99 µg/mg DW) in nodal culture while none of the PEO-IAA concentrations in the cell suspension culture was effective enough to significantly increase catharanthine biosynthesis in cell suspension culture compared to control (Figure 7D).
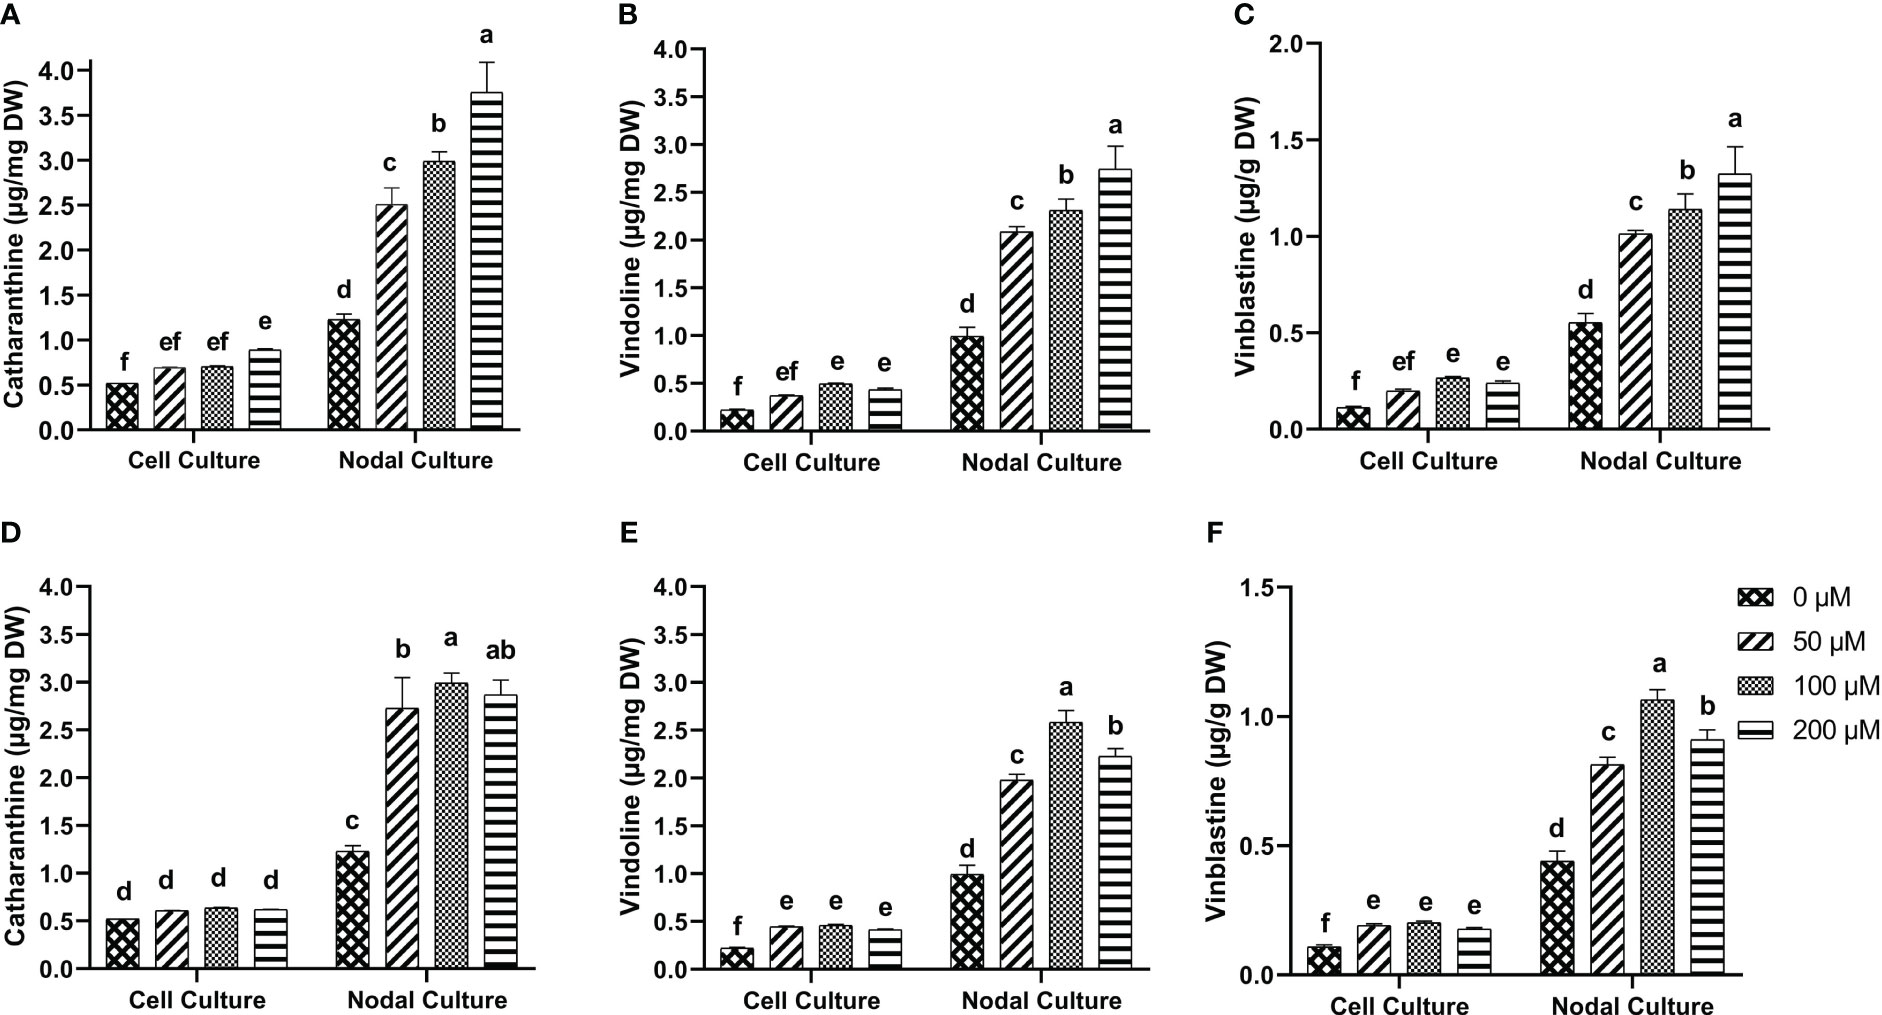
Figure 7 In-vitro biosynthesis of MIAs in response to 5-F-IAA elicitor (A–C) and PEO-IAA elicitor (D–F) in cell suspension and nodal cultures of C. roseus. Bars show mean ± SD. Different lower-case letters show statistically significant differences among means at p ≤ 0.05 by Tukey HSD.
5-F-IAA elicited significantly higher vindoline production at all concentrations compared to the control. The maximum vindoline production (2.74 µg/mg DW) was observed in the nodal culture at 200 µM of 5-F-IAA which was 2.7-fold higher than the control. Likewise, in cell suspension culture, 100 µM 5-F-IAA was effective in producing almost double the amount (0.49 µg/mg DW) of vindoline than control (0.22 µg/mg DW) (Figure 7B). The highest concentration (2.58 µg/mg DW) of vindoline was produced in response to 100 µM PEO-IAA in nodal culture while 200 µM significantly decreased vindoline biosynthesis. In cell suspension culture, increase in vindoline production was independent of an increase in elicitor concentration as is evident by the values observed at 50 µM (0.44 µg/mg DW), 100 µM (0.46 µg/mg DW), and 200 µM (0.41 µg/mg DW) (Figure 7E).
A concentration-dependent significantly linear increase in vinblastine production was observed in response to 5-F-IAA. The highest production of vinblastine (1.32 µg/mg DW) was observed in the nodal culture at 200 µM of 5-F-IAA. On the contrary, 100 µM 5-F-IAA elicited the highest biosynthesis (0.26 µg/mg DW) of vinblastine in cell suspension culture. (Figure 7C). Elicitation of vinblastine by 100 µM PEO-IAA was effective in producing 2.46-fold higher vinblastine in nodal culture than control. Vinblastine production significantly increased in PEO-IAA-treated cell suspension cultures compared to the control, however, the increase in vinblastine production was independent of PEO-IAA concentration (Figure 7F).
3.7 Effect of elicitors on the expression of genes and transcription factors involved in MIA biosynthesis
3.7.1 Genes involved in biosynthesis of strictosidine
Expression of the selected genes of C. roseus upon elicitation with different concentrations of 5-F-IAA and PEO-IAA in nodal culture is presented in Figure 8. The results showed that all the elicitor concentrations significantly upregulated the expression of tryptophan decarboxylase (TDC) compared to the control. The highest expression of TDC (13.5-fold) was observed in response to 200 µM of 5-F-IAA compared to its control. Both 5-F-IAA and PEO-IAA at 100 µM concentration were similarly effective in giving an 8.49-fold and 9.74-fold increase in TDC expression, respectively (Figure 8A). Secologanin synthase (SLS) expression in C. roseus nodal culture was significantly higher upon treatment with 200 µM of 5-F-IAA, exhibiting a 7.89-fold increase compared to the control. (Figure 8B). 200 µM 5-F-IAA was effective enough to increase 7.79-fold expression of strictosidine β-D-glucosidase (SGD). Among the rest of the treatments, the lowest value for SGD expression (2.8-fold) was recorded for 200 µM of PEO-IAA where the mean value was insignificant to the mean control value (Figure 8D). The relative expression of strictosidine synthase (STR) was 5.9-fold and 4.9-fold higher in leaves of C. roseus nodal culture treated with 200 µM and 100 µM of 5-F-IAA, respectively. However, 50 µM of PEO-IAA failed to upregulate significantly higher expression of STR (1.49-fold) compared to the control (Figure 8C).
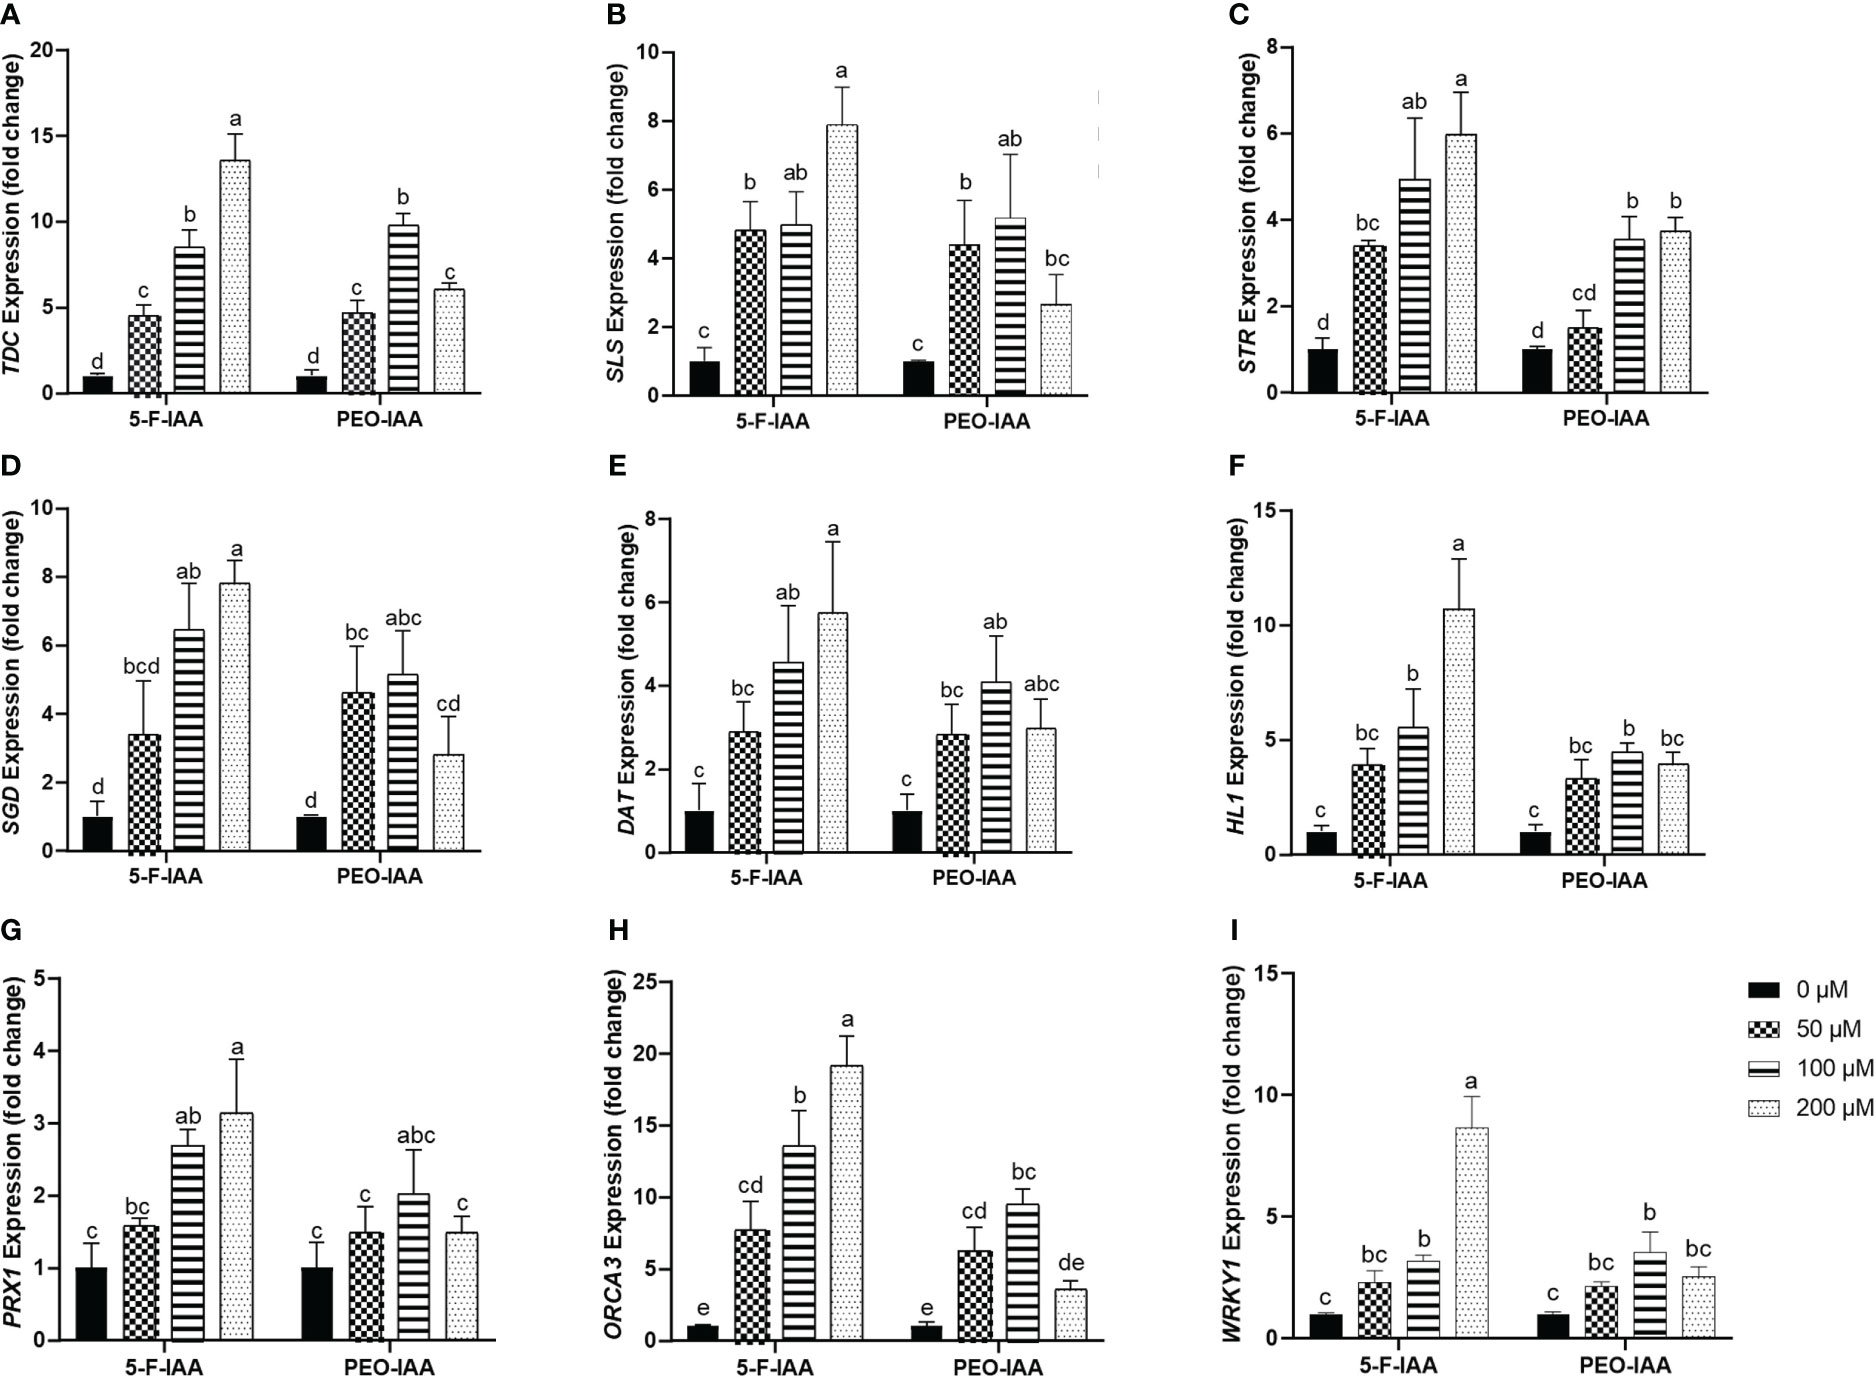
Figure 8 Relative expression of genes involved in the biosynthesis of MIAs upon elicitation with 5-F-IAA and PEO-IAA. Data for (A) TDC, (B) SLS, (C) STR, (D) SGD, (E) DAT, (F) HL1, (G) PRX1, (H) ORCA3, and (I) WRKY1 are presented as fold change ± SD. Different lower-case letters show a statistically significant difference in mean values revealed by Tukey HSD at p ≤ 0.05.
3.7.2 Genes involved in biosynthesis of vinblastine and its precursors
Of the three genes, hydrolase-1 (HL1) showed the highest relative expression (10.7-fold) in response to the treatment with 200 µM of 5-F-IAA followed by 100 µM of 5-F-IAA (5.52-fold) and 100 µM of PEO-IAA (4.45-fold) (Figure 8F). A similar pattern of relative gene expression was recorded for deacetylvindoline O-transferase (DAT) in which 200 µM of 5-F-IAA enhanced the 5.74-fold DAT transcript level compared to its control (Figure 8E). Like HL1 and DAT, the expression of peroxidase-1 (PRX1) was recorded highest upon elicitation with 200 µM of 5-F-IAA (3.13-fold) followed by 100 µM of 5-F-IAA (2.68-fold). No concentration of PEO-IAA was able to elicit statistically significant expression of PRX1 compared to the control. (Figure 8G).
3.7.3 Genes coding for transcription factors involved in biosynthesis of MIAs
In the present study, a notable difference in the expression of ORCA3 and WRKY1 was observed, where the expression of ORCA3 was significantly higher than WRKY1 (Figure 8H). Application of 200 µM of 5-F-IAA was equally effective for the correspondingly highest expression of both ORCA3 (19.15-fold) and WRKY1 (8.6-fold) in the nodal culture of C. roseus. Except for 200 µM of PEO-IAA, application of all other elicitor concentrations of 5-F-IAA and PEO-IAA promoted significantly higher expression of ORCA3 than the control. Expression of WRKY1 upon elicitation with 100 µM of 5-F-IAA and 100 µM of PEO-IAA were not significantly different from one another but significantly higher than the control (Figure 8I).
3.7.4 Expression of CrNAC-7, CrNAC-24 and CrNAC-25
Among CrNACs the highest expression was observed in response to the application of 200 µM of 5-F-IAA in CrNAC-7 (4.3-fold) and CrNAC-24 (3.7-fold) (Figures 9A, B). Interestingly, downregulation was observed for CrNAC-25 at all treatment levels of both 5-F-IAA and PEO-IAA. The lowest expression observed for CrNAC25 was -3.2-fold in response to 200 µM of 5-F-IAA (Figure 9C).
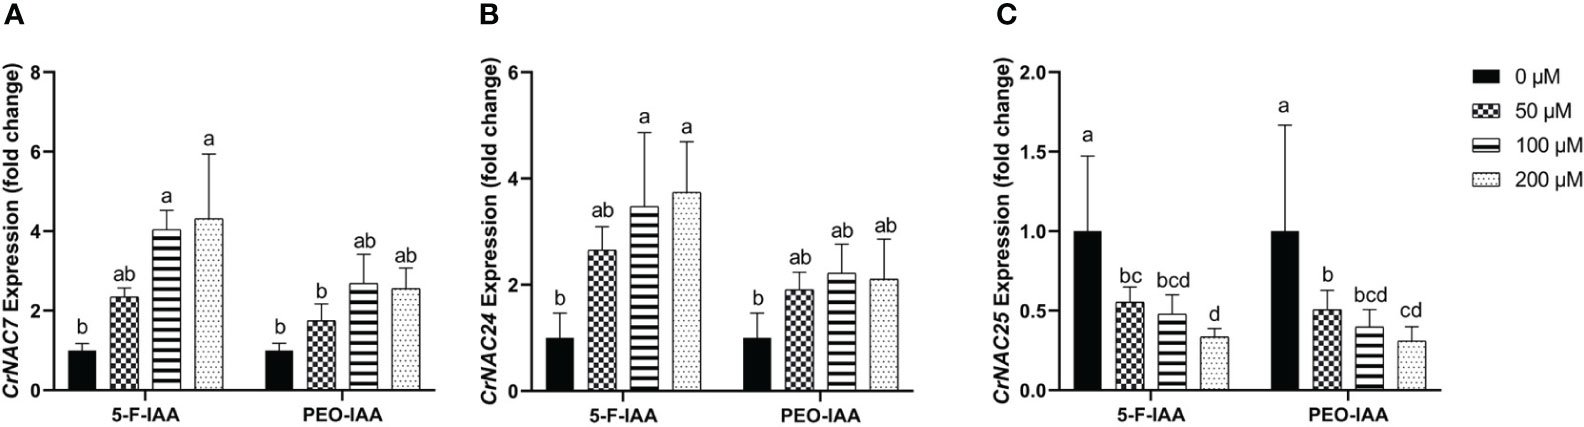
Figure 9 Relative expression of (A) CrNAC-7, (B) CrNAC-24, and (C) CrNAC-25 is presented as fold change ± SD. Different lower-case letters show a statistically significant difference in mean values revealed by Tukey HSD at p ≤ 0.05.
4 Discussion
Several studies have identified NAC families in many plant species, however, there is still no detailed information available on the NAC family in C. roseus. In the present study, 47 NAC TFs were identified in the C. roseus genome, which were classified into eight groups based on homology with AtNACs. Previously, NACs have been divided into 8 subgroups in banana (Cenci et al., 2014) and peanut (Li et al., 2021), 6 subgroups in soybean (Le et al., 2011), and 16 subgroups in cassava (Hu W. et al., 2015). This indicates that the NAC gene family in C. roseus is highly conserved and has similar diversity to that of banana and peanut. Among the 8 groups, group-I (AtNAC3/ATAF) and group-II (SNAC) members were classified as stress-responsive while group-VI (NAM) genes were found to regulate growth (Jiang et al., 2017). Furthermore, group-IV (NAC22) was also found to regulate morphogenesis, particularly root development. In Arabidopsis, the subgroup-AtNAC3 members like ANAC055, ANAC019, and ANAC072 participate in the abiotic stress response (Bu et al., 2008).
Analysis of available RNA-Seq data showed that SNAC members CrNAC-06, CrNAC-07, and CrNAC-09 were also upregulated in response to MeJ and yeast extract treatments, reflecting their involvement in stress responses. Validation of RNA-Seq by expression profiling of putatively identified CrNACs showed that CrNAC-07 and CrNAC-24 were upregulated upon elicitation. The results for CrNAC-07 were consistent with those observed from the analysis of available RNA-Seq data. Moreover, a previous study showed that ANAC0032, a member of the SNAC group responded to high sucrose, oxidative, and other abiotic stresses by regulating the synthesis of anthocyanin (Mahmood et al., 2016). The presence of stress-responsive cis-acting elements in the promotor of SNAC genes further confirmed their role in stress resistance. However, the upregulation of CrNAC-24 was an interesting finding. Ectopic expression of an ATAF member HaNAC1 in A. thaliana showed an improvement in growth as well as resistance to drought (Gong et al., 2020). Therefore, the upregulation of CrNAC-24 may be attributed to the application of selected elicitors. Analysis of putative cis-acting elements in the promoter region of CrNAC-24 revealed the presence of diverse cis-acting elements responsive to both biotic and abiotic stresses which may be the reason behind the enhanced transcript of CrNAC-24. The role of NACs in regulating plant secondary metabolites has just surfaced. Recently, 11 liNAC genes have been reported to positively correlate with 72 plant secondary metabolites in Isatis indigotica (Wang et al., 2023). Likewise, CsNAC-7 has been shown to positively regulate the expression of yhNMT1, a caffeine synthase gene in tea plant (Fu et al., 2013). In apple, anthocyanin accumulation was noted upregulated upon binding of MdNAC25 to MYB genes (Sun et al., 2019).
It was observed that the expression of CrNAC-25 was negatively regulated by both elicitors. CrNAC-25 belongs to the NAC/NAM7 cluster of NAC TFs. The phylogenetically closest member in the subclade (Os12g41680) is reportedly characterized by its role in plant growth (Jiang et al., 2017). Interestingly, a decrease in biomass was also observed in response to elicitation (Supplementary Figure S10). Moreover, it has previously been reported that Osa-miR164a targets Os12g41680 and downregulates its expression under Magnaporthe oryzae infection (Wang et al., 2018). Since both the elicitors are inhibitors of auxin signaling, therefore the decrease in growth-related CrNAC-25 expression may be attributed to a trade-off between plant primary and secondary metabolisms (Huot et al., 2014).
In this study, the accumulation of three MIAs catharanthine, vindoline, and vinblastine was noted significantly higher in nodal culture than in cell suspension culture of C. roseus. In a similar study, (Linh et al., 2021) reported lower total alkaloid content in C. roseus calli than in the whole plant. In another study, metabolomic analysis of 20 plants showed that phenolic content in the callus cultures was either lower or completely lacking compared to intact plant parts such as roots and stems (Hagel et al., 2015). The difference in the production of MIAs in nodal and cell suspension cultures may be attributed to the complex biosynthetic pathway of MIAs, and tissue-specific cellular and subcellular localization of the intermediates involved in their biosynthesis (Miettinen et al., 2014). For example, initial steps in the biosynthesis of MIAs in the C. roseus plant occur in the internal phloem-associated parenchyma (IPAP) cells. The formation of catharanthine takes place in the cytosol of leaf epidermal cells, and vindoline is formed and stored in the vacuole of idioblast cells (Yamamoto et al., 2019). The presence of a central vacuole in differentiated nodal culture contributes to the enhanced biosynthesis of vindoline as compared to cell suspension culture where the vacuoles are smaller in size (Efferth, 2019).
Several reports established that auxins antagonize the production of specialized metabolites by reducing the activity of peroxidases (Bais et al., 2001; El-Sayed and Verpoorte, 2007; Aslam et al., 2010; Amoo and van Staden, 2013; Mekky et al., 2018). Contrariwise, a study conducted on Arabidopsis plants with a double mutant (tir1 afb2) of auxin signaling demonstrated an upregulation of genes involved in plant defense against stress (Iglesias et al., 2011). Moreover, salicylic acid has been shown to inhibit pathogen growth by repressing auxin signaling in A. thaliana (Wang et al., 2007). Considering all the available evidence, we hypothesized that an instant, transient, and dose-dependent inhibition of auxin signaling by small molecules can positively regulate the production of plant secondary metabolism. To test our hypothesis, we used two synthetic auxin signaling inhibitors namely 5-F-IAA and PEO-IAA to evaluate their potential as elicitors of MIAs in C. roseus cell suspension and nodal culture. A differential response of 5-F-IAA and PEO-IAA was observed toward the elicitation of MIAs. 5-F-IAA binds with ABP1 to inhibit auxin signaling in a transcription-independent manner whereas PEO-IAA competes with endogenous auxin and blocks the TIR1/AFB1 receptor in a transcription-dependent manner (Paponov et al., 2019). 5-F-IAA and ABP1 duplex-mediated inhibition of auxin signaling promotes the efflux of K+ ions and the influx of H+ ions making the cytoplasm acidic and the extracellular space alkaline. Such an environment instigates the events involved in the elicitor-induced biosynthesis of secondary metabolites (Ramirez-Estrada et al., 2016). However, intensive research focusing on the role of ion channels, plasma membrane phosphorylation, and acidification/alkalinization pattern of cytoplasm and extracellular space may provide further insights into the 5-F-IAA-induced accumulation of MIAs. Based on these results, it is recommended that higher concentrations than 200 µM of 5-F-IAA may be used to screen an optimal dose. Our results correspond to those of El-Sayed and Verpoorte (2007) wherein sub-culturing of the cells on an auxin-free medium enhanced the production of mRNA of the enzymes involved in alkaloid biosynthesis. Similarly, 2,4-D a synthetic analog of auxins strongly inhibited alkaloid biosynthesis during the growth phase of cell culture by reducing the activity of peroxidases vital to alkaloid biosynthesis. In a study, the substitution of 2,4-D with NAA in cell suspension cultures of Tribulus terrestris increased the concentration of steroidal glycosides (Tomilova et al., 2020). Likewise, in the current study, the concentration of MIAs produced in the callus induced by NAA was higher compared to that induced by 2,4-D (Supplementary Figure S3).
5 Conclusions
In the current study, we identified and characterized the NAC family in C. roseus. Furthermore, transcriptional and targeted metabolite profiling was carried out in elicited in-vitro cultures of C. roseus. An upregulation of stress-related CrNACs whereas the downregulation of growth-related CrNACs was observed under the same elicitation conditions. Based on these findings, it was concluded that NACs have their role in both growth and defense (plant secondary metabolite biosynthesis). The dual facet of NACs provides theoretical insights into the trade-off minimization between growth and defense. Owing to this property, NACs can be an ideal target for regulating growth and secondary metabolite production in medicinally important plants.
Data availability statement
The datasets presented in this study can be found in online repositories. The names of the repository/repositories and accession number(s) can be found in the article/Supplementary Material.
Author contributions
JA: Data curation, Formal analysis, Investigation, Methodology, Writing – original draft. YS: Data analysis, Software, Writing – review & editing. MKG and KEI: Funding acquisition, Visualization, Writing – review & editing. MH: Formal analysis, Software. SAK: Supervision, Technical support, Resources, Writing – review & editing. CS: Conceptualization, Methodology, Supervision, Resources, Validation, Visualization, Writing – review & editing. AMA: Technical support, Resources, Visualization, Funding acquisition, Writing – review & editing AH: Conceptualization, Methodology, Project administration, Resources, Supervision, Visualization, Writing – review & editing.
Funding
The author(s) declare financial support was received for the research, authorship, and/or publication of this article. The study was supported by the Commonwealth Scholarship Commission UK under Ph.D. split-site scholarship. All authors are grateful to Researchers Supporting Project number (RSP2023R393), King Saud University, Riyadh, Saudi Arabia for financial assistance to publish this research work.
Acknowledgments
A major part of the study was carried out at the Institute of Global Food Security, School of Biological Sciences, Queens University Belfast, UK under the supervision of CS. We are grateful to Dr. Fuquan Liu for providing space for setting up in vitro cultures in his laboratory. Equally, we are thankful to Dr. Nicholson, Dr. Brett Greer, and Yunhe Hong for providing technical support during LC-MS analyses. Finally, we are grateful to Qiqi He and Xiaoxuan Xia for their assistance during the whole experimental work.
Conflict of interest
The authors declare that the research was conducted in the absence of any commercial or financial relationships that could be construed as a potential conflict of interest.
Publisher’s note
All claims expressed in this article are solely those of the authors and do not necessarily represent those of their affiliated organizations, or those of the publisher, the editors and the reviewers. Any product that may be evaluated in this article, or claim that may be made by its manufacturer, is not guaranteed or endorsed by the publisher.
Supplementary material
The Supplementary Material for this article can be found online at: https://www.frontiersin.org/articles/10.3389/fpls.2023.1286584/full#supplementary-material
References
Amoo, S. O., van Staden, J. (2013). Influence of plant growth regulators on shoot proliferation and secondary metabolite production in micropropagated Huernia hystrix. Plant Cell Tissue Organ Cult 112, 249–256. doi: 10.1007/s11240-012-0230-x
Aslam, J., Khan, S. H., Siddiqui, Z. H., Fatima, Z., Maqsood, M., Bhat, M. A., et al. (2010). Catharanthus roseus (L.) G. Don. An important drug: it’s applications and production. Int. J. Compr. Pharm. 1, 1–16.
Bailey, T. L., Johnson, J., Grant, C. E., Noble, W. S. (2015). The MEME suite. Nucleic Acids Res. 43, W39–W49. doi: 10.1093/nar/gkv416
Bais, H. P., Sudha, G., George, J., Ravishankar, G. A. (2001). Influence of exogenous hormones on growth and secondary metabolite production in hairy root cultures of Cichorium intybus L. cv. Lucknow Local. In Vitro Cell. Dev. Biol. - Plant 37, 293–299. doi: 10.1007/s11627-001-0052-8
Bian, Z., Gao, H., Wang, C. (2021). NAC transcription factors as positive or negative regulators during ongoing battle between pathogens and our food crops. Int. J. Mol. Sci. 22, 1–21. doi: 10.3390/ijms22010081
Bu, Q., Jiang, H., Li, C. B., Zhai, Q., Zhang, J., Wu, X., et al. (2008). Role of the Arabidopsis thaliana NAC transcription factors ANAC019 and ANAC055 in regulating jasmonic acid-signaled defense responses. Cell Res. 18, 756–767. doi: 10.1038/cr.2008.53
Carqueijeiro, I., Dugé de Bernonville, T., Lanoue, A., Dang, T. T., Teijaro, C. N., Paetz, C., et al. (2018). A BAHD acyltransferase catalyzing 19-O-acetylation of tabersonine derivatives in roots of Catharanthus roseus enables combinatorial synthesis of monoterpene indole alkaloids. Plant J. 94, 469–484. doi: 10.1111/tpj.13868
Cenci, A., Guignon, V., Roux, N., Rouard, M. (2014). Genomic analysis of NAC transcription factors in banana (Musa acuminata) and definition of NAC orthologous groups for monocots and dicots. Plant Mol. Biol. 85, 63–80. doi: 10.1007/s11103-013-0169-2
Chagas, C. M., Alisaraie, L. (2019). Metabolites of vinca alkaloid vinblastine: tubulin binding and activation of nausea-associated receptors. ACS Omega 4, 9784–9799. doi: 10.1021/acsomega.9b00652
Chen, C., Chen, H., Zhang, Y., Thomas, H. R., Frank, M. H., He, Y., et al. (2020). TBtools: an integrative toolkit developed for interactive analyses of big biological data. Mol. Plant 13, 1194–1202. doi: 10.1016/j.molp.2020.06.009
Chi, S., Xie, W., Zhang, J., Xu, S. (2015). Theoretical insight into the structural mechanism for the binding of vinblastine with tubulin. J. Biomol Struct. Dyn 33, 2234–2254. doi: 10.1080/07391102.2014.999256
De Bernonville, D. T., Carqueijeiro, I., Lanoue, A., Lafontaine, F., Sánchez Bel, P., Liesecke, F., et al. (2017). Folivory elicits a strong defense reaction in Catharanthus roseus: Metabolomic and transcriptomic analyses reveal distinct local and systemic responses. Sci. Rep. 7, 1–14. doi: 10.1038/srep40453
De Clercq, I., Vermeirssen, V., Van Aken, O., Vandepoele, K., Murcha, M. W., Law, S. R., et al. (2013). The membrane-bound NAC transcription factor ANAC013 functions in mitochondrial retrograde regulation of the oxidative stress response in Arabidopsis. Plant Cell 25, 3472–3490. doi: 10.1105/tpc.113.117168
Efferth, T. (2019). Biotechnology applications of plant callus cultures. Engineering 5, 50–59. doi: 10.1016/j.eng.2018.11.006
El-Sayed, M., Verpoorte, R. (2007). Catharanthus terpenoid indole alkaloids: Biosynthesis and regulation. Phytochem. Rev. 6, 277–305. doi: 10.1007/s11101-006-9047-8
Fu, Y., Guo, H., Cheng, Z., Wang, R., Li, G., Huo, G., et al. (2013). NtNAC-R1, a novel NAC transcription factor gene in tobacco roots, responds tomechanical damage of shoot meristem. Plant Physiol. Biochem. 69, 74–81. doi: 10.1016/j.plaphy.2013.05.004
Gasteiger, E., Gattiker, A., Hoogland, C., Ivanyi, I., Appel, R. D., Bairoch, A. (2003). ExPASy: The proteomics server for in-depth protein knowledge and analysis. Nucleic Acids Res. 31, 3784–3788. doi: 10.1093/nar/gkg563
Golkar, P., Taghizadeh, M., Yousefian, Z. (2019). The effects of chitosan and salicylic acid on elicitation of secondary metabolites and antioxidant activity of safflower under in vitro salinity stress. Plant Cell Tissue Organ Cult 137, 575–585. doi: 10.1007/s11240-019-01592-9
Gong, L., Zhang, H., Liu, X., Gan, X., Nie, F., Yang, W., et al. (2020). Ectopic expression of HaNAC1, an ATAF transcription factor from Haloxylon ammodendron, improves growth and drought tolerance in transgenic Arabidopsis. Plant Physiol. Biochem. 151, 535–544. doi: 10.1016/j.plaphy.2020.04.008
Gupta, M. M., Singh, D. V., Tripathi, A. K., Pandey, R., Verma, R. K., Singh, S., et al. (2005). Simultaneous determination of vincristine, vinblastine, catharanthine, and vindoline in leaves of Catharanthus roseus by high-performance liquid chromatography. J. Chromatogr Sci. 43, 450–453. doi: 10.1093/chromsci/43.9.450
Hagel, J. M., Mandal, R., Han, B., Han, J., Dinsmore, D. R., Borchers, C. H., et al. (2015). Metabolome analysis of 20 taxonomically related benzylisoquinoline alkaloid-producing plants. BMC Plant Biol. 15, 1–17. doi: 10.1186/s12870-015-0594-2
Horton, P., Park, K. J., Obayashi, T., Fujita, N., Harada, H., Adams-Collier, C. J., et al. (2007). WoLF PSORT: Protein localization predictor. Nucleic Acids Res. 35, 585–587. doi: 10.1093/nar/gkm259
Hu, B., Jin, J., Guo, A. Y., Zhang, H., Luo, J., Gao, G. (2015). GSDS 2.0: An upgraded gene feature visualization server. Bioinformatics 31, 1296–1297. doi: 10.1093/bioinformatics/btu817
Hu, W., Wei, Y., Xia, Z., Yan, Y., Hou, X., Zou, M., et al. (2015). Genome-wide identification and expression analysis of the NAC transcription factor family in cassava. PloS One 10, 1–25. doi: 10.1371/journal.pone.0136993
Huot, B., Yao, J., Montgomery, B. L., He, S. Y. (2014). Growth-defense tradeoffs in plants: A balancing act to optimize fitness. Mol. Plant 7, 1267–1287. doi: 10.1093/mp/ssu049
Iglesias, M. J., Terrile, M. C., Casalongué, C. A. (2011). Auxin and salicylic acid signalings counteract during the adaptive response to stress. Plant Signal Behav. 6, 452–454. doi: 10.4161/psb.6.3.14676
Jensen, M. K., Kjaersgaard, T., Petersen, K., Skriver, K. (2010). NAC genes: Time-specific regulators of hormonal signaling in Arabidopsis. Plant Signal Behav. 5, 907–910. doi: 10.4161/psb.5.7.12099
Jiang, W., Zhou, S., Zhang, Q., Song, H., Zhou, D. X., Zhao, Y. (2017). Transcriptional regulatory network of WOX11 is involved in the control of crown root development, cytokinin signals, and redox in rice. J. Exp. Bot. 68, 2787–2798. doi: 10.1093/jxb/erx153
Kim, H. J., Nam, H. G., Lim, P. O. (2016). Regulatory network of NAC transcription factors in leaf senescence. Curr. Opin. Plant Biol. 33, 48–56. doi: 10.1016/j.pbi.2016.06.002
Kumar, S., Stecher, G., Li, M., Knyaz, C., Tamura, K. (2018). MEGA X: Molecular evolutionary genetics analysis across computing platforms. Mol. Biol. Evol. 35, 1547–1549. doi: 10.1093/molbev/msy096
Le, D. T., Nishiyama, R., Watanabe, Y., Mochida, K., Yamaguchi-Shinozaki, K., Shinozaki, K., et al. (2011). Genome-wide survey and expression analysis of the plant-specific NAC transcription factor family in soybean during development and dehydration stress. DNA Res. 18, 263–276. doi: 10.1093/dnares/dsr015
Lescot, M., Déhais, P., Thijs, G., Marchal, K., Moreau, Y., Van De Peer, Y., et al. (2002). PlantCARE, a database of plant cis-acting regulatory elements and a portal to tools for in silico analysis of promoter sequences. Nucleic Acids Res. 30, 325–327. doi: 10.1093/nar/30.1.325
Li, P., Peng, Z., Xu, P., Tang, G., Ma, C., Zhu, J., et al. (2021). Genome-wide identification of NAC transcription factors and their functional prediction of abiotic stress response in peanut. Front. Genet. 12. doi: 10.3389/fgene.2021.630292
Linh, T. M., Mai, N. C., Hoe, P. T., Ngoc, N. T., Thao, P. T. H., Ban, N. K., et al. (2021). Development of a cell suspension culture system for promoting alkaloid and vinca alkaloid biosynthesis using endophytic fungi isolated from local catharanthus roseus. Plants 10, 14. doi: 10.3390/plants10040672
Liu, J., Qiao, Y., Li, C., Hou, B. (2023). The NAC transcription factors play core roles in flowering and ripening fundamental to fruit yield and quality. Front. Plant Sci. 14. doi: 10.3389/fpls.2023.1095967
Liu, Y., Meng, Q., Duan, X., Zhang, Z., Li, D. (2017). Effects of PEG-induced drought stress on regulation of indole alkaloid biosynthesis in Catharanthus roseus. J. Plant Interact. 12, 87–91. doi: 10.1080/17429145.2017.1293852
Livak, K. J., Schmittgen, T. D. (2001). Analysis of relative gene expression data using real-time quantitative PCR and the 2-ΔΔCT method. Methods 25, 402–408. doi: 10.1006/meth.2001.1262
Lu, S., Wang, J., Chitsaz, F., Derbyshire, M. K., Geer, R. C., Gonzales, N. R., et al. (2020). CDD/SPARCLE: The conserved domain database in 2020. Nucleic Acids Res. 48, D265–D268. doi: 10.1093/nar/gkz991
Mahmood, K., Xu, Z., El-Kereamy, A., Casaretto, J. A., Rothstein, S. J. (2016). The arabidopsis transcription factor ANAC032 represses anthocyanin biosynthesis in response to high sucrose and oxidative and abiotic stresses. Front. Plant Sci. 7. doi: 10.3389/fpls.2016.01548
Matsuura, H. N., Rau, M. R., Fett-Neto, A. G. (2014). Oxidative stress and production of bioactive monoterpene indole alkaloids: Biotechnological implications. Biotechnol. Lett. 36, 191–200. doi: 10.1007/s10529-013-1348-6
Mekky, H., Al-Sabahi, J., Abdel-Kreem, M. F. M. (2018). Potentiating biosynthesis of the anticancer alkaloids vincristine and vinblastine in callus cultures of Catharanthus roseus. South Afr. J. Bot. 114, 29–31. doi: 10.1016/j.sajb.2017.10.008
Miettinen, K., Dong, L., Navrot, N., Schneider, T., Burlat, V., Pollier, J., et al. (2014). The seco-iridoid pathway from Catharanthus roseus. Nat. Commun. 5, 10. doi: 10.1038/ncomms4606
Ming, Q., Su, C., Zheng, C., Jia, M., Zhang, Q., Zhang, H., et al. (2013). Elicitors from the endophytic fungus Trichoderma atroviride promote Salvia miltiorrhiza hairy root growth and tanshinone biosynthesis. J. Exp. Bot. 64, 5687–5694. doi: 10.1093/jxb/ert342
Murthy, H. N., Lee, E. J., Paek, K. Y. (2014). Production of secondary metabolites from cell and organ cultures: Strategies and approaches for biomass improvement and metabolite accumulation. Plant Cell Tissue Organ Cult 118, 1–16. doi: 10.1007/s11240-014-0467-7
Mustafa, N. R., De Winter, W., Van Iren, F., Verpoorte, R. (2011). Initiation, growth and cryopreservation of plant cell suspension cultures. Nat. Protoc. 6, 715–742. doi: 10.1038/nprot.2010.144
Paponov, I. A., Dindas, J., Król, E., Friz, T., Budnyk, V., Teale, W., et al. (2019). Auxin-induced plasma membrane depolarization is regulated by AUXIN transport and not by AUXIN BINDING PROTEIN1. Front. Plant Sci. 9. doi: 10.3389/fpls.2018.01953
Qu, Y., Easson, M. L. A. E., Froese, J., Simionescu, R., Hudlicky, T., DeLuca, V. (2015). Completion of the seven-step pathway from tabersonine to the anticancer drug precursor vindoline and its assembly in yeast. Proc. Natl. Acad. Sci. U.S.A. 112, 6224–6229. doi: 10.1073/pnas.1501821112
Ramirez-Estrada, K., Vidal-Limon, H., Hidalgo, D., Moyano, E., Golenioswki, M., Cusidó, R. M., et al. (2016). Elicitation, an effective strategy for the biotechnological production of bioactive high-added value compounds in plant cell factories. Molecules 21, 24. doi: 10.3390/molecules21020182
Sabater-Jara, A. B., Onrubia, M., Moyano, E., Bonfill, M., Palazón, J., Pedreño, M. A., et al. (2014). Synergistic effect of cyclodextrins and methyl jasmonate on taxane production in Taxus x media cell cultures. Plant Biotechnol. J. 12, 1075–1084. doi: 10.1111/pbi.12214
Schultz, J., Milpetz, F., Bork, P., Ponting, C. P. (1998). SMART, a simple modular architecture research tool: Identification of signaling domains. Proc. Natl. Acad. Sci. U.S.A. 95, 5857–5864. doi: 10.1073/pnas.95.11.5857
Shannon, P., Markiel, A., Ozier, O., Baliga, N. S., Wang, J. T., Ramage, D., et al. (2003). Cytoscape: A software environment for integrated models. Genome Res. 13, 426. doi: 10.1101/gr.1239303.metabolite. 山本隆久.
Sun, Q., Jiang, S., Zhang, T., Xu, H., Fang, H., Zhang, J., et al. (2019). Apple NAC transcription factor MdNAC52 regulates biosynthesis of anthocyanin and proanthocyanidin through MdMYB9 and MdMYB11. Plant Sci. 289, 110286. doi: 10.1016/j.plantsci.2019.110286
Takada, S., Hibara, K. I., Ishida, T., Tasaka, M. (2001). The CUP-SHAPED COTYLEDON1 gene of Arabidopsis regulates shoot apical meristem formation. Development 128, 1127–1135. doi: 10.1242/dev.128.7.1127
Tomilova, S. V., Khandy, M. T., Kochkin, D. V., Galishev, B. A., Klyushin, A. G., Nosov, A. M. (2020). Effect of synthetic auxin analogs (2.4-D and α-NAA) on growth and biosynthetic characteristics of suspension cell culture of tribulus terrestris L. Russian J. Plant Physiol. 67, 636–645. doi: 10.1134/S1021443720040172
Van Moerkercke, A., Fabris, M., Pollier, J., Baart, G. J., Rombauts, S., Hasnain, G., Goossens, A, et al (2013). CathaCyc, a metabolic pathway database built from Catharanthus roseus RNA-Seq data. Plant and Cell Physiology 54 (5), 673–685
Vidal-Limon, H. R., Almagro, L., Moyano, E., Palazon, J., Pedreño, M. A., Cusido, R. M. (2018). Perfluorodecalins and hexenol as inducers of secondary metabolism in taxus media and vitis vinifera cell cultures. Front. Plant Sci. 9. doi: 10.3389/fpls.2018.00335
Wang, D., Pajerowska-Mukhtar, K., Culler, A. H., Dong, X. (2007). Salicylic acid inhibits pathogen growth in plants through repression of the auxin signaling pathway. Curr. Biol. 17, 1784–1790. doi: 10.1016/j.cub.2007.09.025
Wang, D., Yu, Y., Liu, Z., Li, S., Wang, Z., Xiang, F. (2016). Membrane-bound NAC transcription factors in maize and their contribution to the oxidative stress response. Plant Sci. 250, 30–39. doi: 10.1016/j.plantsci.2016.05.019
Wang, G. L., An, Y. H., Zhou, C. L., Hu, Z. Z., Ren, X. Q., Xiong, A. S. (2022). Transcriptome-wide identification of NAC (no apical meristem/Arabidopsis transcription activation factor/cup-shaped cotyledon) transcription factors potentially involved in salt stress response in garlic. PeerJ 10, 18. doi: 10.7717/peerj.14602
Wang, Y., Tang, H., Debarry, J. D., Tan, X., Li, J., Wang, X., et al. (2012). MCScanX: A toolkit for detection and evolutionary analysis of gene synteny and collinearity. Nucleic Acids Res. 40, 1–14. doi: 10.1093/nar/gkr1293
Wang, Z., Xia, Y., Lin, S., Wang, Y., Guo, B., Song, X., et al. (2018). Osa-miR164a targets OsNAC60 and negatively regulates rice immunity against the blast fungus Magnaporthe oryzae. Plant J. 95, 584–597. doi: 10.1111/tpj.13972
Wang, Z., Zhang, Z., Wang, P., Qin, C., He, L., Kong, L., et al. (2023). Genome-wide identification of the NAC transcription factors family and regulation of metabolites under salt stress in Isatis indigotica. Int. J. Biol. Macromol 240, 124436. doi: 10.1016/j.ijbiomac.2023.124436
Keywords: elicitation, cell suspension culture, nodal culture, vinblastine, catharanthine, vindoline, auxin
Citation: Ahmed J, Sajjad Y, Gatasheh MK, Ibrahim KE, Huzafa M, Khan SA, Situ C, Abbasi AM and Hassan A (2023) Genome-wide identification of NAC transcription factors and regulation of monoterpenoid indole alkaloid biosynthesis in Catharanthus roseus. Front. Plant Sci. 14:1286584. doi: 10.3389/fpls.2023.1286584
Received: 31 August 2023; Accepted: 01 December 2023;
Published: 20 December 2023.
Edited by:
Sumit G. Gandhi, Indian Institute of Integrative Medicine (CSIR), IndiaReviewed by:
Sajad Ahmed, Indian Institute of Integrative Medicine (CSIR), IndiaSmita Srivastava, Indian Institute of Technology Madras, India
Copyright © 2023 Ahmed, Sajjad, Gatasheh, Ibrahim, Huzafa, Khan, Situ, Abbasi and Hassan. This is an open-access article distributed under the terms of the Creative Commons Attribution License (CC BY). The use, distribution or reproduction in other forums is permitted, provided the original author(s) and the copyright owner(s) are credited and that the original publication in this journal is cited, in accordance with accepted academic practice. No use, distribution or reproduction is permitted which does not comply with these terms.
*Correspondence: Chen Situ, Yy5zaXR1QHF1Yi5hYy51aw==; Amjad Hassan, YW1qYWRoYXNzYW5AY3VpYXRkLmVkdS5waw==; Arshad Mehmood Abbasi, YW1hYmJhc2lAY3VpYXRkLmVkdS5waw==