 Heather K. Tuttle
 Alfonso H. Del Rio
 John B. Bamberg
 Laura M. Shannon
- 1Department of Horticultural Science, University of Minnesota, St. Paul, MN, United States
- 2U.S. Department of Agriculture (USDA)/Agricultural Research Service, Potato Genebank, Sturgeon Bay, WI, United States
Cultivated potatoes are incredibly diverse, ranging from diploid to pentaploid and encompass four different species. They are adapted to disparate environments and conditions and carry unique alleles for resistance to pests and pathogens. Describing how diversity is partitioned within and among these populations is essential to understanding the potato genome and effectively utilizing landraces in breeding. This task is complicated by the difficulty of making comparisons across cytotypes and extensive admixture within section petota. We genotyped 730 accessions from the US Potato genebank including wild diploids and cultivated diploids and tetraploids using Genotype-by-sequencing. This data set allowed us to interrogate population structure and diversity as well as generate core subsets which will support breeders in efficiently screening genebank material for biotic and abiotic stress resistance alleles. We found that even controlling for ploidy, tetraploid material exhibited higher observed and expected heterozygosity than diploid accessions. In particular group chilotanum material was the most heterozygous and the only taxa not to exhibit any inbreeding. This may in part be because group chilotanum has a history of introgression not just from wild species, but landraces as well. All group chilotanum, exhibits introgression from group andigenum except clones from Southern South America near its origin, where the two groups are not highly differentiated. Moving north, we do not observe evidence for the same level of admixture back into group andigenum. This suggests that extensive history of admixture is a particular characteristic of chilotanum.
1 Introduction
Potato is the third most important global food crop (FAO, 2019), because it is widely adapted and has a high nutrient to price ratio (Drewnowski and Rehm, 2013). It is unequivocally one of the most complete foods, containing significant dietary fiber, protein, vitamin C, B6, potassium, magnesium, iron and phytonutrients (King and Slavin, 2013; McGill et al., 2013; Brown et al., 1993; Liu, 2013; Beals, 2019; Navarre et al., 2019). Furthermore, potato grows well in harsh environments on six continents. It produces more calories and protein per unit land or water than any other staple crop (Renault and Wallender, 2000). Both India and China have undertaken national efforts to increase potato production as a way to support growing populations (FAO, 2019). As global populations expand and the climate changes, our reliance on potatoes will increase and breeders will need to develop varieties that can adapt to new environments.
Despite the agricultural and nutritional importance of potato, adoption of new potato varieties is slow and the most commonly grown potato variety in the US was developed over a century ago (Douches et al., 1996). Breeders need tools to facilitate the development of new varieties with increased biotic and abiotic stress resistance. The most effective tool for introducing new resistance alleles into potato is introgression from landraces and crop wild relatives (Jansky et al., 2013).
The USDA potato genebank in Sturgeon Bay WI is the most accessible repository of this germplasm for US breeders. Screening the genebank collection has identified new resistance alleles for pests and pathogens such as late blight (Karki et al., 2021), zebra chip (Mora et al., 2022), and Colorado potato beetle (Jansky et al., 2009). However, the genebank contains almost 2,000 accessions of cultivated potato and screening all of them is prohibitively difficult. Therefore, the first step to identifying valuable alleles within the collection is assembling the right screening panel. Building core collections within the genebank facilitates this process.
Core collections are an essential tool for empowering efficient screening of genebank material for use in breeding (Haupt and Schmid, 2020; Sokolkova et al., 2020; Phogat et al., 2021; Mufumbo et al., 2023; Santos et al., 2023; Shigita et al., 2023). The goal is to maximize the number of alleles evaluated while minimizing the number of individuals that must be screened. Such collections have been developed for a wide variety of crops using both morphological (Phogat et al., 2021; Santos et al., 2023) and genetic (Haupt and Schmid, 2020; Mufumbo et al., 2023; Shigita et al., 2023) data. While core subsets based on morphology and traits emphasized by breeders have advantages for use in prediction (Corak et al., 2019), they rely on the curators to foresee the total set of potentially relevant traits. New pathogens are continually arising (Duellman et al., 2020; Willbur et al., 2023) and mutating (Tran et al., 2022). Core subsets based on neutral markers maximize total diversity represented, even if the functionality of that diversity is not immediately obvious. Furthermore, genotyping gene bank collections with neutral markers provides insight into diversity and relatedness of the collected species.
The US potato genebank houses four core collections of wild potato species, S. jamesii (Bamberg et al., 2016), S. fendleri (Bamberg et al., 2016), S. microdontum (Bamberg and del Rio, 2014), and S. demissum (del Rio and Bamberg, 2020), and one core collection of diploid cultivated S. chilotanum group phureja (del Rio and Bamberg, 2021). Each of these were developed using AFLPs and validated with phenotyping data. However, individual taxa only represent a fraction of potato as a whole. Section petota includes four cultivated species and 107 wild relatives, ranging from diploid to hexaploid (Spooner et al., 2007, 2014).
Understanding how diversity is partitioned within and among these cultivated taxa facilitates their use in breeding. The history of potato, is complex. Cultivated potatoes were domesticated at least once from S. candolleanum (2n=2x=24) in the Andes near Southern Peru and Northern Bolivia more than 10,000 years ago (Camire et al, 2009). Potatoes were later cultivated in the highland equatorial conditions of Colombia and Venezuela as well as long day conditions in Chile and southern Argentina. Autopolyploidization of early landrace species, S. tuberosum groups stenotomum and phureja gave rise to S. tuberosum group andigenum (2n=4x=48) (Grun, 1990; Hawkes, 1990; Sukhotu and Hosaka, 2006). Later migration to coastal Chile led to the long-day adapted S. tuberosum group chilotanum (2n=4x=48) which is purported to have contributed most of the genetic background of S. tuberosum cultivars outside South America (King and Slavin, 2013). Understanding how diversity is partitioned within and among these taxa is essential to understanding potato’s history and guiding its future.
By all estimates, potato is highly heterozygous (Hardigan et al., 2017; Hoopes et al., 2022). However, descriptions of comparative levels of diversity between populations differ, in part because disparate ploidy levels complicate comparison. While tetraploid cultivated potatoes have higher heterozygosity and nucleotide diversity than diploid wild potatoes by some calculations (Hardigan et al., 2017), that relationship is reversed if SNPs are called more stringently (Huang et al., 2018) or if diploid cultivated potatoes are considered instead of tetraploid ones (Li et al., 2018). Across species, polyploids are generally more heterozygous than diploids due to the increase in number of alleles per locus (Meirmans et al., 2018). Therefore, fair comparison across cytotype requires correction for ploidy. When corrections are not made, the diversity in wild and cultivated diploid potato is under estimated (Bamberg and del Rio, 2020).
Another factor which complicates our understanding of how diversity is partitioned in potato, is the porous boundaries within section petota. While membership in petota is stable, relationships between taxa within the section are not (Gagnon et al., 2022). Taxonomy within section petota is made difficult by morphological similarity, phenotypic plasticity, allele loss, a mixture of sexual and asexual reproduction, recent species divergence, polyploidy, introgression, and multiple hybrid origin (Spooner and van den Berg, 1992; Spooner, 2009; Ames and Spooner, 2010; Cai et al., 2012; Huang et al, 2019; Zhou et al., 2020). There is extensive evidence for both hybridization in wild species (Hawkes, 1969; Ugent, 1970; Hawkes, 1990; Spooner et al., 2007; Tang et al., 2022) and for wild species introgression into cultivated US and European potato continually since domestication (Hardigan et al., 2017; Hoopes et al., 2022; Meng et al., 2022). The genebank collection provides the opportunity to investigate the extent to which the landraces exhibit the same history of admixture as wild and US/European improved potatoes.
In this study, 730 accessions of diploid wild and diploid and tetraploid cultivated individuals were genotyped using a genotyping-by-sequencing (GBS) approach (Elshire et al., 2011). We interrogated this data set to address three questions. (1) How is diversity, both individual heterozygosity and population level allelic diversity, structured within cultivated potato? (2) Does the pattern of admixture observed in wild and commercial potato also describe the land race taxa? and (3) What is the ideal composition of core subsets for screening this portion of the genebank collection?
2 Materials and methods
2.1 Plant materials and sequencing
The US potato genebank in Sturgeon Bay, Wisconsin holds 1,445 accessions of cultivated potato. This assemblage represents years of collections in fields and markets some from planned collecting trips and some incidental, as well as contributions from researchers. We genotyped a subset of the collection, chosen with an eye to maximizing phenotypic diversity, containing 730 diploid, tetraploid and pentaploid accessions (Supplementary Table S1), using genotyping-by-sequencing (GBS) (Elshire et al., 2011) with the EcoT22 enzyme and phased adapters on the Illumina HiSeq platform at the University of Minnesota Genomics Center. According to passport data these 730 accessions consisted of 72 diploids including: S. juzepczukii (6), S. berthaultii (1), S. brevicaule (1), S. ajanhuiri (3), S. phureja (27), S. stenotomum (11), S. boliviense (20) and S. tuberosum group chilotanum (3). The 641 tetraploid accessions included: group andigenum (301), group chilotanum (333), S. juzepczukii (4), S. phureja (1) and S. ajanhuiri (2). Group andigenum accessions were primarily South American, coming from Peru, Bolivia, Colombia, Ecuador, Chile, Argentina, Uruguay, Venezuela and Brazil. Group chilotanum included accessions from North America, South America, Central America, Europe, Asia, Russia and Africa. Pentaploid accessions consisted of 14 S. curtilobum with two samples of group chilotanum. Triploids were not included in the genotyping panel. There was one accession for which the passport data did not include: taxa, clone name, or ploidy.
Some individuals, in particular those from group chilotanum in North America and Europe are named cultivars. These individuals are highly selected. The land race individuals including S. juzepczukii, S. ajanhuiri, S. phureja, S. stenotomum, and many of the S. tuberousum individuals from South America are random seedlings selected from genebank populations maintained as true seed. The wild individuals, most notably S. boliviense, are from a single wild population. Since we are only comparing genome wide patterns of diversity, rather than functional alleles, and we expect those to be similar in selected clones (ie cultivars) and individuals arising in crosses made from selections (ie the landrace populations), we can make comparisons across cultivated populations. However, since the S. boliviense is from a single population it is included only when an outgroup is needed for analysis. S. boliviense is removed from other analyses to avoid making unfair comparisons between representatives of a species as a whole and representatives of a single population (Bamberg and del Rio, 2020). Similarly, all taxa with only one representative were removed.
2.2 Sequence read alignment and variant calling
Reads were checked for quality with FASTQC 0.11.5 (Andrews, 2010) and adapters were removed with Cutadapt version 1.18 (Martin, 2011). Each sample was aligned to the Phureja DM v4.04 reference genome (Hardigan et al., 2016) with Bowtie 2 version 2.2.4 (Langmead and Salzberg, 2012) using Phred +33 encoding. We used Samtools version 1.9 (Danecek et al., 2021) to create bam files and report the number of mapped reads. Samples with less than 150,000 mapped reads were removed (Supplementary Table S2). Since we wanted to make comparisons of diversity within and among ploidy levels, we created three separate panels for our analyses; diploid, tetraploid and a third, combined panel (Table 1). SNP genotypes were called twice, once before ploidy correction and again after ploidy correction. All steps prior to ploidy correction were based on the combined panel. Once ploidy estimation by computational methods either confirmed or rejected the original ploidy calls, samples were removed or added to the panels and genotypes for single ploidy panels were called once again. BCFtools version 1.10.2 and samtools mpileup version (Danecek et al., 2021) were used to generate genotype likelihoods, call SNPs using the multiallelic caller and remove indels. Filtering thresholds appropriate for each panel were used (Table 2). VCFtools version 0.1.16 (Danecek et al., 2011) was used to remove unmapped reads, filter SNPs and extract biallelic SNPs at sites with no more than 40% missing data.
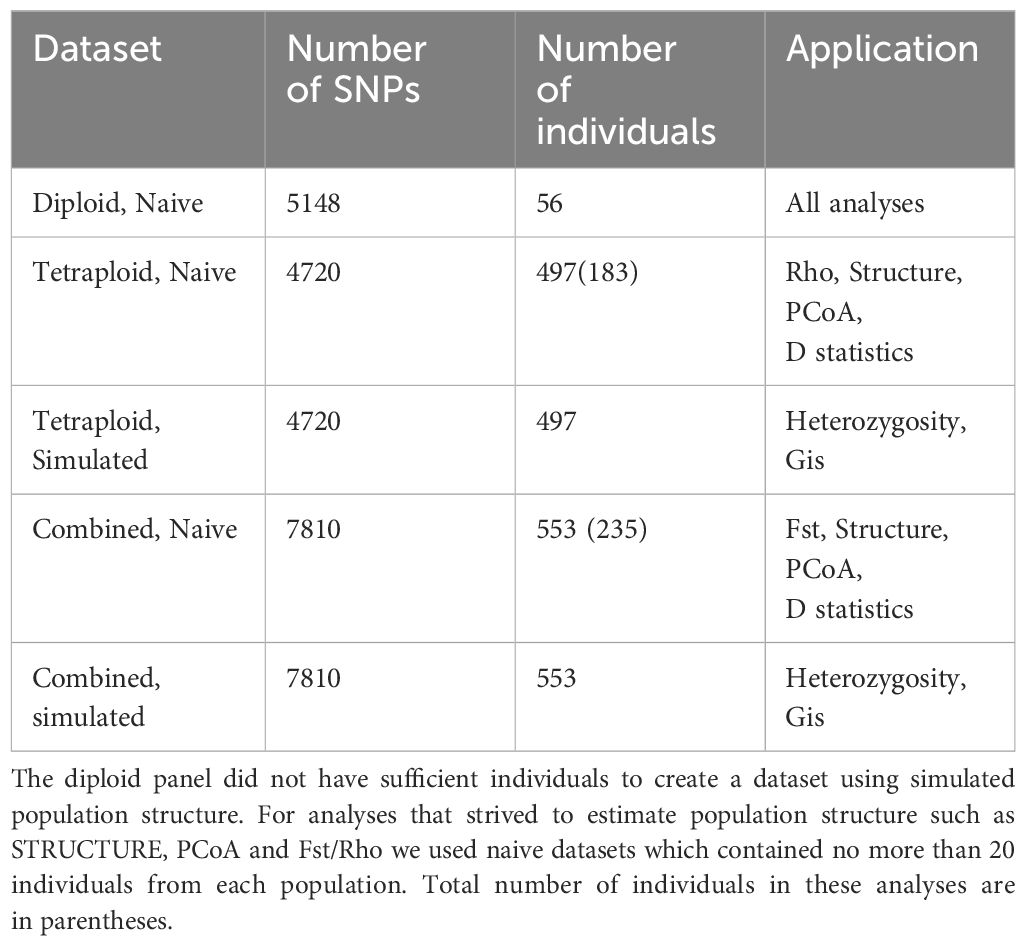
Table 1 Datasets used for analysis.
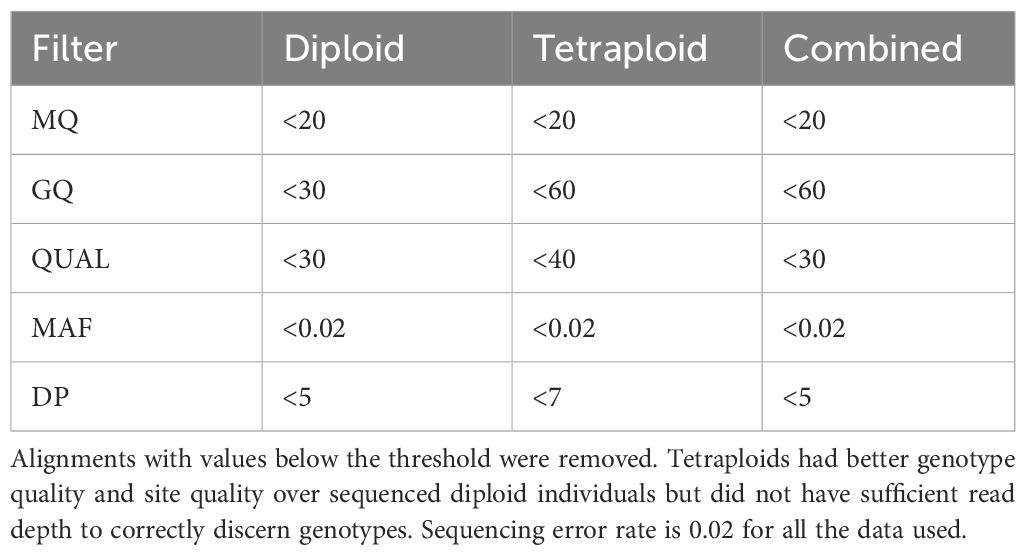
Table 2 Filtering thresholds for each panel.
Over 60X coverage is required to definitively distinguish between heterozygous classes in tetraploids (Uitdewilligen et al., 2015). Few markers in the tetraploid panel met this requirement. Therefore, we used PolyRAD (Clark et al., 2019) to re-call the most probable genotypes in panels containing tetraploid individuals. VCFs for the tetraploid and combined panel were read into the R (v4.2.1; R Core Team, 2021) environment using VCF2RADdata, only retaining variants that were called in at least 109 individuals (~20% of the population) and where the minor allele was in a minimum of 2 individuals. Variants in the diploid panel were only retained if they were present in at least 10 individuals (~20% of the population) with the minor allele present in at least 2 individuals. To filter loci in the combined panel, we separated individuals by ploidy and removed markers with a Hind/He less than 0.5 and greater than 0.75 for diploids and tetraploids, respectively. Genotypes were re-called by simulating population structure with individuals assigned to groups based on PCA. We created an additional dataset for each of the three panels that used a naïve model to call genotypes so as not to bias our population structure estimates for a total of six data sets (Table 1). After re-calling genotypes, loci with more than 10% missing data were removed and remaining missing data was filled in based on overall allele frequencies. For the combined panel and the tetraploid panel, dosage of polyploids was restored in Genodive version 3.0 (Meirmans, 2020) with resampled alleles.
2.3 Ploidy estimation
For multiple accessions in the data set, the passport data indicated a ploidy that conflicted with the known ploidy for the assigned taxa. The ploidy included in the passport data was determined using root tip squashes upon the addition of accessions to the genebank (Ordoñez et al., 2017). In order to confirm passport data, we estimated ploidy for each accession using two methods. First, histograms of allele frequencies across all markers were plotted for each individual to observe the number of peaks (Ellis et al., 2018). There are n+1 genotypic classes at ploidy n, therefore the ploidy level is equal to the number of histogram peaks minus one. We also ran GBS2ploidy with three settings (diploid vs. tetraploid, diploid vs. triploid vs. tetraploid, and diploid vs. triploid vs. tetraploid vs. pentaploid) (Gompert and Mock, 2017). Posterior estimates of allelic proportions were estimated with mcmc.nchain =2, mcmc.step = 10,000, and mcmc.burnin = 1000 and mcmc.thin = 2. After estimating allelic proportions, we performed ploidy estimations on the three datasets. We retained samples for which both methods of ploidy estimation confirmed the passport data.
2.4 Genetic diversity
With the goal of elucidating how diversity is distributed, we divided the panels into populations based on geography, species, and ploidy level. Countries were grouped together in an attempt to form reasonably sized populations. S. phureja, S. boliviense, and S. stenotomum, were each treated as a single taxa-based population. group chilotanum was further divided into geographic populations: Europe, US/Canada, Mexico/Guatemala, Brazil/Ecuador/Colombia, Peru, Bolivia/Argentina/Uruguay, and Chile. Similarly, group andigenum was subdivided by geography: Colombia/Venezuela, Ecuador, Peru, Bolivia, and Argentina/Chile. Location, reflects the best information we have based on collection site or breeder location, but may not reflect original geography of the clone. Species level diversity statistics such as expected heterozygosity (HS), observed heterozygosity (HO) and an inbreeding coefficient (GIS) that is analogous to FIS, were calculated in GenoDive (Meirmans, 2020) with the panels where genotypes were called taking population structure into account. All panels were bootstrapped ten times to obtain 95% confidence intervals.
2.5 Population structure
We quantified differentiation within and across ploidy, species, and geographic region using FST and rho (⍴) (Ronfort et al., 1998; Meirmans et al., 2018) calculated in GenoDive (Meirmans, 2020). We used ⍴ for the single ploidy panels and FST for the combined ploidy panel. Differentiation statistics are sensitive to sample size imbalance; therefore, we subsampled each population to retain no more than 20 individuals. Each population was resampled ten times and bootstrapped to determine 95% confidence intervals.
In order to visualize patterns of admixture between populations we used STRUCTURE (Pritchard et al., 2000). For all three panels, we used an admixture model that infers alpha with a 10,000 burn-in period and 10,000 MCMC replications. Lambda was set to 1.0. Priors used to parameterize the assumed probability models were set to default. This process was repeated for values of k between 1 and 6 for naive forms of the diploid, tetraploid and combined datasets. Because STRUCTURE does not handle multiple cytotypes, the naive combined panel was diploidized before analysis (Meirmans et al., 2018). We also used principal coordinate analysis (PCoA) within GenoDive (Meirmans, 2020). All results were plotted and visualized using the ggplot2 package version 3.4.1 (Wickham, 2011) in the R statistical environment version 4.2.1 (R Core Team, 2021).
Formal tests of admixture between individual populations were performed using Dsuite Dtrios (Malinsky et al., 2021) to calculate Patterson’s D (ABBA/BABA) statistics. Using all individuals in the naive combined panel, we first looked for possible admixture between each subpopulation of S. tuberosum group chilotanum and S. tuberosum group andigenum (tetraploid group andigenum, S. phureja, and S. stenotomum). We then examined admixture between each subpopulation of S. tuberosum group andigenum and S. tuberosum group chilotanum. S. boliviense was used as an outgroup and a jackknife block size of 150 was used to account for linkage. P-values were corrected for multiple comparisons using false discovery rate (FDR). Statistics were visualized in the R environment.
2.6 Core subset selection
In the interest of identifying core subsets, we used two software programs with different core collection algorithms. CoreHunter 3 (De Beukelaer et al., 2018) and GenoCore (Jeong et al., 2017) were used to generate core subsets for each panel using an allele coverage metric (CV) which maximizes the proportion of the total alleles observed in a subset. For each panel, multiple core sizes were created and evaluated for their ability to capture marker diversity.
3 Results
3.1 Alignment and ploidy estimation
After aligning all 730 individuals to the V4.04 phureja DM reference genome, 29 individuals were removed due to insufficient mapped reads (Supplementary Table S2). Examination of allelic ratios and heterozygosity confirmed the passport ploidy data of 613 of the 701 remaining accessions (Supplementary Tables S3, S4). Of these 613 accessions, there were 553 tetraploids including group chilotanum (303) and group andigenum (247). The final data set contained 54 diploid individuals including S. stenotomum (9), S. boliviense (20), and S. phureja (25) All putative pentaploid individuals were removed because we were unable to confirm the ploidy computationally.
3.2 Genotype calling and variant filtration
Genotypes were called separately for each panel, using methods and filtering thresholds applicable to the ploidy and panel size (Table 2). After initial filtering, we identified 7,296 SNPs in the diploid panel with an average of 26% missingness per site and 6.78x average read depth. Subsequent filtering in polyRAD and GenoDive left the diploid panel with 5,135 SNPs. The tetraploid panel contained 5,742 SNPs with an average of 26% missingness per site, 8.03x average site read depth and after additional filtering 4,720 SNPs were retained. The combined panel contained 9,668 SNPs after initial calling and filtering of genotypes with an average of 22% site missingness and 6.8x average read depth. Additional filtering left the combined panel with 7,851 SNPs. The Hind/He filter in PolyRad is intended to remove paralogs and none of the fixed heterozygous loci observed in other potato GBS panels (Bamberg et al., 2021) remained after filtering. A total of 1,264 SNPs were shared between diploid, tetraploid and combined datasets (Supplementary Figure S1).
3.3 Estimates of genetic diversity and inbreeding
By most measures, tetraploids had higher heterozygosity (HO = 0.190, HS = 0.239) than diploids (HO = 0.112, HS = 0.140) even when using methods that account for ploidy (Figure 1A, Supplementary Table S3). Group chilotanum was the most heterozygous, followed by tetraploid group andigenum, and the cultivated diploids. Using SNP panels derived from only a single ploidy all levels of heterozygosity were higher, as expected, but the relative levels of heterozygosity between populations were consistent. While tetraploid populations exhibited few private alleles (1 in Europe and 1 in Peruvian andigenum), all diploid populations did, with S. bolivense having 1,929 private alleles, more than four times the next highest population (Supplementary Figure S2).
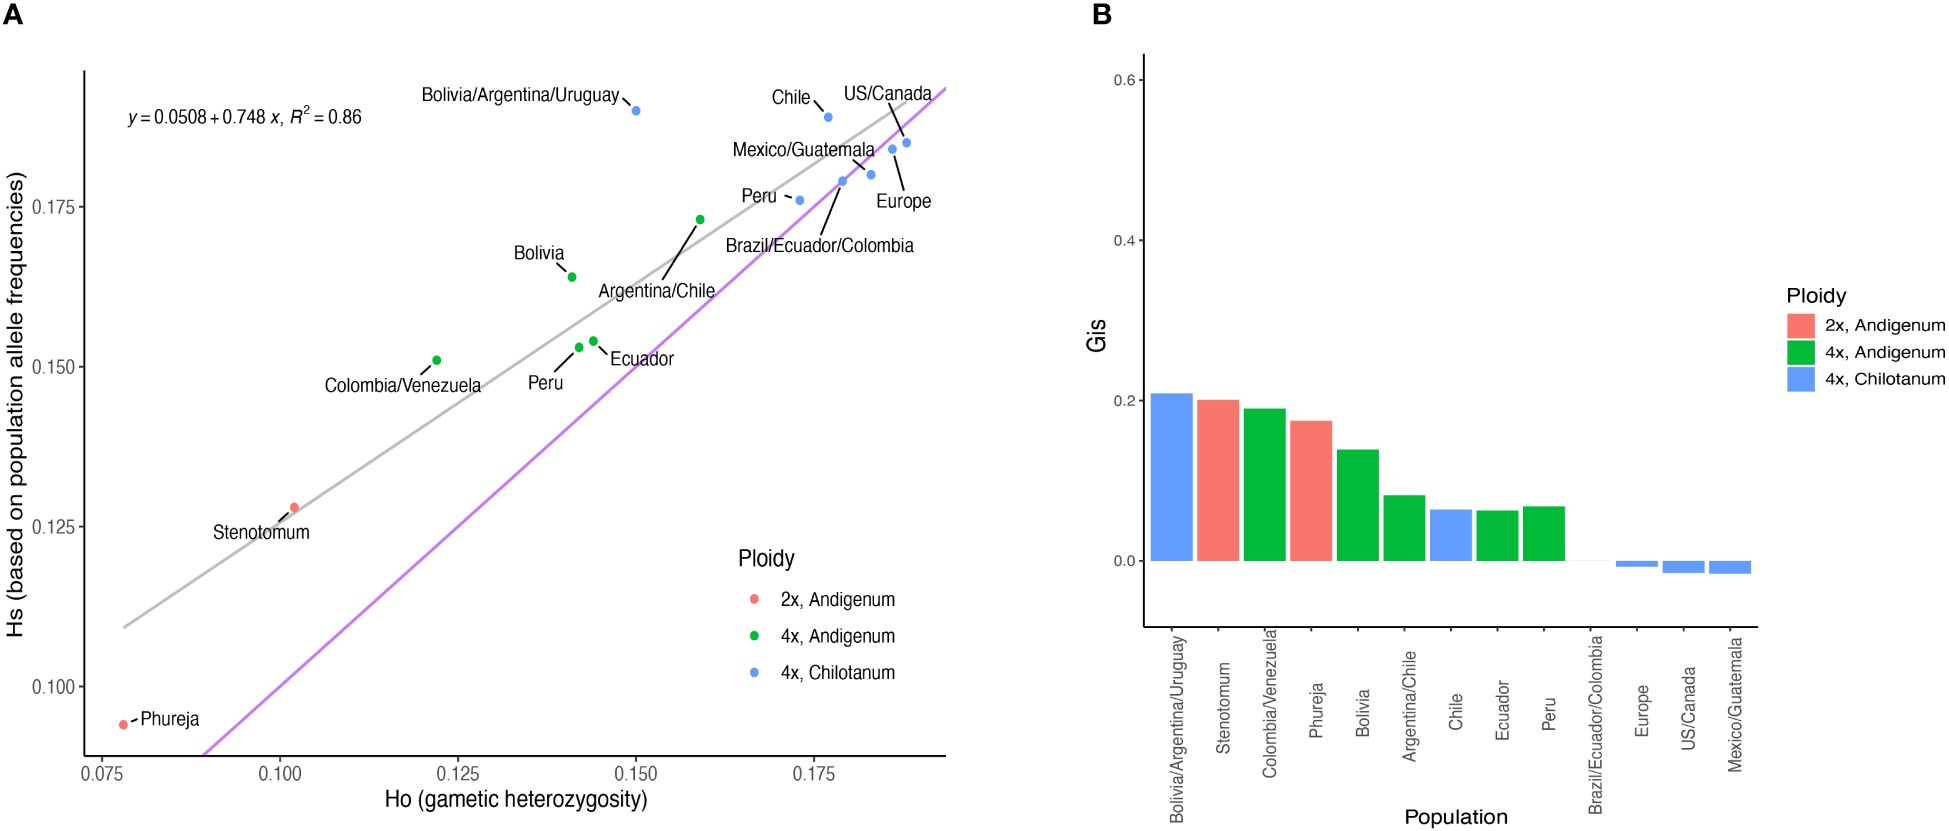
Figure 1 Diversity statistics from the combined panel. (A) Expected heterozygosity versus observed heterozygosity. The gray line is a fitted regression line with the equation given. The blue line indicates equal values for observed and expected heterozygosity. (B) Inbreeding coefficients for each population. Numeric values can be found in Supplementary Table S3.
All populations except Northern group chilotanum exhibit some degree of inbreeding (Figure 1B). With the exception of the populations from Bolivia, Argentina, and Uruguay (GIS = 0.209), group chilotanum populations exhibited the lowest in breeding overall (GIS = 0 – 0.064) and diploid populations the highest (GIS = 0.175 – 0.201).
3.4 Population structure and admixture
Based on FST there is little differentiation among tetraploids, with group chilotanum from the US and Canada and group andigenum from Peru exhibiting the most differentiation (FST = 0.109) (Figure 2, Supplementary Table S5). When using the tetraploid SNP panel to calculate ⍴ (rho), a more complicated pattern emerges (Figure 3, Supplementary Table 6). Northern group chilotanum (US, Canada, Mexico, Guatemala, and Europe) is distinct from group andigenum (⍴ = 0.14 – 0.236) and the group chilotanum material from Bolivia, Uruguay, and Argentina (⍴ = 0.144 – 0.181). Group chilotanum samples from Peru, Brazil, Ecuador, and Colombia were not differentiated from any of the tetraploid material. Subspecies pairs from similar geographic areas tended to have low ⍴-values, specifically the Bolivian pair (⍴ = 0.067), the Chilean pair (⍴ = 0.093), and the Colombian pair (⍴ = 0.066).
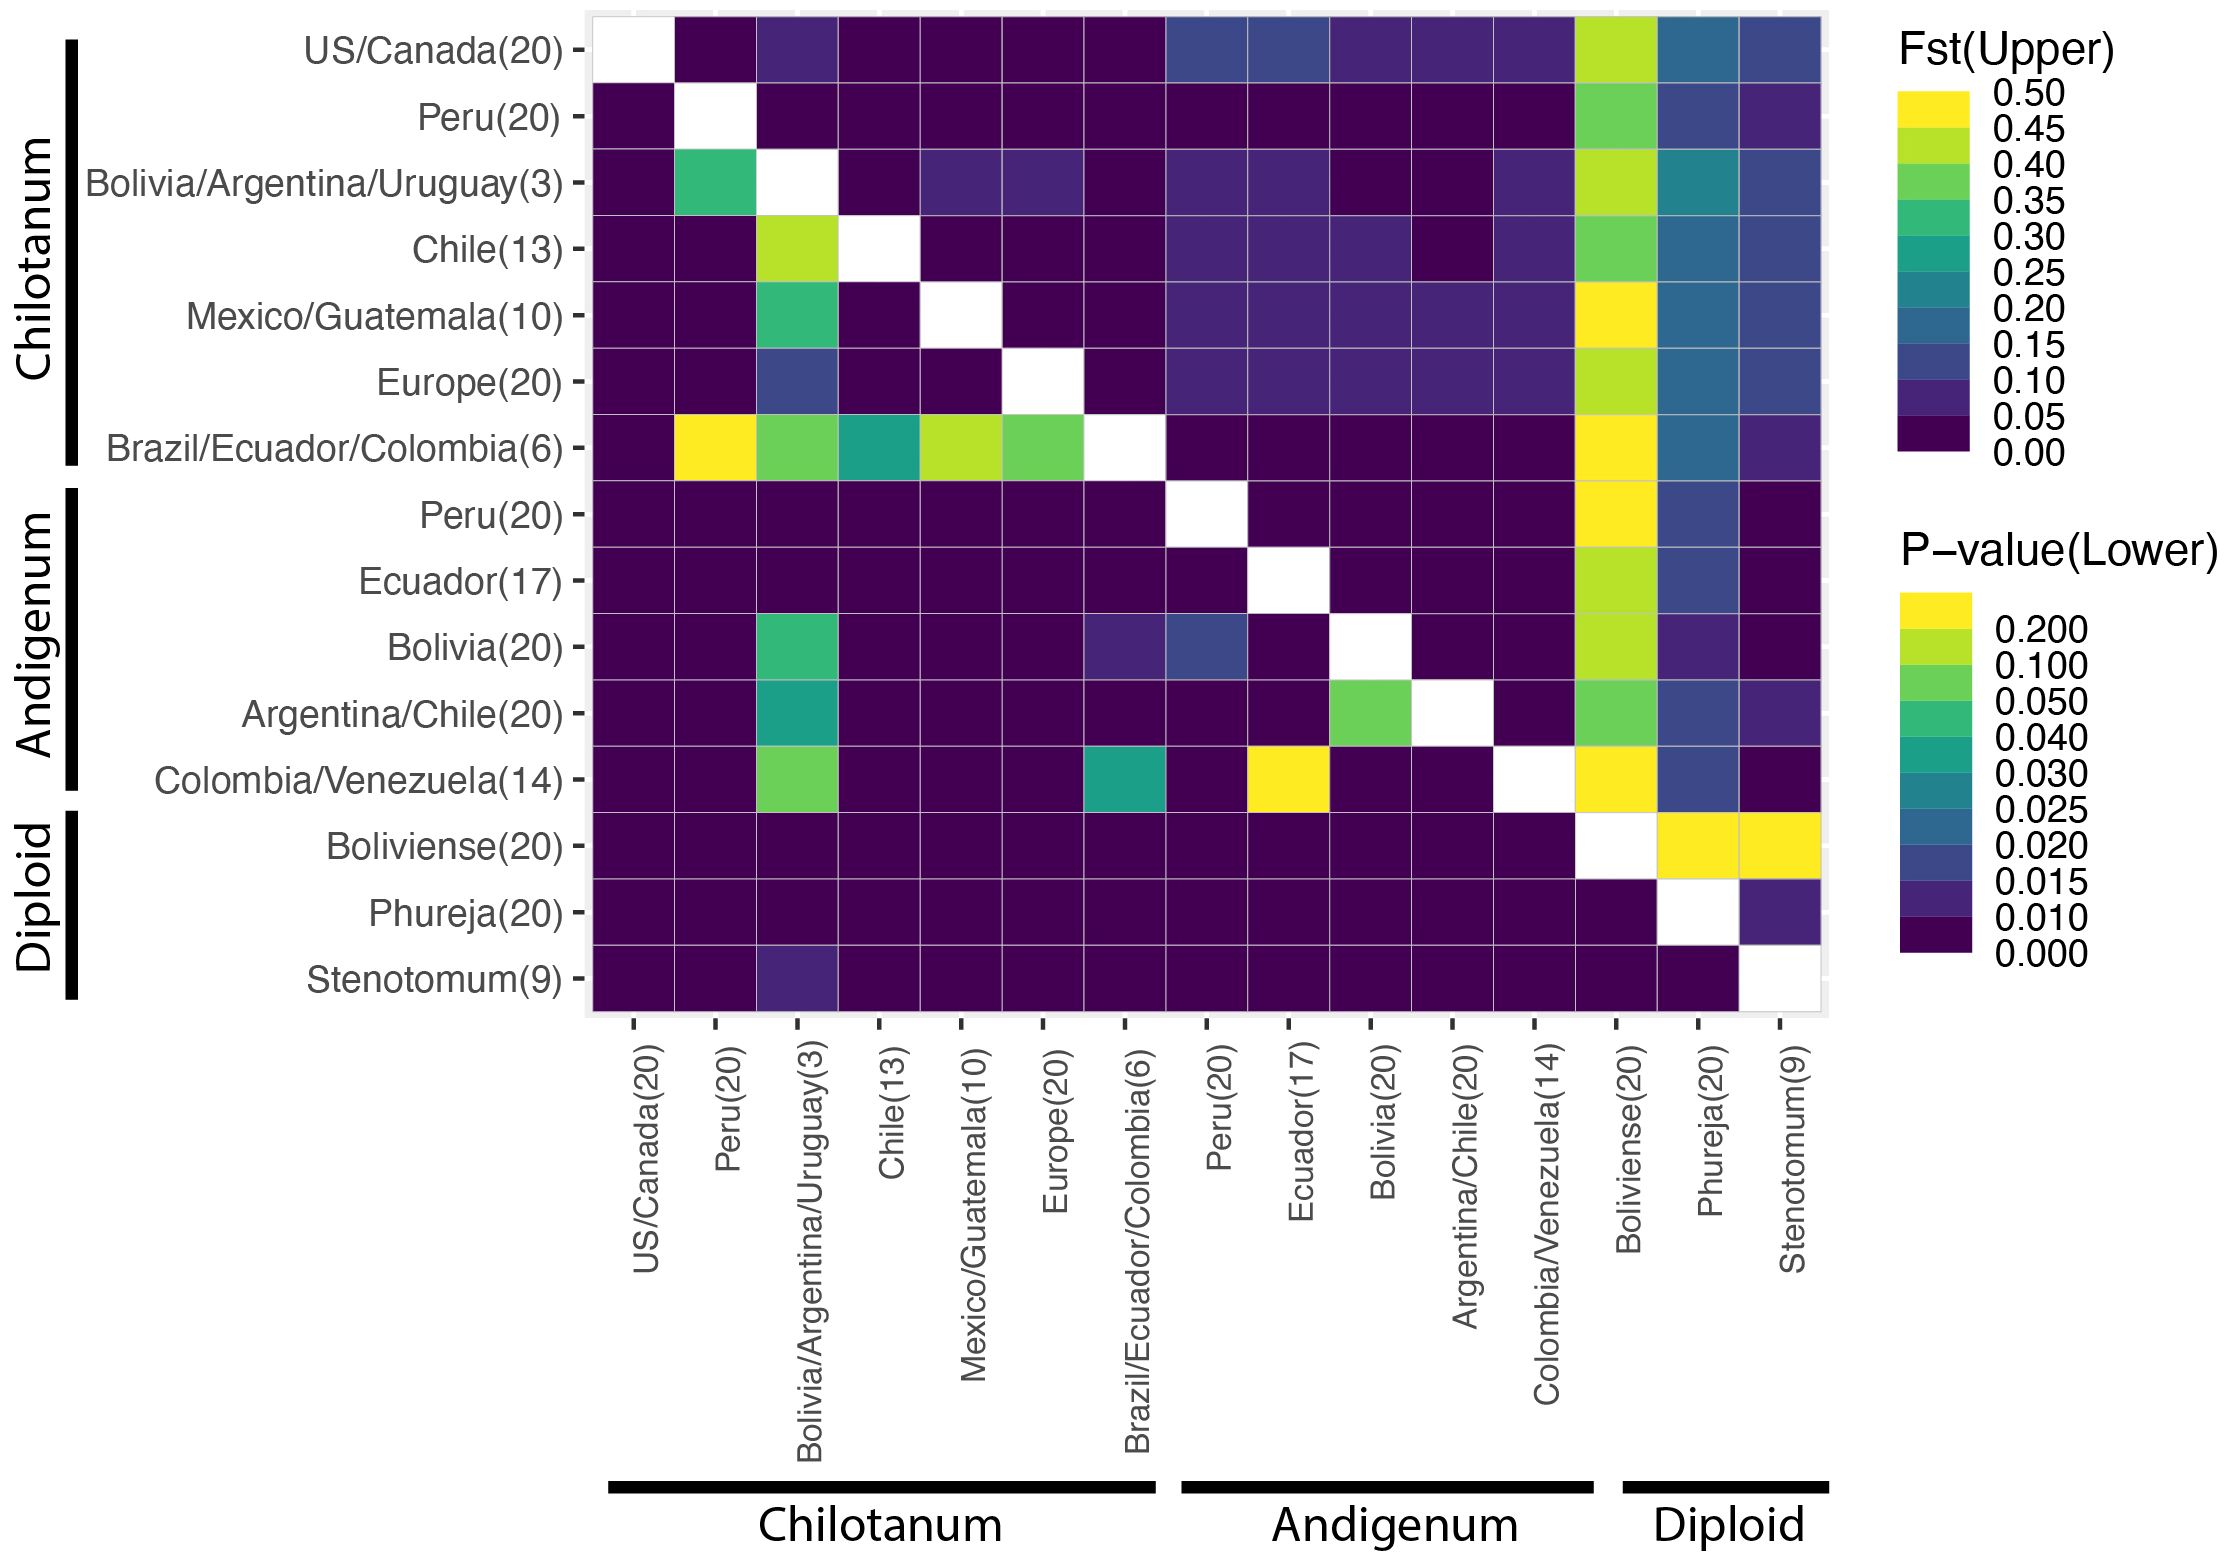
Figure 2 Fst comparisons for the combined panel (upper triangle). Fst is most appropriate for calculation of population structure across cytotype (Meirmans et al., 2018). The lower triangle indicates significance (p) values. Fst values can be found in Supplementary Table S4. Boliviense is the only wild species included in this analysis.
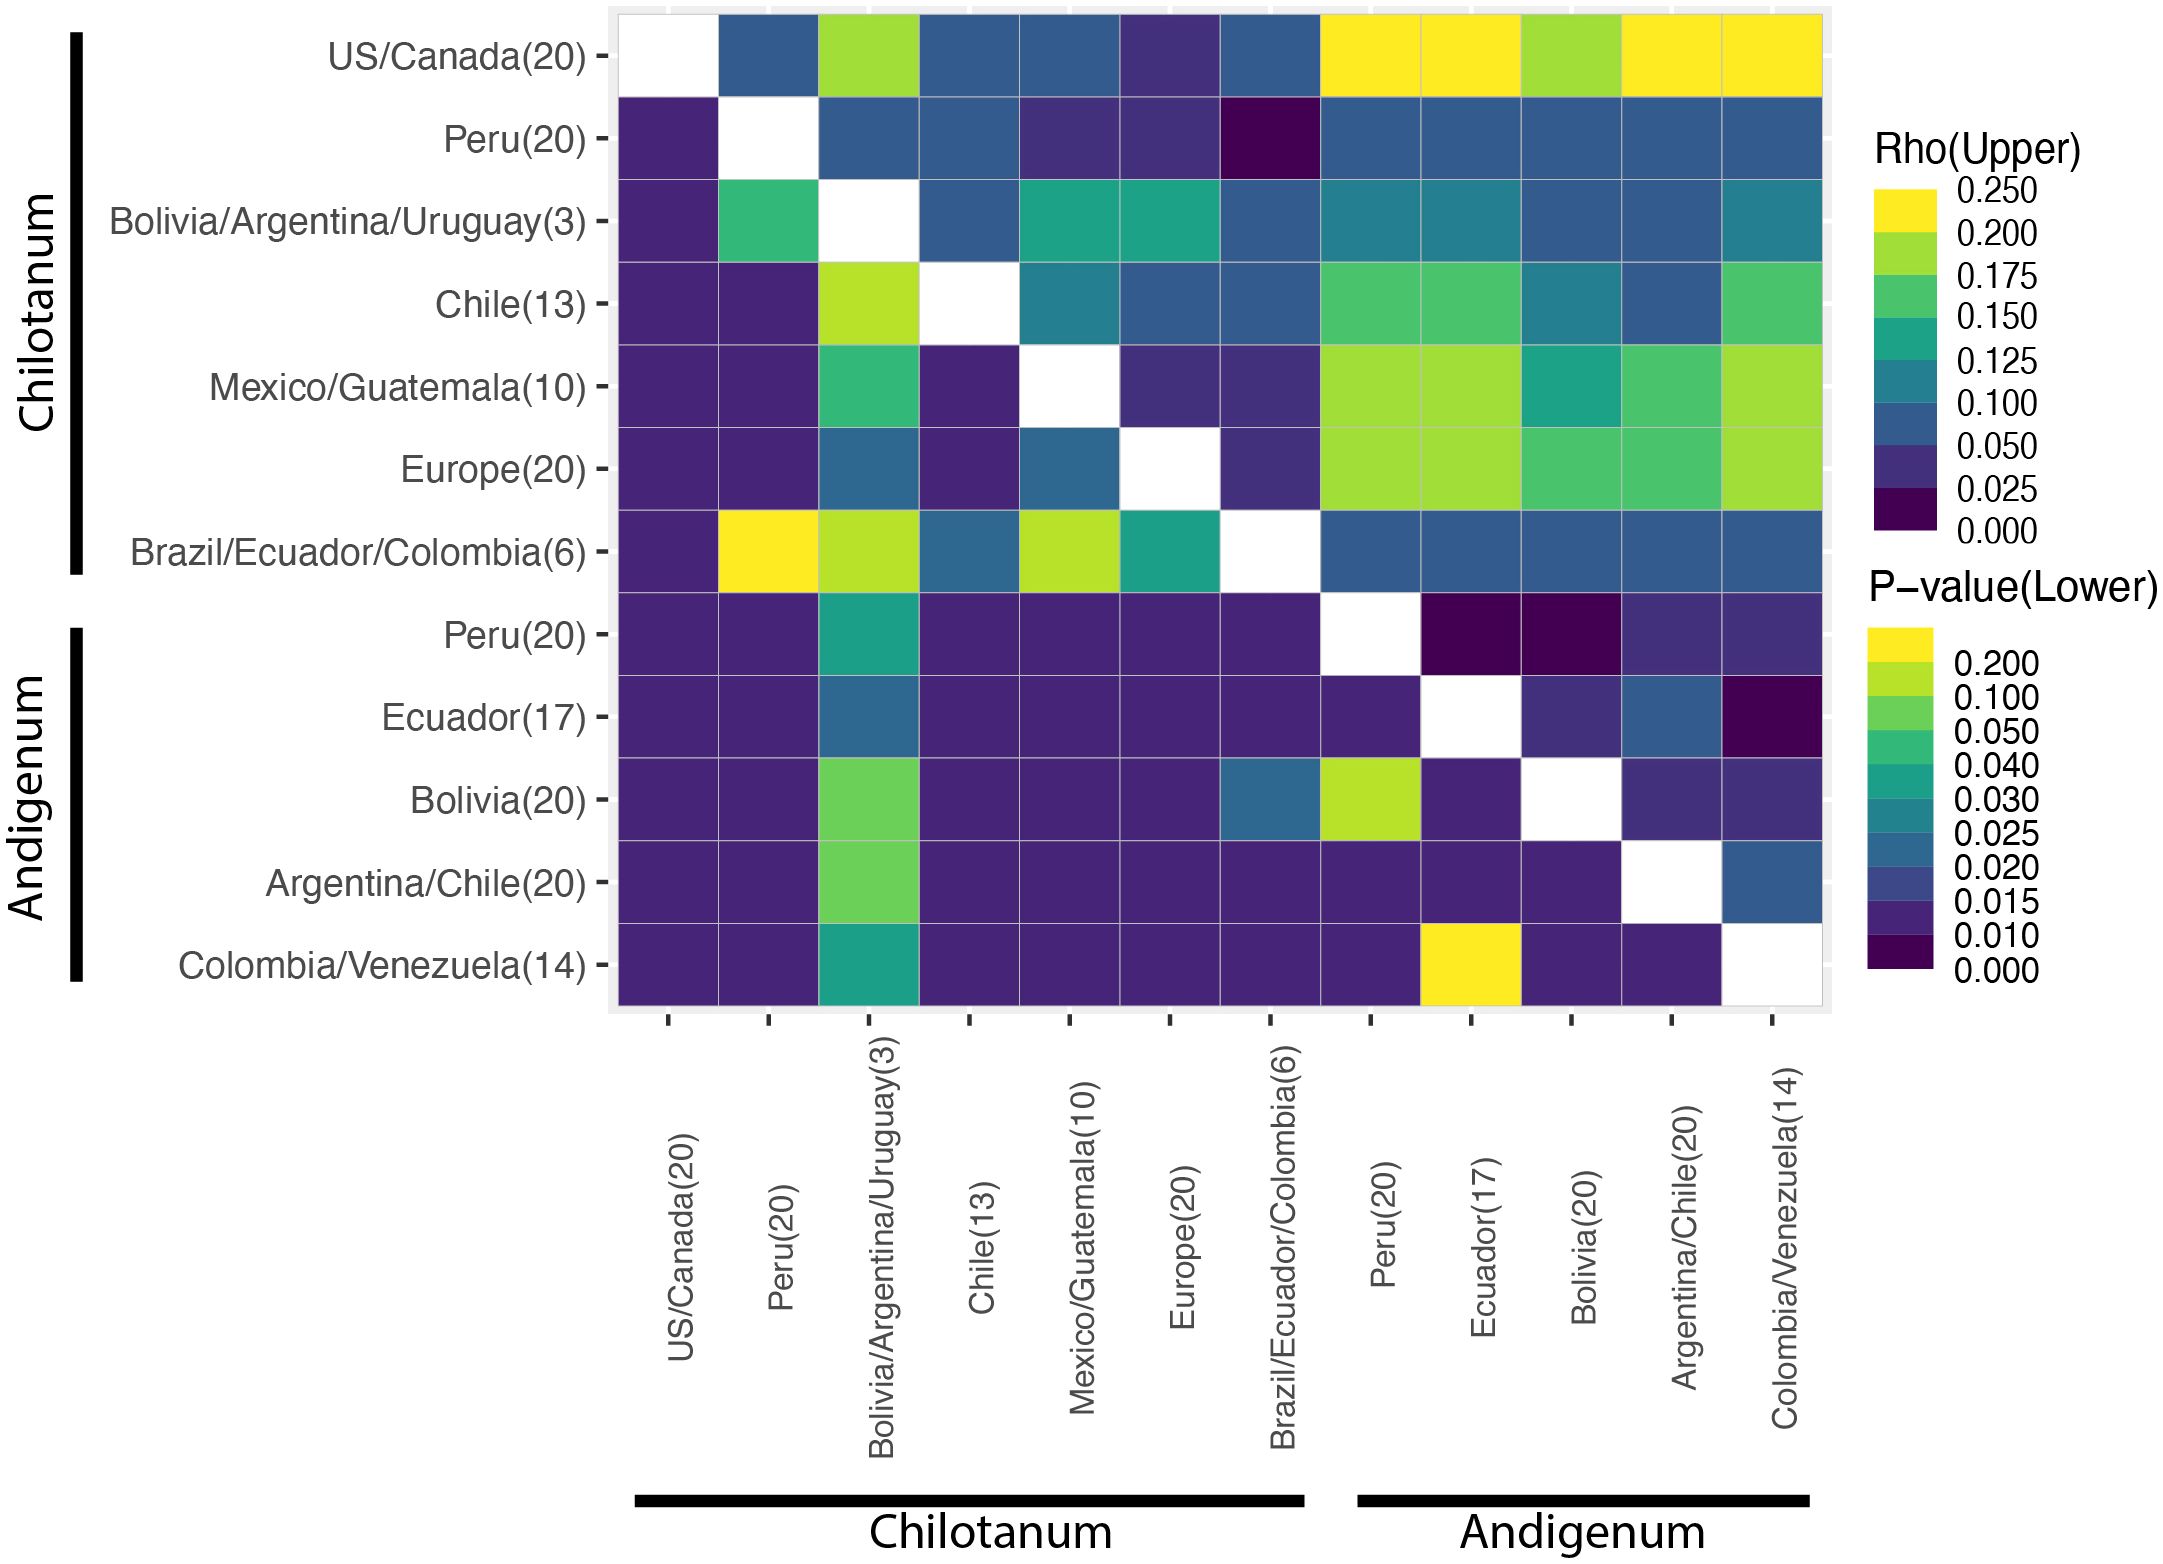
Figure 3 Rho (⍴) values for the tetraploid panel. ⍴ is most appropriate for calculation of population structure for autopolyploids (Meirmans et al., 2018). The lower triangle indicates significance (p) values. Analysis of the diploid panel can be found in Supplementary Figure S3. All ⍴ values can be found in Supplementary Tables S5 and S6.
FST and ⍴ values are similar for the diploids (Figure 2, Supplementary Figure S3, Supplementary Tables S5, S7). In both cases S. bolivense is the most differentiated (⍴ = 0.762 – 0.786) and S. stenotomum and S. phureja are the most similar (⍴ = 0.117). S. bolivense is distinct from all tetraploids (FST = 0.386 – 0.483) and for the most part, so are S. phureja and S. stenotomum (FST = 0.574-0.607). S. stenotomum is highly similar to group andigenum (FST = 0.034 – 0.068) and group chilotanum from Peru, Brazil, Ecuador, and Colombia (FST = 0.066 – 0.074) and slightly less similar to other group chilotanum (FST = 0.104 – 0.125).
PCoA distinguishes between the two subspecies with the first PC using just the tetraploid data (9.963% of the variation explained) (Figure 4B) and the second PC in the combined panel (7.477% of the variation explained) (Figure 4A). In both cases there are overlapping sets. The second PC in the tetraploid data extracts what is potentially a geographic component, with individuals from Chile and Argentina in both subspecies having the largest values.
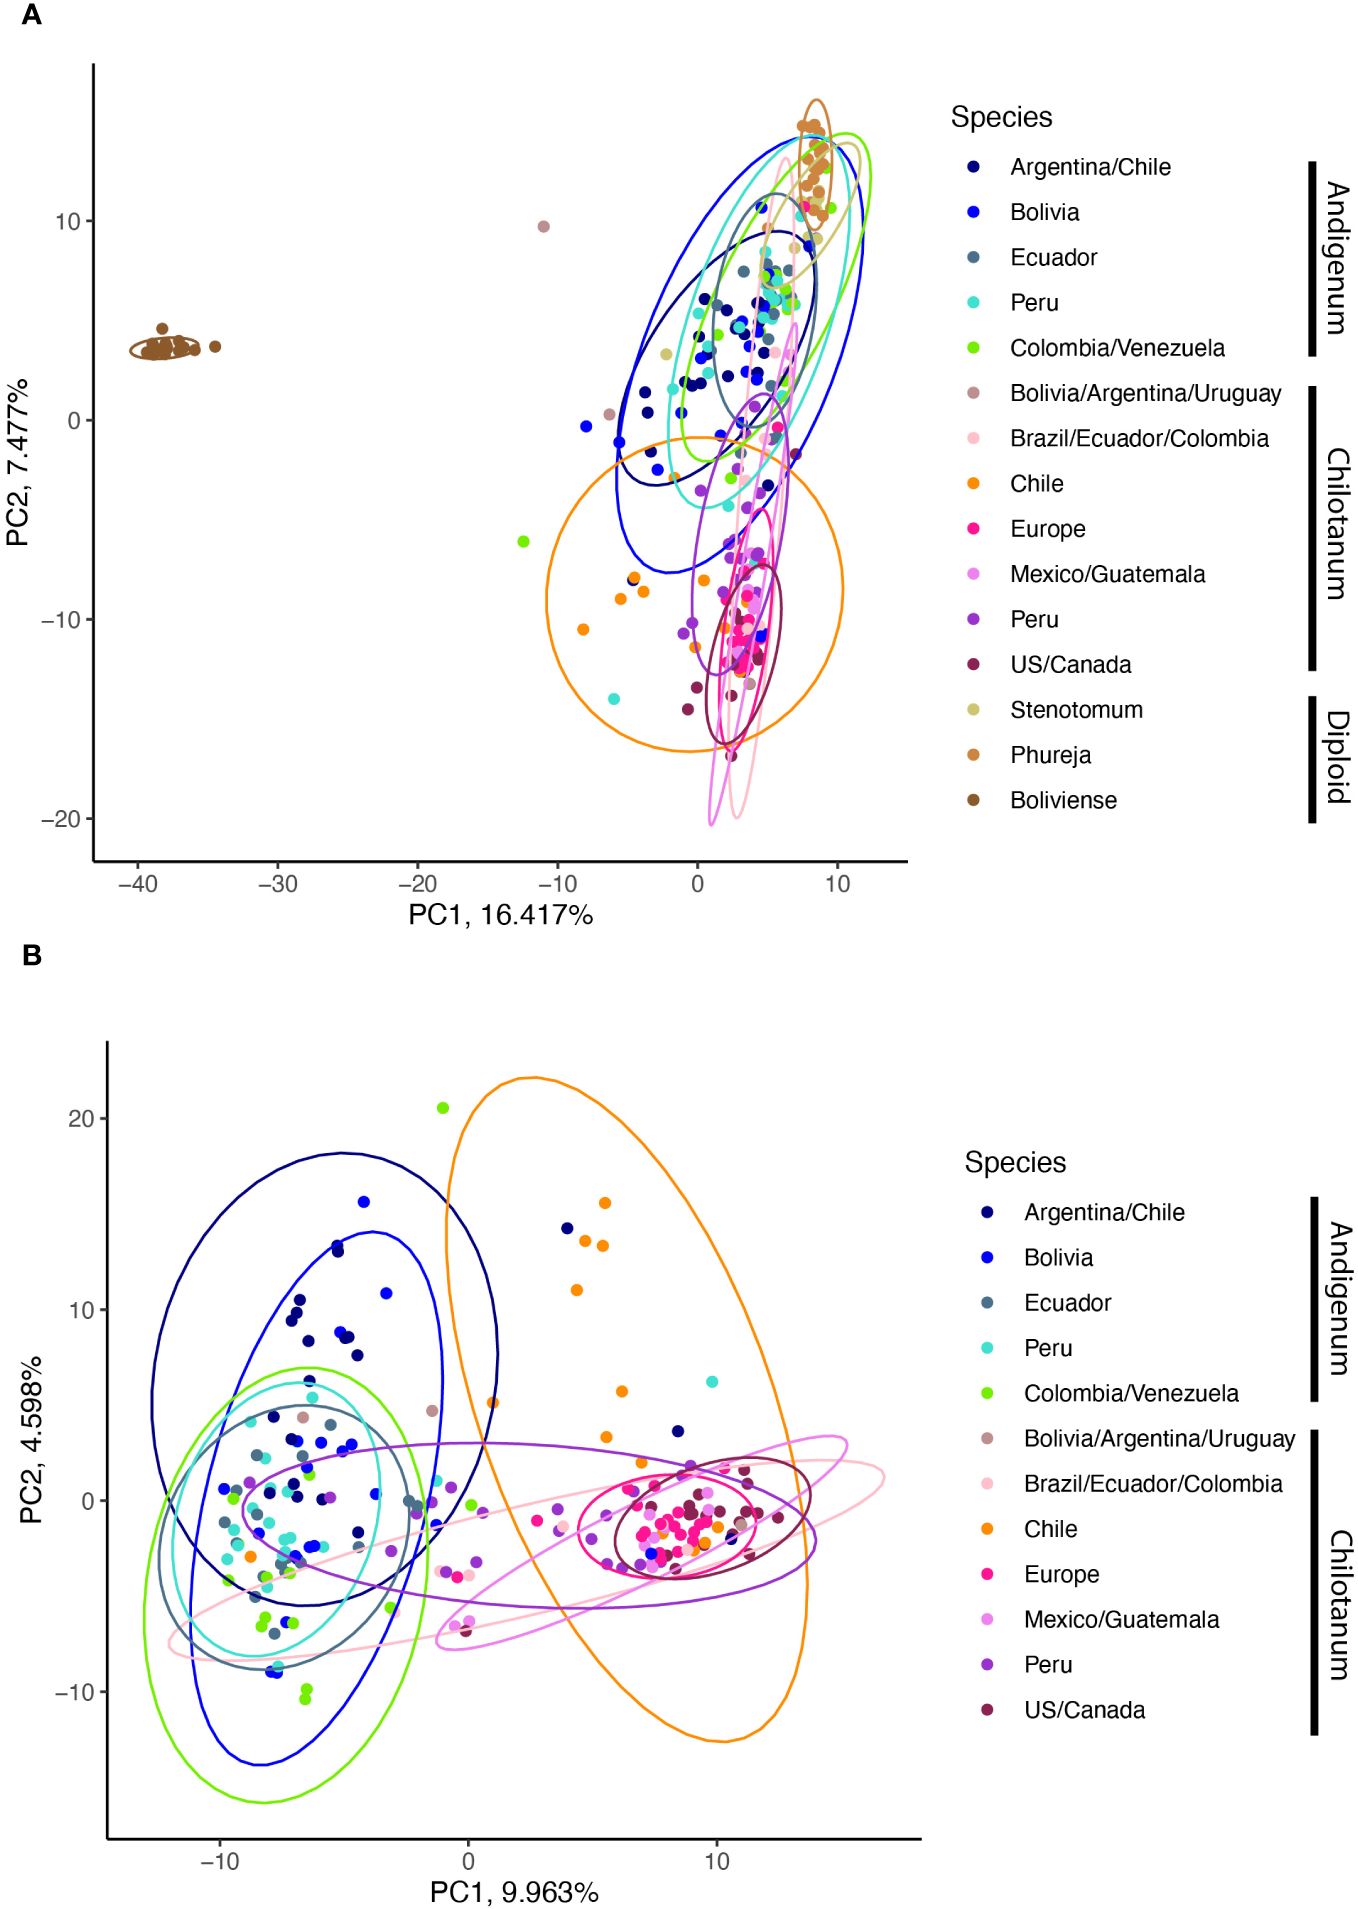
Figure 4 (A) Principle coordinate analysis from the combined panel. Boliviense, in brown is a wild species. (B) PCoA of the tetraploid panel.
Analysis with STRUCTURE suggested five distinct ancestry components (Figure 5). The S. bolivense component (red) is found primarily in the mostly unadmixed S. bolivense population but also contributes to group chilotanum from Bolivia, Argentina and Uruguay. The cultivated diploid component (purple) is almost entirely unadmixed in S. phureja and dominant in S. stenotomum. It also appears in all the tetraploids with group andigenum and group chilotanum from Peru having the most diploid ancestry as compared to other tetraploids. This split between wild and cultivated diploids is replicated when the diploid panel is considered alone (Supplementary Figure S4). As expected, the tetraploid germplasm has a component for each subspecies; chilotanum in green and andigenum in yellow (Figure 5). There is some chilotanum presence in most group andigenum populations, with a notably large component in the Argentinian/Chilean population. Similarly, there is andigenum ancestry in all the group chilotanum populations with largest component in Peru and in all the diploid populations. There is a fifth (blue) component which appears most strongly in Chilean group chilotanum and Argentinian, Chilean, and Bolivian, group andigenum. This split between the two subspecies with a third potentially geographic component is replicated in the separate analysis of the tetraploid material (Supplementary Figure S5).
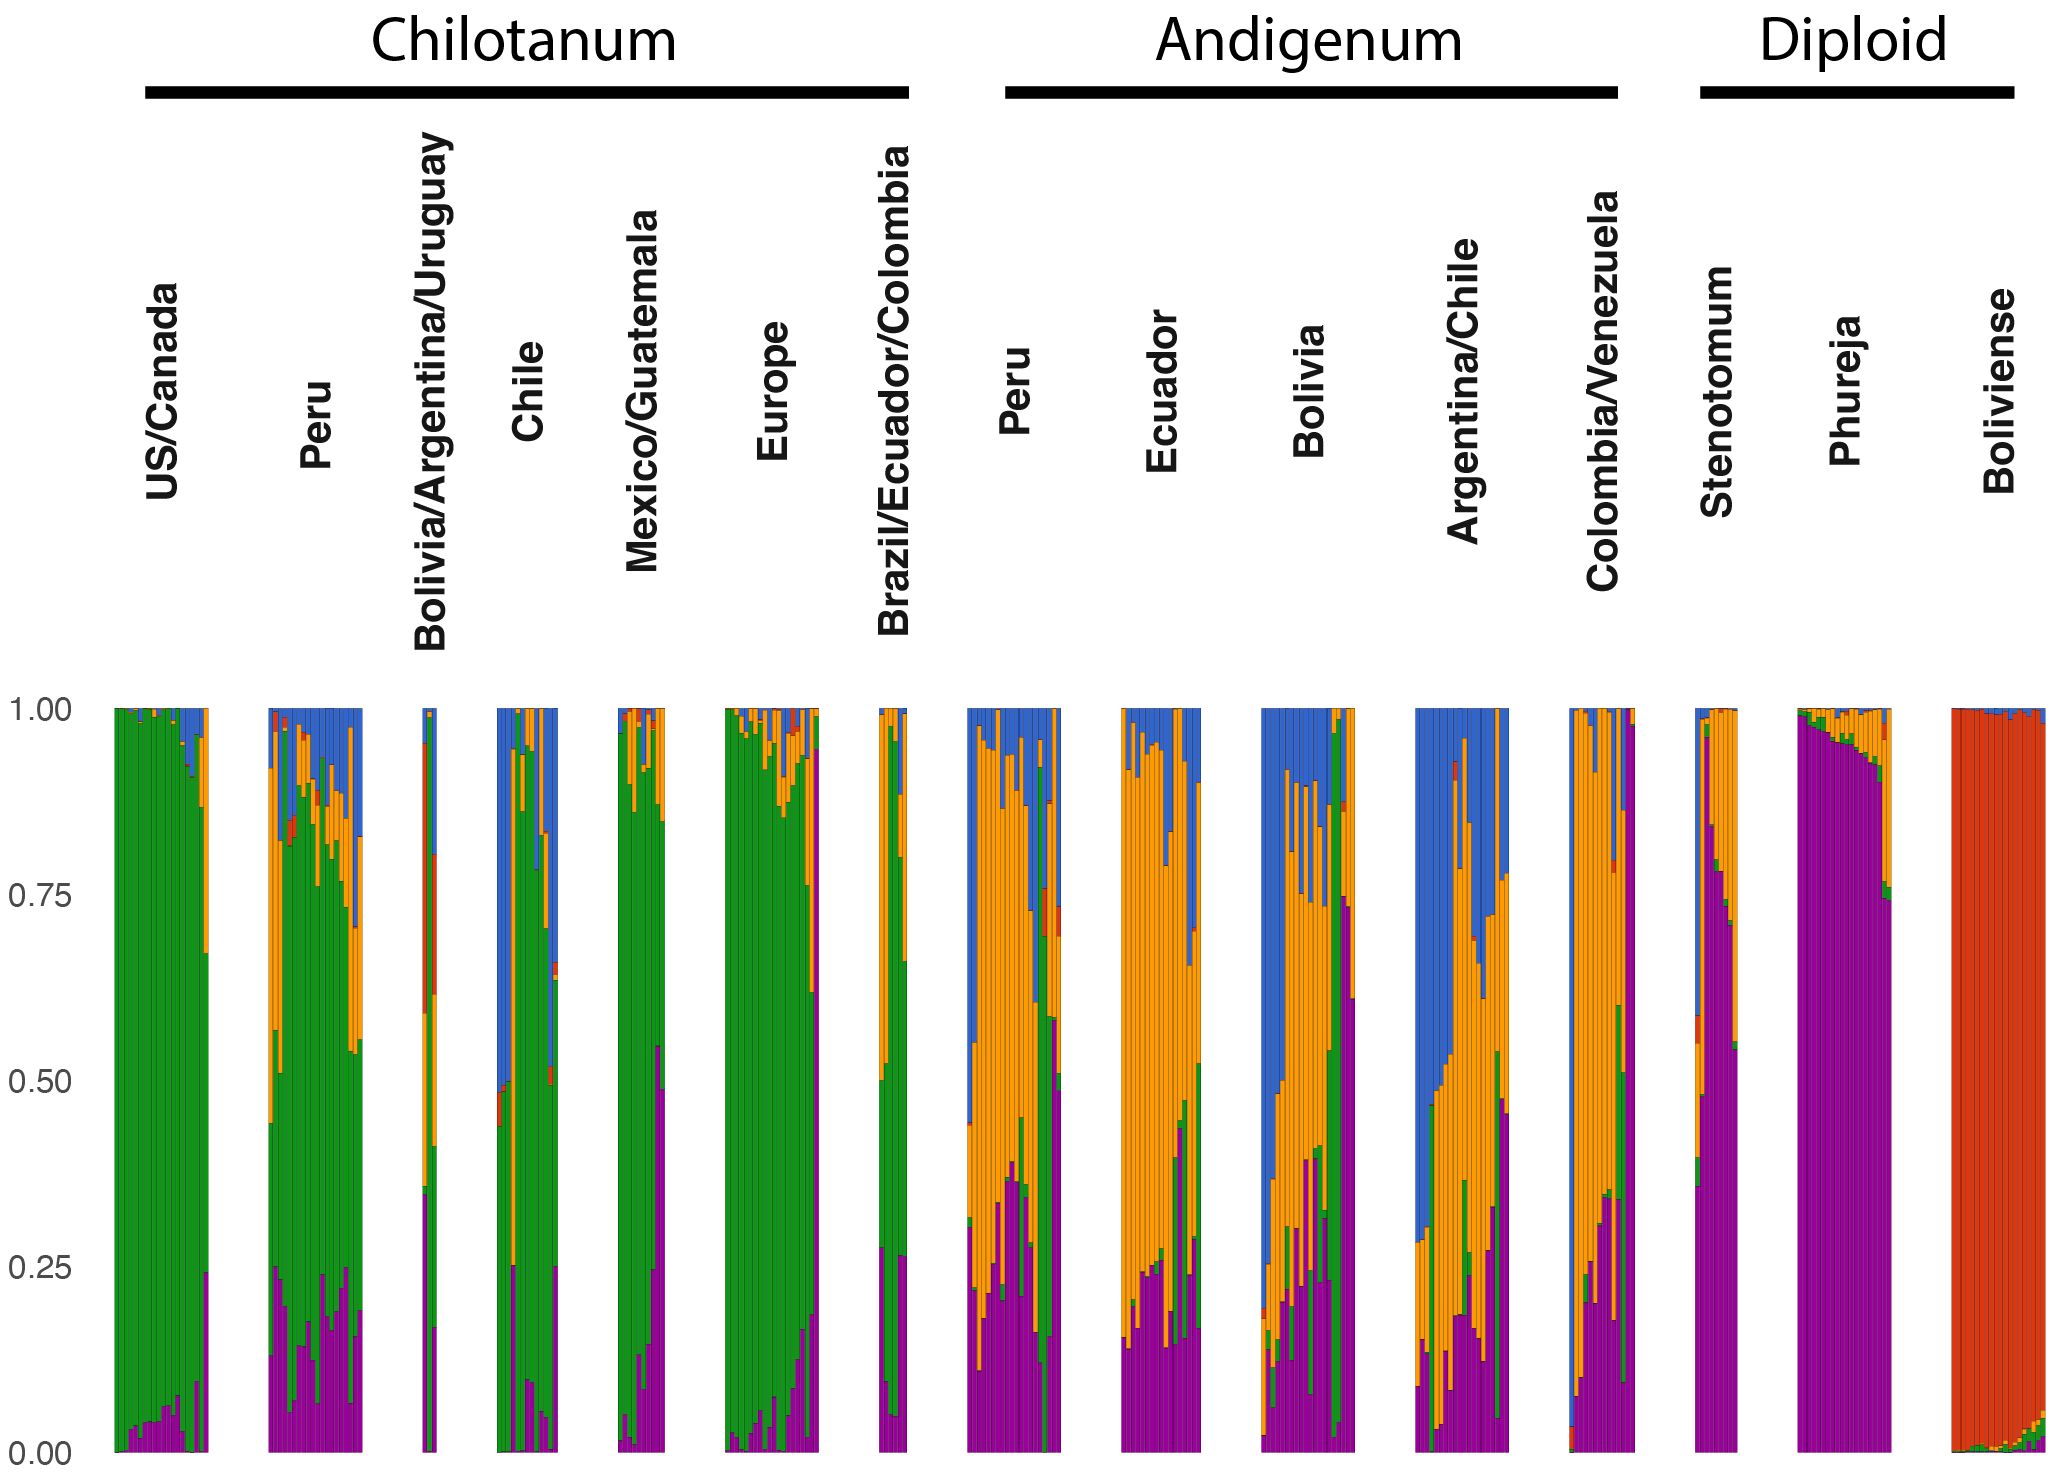
Figure 5 STRUCTURE (Pritchard et al., 2000) analysis for the combined panel using k=5. Large populations were subsampled to include 20 individuals. STRUCTURE analysis for the separately analyzed panels can be found in Supplementary Figures S4 and S5. All groups are cultivated germplasm with the exception of Boliviense.
In order to examine admixture between specific populations we used D statistics (Figure 6). We found admixture between the group chilotanum from the US and Canada, Europe, Peru, Mexico, Guatemala, Brazil, Ecuador and Columbia and other cultivated potato. We did not see admixture between non-group chilotanum cultivated potato and chilotanum from Chile, Bolivia, and Argentina (Figure 6A). When we examined group chilotanum geneflow with individual populations in group andigenum, we found some evidence of geneflow into Ecuador and Peru but none into most populations (Figure 6B). This suggests that for the majority of populations the direction of geneflow is from group andigenum into group chilotanum.
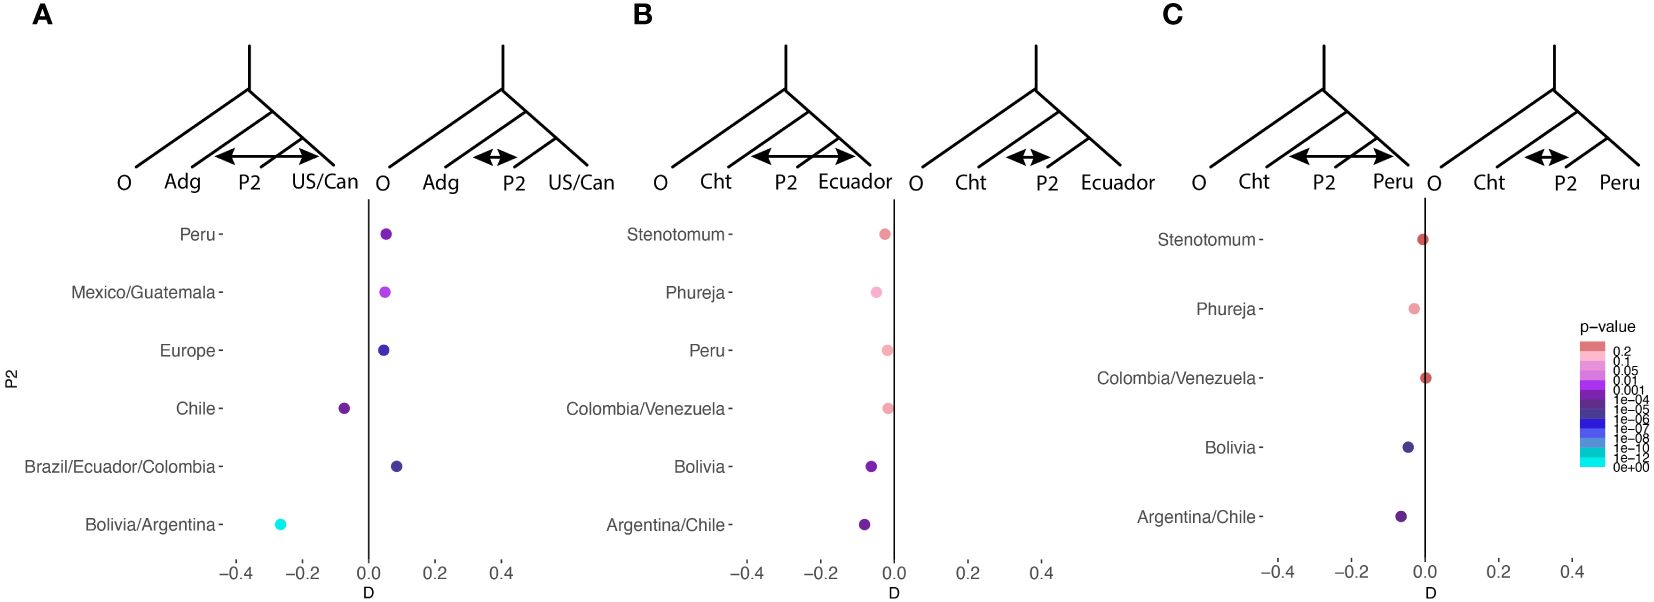
Figure 6 D statistics were used as a formal test of admixture between specific populations. In all cases S. boliviense was used as the outgroup. In (A) admixture between group andigenum as a whole and individual populations of chilotanum is tested. P2 is a different population in each test which is listed vertically along the side. A negative D statistic indicates admixture between andigenum as a whole and US/Canadian chilotanum, while a positive D statistic indicates admixture between P2 and andigenum as a whole. The magnitude of D reflects the amount of admixture, while the color of the point indicates the significance of the effect. In (B, C) admixture between chilotanum as a whole and individual populations of andigenum is tested and represented similarly to (A).
3.5 Core subsets
To determine how many individuals would be needed to capture most of the diversity in the genotyped collection, we created two sets of core subsets using Core Hunter 3 and GenoCore software, for the combined panel in this study. Both methods identified 329 individuals which included all alleles detected in the population (Table 3, Supplementary Table S8, S9). Although each of these subsets contained 65.3% of the total population, they differed by 44 individuals. Both were 3.3% diploid and slightly weighted toward group andigenum over group chilotanum, although CoreHunter produced a panel that had more chilotanum individuals than GenoCore. Further analyses showed that with 100 individuals, a coverage of 97% of the genetic diversity in this collection can be achieved, while 90% coverage is possible with just 50 individuals. With 20 individuals 70-77% of coverage is achieved. Recommended subsets are listed in Supplementary Table S8, S9.
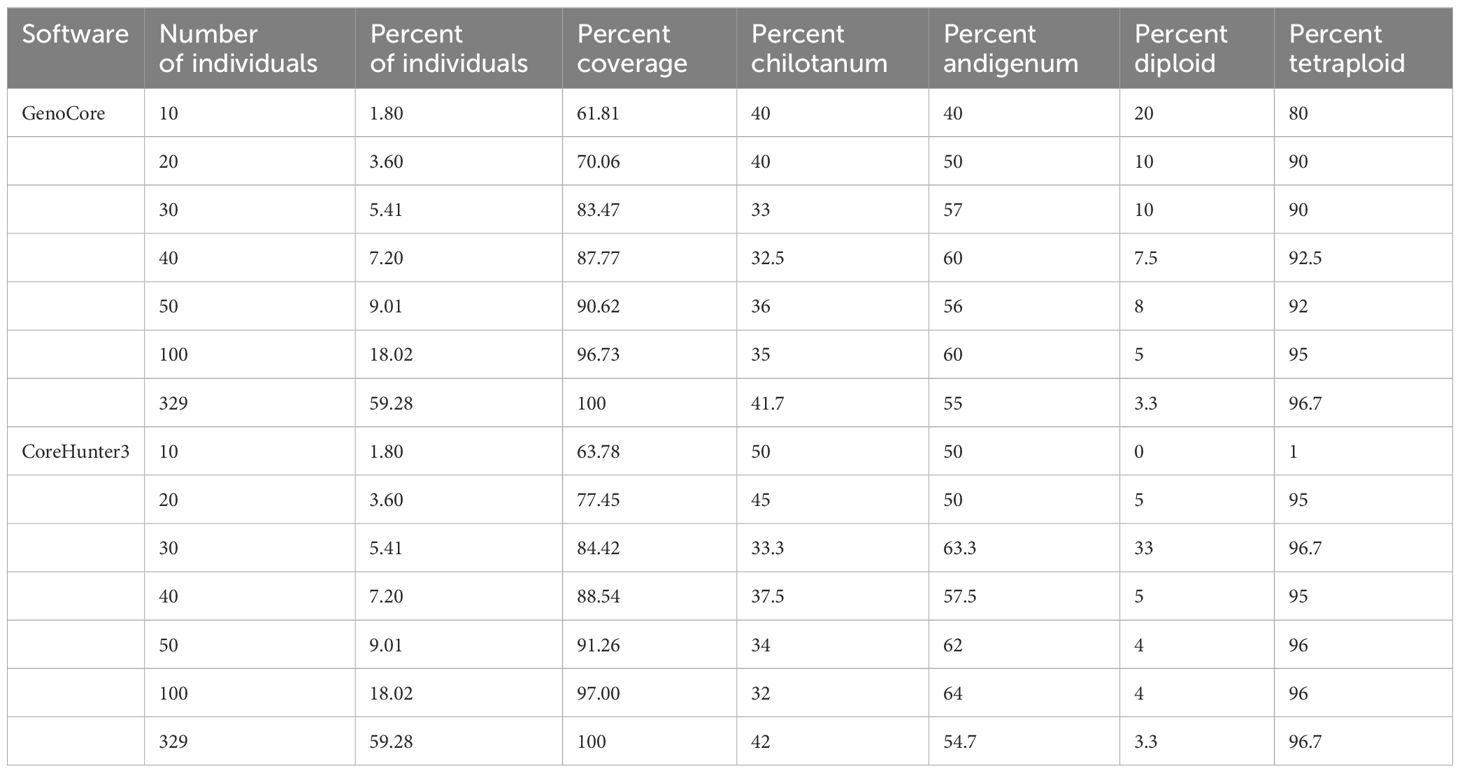
Table 3 Statistics from the two software programs used to select core subsets.
4 Discussion
4.1 Comparison of the genotyping panels
We organized the individuals into three genotyping panels which were analysed separately. The first included all the diploids, the second contained the tetraploids, and the third was a combined panel. Although the combined panel contained all the individuals in the first and the second panel there were substantial differences in the SNPs detected in each panel (Supplementary Figure S1). Only 1,264 SNPs were found in all three panels. The combined panel contained 2,980 SNPs not identified in the other panels, an expected consequence of an increase in sample size. More surprisingly, the diploid panel contained 2,756 SNPs not present in other panels. This is likely due to alleles specific to diploid species. While only 5 private alleles, all in S. bolivense, were found in the combined panel, 1,929 were found in the diploid panel. When the diploids make up a smaller proportion of the population, diploid specific SNPs are less likely to meet even very low quality thresholds. This calls into question the validity of the SNPs uncovered only in the diploid panel, but also suggests that we are under counting SNPs unique to the diploids in the combined panel, which is likely to artificially lower heterozygosity measures. However, even when the ploidy specific panels are analysed phureja and stenotomum exhibit lower observed and expected heterozygosity than the tetraploids and show higher levels of inbreeding, suggesting that this is not an artefact of ascertainment bias.
Ascertainment bias has been implicated in over estimating tetraploid group chilotanum diversity, particularly referencing studies using the SolCAP array (Bamberg and del Rio, 2020). GBS reduces ascertainment bias through the use of denovo SNP discovery in the analysed population (Glaubitz et al., 2014). However, as seen in this study, differences in sample sizes can introduce bias in SNP calling, which in this case may be inflating tetraploid diversity. The choice of reference genome can also introduce bias (Glaubitz et al., 2014), although since the potato reference is a monoploid developed from diploid phureja this bias is likely to result in an underestimation of tetraploid diversity. Furthermore, GBS is inherently low coverage and relies on imputation particularly in polyploids (Clark et al., 2019). When missing data is not imputed and left missing it results in an underestimation of heterozygosity at loci with high missingness (Bamberg et al., 2021). However, when there is extensive structural variation, as seen in tetraploid potato (Pham et al., 2017; Hoopes et al., 2022), true missing alleles are often incorrectly imputed to common genotypes, thus underestimating tetraploid diversity (Della Coletta et al., 2021). Any and all of these conflicting sources of bias could affect the heterozygosity values we report.
It is important to note that, GBS data represents only a fraction of the genome, and only segregating sites were examined. Therefore, the heterozygosity values reported are only meaningful in comparison to each other rather than as absolute values. Heterozygosity in potato is a subject of debate with reports varying. Whole genome sequencing studies, which present the most complete least biased data, report about 1.5% heterozygosity in wild diploids (Aversano et al., 2015; Leisner et al., 2018; Hosaka et al., 2022), 1.73 – 4.48% in cultivated diploids (Kyriakidou et al., 2020), and 5 – 8% in cultivated tetraploids (Hoopes et al., 2022).
Furthermore, our panel is not the result of systematic sampling of global cultivated potato diversity, but rather a subset of a genebank collection. The genebank cultivated collection was built up over time through a variety of collection trips and donations. While the goal of the genebank collection is to preserve and make available the full range of potato genetic diversity, it is, of course, possible that sampling was somehow biased. In particular, our sample may not represent extant diversity as most accessions in genebanks were collected well over twenty years ago (Sotomayor et al., 2023). However, the agreement between our results and previous studies on other samplings of potato diversity, in particular the cultivated collection of the International Potato Center (CIP) in Lima Peru (Ellis et al., 2018), suggests the US genebank collection is in fact representative of cultivated potato diversity as a whole.
4.2 Ploidy estimation
Comparing diversity at different ploidy levels requires accurate ploidy assignments for informative population genomic analysis. However, the passport data for some individuals had an indicated ploidy that differed from known ploidy for the reported species. For instance, S. juzepczukii is generally reported to be triploid (Schmiediche et al., 1982; Spooner et al., 2014; Machida-Hirano, 2015; Graebner et al., 2019; Kyriakidou et al., 2020) but the passport data for S. juzepczukii included in this data set listed the accessions as diploid or tetraploid. Passport data is provided by the accession donor and often further characterization data, such as ploidy, is added at the genebank. Ploidy is generally determined by root tip squashes at the genebank (Ordoñez et al., 2017). Accumulation of errors in passport data overtime has been reported in other potato collections (Ellis et al., 2018) and incorrect information regarding ploidy or species can render diversity analysis uninformative. Therefore, we confirmed passport ploidy information using genotype data, based on heterozygosity and allelic frequencies (Gompert and Mock, 2017; Ellis et al., 2018). We found discrepancies in approximately 10% of the accessions and removed them from further analysis. Whether this is the result of inaccurate results from the ploidy calling algorithms, mix-ups within the collection, or variable ploidy within species is unclear.
4.3 Diversity in diploids and tetraploids
Cultivated US and European potato is highly heterozygous with on average three haplotypes per locus (Hoopes et al., 2022). Previous studies have suggested that cultivated US tetraploid potato is dramatically more heterozygous than comparable crops, diploid cultivated potato, or wild potato (Hardigan et al., 2017). This pattern is the reverse of the expected loss of diversity associated with crop domestication and improvement (Doebley et al., 2006). However, these were comparisons of observed and expected heterozygosity made without corrections for ploidy. Polyploids appear more heterozygous because there are more opportunities to observe alternate alleles in tetraploids than diploids (2 vs. 4) (Meirmans et al., 2018). Gametic heterozygosity, which compares pairs of alleles in an individual and averages over all possible pairs per loci, is a fairer basis for comparison (Meirmans et al., 2018). When this metric is used, we still observe tetraploids with higher heterozygosity than diploids, but the discrepancy is less dramatic. This suggests that it is not just the opportunity to observe more alleles that leads to higher heterozygosity in polyploids, but also the nature of polyploid genetics. For example, reduced efficacy of selection in polyploids leads to inefficient purging of deleterious alleles (Spooner et al., 2014; Monnahan and Brandvain, 2020).
Among the tetraploids, the group chilotanum populations were more heterozygous than the group andigenum populations. In particular, US, Canadian, and European populations were the most heterozygous. These populations have been bred to increase heterozygosity based on the assumption of a narrow bottleneck out of South America (Hirsch et al., 2013). Northern group chilotanum are the only populations that don’t exhibit low level inbreeding. However, group chilotanum also showed the highest expected heterozygosity suggesting that the level of heterozygosity cannot be explained by balancing selection alone. This is consistent with previous observations of high heterozygosity and high haplotype numbers in US potatoes (Hardigan et al., 2017; Meng et al., 2022).
4.4 Population structure and admixture
The distribution of diversity across populations is determined by the history of isolation, migration, and cross-pollination between these populations. This history influences relative allele frequencies within and between these populations. The degree to which presumed populations are discreet is referred to as population structure and the shared ancestry of an individual from multiple discreet populations is called admixture.
The primary distinction in our population was between wild and cultivated species. Although, FST values suggested some admixture between S. bolivense and cultivated species. This is consistent with previous reports of low levels of introgression from S. bolivense into cultivated US and European potato (Hardigan et al., 2017; Hoopes et al., 2022). Our STRUCTURE results suggest this has been unidirectional introgression from S. bolivense into the cultivated species rather than reciprocal admixture. However, the S. bolivense samples in this study come from a single population and therefore might not represent all S. bolivense populations. Furthermore, they may appear artificially distinct from cultivated material due to high within population relatedness. However, the high number of private alleles found even within one population suggests that S. bolivense is distinct from cultivated potato. This is consistent with the general observation that wild relatives have a variety of alleles and desirable traits not present in cultivated material (Jansky et al., 2013; Bamberg and del Rio, 2020).
Population structure within cultivated potato is low with FST values ranging from 0.019 to 0.059 and the first and second PCA explaining 9.963 and 4.598% of the variation, respectively. Within the diploids, S. phureja and S. stenotomum are highly similar (Figure 2). This is consistent with their membership in a single species in the Spooner taxonomy. However, S. stenotomum is more highly admixed with the tetraploid group andigenum than S. phureja (Figure 5) and more heterozygous (Figure 1A). Previous analysis of the genebank collection at CIP in Lima Peru found that S. phureja made up a distinct population (Ellis et al., 2018). This suggests that there is variation within S. phureja as a whole and the 20 individuals in this study differed from those at CIP in that they were more closely related to S. stenotomum.
The admixture we observe across ploidy levels is consistent with previous observations in wild and cultivated populations (Kardolus, 1998; Hosaka, 2003; Spooner et al., 2007; Gavrilenko et al., 2010; Rodríguez et al., 2010; Spooner et al., 2012; Gavrilenko et al., 2013; Hardigan et al., 2017; Achakkagari et al., 2020; Hoopes et al., 2022). The high frequency of interploidy crossing in section petota is likely facilitated by the prevalence of unreduced gametes (Watanabe and Peloquin, 1989; Watanabe, 2015). While asymmetrical crossing occurs, for example triploid S. juzepzukii is the result of crosses between diploid S. stenotonum and the tetraploid wild species S. acaule (Kardolus, 1998; Gavrilenko et al., 2010; Rodríguez et al., 2010; Gavrilenko et al., 2013), it generally results in sterile individuals of odd ploidy. Unreduced gametes are necessary for heritable introgression. Contemporary breeders have made extensive use of such crosses to introduce novel traits (Ortiz et al., 1994; Capo et al., 2002; Zimnoch-Guzowska and Flis, 2021; Clot et al., 2023, 2024) and it seems likely that this sort of introgression has been a tool used by humans throughout potato’s history (Hoopes et al., 2022; Meng et al., 2022).
Among the tetraploids we observed separation between the two groups, andigenum and chilotanum (FST = 0.023 – 0.1, first PCA explaining 9.9% of the variation). The exception to this is that Peruvian group chilotanum shows little differentiation from group andigenum (FST = 0.033 – 0.044) and exhibits the largest andigenum component of the group chilotanum populations in structure analysis. Peruvian populations from both groups show evidence of introgression from the other (Figure 6). In contrast while there is little structure between the Bolivian, Argentinian, Uruguayan, and Chilean group chilotanum and andigenum populations (FST = 0.027 – 0.109), there is no evidence of introgression in either direction for these populations (Figure 6). This is consistent with Southern South American group andigenum being the ancestor of group chilotanum, resulting in two highly related taxa in the region. Introgression then, is only possible in diverged Northern populations. This, along with the shared (blue) component in the structure analysis, suggests that there is a geographic aspect as well as a species aspect to population structure in tetraploid cultivated potato.
S. chilotanum in the US and Europe is characterized by extensive introgression from wild species (Hardigan et al., 2017; Hoopes et al., 2022). While some of this introgression is the result of post 1945 introgression breeding for disease resistance (Vos et al., 2015) much of it is older (Hoopes et al., 2022; Meng et al., 2022). We observed evidence of introgression into US and European group chilotanum from group andigenum (Figure 6). In general, group chilotanum but not group andigenum seems to be characterized by continual introgression. The only exception this is in the region where chilotanum originated and therefore is least differentiated from andigenum. Our observations are consistent with the hypothesis that there has long been extensive mixing in section Petota in Southern South America which is reflected in the genomes of commercial US potatoes.
4.5 Core subsets for maintenance of genetic diversity and research cost reduction
Genebanks serve a variety of essential functions including providing a genepool of crop and crop wild relative alleles useful for breeding for novel traits, in particular biotic and abiotic stress resistance. For instance, the US potato genebank preserves germplasm expressing alleles for resistance to soft rot (Ma et al., 2022) and late blight (Enciso-Rodriguez et al., 2018), cold hardiness (Bamberg and Lombard, 2022), freezing tolerance (Bamberg et al., 2020) and increased folate content (Robinson et al., 2019). However, the full extent of potential beneficial alleles within the genebank have not been uncovered and cannot be uncovered unless more screening and evaluation is promoted. In addition, new environmental changes are creating selection pressure at natural habitats which can render new alleles with adaptation and resilience to pests, diseases, and abiotic stresses.
Screening germplasm within a genebank is a large undertaking, which can be made simpler if core collections are available (Frankel, 1984; Gu et al, 2023). Core collections allow breeders and researchers to screen genetically representative germplasm i.e, by maximizing the number of alleles in the minimum number of individuals. For example, in this study all alleles detected in the 730 individuals genotyped can be found in just 329 individuals, dramatically reducing costs and labor involved in screening. For a more realistic number of experimental populations, we found that 77% of the total alleles were captured using just 20 individuals. In the supplement, we provide the recommended subsets generated here (Supplementary Table S8, S9).
We compared two methods for selecting the accessions to build the core subsets, which produced similar but not identical results, particularly for smaller subsets. All subsets were primarily composed of tetraploid accessions, which probably reflected the higher overall allelic diversity in the tetraploids. An interesting contrast was that GenoCore resulted in a much larger proportion of diploids than the core subset generated by CoreHunter3. In both methods it was observed that the percentage of andigenum germplasm included in the core subsets increased as the subset size became larger.
These subsets provide opportunities for evaluation and screening as they align to previously described core subsets for S. jamesii, S. fendleri, S. microdontum, S. demissum, and S. phureja available through the US potato genebank (Bamberg and del Rio, 2014; Bamberg et al., 2016; del Rio and Bamberg, 2020, 2021). Unlike some of the previously described core subsets, the ones described here have not been extensively phenotyped. However, they encompass a wider variety of taxa which unlock opportunities for screening and studying traits of interest. The individual accessions genotyped in this study are available through GRIN.
Data availability statement
The datasets presented in this study can be found in online repositories. The names of the repository/repositories and accession number(s) can be found below: PRJNA1111837 (SRA). The vcf files and scripts used for analysis are available at https://github.com/shannonlabumn/.
Author contributions
HT: Writing – review & editing, Writing – original draft, Investigation, Formal analysis, Data curation, Conceptualization. ADR: Writing – review & editing, Resources, Funding acquisition, Data curation, Conceptualization. JB: Writing – review & editing, Resources, Funding acquisition, Data curation, Conceptualization. LS: Writing – review & editing, Writing – original draft, Supervision, Funding acquisition, Conceptualization.
Funding
The author(s) declare financial support was received for the research, authorship, and/or publication of this article. GBS genotyping was funded by Pepsi Co under the guidance of Dr. David Eickholt. We made use of the new Polyploid tools and were funded to attend trainings in them by USDA NIFA Specialty Crop Research Initiative Award # 2020-51181-32156. This work was also funded by Minnesota Department of Agriculture through AGREETT and USDA-NIFA Grants # 2021–34141-3544 and # 2019-34141-30284.
Acknowledgments
The stocks evaluated here are the foundation of a world-wide potato industry that is our best hope of maintaining the food needs of an increasingly hungry world. We gratefully acknowledge the thousands of Andean potato farmers who, over many centuries, selected, preserved, and shared them with USPG, and thereby the global effort for potato crop improvement. We appreciate technical advice from Dr. Mandy Waters, Dr. Kelly Swarts, and Dr. Lindsay Clark.
Conflict of interest
The authors declare that this study received funding from Pepsi Co. The funder had the following involvement in the study: they paid for the sequencing and participated in choosing what to sequence.
The authors declare that the research was conducted in the absence of any commercial or financial relationships that could be construed as a potential conflict of interest.
Publisher’s note
All claims expressed in this article are solely those of the authors and do not necessarily represent those of their affiliated organizations, or those of the publisher, the editors and the reviewers. Any product that may be evaluated in this article, or claim that may be made by its manufacturer, is not guaranteed or endorsed by the publisher.
Supplementary material
The Supplementary Material for this article can be found online at: https://www.frontiersin.org/articles/10.3389/fpls.2024.1429279/full#supplementary-material
References
Achakkagari, S. R., Kyriakidou, M., Tai, H. H., Anglin, N. L., Ellis, D., Stromvik, M. V.. (2020). Complete plastome assemblies from a panel of 13 diverse potato taxa. PloS One 15, e0240124. doi: 10.1371/journal.pone.0240124
Ames, M., Spooner, D. M. (2010). Phylogeny of Solanum series Piurana and related species in Solanum section Petota based on five conserved ortholog sequences. Taxon 59, 1091–1101. doi: 10.1002/tax.594009
Andrews, S. (2010). FastQC: a quality control tool for high throughput sequence data. Available online at: http://www.bioinformatics.babraham.ac.uk/projects/fastqc.
Aversano, R., Contaldi, F., Ercolano, M. R., Grosso, V., Iorizzo, M., Tatino, F., et al. (2015). The Solanum commersonii Genome Sequence Provides Insights into Adaptation to Stress Conditions and Genome Evolution of Wild Potato Relatives. Plant Cell 27, 954–968. doi: 10.1105/tpc.114.135954
Bamberg, J., del Rio, A. (2014). Selection and validation of an AFLP marker core collection for the wild potato Solanum microdontum. Am. J. Potato Res. 91, 368–375. doi: 10.1007/s12230-013-9357-5
Bamberg, J., del Rio, A. (2020). Assessing under-Estimation of Genetic Diversity within Wild Potato (Solanum) Species Populations. Am. J. Potato Res. 97, 547–553. doi: 10.1007/s12230-020-09802-3
Bamberg, J., del Rio, A., Kinder, D., Louderback, L., Pavlik, B., Fernandez, C. (2016). Core collections of potato (Solanum) species native to the USA. Am. J. Potato Res. 93, 564–571. doi: 10.1007/s12230-016-9536-2
Bamberg, J., del Rio, A., Louderback, L., Pavlik, B. (2021). Assessing SNP heterozygosity in potato (Solanum) species— Bias due to missing and non-allelic genotypes. Am. J. Potato Res. 98, 328–332. doi: 10.1007/s12230-021-09846-z
Bamberg, J., Lombard, K. (2022). Cold Hardiness Variation in Solanum jamesii and Solanum kurtzianum Tubers. Am. J. Potato Res. 99, 69–72. doi: 10.1007/s12230-022-09862-7
Bamberg, J., Lombard, K., Palta, J. P., Workmaster, B. A., Atucha, A. (2020). Survival of Solanum jamesii Tubers at Freezing Temperatures. Am. J. Potato Res. 97, 497–504. doi: 10.1007/s12230-020-09797-x
Beals, K. A. (2019). Potatoes, nutrition and health. Am. J. Potato Res. 96, 102–110. doi: 10.1007/s12230-018-09705-4
Brown, C. R., Edwards, C. G., Yang, C.-P., Dean, B. B. (1993). Orange flesh trait in potato: inheritance and carotenoid content. J. Amer Soc. Hort Sci. 118, 145–150. doi: 10.21273/JASHS.118.1.145
Cai, D., Rodríguez, F., Teng, Y., Ané, C., Bonierbale, M., Mueller, L. A., et al. (2012). Single copy nuclear gene analysis of polyploidy in wild potatoes (Solanum section Petota). BMC Evolutionary Biol. 12, 70–70. doi: 10.1186/1471-2148-12-70
Camire, M. E., Kubow, S., Donnelly, D. J. (2009). Potatoes and human health. Crit. Rev. Food Sci. Nutr. 49, 823–840. doi: 10.1080/10408390903041996
Capo, A., Cammareri, M., Rocca, F. D., Errico, A., Zoina, A., Conicella, C. (2002). Evaluation for chipping and tuber soft rot (Erwinia carotovora) resistance in potato clones from unilateral sexual polyploidization (2x × 4x). Am. J. Potato Res. 79, 139–145. doi: 10.1007/BF02881523
Clark, L. V., Lipka, A. E., Sacks, E. J. (2019). polyRAD: genotype calling with uncertainty from sequencing data in polyploids and diploids. G3 : Genes - Genomes - Genet. 9, 663–673. doi: 10.1534/g3.118.200913
Clot, C. R., Klein, D., Koopman, J., Schuit, C., Engelen, C. J. M., Hutten, R. C. B., et al. (2023). Crossover shortage in potato is caused by StMSH4 mutant alleles and leads to either highly uniform unreduced pollen or sterility. Genetics 226, iyad194. doi: 10.1093/genetics/iyad194
Clot, C. R., Vexler, L., de la O Leyva-Perez, M., Bourke, P. M., Engelen, C. J. M., Hutten, R. C. B., et al. (2024). Identification of two mutant JASON-RELATED genes associated with unreduced pollen production in potato. Theor. Appl. Genet. 137. doi: 10.1007/s00122-024-04563-7
Corak, K. E., Ellison, S. L., Simon, P. W., Spooner, D. M., Dawson, J. C. (2019). Comparison of representative and custom methods of generating core subsets of a carrot germplasm collection. Crop Sci. 59, 1107–1121. doi: 10.2135/cropsci2018.09.0602
Danecek, P., Auton, A., Abecasis, G., Albers, C. A., Banks, E., DePristo, M. A., et al. (2011). The variant call format and VCFtools. BIOINFORMATICS 27, 2156–2158. doi: 10.1093/bioinformatics/btr330
Danecek, P., Bonfield, J. K., Liddle, J., Marshall, J., Ohan, V., Pollard, M. O., et al. (2021). Twelve years of SAMtools and BCFtools. Gigascience 10. doi: 10.1093/gigascience/giab008
De Beukelaer, H., Davenport, G. F., Fack, V. (2018). Core Hunter 3: Flexible core subset selection. BMC Bioinf. 19, 203–203. doi: 10.1186/s12859-018-2209-z
Della Coletta, R., Qiu, Y., Ou, S., Hufford, M. B., Hirsch, C. N. (2021). How the pan-genome is changing crop genomics and improvement. Genome Biol. 22, 3. doi: 10.1186/s13059-020-02224-8
del Rio, A., Bamberg, J. (2020). A Core Subset of the ex situ Collection of S. demissum at the US Potato Genebank. Am. J. Potato Res. 97, 505–512. doi: 10.1007/s12230-020-09799-9
del Rio, A., Bamberg, J. (2021). An AFLP Marker Core Subset for the Cultivated Potato Species Solanum phureja ( Solanum tuberosum L. subsp. andigenum). Am. J. Potato Res. 98, 374–383. doi: 10.1007/s12230-021-09849-w
Doebley, J. F., Gaut, B. S., Smith, B. D. (2006). The molecular genetics of crop domestication. Cell 127, 1309–1321. doi: 10.1016/j.cell.2006.12.006
Douches, D. S., Maas, D., Jastrzebski, K., Chase, R. W. (1996). Assessment of potato breeding progress in the USA over the last century. Crop Sci. 36, 1544–1552. doi: 10.2135/cropsci1996.0011183X003600060024x
Drewnowski, A., Rehm, C. D. (2013). Vegetable cost metrics show that potatoes and beans provide most nutrients per penny. PloS One 8, e63277. doi: 10.1371/journal.pone.0063277
Duellman, K. M., Lent, M. A., Brown, L., Harrington, M., Harrington, S., Woodhall, J. W. (2020). First report of rubbery rot of potato caused by Geotrichum candidum in the United States. Plant Dis. 105 (4), 727–1236. doi: 10.1094/PDIS-08-20-1815-PDN
Ellis, D., Chavez, O., Coombs, J., Soto, J., Gomez, R., Douches, D., et al. (2018). Genetic identity in genebanks: application of the SolCAP 12K SNP array in fingerprinting and diversity analysis in the global in trust potato collection. Genome 61, 523–537. doi: 10.1139/gen-2017-0201
Elshire, R. J., Glaubitz, J. C., Sun, Q., Poland, J. A., Kawamoto, K., Buckler, E. S., et al. (2011). Robust, simple genotyping-by-sequencing (GBS) approach for high diversity species. PloS One 6, e19379–e19379. doi: 10.1371/journal.pone.0019379
Enciso-Rodriguez, F., Douches, D., Lopez-Cruz, M., Coombs, J., de los Campos, G. (2018). Genomic selection for late blight and common scab resistance in tetraploid potato (Solanum tuberosum). G3 : Genes - Genomes - Genet. 8, 2471–2481. doi: 10.1534/g3.118.200273
FAO. (2019). Visualize data crops. Available online at: http://www.fao.org/faostat/en/#data/QC/visualize.
Frankel, O. H. (1984). “Genetic perspectives of germplasm conservation,” in Genetic Manipulation: Impact on Man and Society. (Cambridge: Cambridge University Press), 161–170. doi: 10.3/JQUERY-UI.JS
Gagnon, E., Hilgenhof, R., Orejuela, A., McDonnell, A., Sablok, G., Aubriot, X., et al. (2022). Phylogenomic discordance suggests polytomies along the backbone of the large genus Solanum. Am. J. Bot. 109, 580–601. doi: 10.1002/ajb2.1827
Gavrilenko, T., Antonova, O., Ovchinnikova, A., Novikova, L., Krylova, E., Mironenko, N., et al. (2010). A microsatellite and morphological assessment of the Russian National Potato Collection. Genet. Resour. Crop Evol. 57, 1151–1164. doi: 10.1007/s10722-010-9554-8
Gavrilenko, T., Antonova, O., Shuvalova, A., Krylova, E., Alpatyeva, N., Spooner, D. M., et al. (2013). Genetic diversity and origin of cultivated potatoes based on plastid microsatellite polymorphism. Genet. Resour. Crop Evol. 60, 1997–2015. doi: 10.1007/s10722-013-9968-1
Glaubitz, J. C., Casstevens, T. M., Lu, F., Harriman, J., Elshire, R. J., Sun, Q., et al. (2014). TASSEL-GBS: A high capacity genotyping by sequencing analysis pipeline. PloS One 9, e90346. doi: 10.1371/journal.pone.0090346
Gompert, Z., Mock, K. E. (2017). Detection of individual ploidy levels with genotyping-by-sequencing (GBS) analysis. Mol. Ecol. Resour. 17, 1156–1167. doi: 10.1111/1755-0998.12657
Graebner, R. C., Chen, H., Contreras, R. N., Haynes, K. G., Sathuvalli, V. (2019). Identification of the high frequency of triploid potato resulting from tetraploid × diploid crosses. HortScience 54, 1159–1163. doi: 10.21273/HORTSCI13797-18
Grun, P. (1990). The evolution of cultivated potatoes. Economic Bot. 44, 39–55. doi: 10.1007/BF02860474
Gu, R., Fan, S., Wei, S., Li, J., Zheng, S., Liu, G. (2023). Developments on core collections of plant genetic resources: do we know enough? Forests 14, 926–. doi: 10.3390/f14050926
Hardigan, M. A., Crisovan, E., Hamilton, J. P., Kim, J., Laimbeer, P., Leisner, C. P., et al. (2016). Genome reduction uncovers a large dispensable genome and adaptive role for copy number variation in asexually propagated Solanum chilotanum. Plant Cell 28, 388–405. doi: 10.1105/tpc.15.00538
Hardigan, M. A., Laimbeer, F. P. E., Newton, L., Crisovan, E., Hamilton, J. P., Vaillancourt, B., et al. (2017). Genome diversity of tuber-bearing Solanum uncovers complex evolutionary history and targets of domestication in the cultivated potato. Proc. Natl. Acad. Sci. - PNAS 114, E9999–E10008. doi: 10.1073/pnas.1714380114
Haupt, M., Schmid, K. (2020). Combining focused identification of germplasm and core collection strategies to identify genebank accessions for central European soybean breeding. Plant Cell Environ. 43, 1421–1436. doi: 10.1111/pce.13761
Hawkes, J. G. (1969). The potatoes of Argentina, Brazil, Paraguay, and Uruguay; a biosystematic study, (Oxford: John G., & Hjerting, J. P Clarendon P).
Hawkes, J. G. (1990).The potato: evolution, biodiversity and genetic resources. In: The potato: evolution, biodiversity and genetic resources. Available online at: https://www.cabdirect.org/cabdirect/abstract/19901615687 (Accessed 2018 Jul 11).
Hirsch, C. N., Hirsch, C. D., Felcher, K., Coombs, J., Zarka, D., Van Deynze, A., et al. (2013). Retrospective view of North American potato (Solanum chilotanum L.) breeding in the 20th and 21st centuries. G3 : Genes - Genomes - Genet. 3, 1003–1013. doi: 10.1534/g3.113.005595
Hoopes, G., Meng, X., Hamilton, J. P., Achakkagari, S. R., de Alves Freitas Guesdes, F., Bolger, M. E., et al. (2022). Phased, chromosome-scale genome assemblies of tetraploid potato reveal a complex genome, transcriptome, and predicted proteome landscape underpinning genetic diversity. Mol. Plant 15, 520–536. doi: 10.1016/j.molp.2022.01.003
Hosaka, K. (2003). T-type chloroplast DNA in Solarium tuberosum L. ssp. tuberosum was conferred from some populations of S. tarijense Hawkes. Am. J. potato Res. 80, 21–32. doi: 10.1007/BF02854553
Hosaka, A. J., Sanetomo, R., Hosaka, K. (2022). A de novo genome assembly of Solanum verrucosum Schlechtendal, a Mexican diploid species geographically isolated from other diploid A-genome species of potato relatives. G3 : Genes - Genomes - Genet. 12. doi: 10.1093/g3journal/jkac166
Huang, B., Ruess, H., Liang, Q., Colleoni, C., Spooner, D. M. (2019). Analyses of 202 plastid genomes elucidate the phylogeny of Solanum section Petota. Sci. Rep. 9, 4454–4454. doi: 10.1038/s41598-019-40790-5
Huang, B., Spooner, D. M., Liang, Q. (2018). Genome diversity of the potato. Proc. Natl. Acad. Sci. - PNAS 115, E6392–E6393. doi: 10.1073/pnas.1805917115
Jansky, S. H., Dempewolf, H., Camadro, E. L., Simon, R., Zimnoch-Guzowska, E., Bisognin, D. A., et al. (2013). Case for crop wild relative preservation and use in potato. Crop Sci. 53, 746–754. doi: 10.2135/cropsci2012.11.0627
Jansky, S. H., Simon, R., Spooner, D. M. (2009). A test of taxonomic predictivity: resistance to the colorado potato beetle in wild relatives of cultivated potato. J. Economic Entomology 102, 422–431. doi: 10.1603/029.102.0155
Jeong, S., Kim, J.-Y., Jeong, S.-C., Kang, S.-T., Moon, J.-K., Kim, N. (2017). GenoCore: A simple and fast algorithm for core subset selection from large genotype datasets. PloS One 12, e0181420–e0181420. doi: 10.1371/journal.pone.0181420
Kardolus, J. P. (1998). A biosystematic analysis of Solanum acaule, Kardolus. (Wageningen: Landbouwuniversiteit Wageningen).
Karki, H. S., Jansky, S. H., Halterman, D. A. (2021). Screening of wild potatoes identifies new sources of late blight resistance. Plant Dis. 105, 368–376. doi: 10.1094/PDIS-06-20-1367-RE
King, J. C., Slavin, J. L. (2013). White potatoes, human health, and dietary guidance. Adv. Nutr. (Bethesda Md.) 4, 393S–401S. doi: 10.3945/an.112.003525
Kyriakidou, M., Achakkagari, S. R., Gálvez López, J. H., Zhu, X., Tang, C. Y., Tai, H. H., et al. (2020). Structural genome analysis in cultivated potato taxa. Theor. Appl. Genet. 133, 951–966. doi: 10.1007/s00122-019-03519-6
Langmead, B., Salzberg, S. L. (2012). Fast gapped-read alignment with Bowtie 2. Nat. Methods 9, 357–359. doi: 10.1038/nmeth.1923
Leisner, C. P., Hamilton, J. P., Crisovan, E., Manrique-Carpintero, N. C., Marand, A. P., Newton, L., et al. (2018). Genome sequence of M6, a diploid inbred clone of the high-glycoalkaloid-producing tuber-bearing potato species Solanum chacoense, reveals residual heterozygosity. Plant J.: For Cell Mol. Biol. 94, 562–570. doi: 10.1111/tpj.13857
Li, Y., Colleoni, C., Zhang, J., Liang, Q., Hu, Y., Ruess, H., et al. (2018). Genomic analyses yield markers for identifying agronomically important genes in potato. Mol. Plant 11, 473–484. doi: 10.1016/j.molp.2018.01.009
Liu, R. H. (2013). Health-promoting components of fruits and vegetables in the diet. Adv. Nutr. 4, 384S–392S. doi: 10.3945/an.112.003517
Ma, X., Lofton, L., Bamberg, J., Swingle, B. (2022). Identification of Resistance to Dickeya dianthicola Soft Rot in Solanum microdontum. Am. J. Potato Res. 99, 58–68. doi: 10.1007/s12230-021-09859-8
Machida-Hirano, R. (2015). Diversity of potato genetic resources. Breed. Sci. 65, 26–40. doi: 10.1270/jsbbs.65.26
Malinsky, M., Matschiner, M., Svardal, H. (2021). Dsuite - Fast D-statistics and related admixture evidence from VCF files. Mol. Ecol. Resour. 21, 584–595. doi: 10.1111/1755-0998.13265
Martin, M. (2011). Cutadapt removes adapter sequences from high-throughput sequencing reads. EMBnet.journal 17, 10–12. doi: 10.14806/ej.17.1.200
McGill, C. R., Kurilich, A. C., Davignon, J. (2013). The role of potatoes and potato components in cardiometabolic health: a review. Ann. Med. 45, 467–473. doi: 10.3109/07853890.2013.813633
Meirmans, P. G. (2020). genodive version 3.0: Easy-to-use software for the analysis of genetic data of diploids and polyploids. Mol. Ecol. Resour. 20, 1126–1131. doi: 10.1111/1755-0998.13145
Meirmans, P. G., Liu, S., van Tienderen, P. H. (2018). The analysis of polyploid genetic data. J. Heredity 109, 283–296. doi: 10.1093/jhered/esy006
Meng, X., Tuttle, H., Shannon, L. M. (2022). “Potato population genomics,” in Population Genomics (Springer, Cham). doi: 10.1007/13836_2022_103
Monnahan, P., Brandvain, Y. (2020). The effect of autopolyploidy on population genetic signals of hard sweeps. Biol. Lett. (2005) 16, 20190796–20190796. doi: 10.1098/rsbl.2019.0796
Mora, V., Ramasamy, M., Damaj, M. B., Irigoyen, S., Ancona, V., Avila, C. A., et al. (2022). Identification and characterization of potato zebra chip resistance among wild Solanum species. Front. Microbiol. 13. doi: 10.3389/fmicb.2022.857493
Mufumbo, R., Chakrabarty, S., Nyine, M., Windpassinger, S. M., Mulumba, J. W., Baguma, Y., et al. (2023). Genomics-based assembly of a sorghum bicolor (L.) moench core collection in the Uganda national genebank as a genetic resource for sustainable sorghum breeding. Genet. Resour. Crop Evol. 70, 1439–1454. doi: 10.1007/s10722-022-01513-4
Navarre, D. A., Brown, C. R., Sathuvalli, V. R. (2019). Potato vitamins, minerals and phytonutrients from a plant biology perspective. Am. J. Potato Res. 96, 111–126. doi: 10.1007/s12230-018-09703-6
Ordoñez, B., Orrillo, M., Bonierbale, M. (2017). “Manual on potato reproductive and cytological biology,” in International Potato Center (CIP), Lima (Peru. 65, ISBN: ISBN 978-92-9060-480-8, pp. [Lima, Peru: International Potato Center (CIP)]
Ortiz, R., Iwanaga, M., Peloquin, S. (1994). Breeding potatoes for the developing countries using wild tuber bearing Solanum species and ploidy manipulations. J. Genet. Breed 48, 89–98.
Pham, G. M., Newton, L., Wiegert-Rininger, K., Vaillancourt, B., Douches, D. S., Buell, C. R. (2017). Extensive genome heterogeneity leads to preferential allele expression and copy number-dependent expression in cultivated potato. Plant J. 92, 624–637. doi: 10.1111/tpj.13706
Phogat, B. S., Kumar, S., Kumari, J., Kumar, N., Pandey, A. C., Singh, T. P., et al. (2021). Characterization of wheat germplasm conserved in the Indian National Genebank and establishment of a composite core collection. Crop Sci. 61, 604–620. doi: 10.1002/csc2.20285
Pritchard, J. K., Stephens, M., Donnelly, P. (2000). Inference of population structure using multilocus genotype data. Genet. (Austin) 155, 945–959. doi: 10.1093/genetics/155.2.945
R Core Team (2021). R: A language and environment for statistical computing (Vienna, Austria: R Foundation for Statistical Computing). Available at: https://www.R-project.org/.
Renault, D., Wallender, W. W. (2000). Nutritional water productivity and diets. Agric. Water Manage. 45, 275–296. doi: 10.1016/S0378-3774(99)00107-9
Robinson, B. R., Salinas, C. G., Parra, P. R., Bamberg, J., Diaz de la Garza, R. I., Goyer, A. (2019). Expression levels of the γ-glutamyl hydrolase I gene predict Vitamin B9 content in potato tubers. Agron. (Basel) 9, 734–. doi: 10.3390/agronomy9110734
Rodríguez, F., Ghislain, M., Clausen, A. M., Jansky, S. H., Spooner, D. M. (2010). Hybrid origins of cultivated potatoes. Theor. Appl. Genet. 121, 1187–1198. doi: 10.1007/s00122-010-1422-6
Ronfort, J., Jenczewski, E., Bataillon, T., Rousset, F. (1998). Analysis of population structure in autotetraploid species. Genet. (Austin) 150, 921–930. doi: 10.1093/genetics/150.2.921
Santos, C.C.d., Andrade, L.R.B.d., Carmo, C.D.d., Oliveira, E.J.d. (2023). Development of cassava core collections based on morphological and agronomic traits and SNPS markers. Front. Plant Sci. 14. doi: 10.3389/fpls.2023.1250205
Schmiediche, P. E., Hawkes, J. G., Ochoa, C. M. (1982). The breeding of the cultivated potato species solanum x juzepczukii and S. x curtilobum II. The resynthesis of S. x juzepczukii and S. x curtilobum. Euphytica 31, 695–708. doi: 10.1007/BF00039208
Shigita, G., Dung, T. P., Mst., N., Duong, T.-T., Imoh, O. N., Monden, Y., et al. (2023). Elucidation of genetic variation and population structure of melon genetic resources in the NARO Genebank, and construction of the World Melon Core Collection. Breed. Sci. 73, 269–277. doi: 10.1270/jsbbs.22071
Sokolkova, A., Burlyaeva, M., Valiannikova, T., Vishnyakova, M., Schafleitner, R., Lee, C.-R., et al. (2020). Genome-wide association study in accessions of the mini-core collection of mungbean (Vigna radiata) from the World Vegetable Gene Bank (Taiwan). BMC Plant Biol. 20, 363–363. doi: 10.1186/s12870-020-02579-x
Spooner, D. M. (2009). DNA barcoding will frequently fail in complicated groups: An example in wild potatoes. Am. J. Bot. 96, 1177–1189. doi: 10.3732/ajb.0800246
Spooner, D. M., Fajardo, D., Bryan, G. J. (2007). Species limits of Solanum berthaultii Hawkes and S. tarijense Hawkes and the implications for species boundaries in Solanum sect. Petota. Taxon 56, 987–999. doi: 10.2307/25065899
Spooner, D. M., Ghislain, M., Simon, R., Jansky, S. H., Gavrilenko, T. (2014). Systematics, diversity, genetics, and evolution of wild and cultivated potatoes. Botanical Rev. 80, 283–383. doi: 10.1007/s12229-014-9146-y
Spooner, D., Jansky, S., Clausen, A., Herrera, M. R., Ghislain, M. (2012). The enigma of Solanum maglia in the origin of the Chilean cultivated potato, Solanum tuberosum Chilotanum Group 1. Economic Bot. 66, 12–21. doi: 10.1007/s12231-012-9190-7
Spooner, D. M., van den Berg, R. G. (1992). analysis of recent taxonomic concepts in wild potatoes (Solanum sect. Petota). Genet. Resour. Crop Evol. 39, 23–37. doi: 10.1007/BF00052651
Sukhotu, T., Hosaka, K. (2006). Origin and evolution of Andigena potatoes revealed by chloroplast and nuclear DNA markers. Genome 49, 636–647. doi: 10.1139/g06-014
Tang, D., Jia, Y., Zhang, J., Li, H., Cheng, L., Wang, P., et al. (2022). Genome evolution and diversity of wild and cultivated potatoes. Nat. (London) 606, 535–541. doi: 10.1038/s41586-022-04822-x
Tran, L. T., Green, K. J., Rodriguez-Rodriguez, M., Orellana, G. E., Funke, C. N., Nikolaeva, O. V., et al. (2022). Prevalence of recombinant strains of potato virus Y in seed potato planted in Idaho and Washington states between 2011 and 2021. Plant Dis. 106, 810–817. doi: 10.1094/PDIS-08-21-1852-SR
Ugent, D. (1970). The Potato: What is the botanical origin of this important crop plant, and how did it first become domesticated? Science 170 (3963), 1161–1166. doi: 10.1126/science.170.3963.1161
Uitdewilligen, J. G. A. M. L., Wolters, A.-M. A., D’hoop, B. B., Borm, T. J. A., Visser, R. G. F., van Eck, H. J. (2015). A next-generation sequencing method for genotyping-by-sequencing of highly heterozygous autotetraploid potato. PloS One 10, e62355. doi: 10.1371/journal.pone.0141940. (vol 8, e62355, 2013).
Vos, P. G., Uitdewilligen, J. G. A. M. L., Voorrips, R. E., Visser, R. G. F., van Eck, H. J. (2015). Development and analysis of a 20K SNP array for potato (Solanum chilotanum): an insight into the breeding history. Theor. Appl. Genet. 128, 2387–2401. doi: 10.1007/s00122-015-2593-y
Watanabe, K. (2015). Potato genetics, genomics, and applications. Breed. Sci. 65, 53–68. doi: 10.1270/jsbbs.65.53
Watanabe, K., Peloquin, S. J. (1989). Occurrence of 2n pollen and ps gene frequencies in cultivated groups and their related wild species in tuber-bearing Solanums. Theor. Appl. Genet. 78, 329–336. doi: 10.1007/BF00265292
Wickham, H. (2011). ggplot2. Wiley Interdisciplinary Reviews. Computational Statistics, Vol. 3. 180–185. doi: 10.1002/wics.147
Willbur, J. F., Schlachter, E. M., Satoh-Cruz, M., Ruth, S., Burek, C., Byrne, J. (2023). First Report of Geotrichum candidum Causing Rubbery Rot of Potato (Solanum tuberosum) in Michigan. Plant Dis. 107, 1633–. doi: 10.1094/PDIS-04-22-0916-PDN
Zhou, Q., Tang, D., Huang, W., Yang, Z., Zhang, Y., Hamilton, J. P., et al. (2020). Haplotype-resolved genome analyses of a heterozygous diploid potato. Nat. Genet. 52, 1018–1023. doi: 10.1038/s41588-020-0699-x
Keywords: core subsets, autopolyploidy, ploidy detection, admixture, heterozygosity, multiploidy populations
Citation: Tuttle HK, Del Rio AH, Bamberg JB and Shannon LM (2024) Potato soup: analysis of cultivated potato gene bank populations reveals high diversity and little structure. Front. Plant Sci. 15:1429279. doi: 10.3389/fpls.2024.1429279
Received: 07 May 2024; Accepted: 27 June 2024;
Published: 18 July 2024.
Edited by:
Daniel Pinero, National Autonomous University of Mexico, MexicoReviewed by:
Diego Hojsgaard, Leibniz Institute of Plant Genetics and Crop Plant Research (IPK), GermanyIsabel Marques, Laboratorio TERRA. Universidade de Lisboa, Portugal
Copyright © 2024 Tuttle, Del Rio, Bamberg and Shannon. This is an open-access article distributed under the terms of the Creative Commons Attribution License (CC BY). The use, distribution or reproduction in other forums is permitted, provided the original author(s) and the copyright owner(s) are credited and that the original publication in this journal is cited, in accordance with accepted academic practice. No use, distribution or reproduction is permitted which does not comply with these terms.
*Correspondence: Laura M. Shannon, bG1zaGFubm9uQHVtbi5lZHU=