 Xinsheng Zhu1Tianbao Huang1Ziyang Liu1Lang Bai1Yongfeng Yang2Jinsheng Ye3Qiulai Wang3
 Ram P. Sharma4
 Liyong Fu1*
- 1Research Institute of Forest Resource Information Techniques, Chinese Academy of Forestry, Beijing, China
- 2Hanan Sanya Urban Ecosystem Observation and Research, Staton, Academy of Inventory and Planning, National Forestry and Grassland Administration, Beijing, China
- 3Guangdong Forestry Survey and Planning Institute, Guangzhou, China
- 4Institute of Forestry, Tribhuvan University, Kathmandu, Nepal
Introduction: Chinese fir (Cunninghamia lanceolata) is a crucial afforestation and timber species in southern China. Accurate estimation of its stand biomass is vital for forest resource assessment, ecological industry development, and ecosystem management. However, traditional biomass prediction methods often face limitations in terms of accuracy and efficiency, highlighting the need for more robust modeling approaches.
Methods: This study utilized data from 154 forest stands in Guangdong Province to develop biomass regression models that incorporate random effects and dummy variables. The models were based on airborne LiDAR-derived metrics. Among 41 highly correlated LiDAR variables, only two—5% cumulative height percentile and leaf area index—were retained in the final model.
Results: The results revealed that the logistic mixed-effects model was the most effective for estimating leaf biomass, while the empirical mixed-effects model was better suited for other biomass components. Nonlinear models outperformed linear models, with the nonlinear mixed-effects model (incorporating stand age as a random effect) achieving the highest predictive accuracy. Furthermore, machine learning techniques further improved model performance (R² = 0.855 to 0.939). Validation with independent test samples confirmed the robustness and reliability of the nonlinear mixed-effects model.
Discussion: This study highlights the effectiveness of airborne LiDAR data in providing efficient and precise estimates of stand biomass. It also emphasizes the significant role of stand developmental stages in biomass modeling. The findings contribute to the development of a rigorous and scalable framework for large-scale artificial forest biomass estimation, which has important implications for forest resource monitoring, ecological industry development, and ecosystem management strategies.
1 Introduction
As the primary component of terrestrial ecosystems, forest ecosystems exhibit high productivity, biomass, and biodiversity, playing a crucial and irreplaceable role in global ecosystems as well as in human economic and social development (Song et al., 2011; Liu et al., 2015; Organization, A, 2017). Biomass serves as the foundational energy source and nutrient reservoir for the functioning of forest ecosystems, making it one of the most fundamental indicators of their health (Zhao et al., 2016). Additionally, biomass is a significant contributor to the stability of terrestrial ecosystems. Accurately estimating forest biomass and quantitatively analyzing forestry and forest system issues is essential for evaluating the health status of forest ecosystems and for studying forest carbon cycling (He et al., 2013; Stovall et al., 2017). Cunninghamia lanceolata has the advantages of strong adaptability, barren tolerance, rapid growth, low afforestation cost and easy management. It is an important commercial timber tree species in the subtropical region of southern China. The planting area accounts for about 20% of the total amount of China’s plantations, and plays an important role in wood production and forest carbon sequestration (Zhou et al., 2021; Guo et al., 2022). Accurately estimating its biomass is of great significance for forest resource assessment, ecological industry development, and refined forestry management.
Traditional ground survey methods for estimating forest biomass are constrained by human factors, making them inefficient, time-consuming, and incapable of collecting data on a regional or larger scale (Di et al., 2016; Mutwiri et al., 2017). In contrast, the rapid advancement of remote sensing technology allows for the swift acquisition of large-scale, high-temporal data, significantly enhancing forest resource monitoring capabilities (Eisfelder et al., 2012). Optical remote sensing data can quickly and accurately capture large-scale forest growth factors and ecological information, providing valuable support for forest resource management. However, optical remote sensing is limited to obtaining horizontal structural information of forests and does not provide access to three-dimensional structural data (Mao et al., 2022). Compared to traditional field surveying and optical remote sensing technology, LiDAR (Light Detection and Ranging) uses high-frequency laser pulses actively directed at the target to directly obtain precise three-dimensional spatial coordinates and echo information of forest trees, offering advantages such as accurate positioning, high penetration rate, and direct measurement of height. This is beneficial for determining vegetation structure characteristics and estimating biomass at both individual tree and stand scales (Tang et al., 2012; Beland et al., 2019). Currently, LiDAR technology is divided into three types based on the sensor platform: satellite-based, airborne, and ground-based. Airborne LiDAR, due to its low cost, high timeliness, high spatiotemporal resolution, and high mobility, has garnered more attention in forest resource surveys (Maltamo et al., 2004; Noordermeer et al., 2018). In recent years, some European and American countries have begun using airborne LiDAR for large-scale forest resource surveys (Pawe et al., 2017). Studies have shown that it significantly improves the accuracy of forest structural parameter extraction and achieves reliable performance in biomass estimation across various forest types (Pawe et al., 2017; Zhang et al., 2024).
Establishing reliable and accurate biomass inversion models, grounded in the strong correlation between forest biomass and structural parameters, is essential for the effective application of airborne LiDAR technology in forest resource surveys. Currently, biomass inversion primarily relies on regression models, which can be categorized into parametric and non-parametric models. Parametric models are mostly linear regressions (LR), Logistic regressions, etc., while non-parametric models include Support Vector Machines, Random Forests (RF), and more (Zhu et al., 2020; Emilien et al., 2021; Zeng et al., 2021; Xie et al., 2023). Many researchers have analyzed data based on radar variables and stand parameters, achieving good inversion results in biomass estimation for different forest types within specific research areas. The variables extracted from airborne LiDAR data mainly consist of height characteristics and canopy characteristics (Lim and Treitz, 2004). Wallace et al. used UAV LiDAR systems for forest stand structure assessment, exploring the potential of UAVs in measuring and monitoring forest structural characteristics (Wallace et al., 2016). Xie et al. analyzed the vertical structure of subtropical evergreen broadleaf forest communities using UAV LiDAR technology, effectively extracting canopy height and tree location information (Xie et al., 2020). Xu et al. used UAV imagery and LiDAR point clouds to estimate forest stand characteristic variables in subtropical natural secondary forests, while Yuan used airborne LiDAR technology to estimate the accumulation models of four typical coniferous forests (Korean pine, Larch, Red pine, and Spruce) in the Northeast forest region, finding that point cloud height variables contributed the most to biomass models (Xu et al., 2015; Yuan et al., 2021). These studies indicate that LiDAR-derived feature variables can estimate and invert forest structure parameters at the stand scale, but the optimal biomass model varies with the scope and purpose of the survey.
Recent studies integrating LiDAR technology with biomass estimation of Cunninghamia lanceolata have primarily focused on optimal single-tree segmentation, height growth prediction, and carbon storage estimation. The structural parameters of Chinese fir extracted using airborne LiDAR generally correspond well with known growth patterns, highlighting the practical value of this approach (Yu et al., 2023; Zhou et al., 2023; Yu et al., 2024). However, current research on Chinese fir biomass remains relatively limited. Existing models often neglect critical factors such as stand age and site conditions, which can introduce significant bias into biomass estimates. Furthermore, most available models concentrate on total tree biomass, with limited attention given to individual tree components (Guo et al., 2022). To improve model precision and applicability, it is essential to account for varying stand developmental stages and to incorporate a broader range of variables that capture both intra- and inter-group variation, thereby better elucidating the influence of stand structure on biomass accumulation. This study addresses these gaps by focusing on Chinese fir plantations across eight regions in Guangdong Province. Utilizing high-density UAV LiDAR point cloud data, the research extracts 57 forest structural variables—including height, intensity, canopy cover, and leaf area index. The objectives are threefold: (1) to assess the predictive utility of elevation, density, and intensity metrics derived from LiDAR data; (2) to construct age-group-specific biomass models for different tree components; and (3) to evaluate and compare the accuracy of various modeling approaches to identify the most effective estimation strategy. By systematically analyzing the influence of stand developmental stages on biomass modeling for Cunninghamia lanceolata, this study aims to enhance estimation accuracy and provide a scientifically rigorous framework for large-scale forest carbon stock assessment, precision forestry, and sustainable ecosystem management.
2 Materials and methods
2.1 Study area
The study area is located in the northern and central parts of the Nanling Mountains in Guangdong Province, China. The geographical coordinates range from 23°2′12″N to 25°17′29″N and 111°22′55″E to 115°4′54″E (Figure 1). This region is a major distribution area of Chinese fir, where the species has been cultivated for many years. The presence of well-established stands across various age groups provides an ideal setting for research and development. The terrain is generally higher in the north and lower in the south, with mountains and high hills in the north and plains and terraces in the south. The elevation ranges from 53 m to 580 m, and the annual rainfall is between 1300 mm and 2500 mm, belonging to the East Asian subtropical monsoon climate zone (Huang et al., 2022). Sample plots were set up in state-owned forest farms in eight counties (cities) within the region. The soil is mountainous red soil with a slightly acidic pH value and is primarily sandy loam with a thickness of about 50 cm. The main tree species in the forest farms include Cunninghamia lanceolata, Pinus massoniana, and Eucalyptus spp., with pure plantations being predominant.
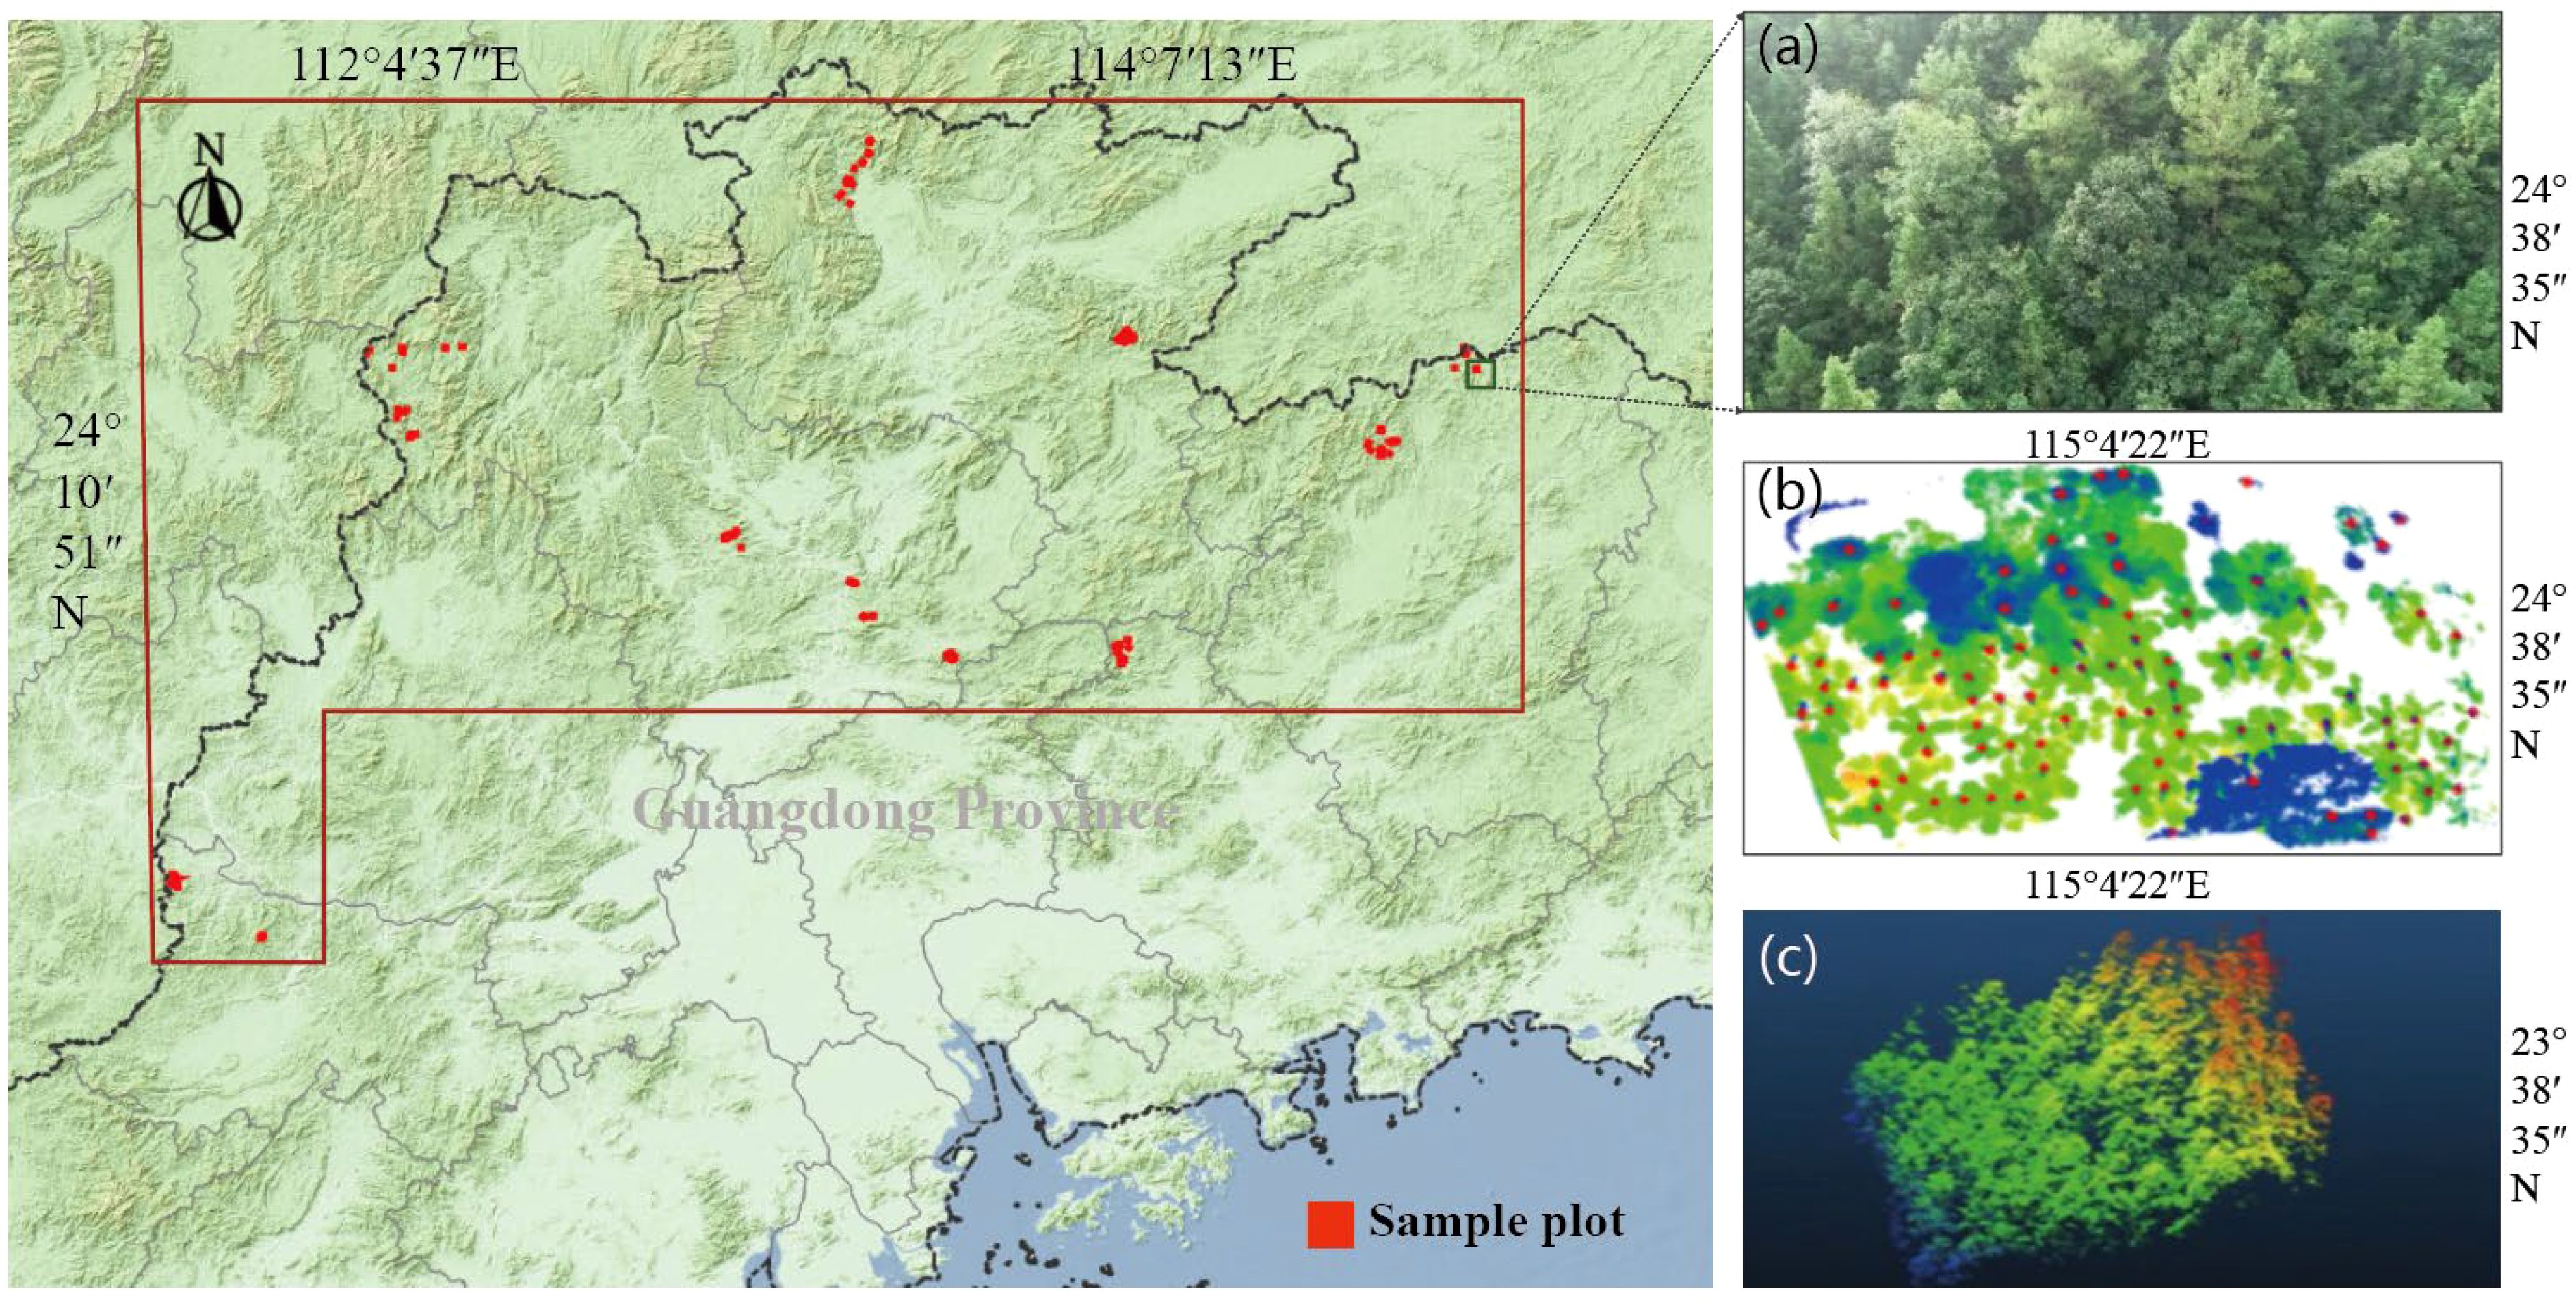
Figure 1. Location of study area and sample distributions across North-central Guangdong, China (subfigures: (a) orthorectified RGB image of the sample plot, (b) single-tree segmentation output derived from canopy analysis, and (c) LiDAR point cloud map of the sample plot).
2.2 Data sources
2.2.1 Sample plots
In September 2023, following a comprehensive reconnaissance of the study area, 154 sample plots of 30 m × 30 m were selected based on forest type, stand age, and management practices. This study considered 33 plots of young forests, 34 of middle-aged forests, 26 of near-mature forests, 34 of mature forests, and 27 of over-mature forests. Real-time kinematic (RTK) GPS was used to obtain the geographical coordinates and elevation data for each tree and plot center. Terrain factors such as topography, slope, and altitude were recorded. All trees with a diameter at breast height (DBH) ≥ 5 cm in the sample plots were measured for tree species, DBH, height, height to the first branch, crown width, and canopy density. DBH was measured using a measuring tape (at a height of 1.3 m from the ground). Total tree height and height to the first branch were measured using a TruPuls 360 laser rangefinder; crown width was measured in two perpendicular directions (east-west and north-south).
Forest biomass estimation based on the tree measurement factors includes above-ground biomass, under-ground biomass, wood biomass, bark biomass, branch biomass, and leaf biomass. above-ground biomass includes all wood biomass and non-wood biomass (leaf, branch, bark, leaf). The allometric growth equation was used to calculate the above-ground biomass and its components in the sample plots (Zeng, 2013; Xiang et al., 2021; Sun et al., 2023). It can be expressed as (Equation 1):
In the formula, , , , and represent the biomass of stand trunk, bark, branches, and leaves components, respectively, measured in kilograms (kg). and are the estimated values of stand aboveground biomass, and underground biomass, while , , and are the ratio functions of bark, branches, and leaves relative to wood biomass, which is set to 1. According to the established standards, the specific calculation formulas are as follows:
,
where D is the average diameter at breast height of the forest stand and H is the average tree height of the forest stand.
2.2.2 Lidar data
UAV-based LiDAR data was acquired in the study area. The flight platform used was a quadcopter drone equipped with the Huace AS-1300HL LiDAR system, operating at a wavelength of 1550 nm with an accuracy of 5 mm. The system had a scanning angle of 330°, an effective scanning field of ±30°, a laser beam divergence of 0.5 mrad, a pulse duration of 3.5 ns, and a side overlap greater than 50%, achieving a point density of approximately 110 points/m². The LiDAR data underwent preprocessing using the commercial software LiDAR360, where it was normalized and classified to generate the Digital Surface Model (DSM), Digital Elevation Model (DEM), and Canopy Height Model (CHM) (Zhang et al., 2016).
Vertical distribution variables of LiDAR point clouds are commonly used for estimating forest biomass. These variables can quantitatively describe the height distribution of vegetation canopies, such as height percentiles, density percentiles, and height statistics (Holmgren, 2004; Næsset and Gobakken, 2005; Zhang et al., 2016). The Leaf Area Index (LAI), which is one of the most fundamental parameters characterizing canopy structure, is defined as half of the total leaf surface area per unit ground area and is calculated from the normalized vegetation points in the point cloud data (White et al., 2015). The point cloud data was denoised and filtered to obtain noise points, ground points, and vegetation points. The classified vegetation points were then normalized for elevation to eliminate the effects of terrain, resulting in a normalized point cloud (Yan et al., 2020). Based on the vector boundaries of sample plots, the normalized point cloud for each plot was clipped, and 57-point cloud feature variables were extracted, including height percentiles, cumulative height percentiles, height statistics, and density percentiles (Table 1).
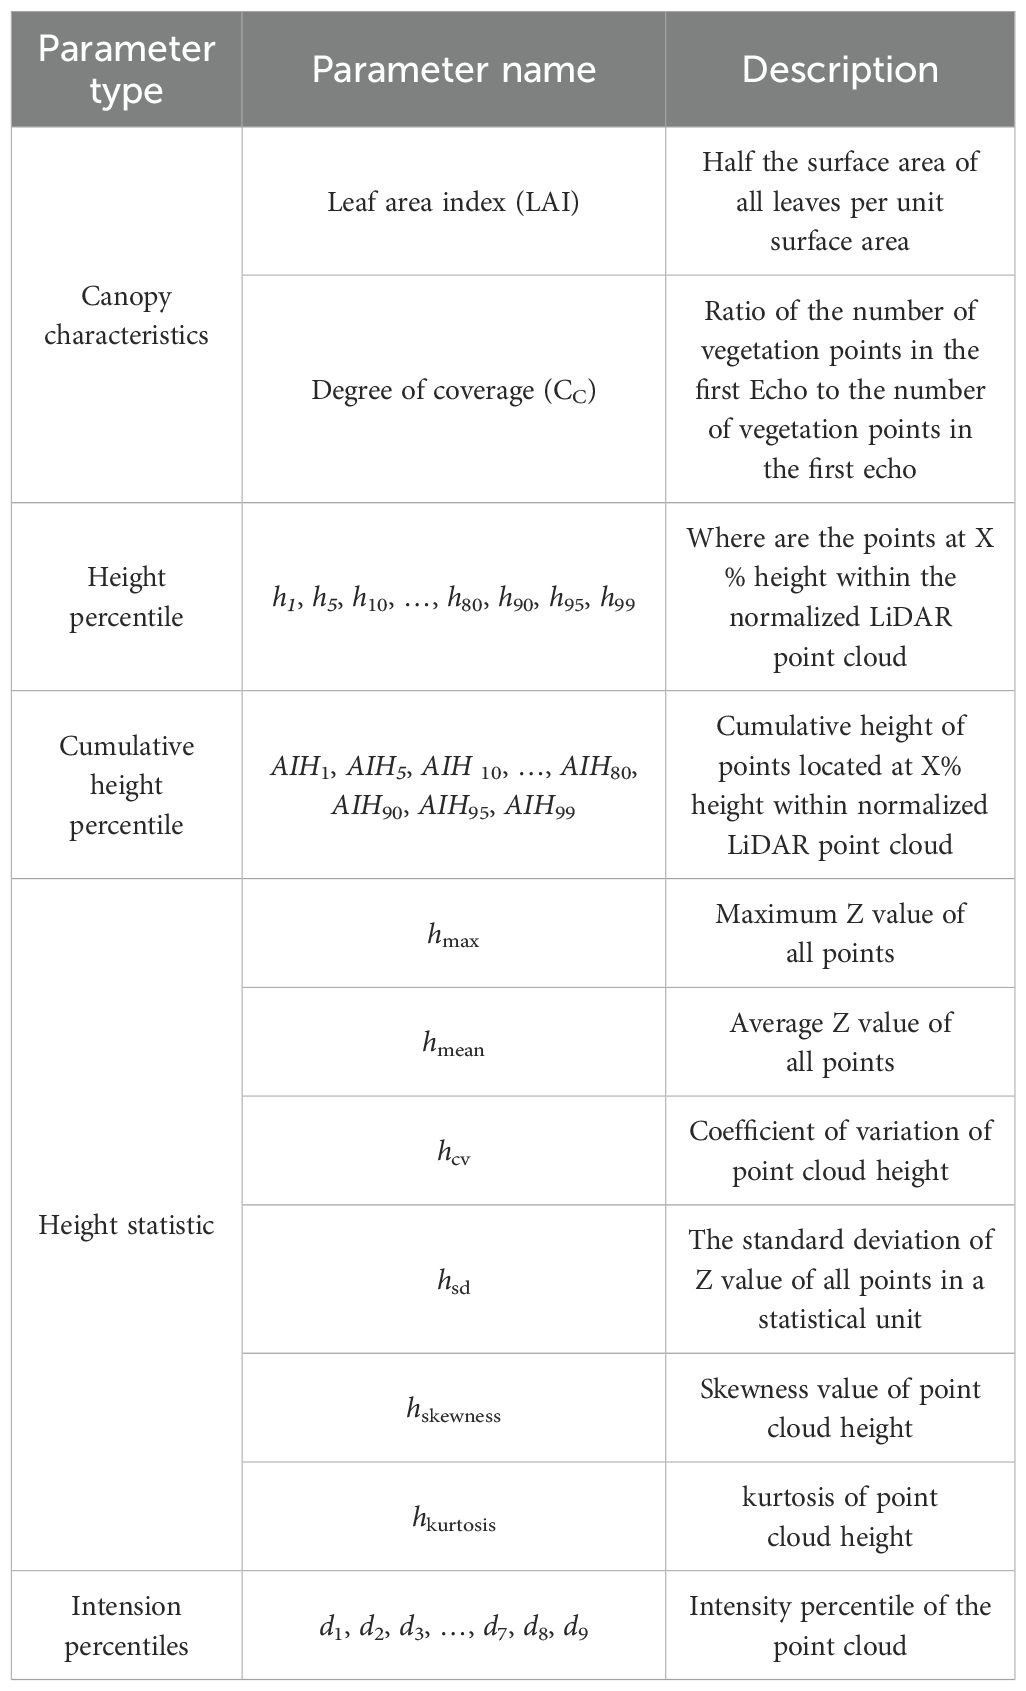
Table 1. Description of LiDAR metrics.
2.3 Model construction
Based on field-measured data of Chinese fir plots and corresponding LiDAR data, univariate and bivariate models were constructed for different stand biomass categories. The optimal biomass model was selected through model comparison, and age groups were further incorporated to develop an inversion model.
2.3.1 Basic model
This study, limited by the available measured sample data, utilized RStudio software to establish biomass estimation models for Chinese fir. A total of 154 samples were selected as the dataset for model development. Widely used biomass models, including linear, logarithmic, exponential, and power functions, were chosen as the basic models to examine the relationship between dependent and independent variables (Andersen et al., 2006; Trofymow et al., 2014) (Table 2). To address the issue of reduced degrees of freedom due to an excessive number of independent variables, a correlation test was used to select variables. To avoid multicollinearity within the models, only variables that significantly contributed to stand biomass were selected. The initial analysis was conducted by fitting the models with the entire dataset, and the optimal basic model was selected based on model evaluation metrics (Chen et al., 2022).
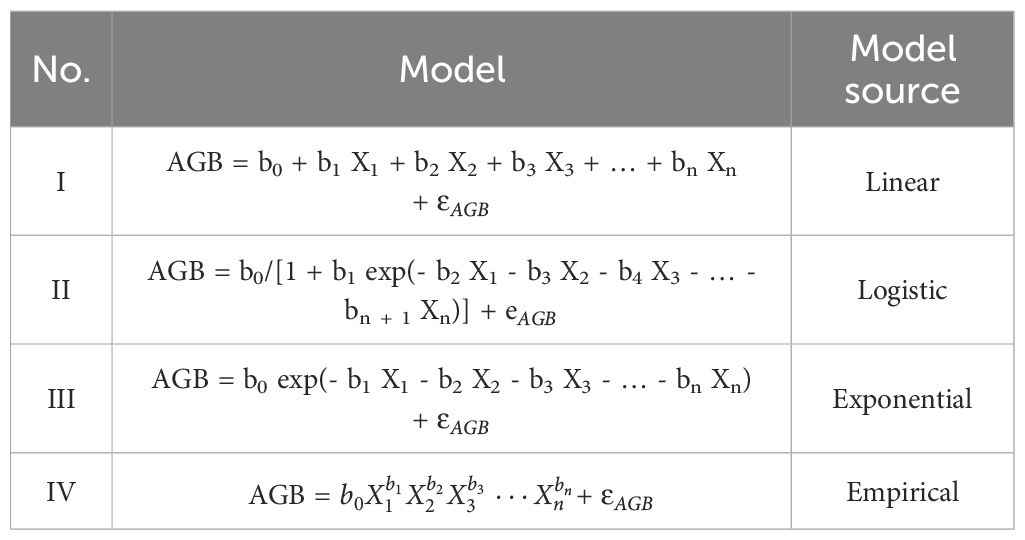
Table 2. Basic model form to describe forest biomass variations.
In the model parameters, AGB is the aboveground biomass calculated by allometric growth equation (Eq. 1), X1,X2, X3, …, Xn are the height variable and intensity variable extracted from lidar LiDAR, b0, b1, b2, …,bn are the parameter to be estimated, represents the error term in each equation.
2.3.2 Nonlinear mixed-effects model
A mixed-effects model was constructed based on the linear and nonlinear relationships between the regression function and both fixed effects and random effects parameters (Pinheiro and Bates, 2000). The general form of a single-level mixed-effects model is as follows (Equation 2):
where: and represent the explanatory variable and response variable for the j plot in the i group, respectively; is the parameter vector; is the error term, assumed to follow a normal distribution; is the aboveground biomass model; and are the design matrices of β and , respectively; is the fixed effects parameter vector; represents the random effect generated by the i group; and are independent of each other; D is the covariance matrix of the random effects.
2.2.3 Dummy variable model
A dummy variable model was introduced to describe the impact of different stand development stages on biomass. All Chinese fir stands in the study area were classified into five stages: young forest, middle-aged forest, near-mature forest, mature forest, and over-mature forest. Corresponding variables =( , , , , )were set to represent these stages. In this approach, variables are assigned values to represent qualitative or categorical data. =(1, 0, 0, 0) represents young forest; =(0, 1, 0, 0)represents middle-aged forest; =(0, 0, 1, 0) represents near-mature forest; =(0, 0, 0, 1) represents mature forest; =(0, 0, 0, 0) represents over-mature forest.
The significance of parameters that include dummy variables was tested using the t-test. If the dummy variable was not significant at a level of α=0.05, it was excluded, and the model was refitted. This process was repeated until all parameters would be significant (Dong et al., 2023).
2.2.4 Random forest
The Random Forest model uses the bootstrap sampling to construct multiple decision trees for regression prediction. The final prediction is generated by aggregating the results of these trees, typically by averaging the predictions for regression problems or taking the mode for classification problems (Dinh et al., 2016; Deng et al., 2023). The feature vector calculation formula for each decision tree in the Random Forest is as follows (Equation 3):
where: j and m are the feature vectors of the decision tree, respectively; is the set of samples of the first child node obtained by splitting feature m on node j, is the sample set of the second child node obtained after splitting feature m on node j; is the actual measured value of the i-th sample; and are the predicted values of stand biomass for and , respectively. The study chose to import the sample biomass data and LiDAR variables for simulation with the help of Random forest function in RStudio to derive the predictions.
2.4 Model accuracy evaluation criteria
The fitting performance of the models was evaluated using coefficient of determination (R²), relative residual, root mean square error (RMSE), and total relative error (TRE) (Fu et al., 2018; Guo et al., 2022). We randomly divided the data into two datasets, with 70% of the data used for model training (108 sample plots) and the other 30% for model validation (46 sample plots).
To further assess the model, verification set covering different age groups were used to obtain the predicted biomass values for these test samples. A linear regression relationship was then established between the predicted values and the observed values, expressed a as y=b+ax, with b corresponding coefficients and R² values. When a is close to 1, b is close to 0, and R2 is high, it indicates minimal bias between predicted and observed values, signifying high prediction accuracy of the model.
where and are the stand biomasses estimated by the allometric equation and predicted by the newly developed biomass model, respectively, and y is the mean biomass by the allometric equation; and n is the number of sample plots; and k is the number of model parameters; and l is the likelihood function value; and , , , TRE and RMSE are the mean bias, variance of bias, coefficient of determination, total relative error and root mean square error, respectively. RMSE is defined as the combination of the mean bias and its variance and is the most important evaluation criterion of the model.
3 Results and analysis
3.1 Statistical results of measured data
Tree height and diameter at breast height (DBH) were measured for 33,628 Chinese fir trees within the sample plots. The results showed that the number of Chinese firs per plot ranged from 39 to 478, with a canopy density between 0.35 and 0.90. The average DBH (calculated using the quadratic mean method) ranged from 6.10 cm to 28.24 cm, and the average tree height ranged from 5.05 m to 21.35 m. The slope of the plots varied between 6°and 37°, with most plots located on eastern slopes. Based on the measured tree height and DBH, the aboveground biomass in the plots was calculated using an allometric growth equation, resulting in a range of 41.92 t/hm² to 523.90 t/hm², with an average value of 228.90 t/hm². Detailed statistical data are presented in Table 3.
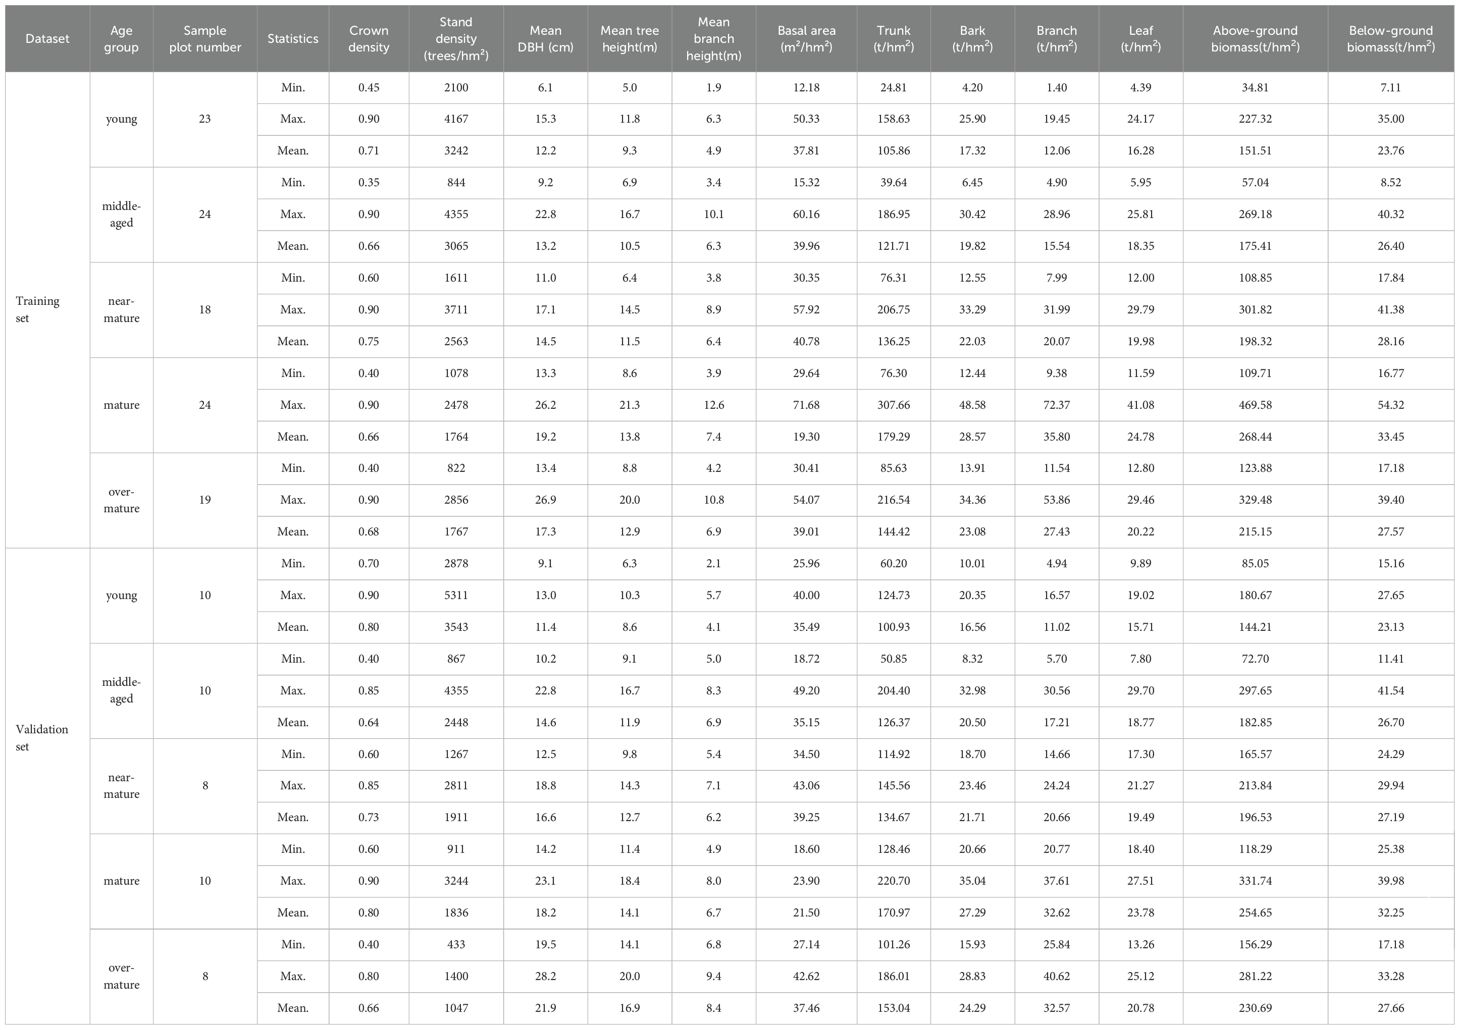
Table 3. Biomass characteristics of all age groups for modeling.
There are differences in parameters such as tree height and biomass across different age groups of Chinese fir. As shown in Figure 2, the biomass of young, middle-aged, near-mature, and mature forests shows an upward trend, while the biomass of over-mature forests slightly decreases compared to mature forests. In terms of dispersion, the biomass distribution within different plots is relatively concentrated for young, near-mature, and mature forests, while it is more scattered among over-mature forests. Regarding outliers, young forests tend to have more instances of extremely low biomass values, while mature forests have more instances of relatively high biomass values.
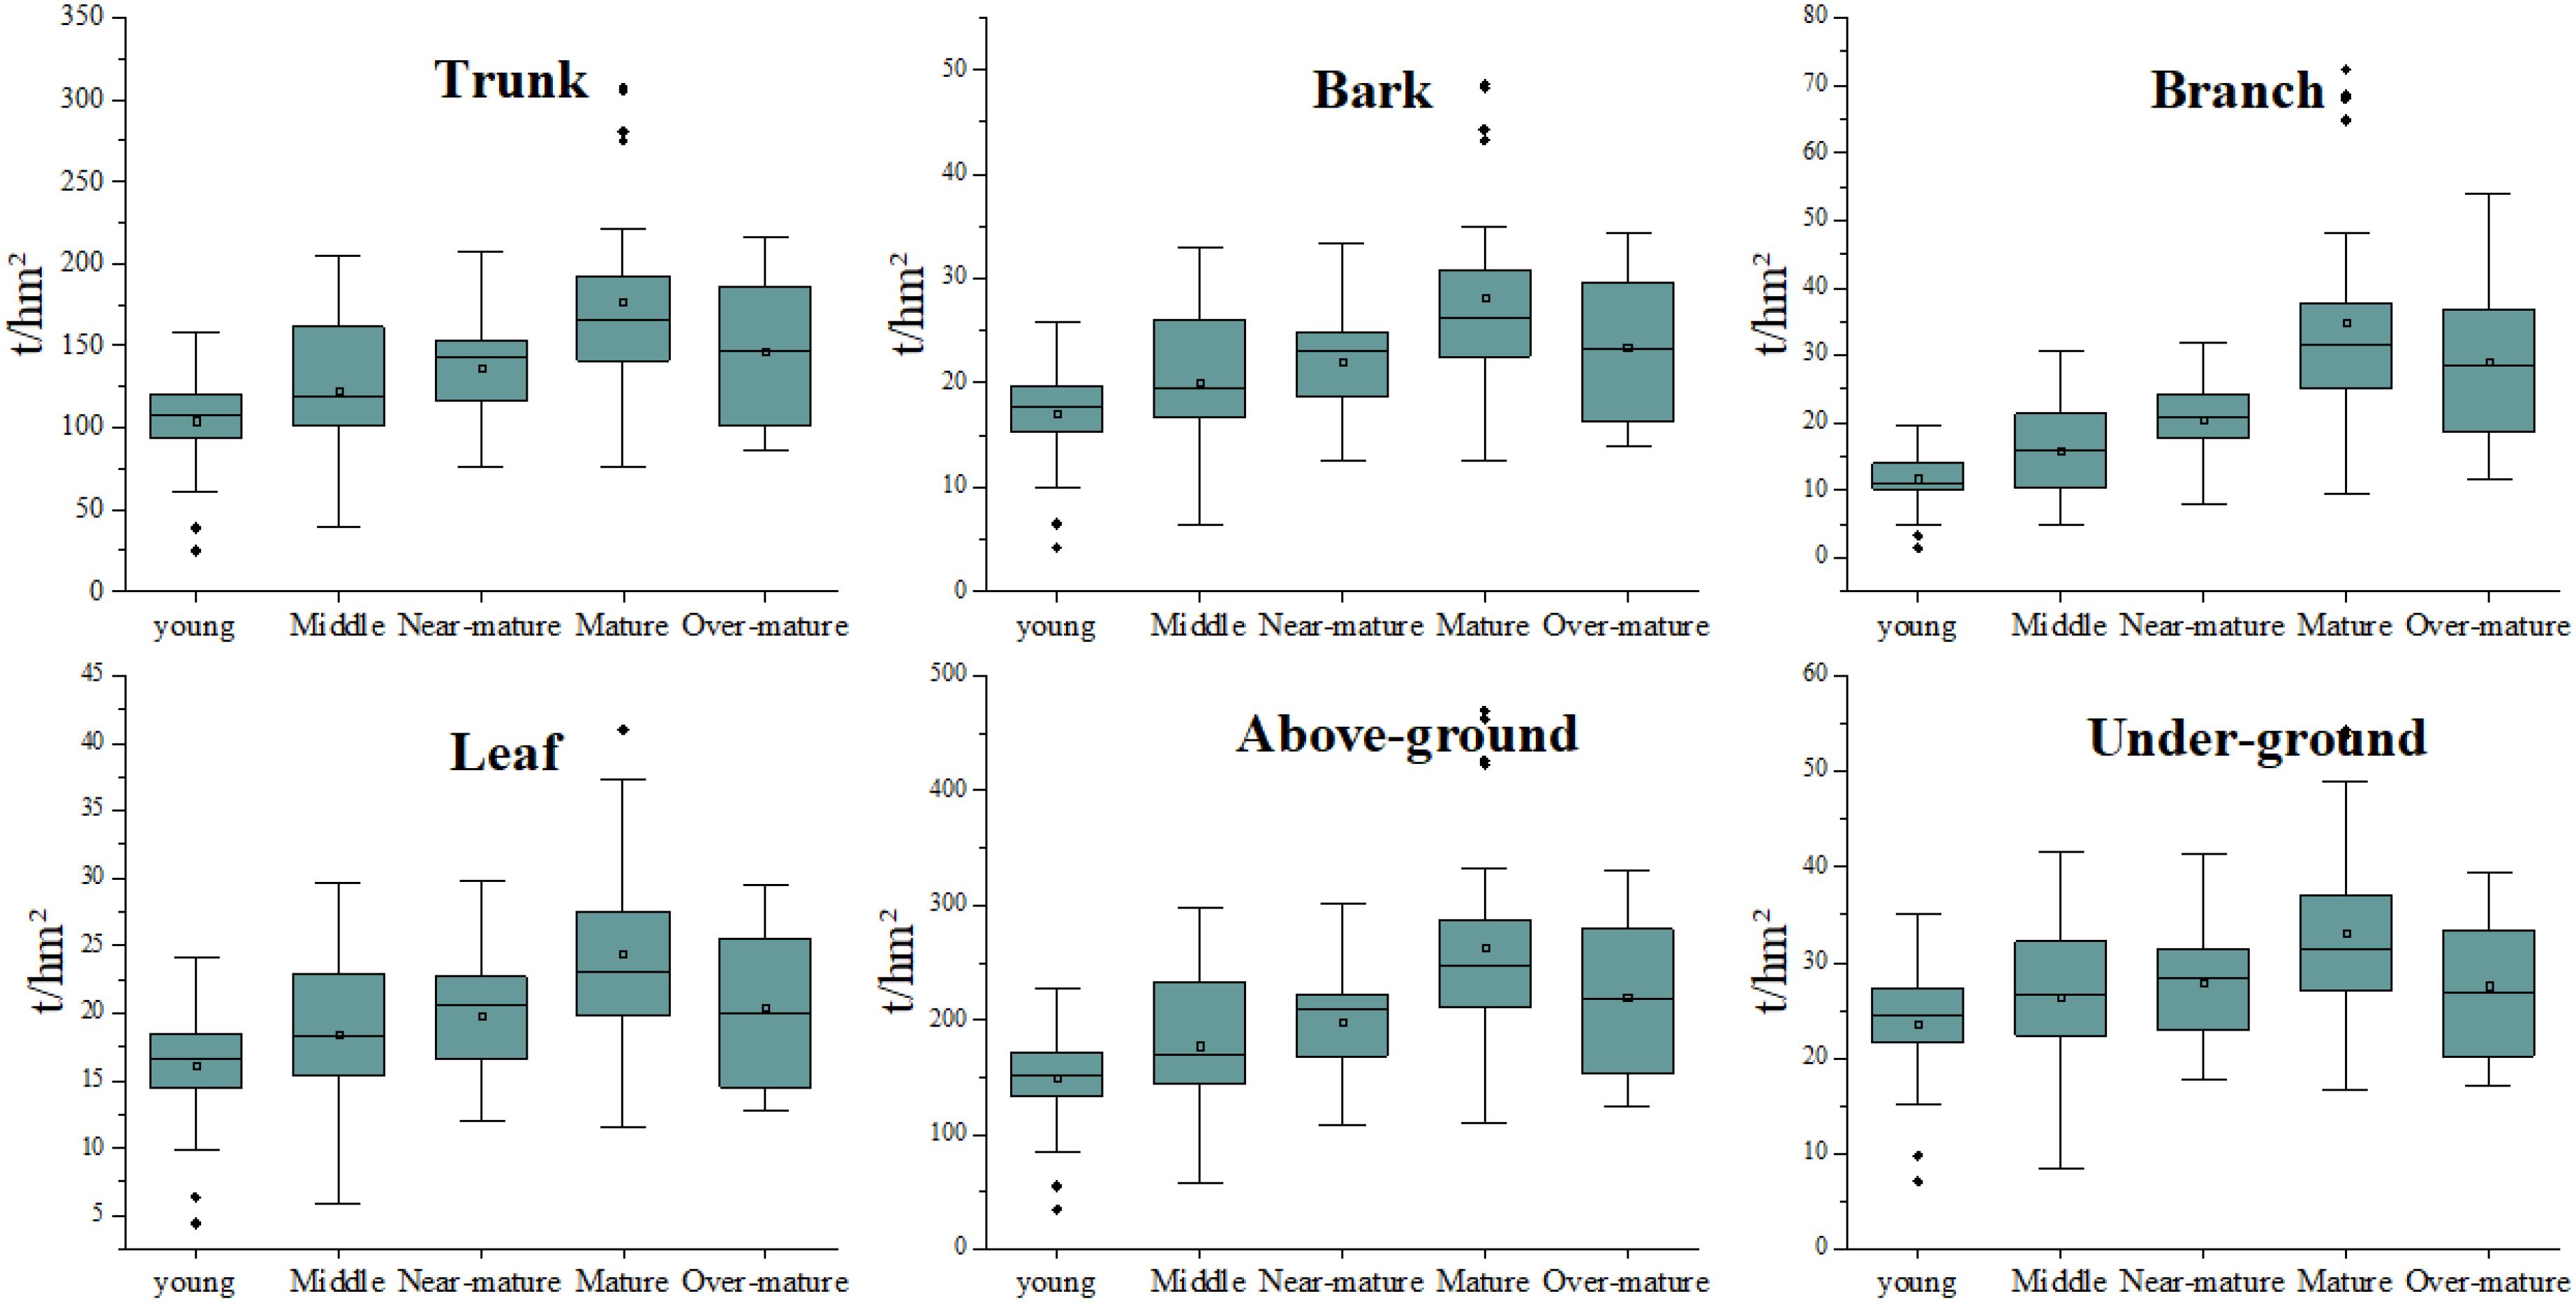
Figure 2. Boxplots of the six measured stand biomass for different forest types (The subfigures represent the biomass distribution across different tree components in the following order: Trunk, bark, branches, leaves, aboveground, and underground across various age groups).
3.2 Correlation analysis of feature variables
A Pearson correlation analysis was conducted between LiDAR point cloud variables and plot biomass, revealing 41 significantly correlated feature variables. The biomass of the trunk, bark, aboveground, and belowground components showed a high correlation with LiDAR point cloud variables, with Pearson correlation coefficients generally above 0.4. The correlation between branch and leaf biomass and LiDAR point cloud variables was moderate. Specifically, leaf biomass had a significant correlation with only seven LiDAR point cloud variables (P<0.05). The intensity variables had a generally low correlation with the measured biomass, with an average correlation coefficient of only 0.445.
Variables with a high correlation to different biomass components of the stand were selected. As shown in Figure 3, height percentiles (h1, h2) and cumulative height percentiles (AIH2, AIH3, AIH4, AIH6, AIH7) exhibited high Pearson correlation coefficients with various biomass components. Notably, the 5% cumulative height percentile had the highest correlation coefficients with trunk biomass (0.847), bark biomass (0.813), branch biomass (0.688), and aboveground biomass (0.817). Leaf biomass had the highest correlation with the Leaf Area Index (LAI), with a correlation coefficient of 0.608.
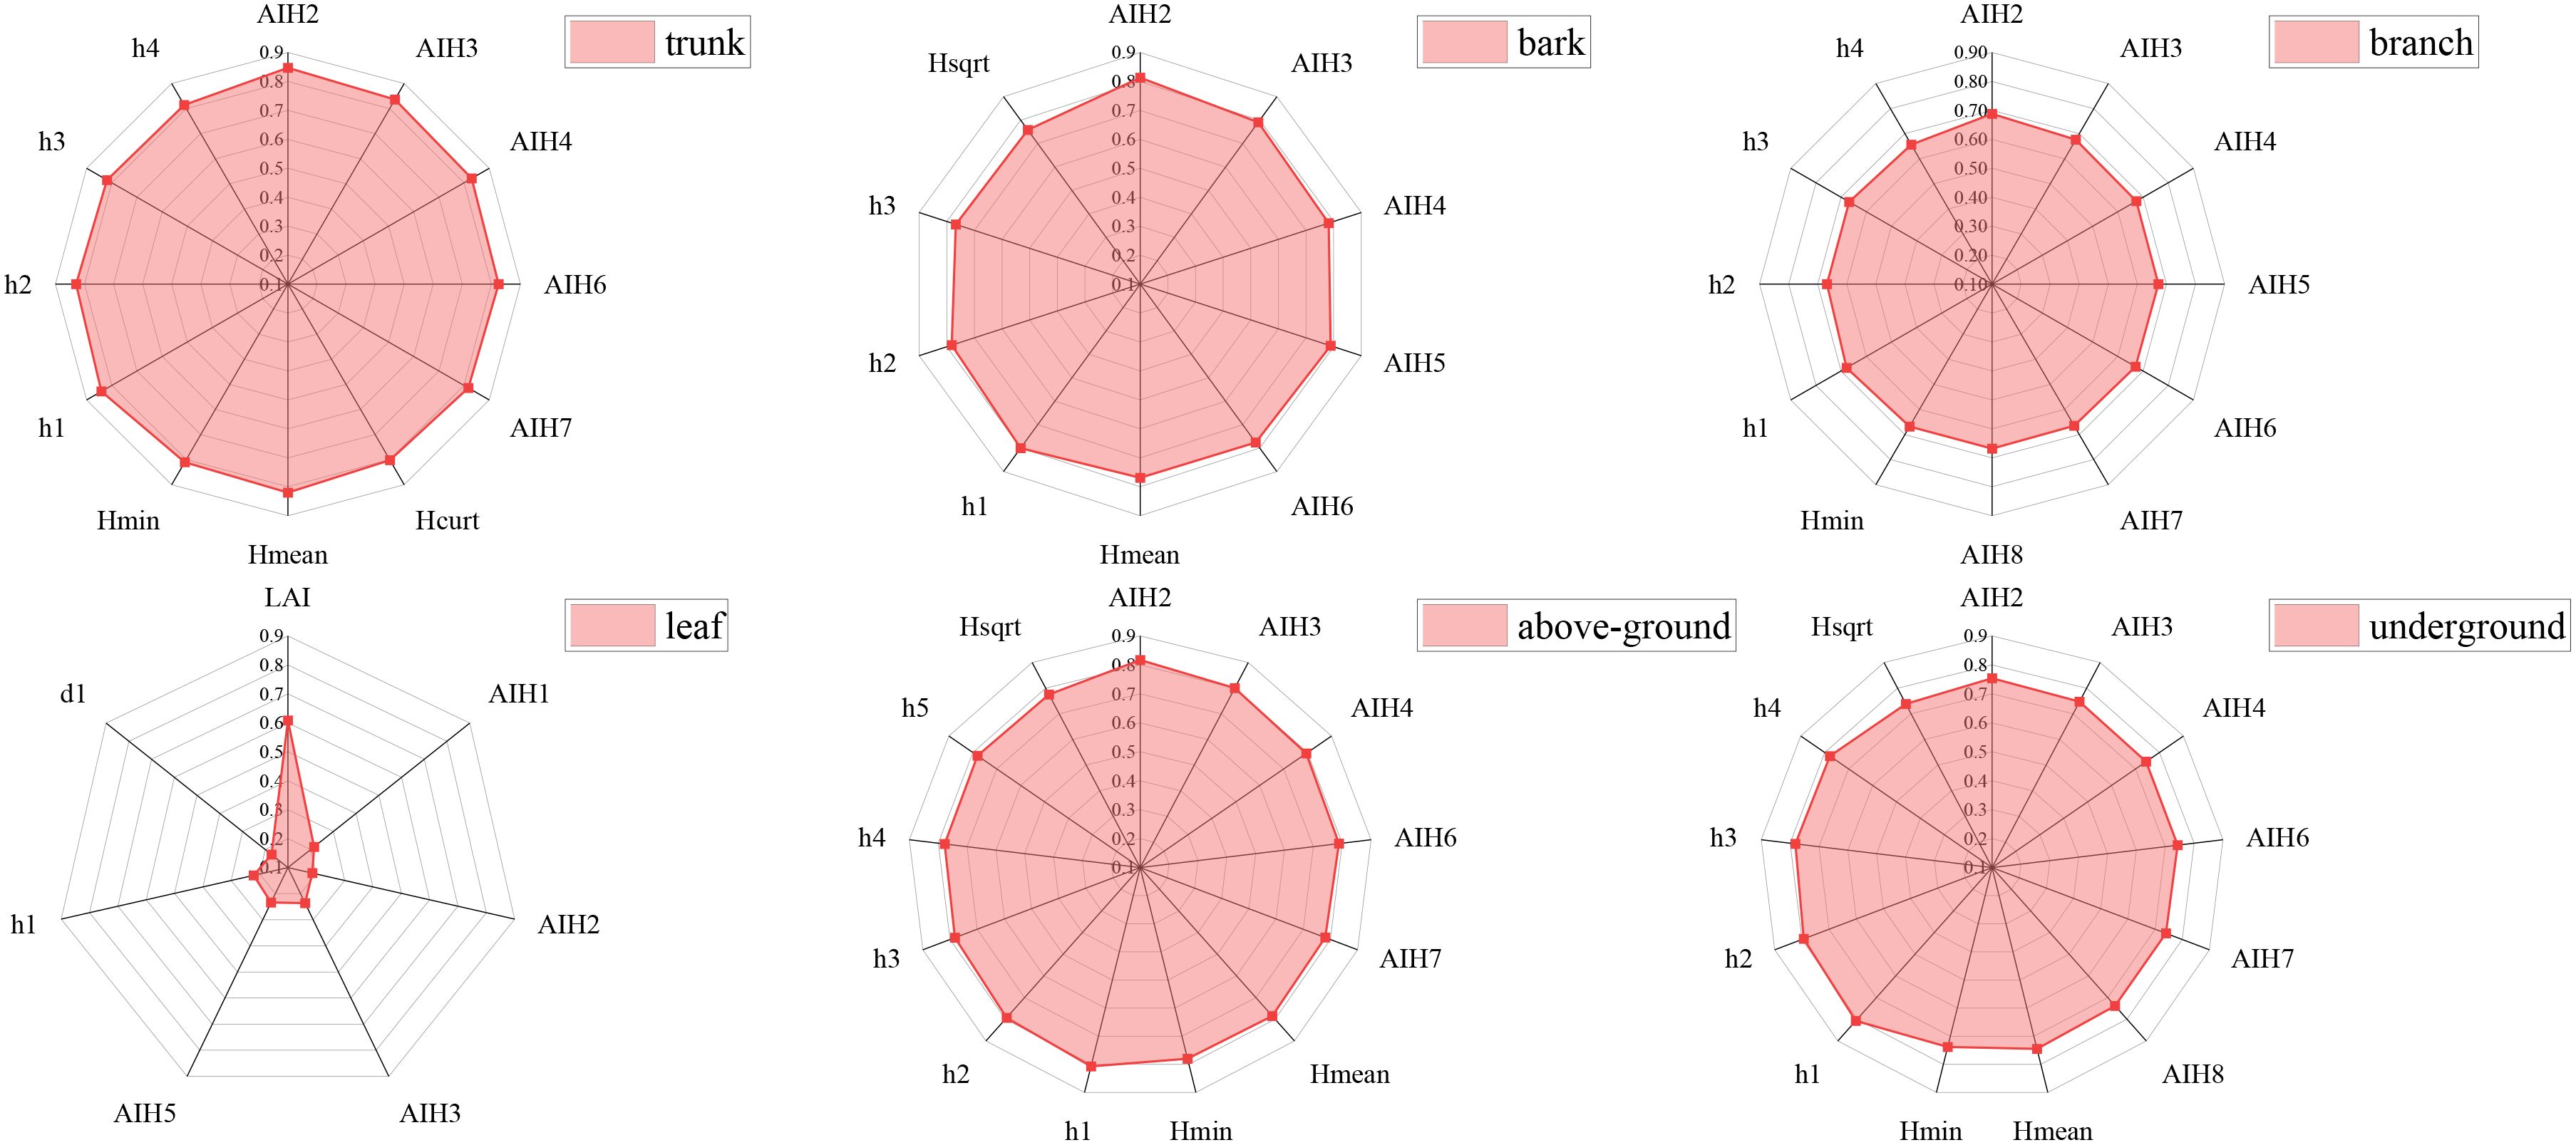
Figure 3. Pearson’s correlation coefficient between the selected metric and measured biomass (AIH1, AIH2,…, and LAI represent the corresponding LiDAR characteristic variables in sequential order, as detailed in Table 1).
3.3 Model construction and accuracy analysis
3.3.1 Base model
To enhance model accuracy, variance inflation factor (VIF<10) analysis was used to remove multicollinearity among the variables. These were then analyzed for correlation with various biomass components of the forest stands. After screening, only three LiDAR feature variables—cumulative height percentile AIH2, Leaf Area Index (LAI), and intensity percentile d9—had a VIF of less than 10. Based on the correlation analysis results in the previous text, the 5% cumulative height percentile AIH2 and LAI were chosen as the parameters for the equations. The estimation accuracy results of the univariate and bivariate regression base models are presented in Tables 4, 5. Due to space constraints, only the validation set results are presented in the article.
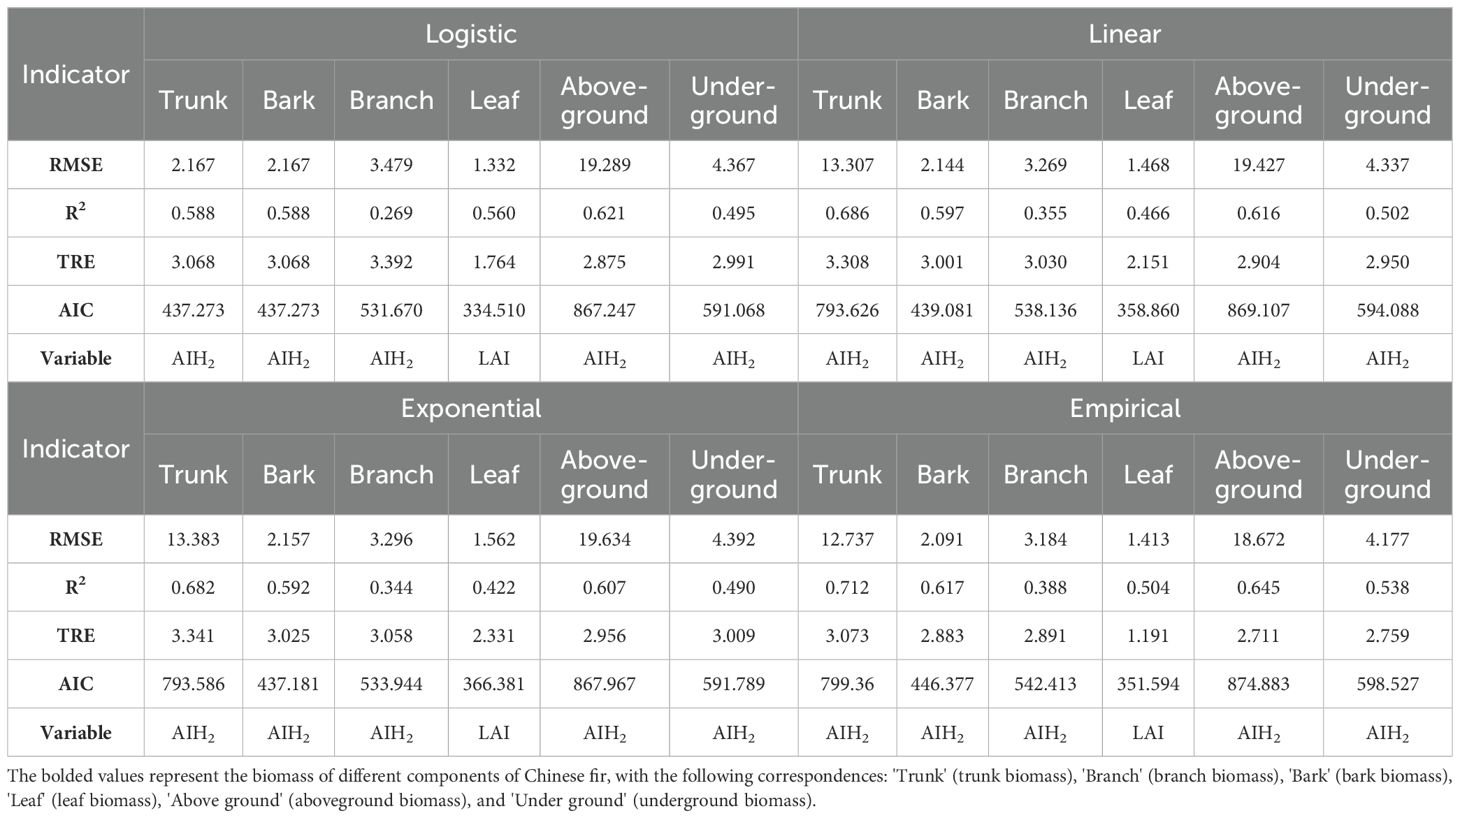
Table 4. Statistical indicators for the validation set of the univariate biomass model based on stand factors.
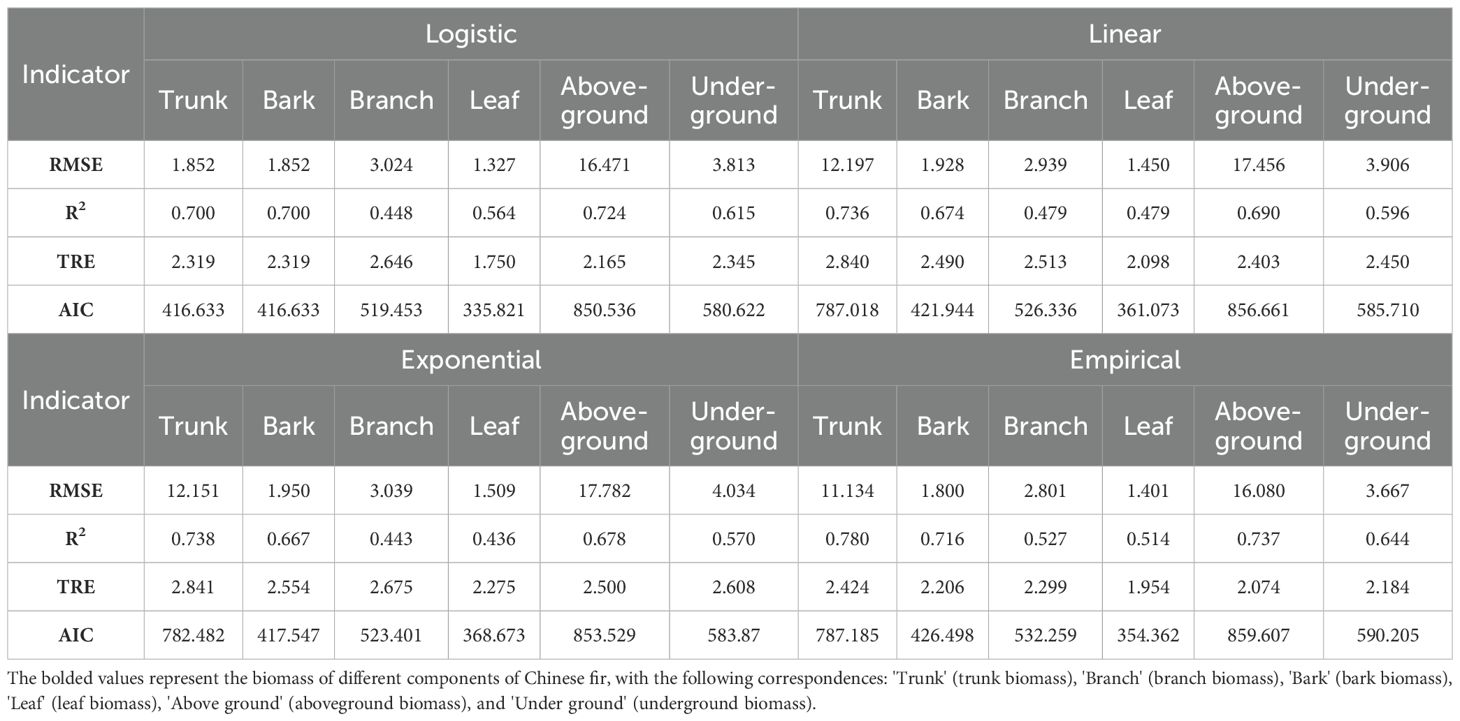
Table 5. Statistical indicators for the validation set of the bivariate parameter biomass model based on stand factors.
From the model evaluation results, in the univariate regression model, the 5% cumulative height percentile AIH2 as an independent variable showed a significantly better fit than LAI. Moreover, only leaf biomass selected LAI as a parameter in the optimal model. Considering the accuracy evaluation of both regression models, the R² values for the univariate regression model ranged from 0.269 to 0.712, with a median of 0.537. In contrast, the R² values for the bivariate regression model ranged from 0.443 to 0.780, with a median of 0.619, and most were above 0.6. When comparing RMSE, TRE, and AIC values, the bivariate regression model also reflected a better fit. Therefore, the bivariate regression model better explains the variations in biomass among the different components of Chinese fir stands, and this analysis focuses primarily on the bivariate regression model.
The fitting results indicate that UAV LiDAR point cloud feature variables have a good fitting effect on trunk, branch, aboveground, and belowground biomass, with most R² values above 0.6. The fitting effect for branch and leaf biomass was relatively poor, with leaf biomass showing the worst fit, having R² values around 0.5. This suggests the need to introduce more parameters to improve the fitting model for leaf biomass.
Comparing the four base models, the results show that the Empirical model had the highest R² values and the lowest RMSE and TRE values for predicting the biomass of the trunk, branches, bark, aboveground, and belowground components, indicating high predictive accuracy for the biomass of Chinese fir stands. For leaf biomass prediction, the Logistic model had a higher R² value, and its TRE value of 1.750 was the lowest among all models, suggesting that this model provides a better fit for leaf biomass and has high predictive accuracy. Additionally, the AIC values of the Logistic model were all at low levels.
Based on the model accuracy results, the following models were selected as the base models for predicting the biomass of each component (Equation 10).
3.3.2 Nonlinear mixed-effects models
To increase the accuracy of the base models, nonlinear mixed effects models (NLME) were constructed in this study. Considering the effects of different management practices, various age group were treated as random variables influencing the parameters a0~a2、b0~b2、… 、f0~ f2, resulting in a total of 50 NLME models. Out of these, 47 models were statistically significant, with AIC values ranging from 326.222 to 848.969 (Figure 4). The results showed that the AIC values within the model groups were relatively similar, but there were substantial differences between groups.
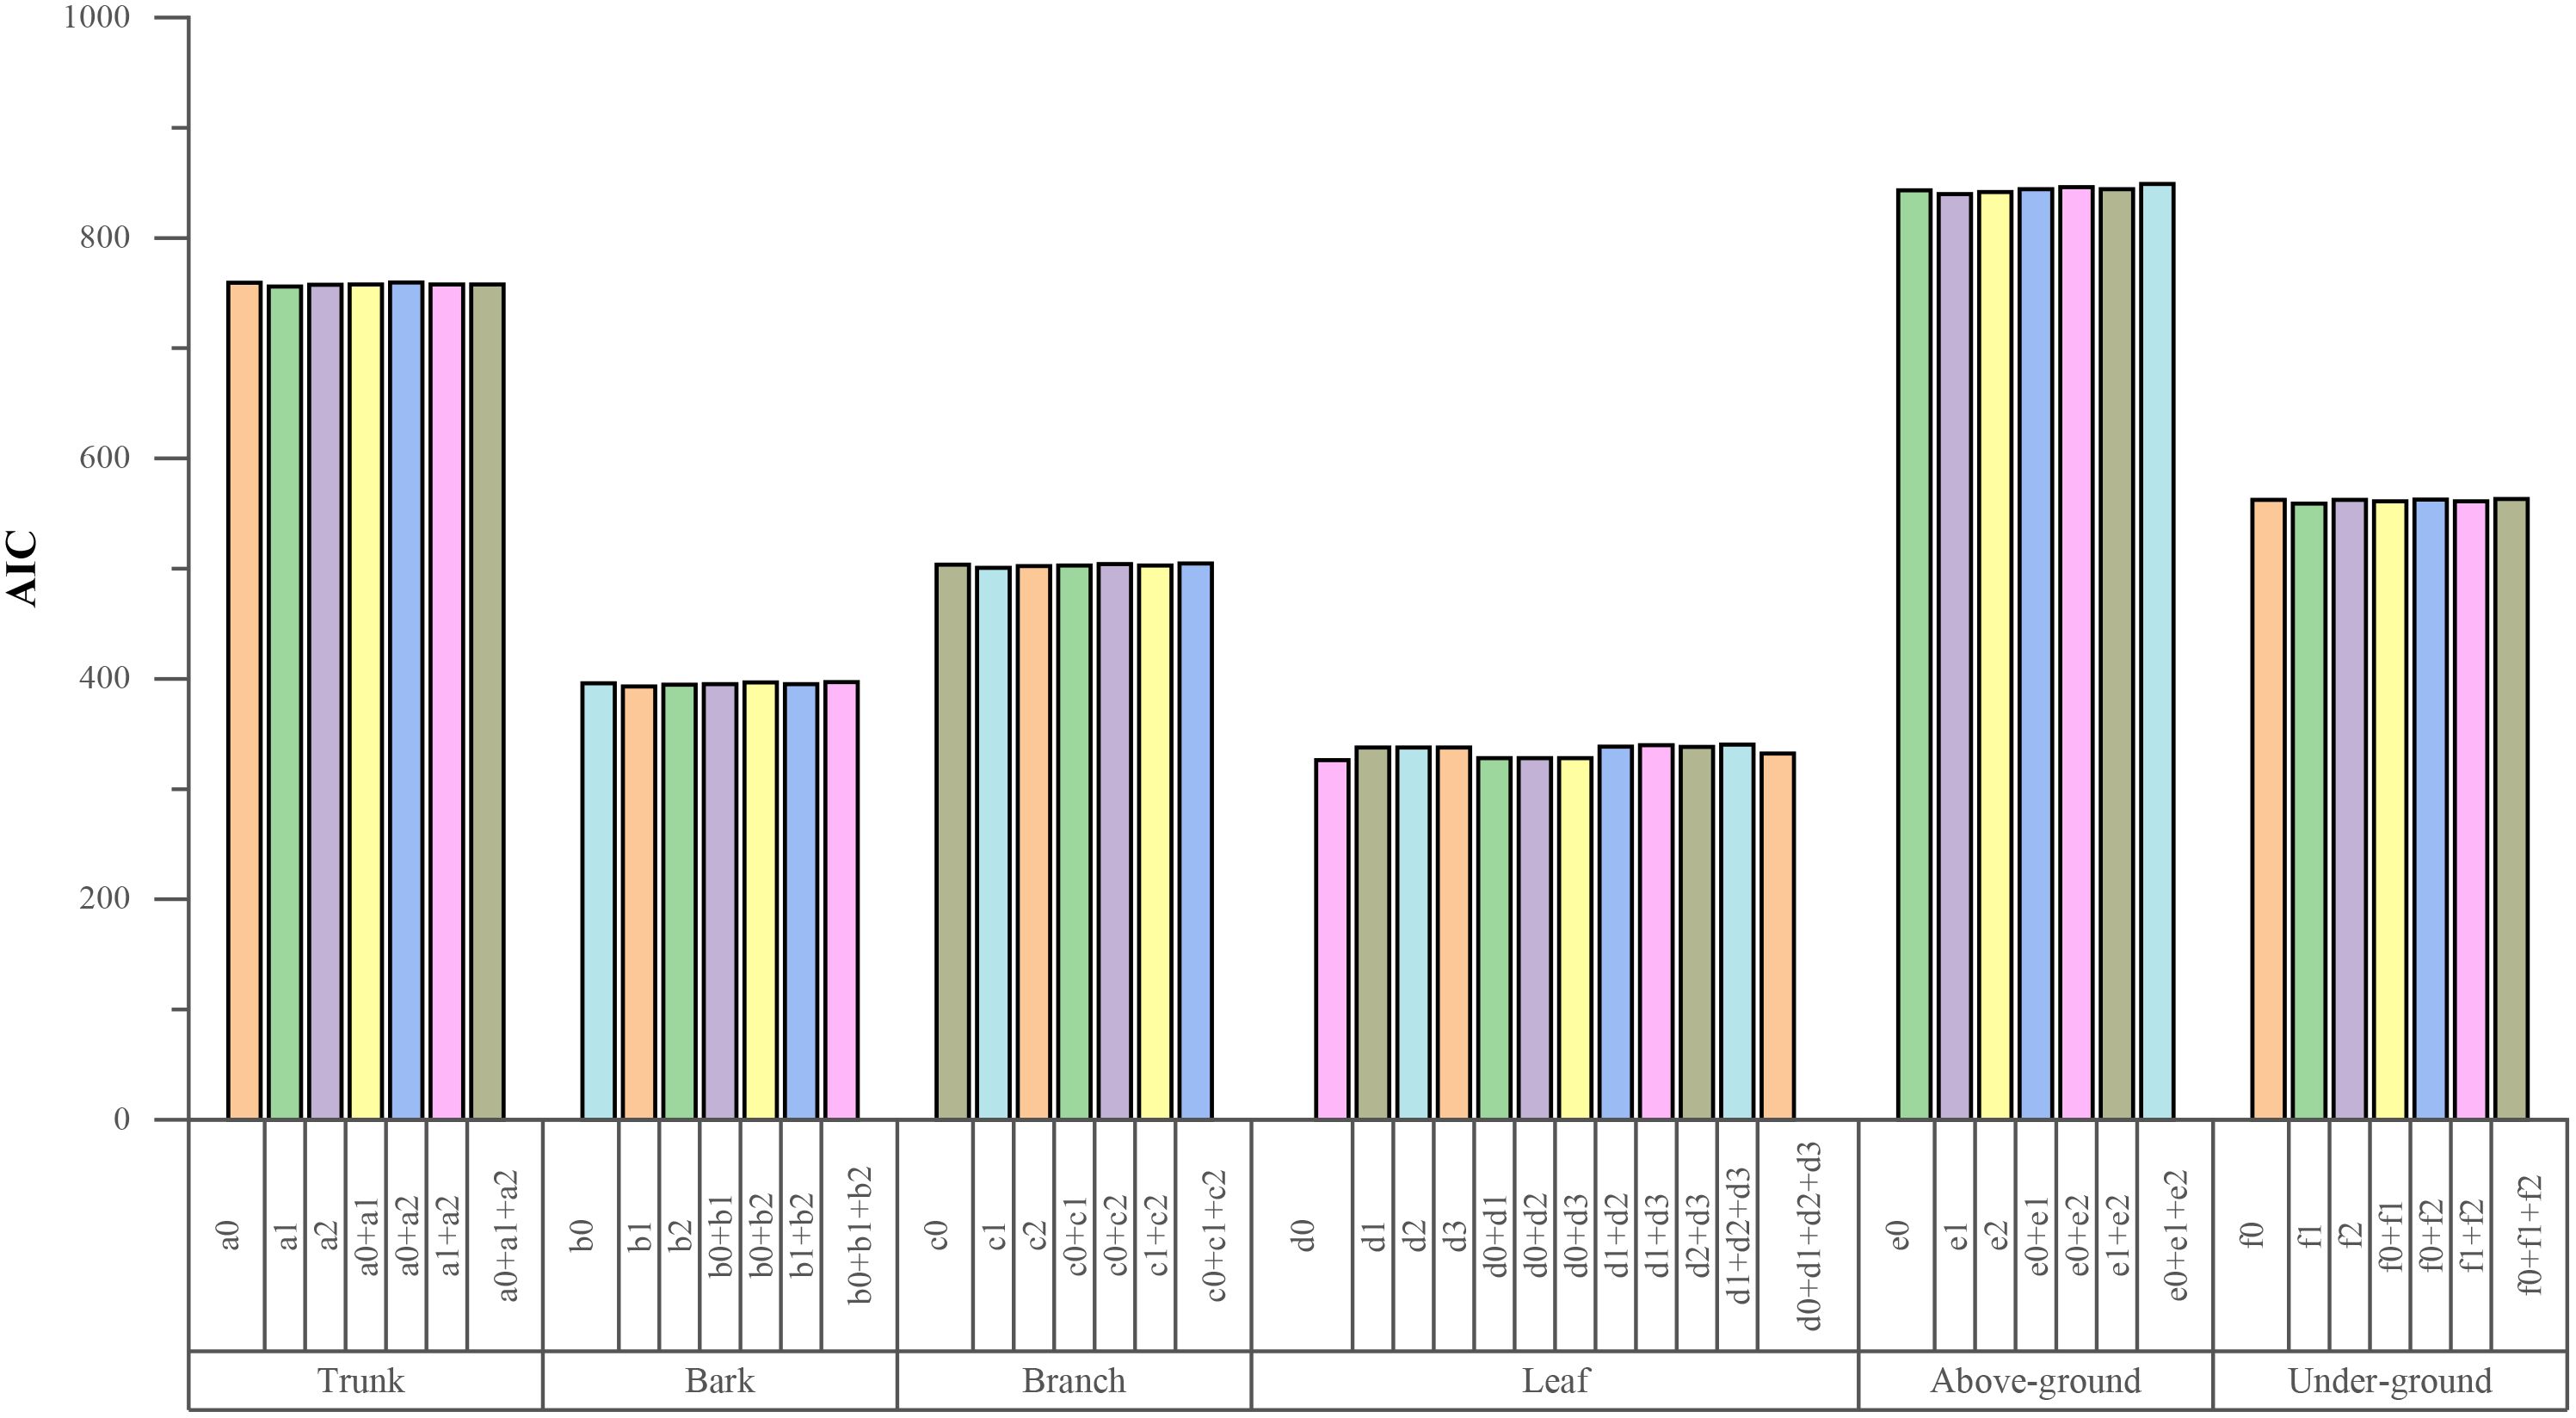
Figure 4. AIC values of non-linear random effects combination for each sub item biomass (a0, a1, …f2 refer to the parameters needs to be included as random effects; + refer to the combinations of the random effects).
The following NLME models for Chinese fir biomass components exhibited optimal fitting statistics. Parameter estimates, standard errors, adjusted R², RMSE, and TRE are shown in Table 6. For the fitted models, the adjusted R² values for each biomass component model were above 0.65. Simultaneously, the RMSE and TRE values decreased, reflecting an improved fit. At a significance level of 0.05, all parameters in the NLME models were statistically significant, indicating that the explanatory variables had a notable impact on the biomass of various forest components.
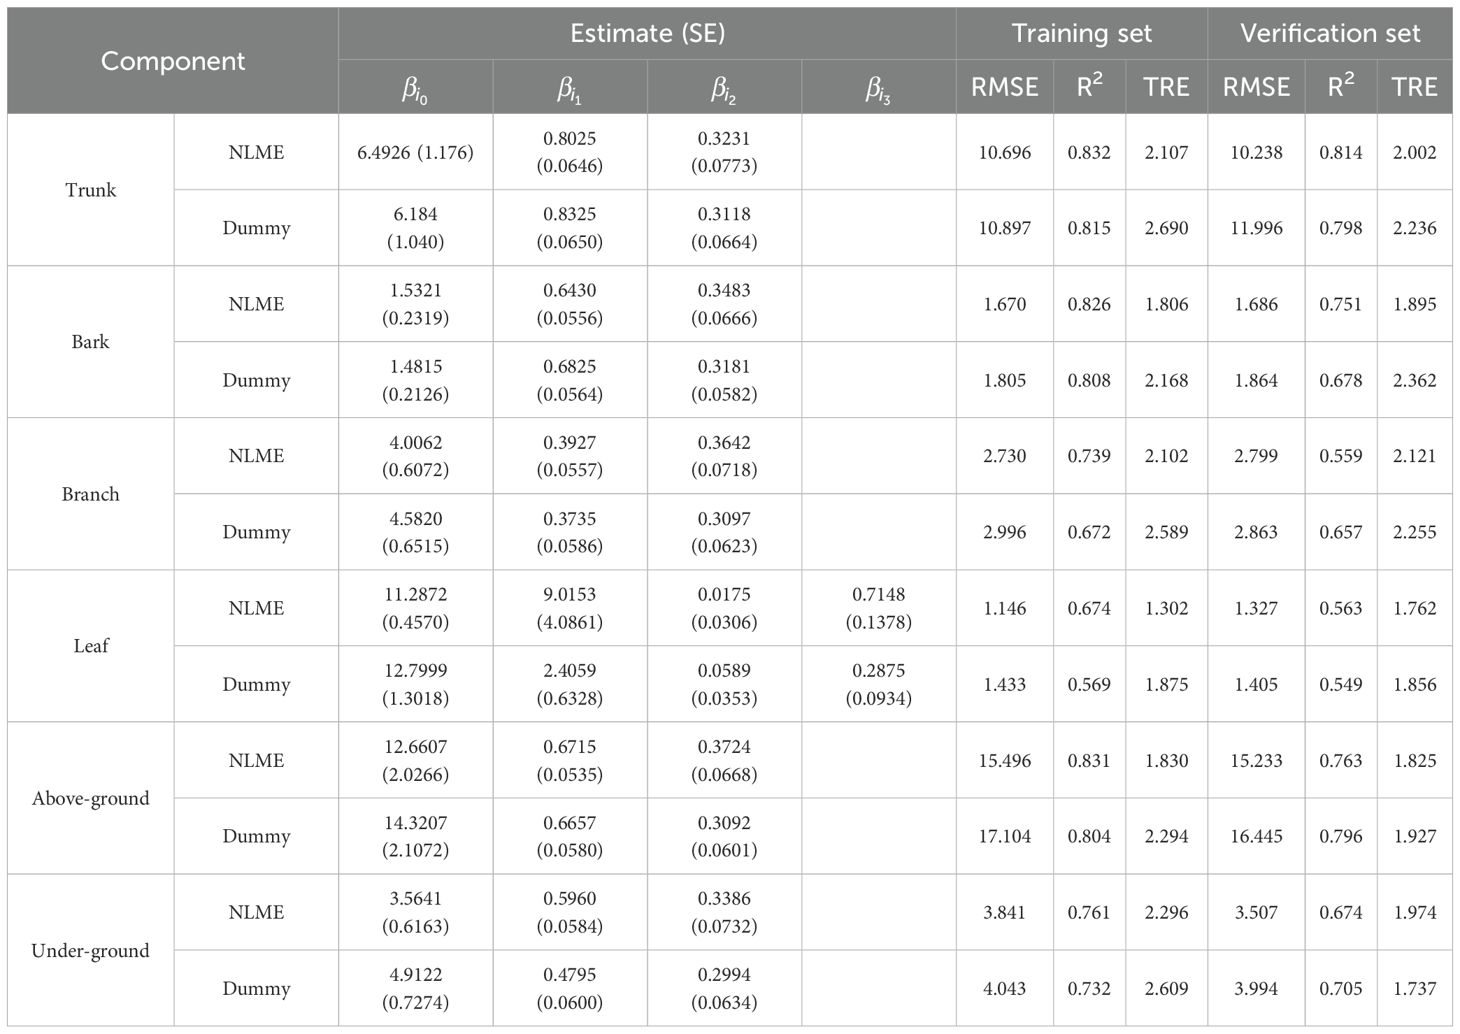
Table 6. Fitting results of nonlinear mixed effects model for various tree component biomass.
In Table 6, “NLME” represents the nonlinear mixed-effects model, while “Dummy” denotes the dummy variable model.
3.3.3 Dummy variable models
Compared to the NLME models, the dummy variable models showed a reduction in R², with increases in RMSE and TRE values, indicating slightly poorer fit for the biomass of Chinese fir (Table 6).When compared to the corresponding univariate and bivariate models, the fit of the biomass models improved, with noticeable enhancements in branch biomass model (Training set R2 = 0.672, RMSE=2.996; Verification set R2 = 0.657, RMSE=2.863), while the leaf biomass fitting did not show significant changes.
Figure 5 shows the residual plots for the NLME and dummy variable models showed that residuals are uniformly distributed around zero, with no apparent trends of divergence or convergence related to predicted biomass values. This suggests that there are no significant systematic biases or heteroscedasticity, and the NLME model residuals are closer to zero with fewer outliers.
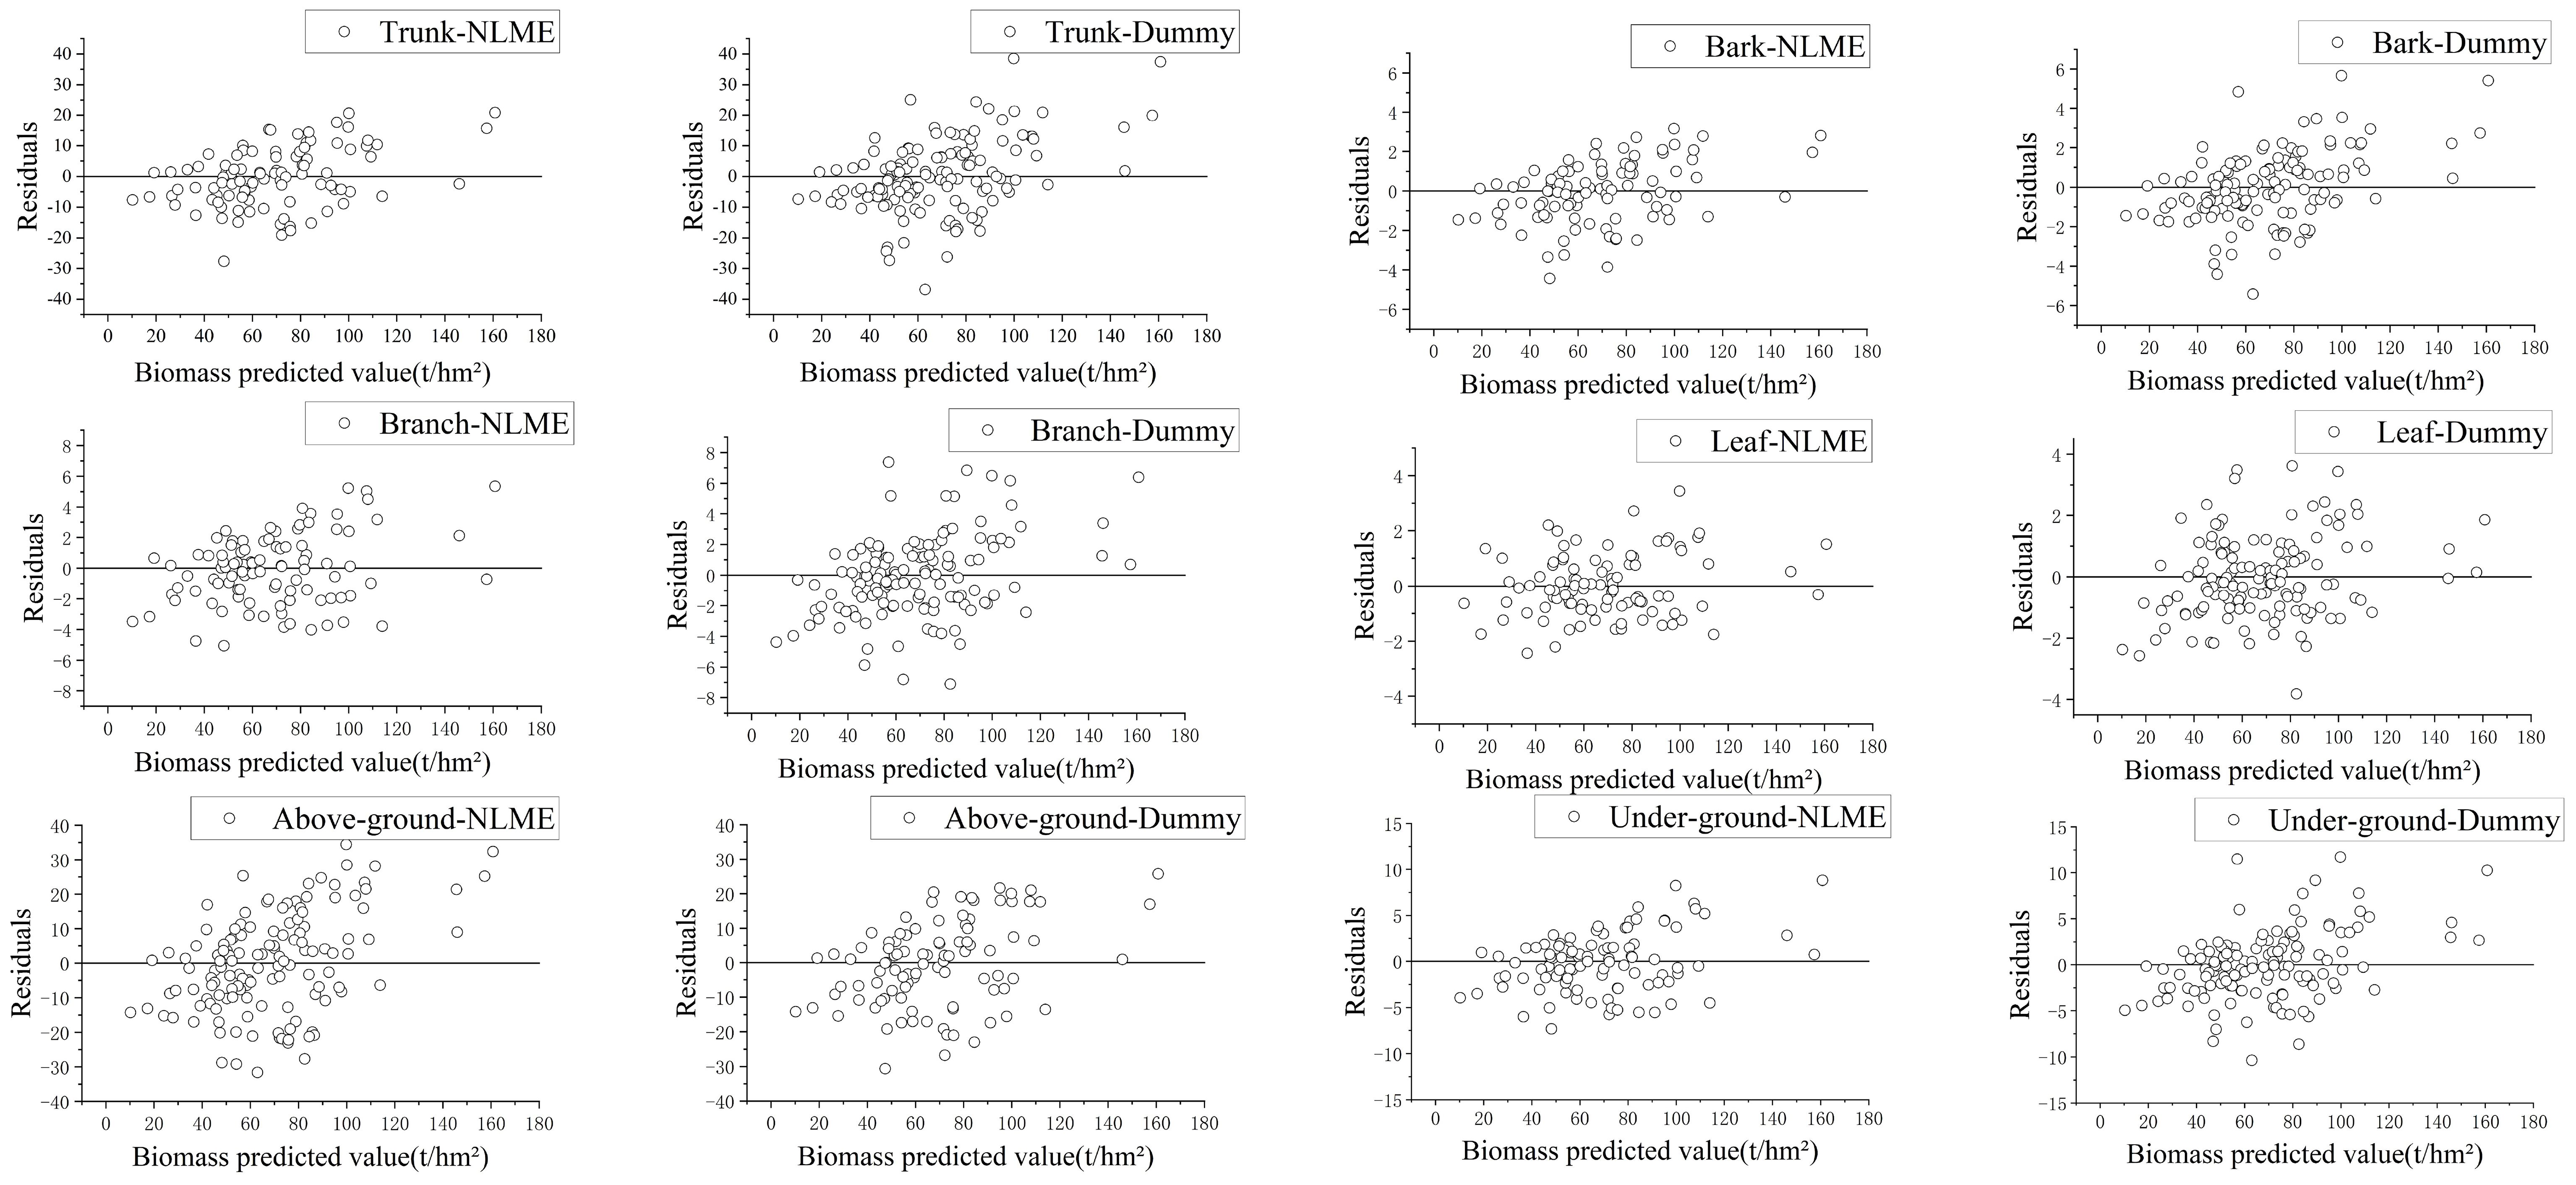
Figure 5. Residual distribution diagram of nonlinear mixed effects model and dummy variable model (“-NLME” represents the residual of the nonlinear mixed-effects model for each branch, “-Dummy” represents the residual of the dummy variable model for each branch).
3.3.4 Machine learning methods
Compared to traditional parametric models, the Random Forest algorithm demonstrated certain advantages (Table 7). The R2 value has increased compared to the average of the base model, random effects model, and dummy variable model, demonstrating a significant improvement in fitting accuracy. The largest improvements were seen in leaf biomass (Training set R2 = 0.855, RMSE=0.804; Verification set R2 = 0.862, RMSE=0.934), where the parameter models had lower fitting accuracy.
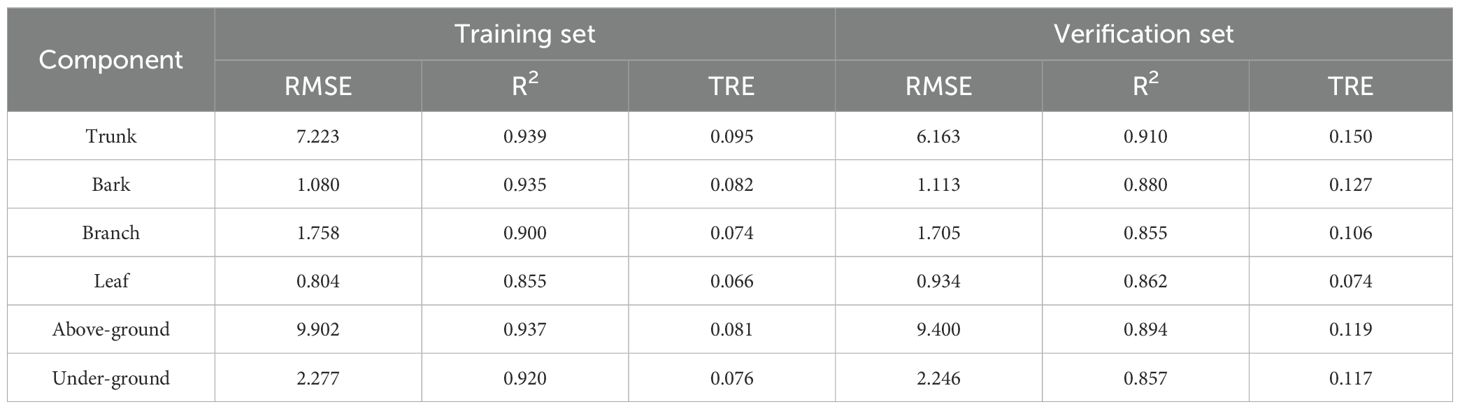
Table 7. Fit statistics of machine learning models.
3.4 Model validation
Due to the more reasonable distribution of relative residuals in NLME, this study employed the Logistic and Empirical models, incorporating age groups as mixed effects, the validation sample data were then use in the NLME models to obtain predicted value. The calculations show that the majority of a values fall within the range of 0.6 to 1.1, while most b values remain between -1 and 5, despite a few extreme values exceeding 10. Overall, the scatter plot of the model shows a balanced distribution around the fitting line. Across different age groups, the model performs better for young and middle-aged forests, while the fitting accuracy for near-mature forests is relatively lower compared to the other four age groups. In terms of different biomass components, except for leaf biomass, there is no significant deviation between the observed and estimated values for other components of Chinese fir biomass. Notably, the estimation accuracy for trunk biomass and aboveground biomass is higher than that of other components. Figure 6 displays the fit between the predicted and observed values for the NLME models.
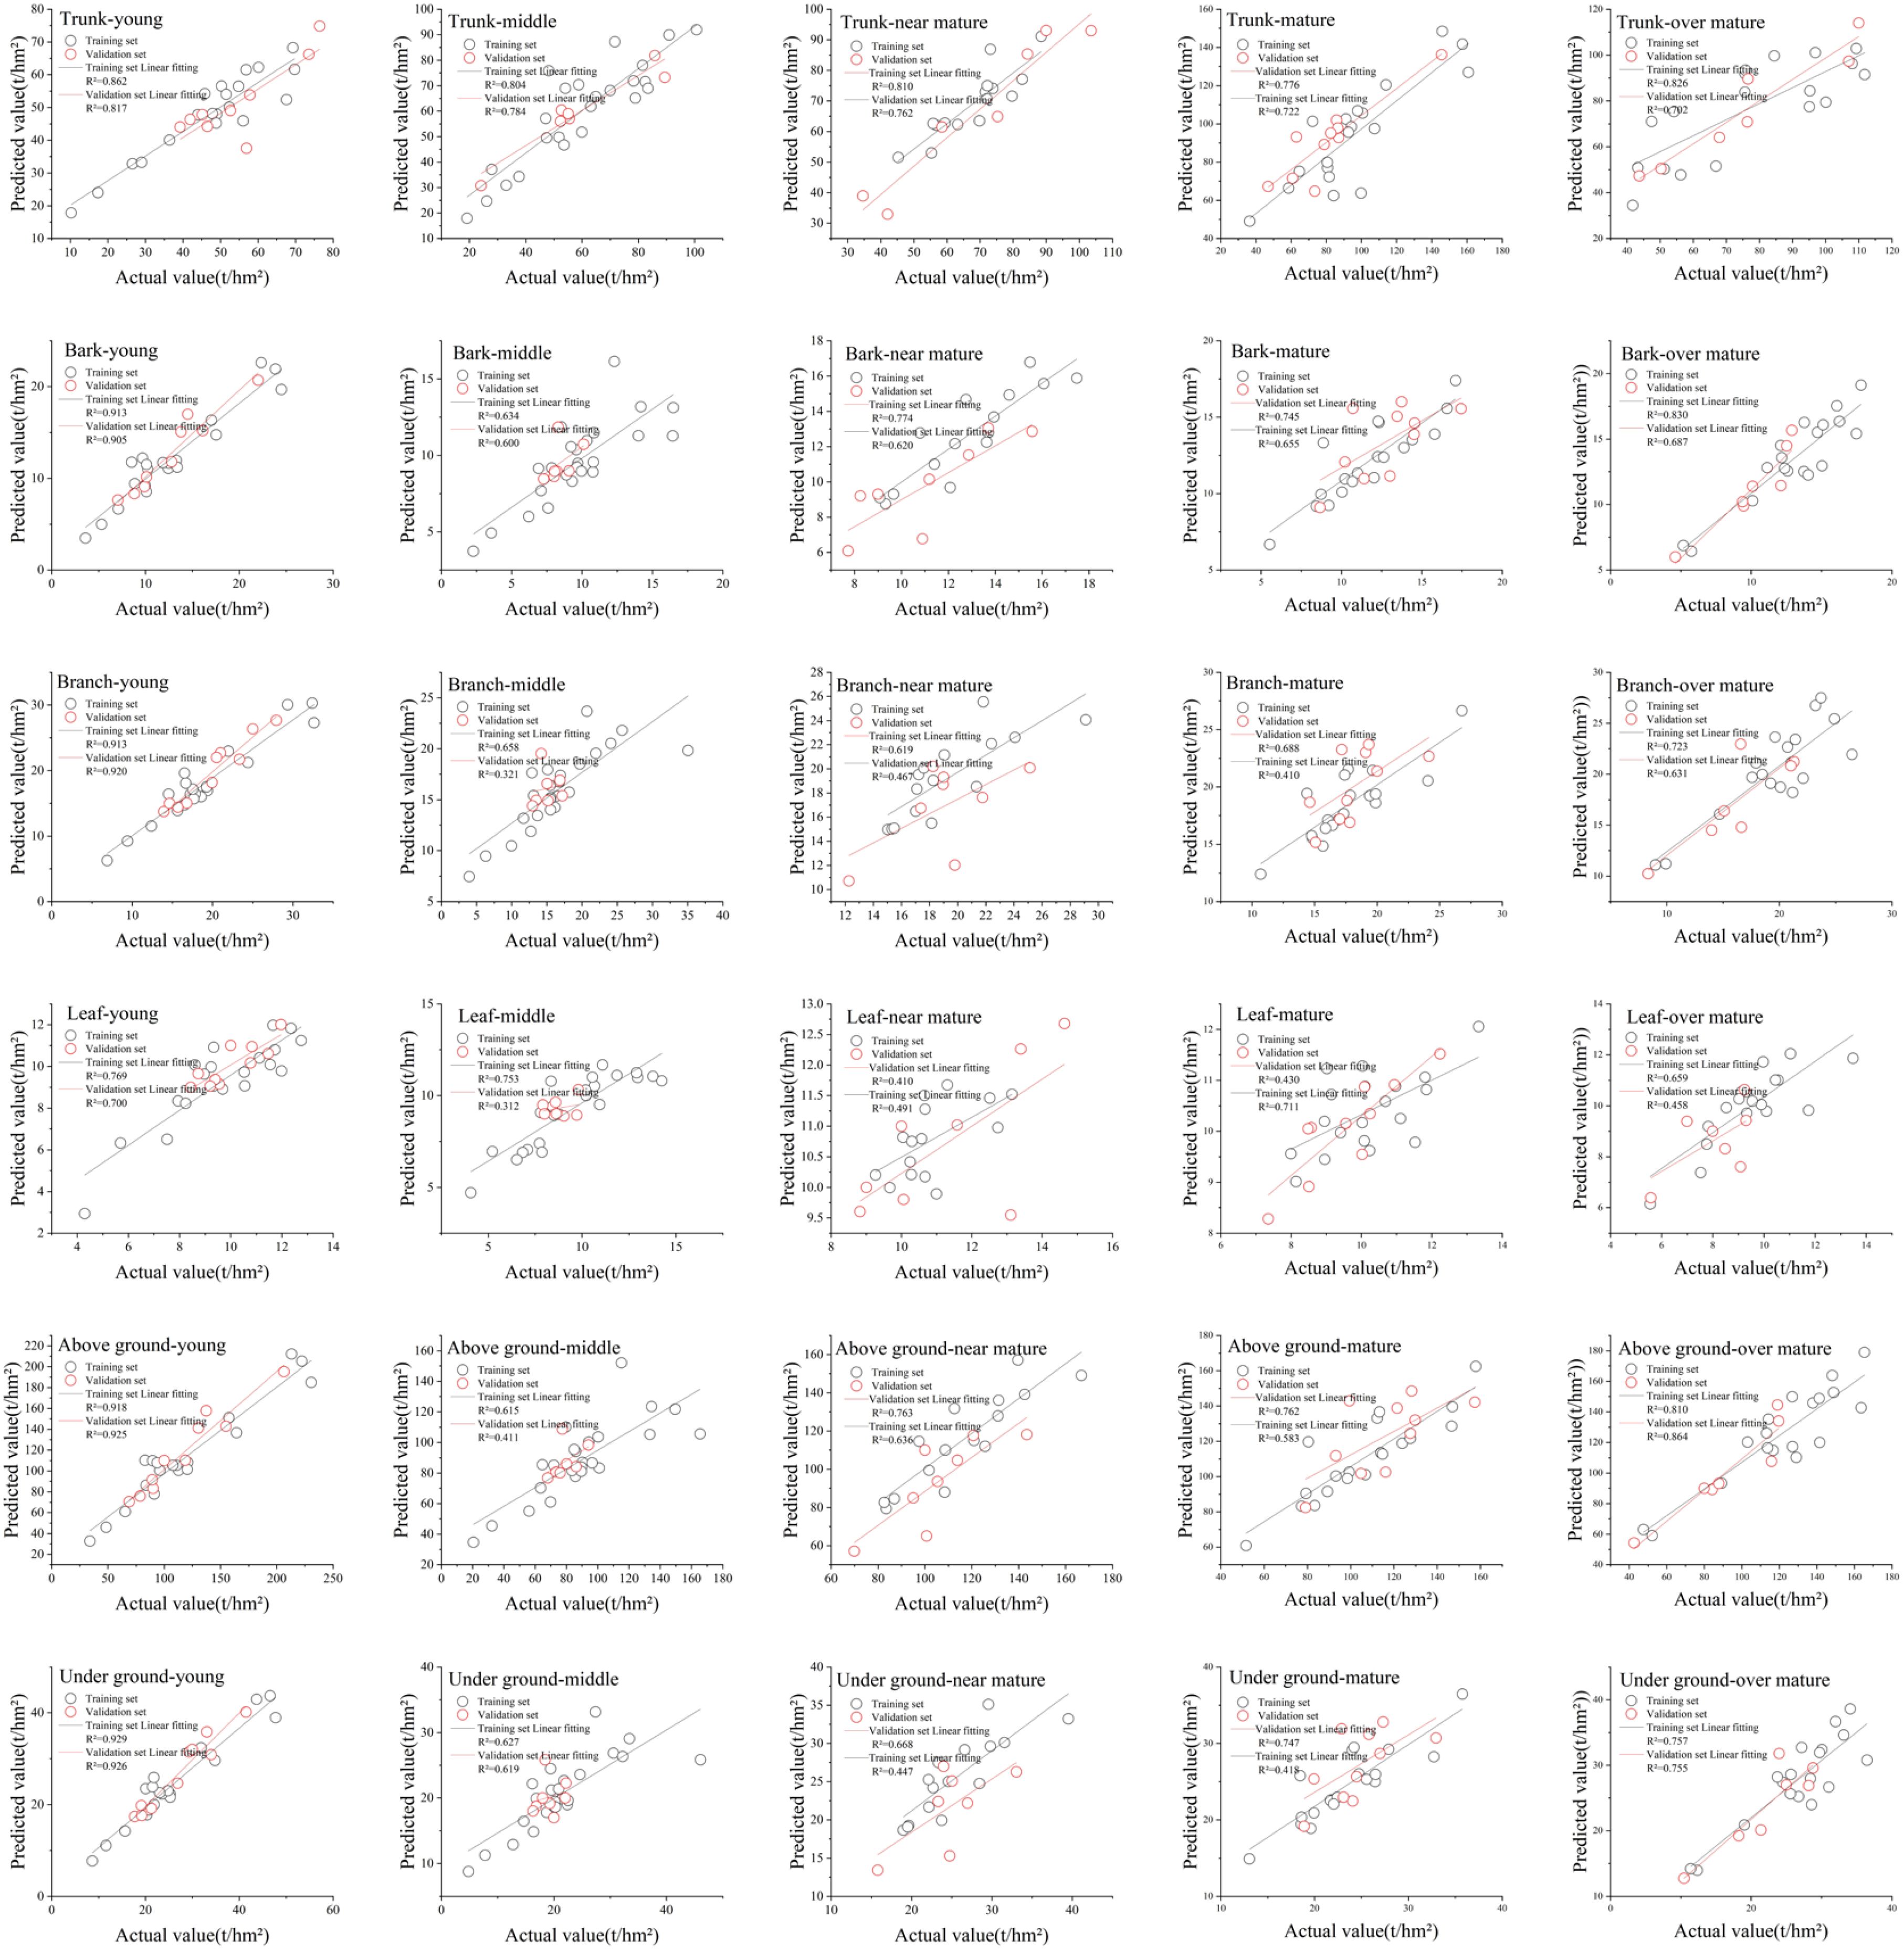
Figure 6. Fitting diagram of estimated and observed values of nonlinear mixed effects model (Trunk, Bark, Branch, Leaf, Aboveground, and Underground represent the biomass distribution of different components of Chinese fir, while Young, Middle, Near-Mature, Mature, and Over-Mature indicate the respective age groups).
The diagnostic analyses in Figures 5, 6 and Table 7 the demonstrate that the model in this study exhibits a good overall fit, with no significant heteroscedasticity. The bivariate models provided a better fit for biomass than the univariate models, and tree height was found to be a significant factor influencing the models. The inclusion of age group factors in the NLME and dummy variable models led to improvements over conventional models, while machine learning methods significantly enhanced the fitting accuracy over the NLME model.
4 Discussion
This study constructed biomass inversion models for Cunninghamia lanceolata (Chinese fir) stands using UAV-based LiDAR point cloud data integrated with field survey measurements. The parametric and non-parametric models achieved coefficients of determination of R² = 0.832 and R² = 0.939, respectively, indicating high predictive accuracy. These results are comparable to those reported by Yu et al. (2023) and outperform several previously developed UAV-LiDAR-based biomass estimation models for Chinese fir (Yu et al., 2023; Xian et al., 2024). This demonstrates the reliability and applicability of LiDAR-derived structural metrics in estimating stand biomass, providing critical methodological support for biomass estimation and carbon stock assessments at the regional scale.
Remote sensing-based biomass modeling, particularly using LiDAR, offers significant advantages in characterizing vertical forest structure and spatial heterogeneity, addressing limitations inherent in traditional ground-based inventory methods. However, challenges remain regarding optimal variable selection, model transferability, and reduced accuracy in structurally complex or heterogeneous forest stands. Model accuracy is not only contingent upon stand structure and geographic characteristics but is also influenced by the specific LiDAR-derived metrics selected for modeling (Li et al., 2019; Chen et al., 2022). In this study, a comprehensive set of LiDAR metrics was extracted, including 46 height variables, 9 intensity variables, and 2 density variables. Following comparative analysis, two key variables—cumulative 5th percentile height and Leaf Area Index (LAI)—were selected as final predictors. These findings are consistent with previous research by Du et al. (2021) and Qu et al. (2014), who identified percentile-based height metrics and canopy cover as dominant variables in biomass modeling (Qu et al., 2014; Du et al., 2021). Height-related metrics were found to effectively capture mean stand height, while density and intensity variables reflected canopy closure and horizontal structure. The integration of these three types of features enhances the capability of LiDAR-based models to accurately estimate biomass across various stand conditions (Wallace et al., 2016).
Regarding model architecture, four commonly used base models were tested, with enhancements including nonlinear mixed-effects modeling, dummy variables, and machine learning techniques. Model performance was assessed using R², RMSE, TRE, and residual diagnostics (Li et al., 2022). Results revealed that different base models were optimal for different biomass components: the Logistic model was best suited for foliage biomass, while the Empirical model provided superior performance for other components. Overall, nonlinear models demonstrated better fit and stability than linear regressions, aligning with previous findings (Fu et al., 2018; Chen et al., 2022).
The inclusion of stand age as a covariate in the mixed-effects models significantly improved model accuracy, indicating that developmental stage plays a critical role in biomass accumulation. This aligns with the work of Guo (2022), who highlighted the influence of stand age in ground-based biomass models for Chinese fir (Zhao et al., 2020). In managed plantations—such as those in Guangdong Province where initial planting densities are high—tending and thinning practices during early to mid-rotation stages alter stand density and structural attributes (e.g., DBH, height, volume), thereby impacting biomass distribution (Jiang et al., 2022). Furthermore, both dummy-variable models and mixed-effects models were evaluated. The dummy-variable models showed slightly lower accuracy compared to nonlinear mixed-effects models, which may be attributed to the selection of input variables and sample size distribution among age classes. This aligns with the guidance of Wang (2008) and Chen (2018), who suggest that when the number of categories is small (<10), dummy-variable models are suitable, whereas mixed-effects models are more appropriate when category count is higher or sample sizes are imbalanced (Wang et al., 2008; Chen et al., 2017).
Component-wise biomass modeling showed the following order of model performance: trunk > aboveground > bark > underground > branch > leaf. This ranking is consistent with the results reported by Sun et al. (2021), who also found trunk and underground biomass to be more predictable than foliage biomass (Sun et al., 2023). As stands mature, increases in DBH and height lead to higher trunk, bark, and underground biomass, while branch and leaf biomass are more sensitive to stand density and light competition. Including stand age in foliage biomass models improved their accuracy, though performance remained lower than for other components. This may explain why the foliage biomass model required a distinct base function (Logistic) to accommodate its nonlinear growth pattern.
Despite the strong performance of the proposed models, several limitations remain. While stand age was incorporated, other environmental factors such as site conditions and canopy closure were not included and may have significant impacts on biomass allocation. Future research could incorporate two-level or multi-level mixed-effects models to account for these sources of variability. Moreover, this study focused on monospecific plantations, and further investigations in mixed-species forests are necessary to explore the effects of species composition and structural complexity. Prior studies have indicated that LiDAR detection accuracy may be reduced in steep terrain or multi-layered canopies, warranting methodological refinement in such contexts (Wang et al., 2008; Khosravipour et al., 2015; Chen et al., 2017; Jiang et al., 2022). Additionally, only the Random Forest algorithm was evaluated among non-parametric methods. Future work should include other machine learning approaches, such as Support Vector Machines (SVM), Artificial Neural Networks (ANN), and K-Nearest Neighbor (KNN), to compare their performance against traditional models. Due to space limitations, integrated estimation of component and total biomass will be discussed in a follow-up paper.
5 Conclusion
This study focused on Chinese fir plantations in Guangdong Province and employed a combination of airborne LiDAR data and ground-measured data to construct biomass models for different components of forest stands using both parametric and non-parametric modeling methods. Forest stand age was incorporated as a random factor in the models. The following conclusions were drawn based on the fitting and validation results:
1. Multicollinearity among LiDAR-derived variables: There is significant multicollinearity among the characteristic variables derived from UAV LiDAR data, with height variables showing a strong positive correlation with stand biomass. The 5% cumulative height percentile and leaf area index (LAI) were identified as more suitable predictor variables.
2. Good fitting performance of basic models: Both univariate and bivariate basic models demonstrated good fitting performance, with coefficients of determination R2 generally above 0.6. The fitting accuracy was highest for trunk and branch biomass, while leaf biomass model showed relatively lower fitting accuracy.
3. Impact of stand development stage on biomass: The stand developmental stage significantly influences the biomass of Chinese fir stands, making it essential to consider stand age when constructing stand models. Nonlinear mixed-effects models demonstrated higher fitting accuracy compared to dummy variable models. Machine learning methods significantly improved model fitting accuracy.
4. High predictive accuracy of the models: The models developed in this study exhibited high predictive accuracy, with all errors remaining within reasonable limits. These models are suitable for estimating the biomass of Chinese fir stands at the scale of Guangdong Province and can be applied in practical scenarios.
Data availability statement
The raw data supporting the conclusions of this article will be made available by the authors, without undue reservation.
Author contributions
XZ: Writing – original draft. TH: Writing – original draft. ZL: Writing – original draft. LB: Writing – original draft. YY: Writing – original draft. JY: Writing – original draft. QW: Writing – original draft. RS: Writing – review & editing. LF: Writing – review & editing.
Funding
The author(s) declare that financial support was received for the research and/or publication of this article. An airborne LiDAR-based model for estimating stand volume and aboveground biomass of major tree species in Guangdong Province (2021KJCX001).
Conflict of interest
The authors declare that the research was conducted in the absence of any commercial or financial relationships that could be construed as a potential conflict of interest.
The author(s) declared that they were an editorial board member of Frontiers, at the time of submission. This had no impact on the peer review process and the final decision.
Generative AI statement
The author(s) declare that no Generative AI was used in the creation of this manuscript.
Publisher’s note
All claims expressed in this article are solely those of the authors and do not necessarily represent those of their affiliated organizations, or those of the publisher, the editors and the reviewers. Any product that may be evaluated in this article, or claim that may be made by its manufacturer, is not guaranteed or endorsed by the publisher.
References
Andersen, H. E., Reutebuch, S. E., McGaughey, R. J. (2006). A rigorous assessment of tree height measurements obtained using airborne liDAR and conventional field methods. Can. J. Remote Sens. 32, 355–366.
Beland, M., Parker, G., Barkarrow, B., Harding, D., Chasmer, L., Phinn, S., et al. (2019). On promoting the use of lidar systems in forest ecosystem research. For. Ecol. Manage. 450, 117484.
Chen, X., Feng, L., Zhang, Y., Liu, Q., Yang, C., Fu, L., et al. (2022). Inversion of aboveground biomass in the core area of Chongli winter olympics based on airborne LiDAR. Scientia Silvae Sinicae 58, 35–46.
Chen, D., Huang, X., Zhang, S., Sun, X. (2017). Biomass modeling of larch (Larix spp.) plantations in China based on the mixed model, dummy variable model, and Bayesian hierarchical model. Forests 8, 268.
Deng, L., Yuan, S., Bai, P., Li, H. (2023). Evaluation of agricultural carbon emissions in Xinjiang and analysis of driving factors based on machine learning algorithms. Chin. J. Eco-Agriculture 31, 265–279.
Di, C. L., Gasparini, P., Tabacchi, G. (2016). Anational-scale, stand-level model to predict total above-ground tree biomass from growing stock volume. For. Ecol. Manage. 361, 269–276.
Dinh, H. T. M., Thuy, L. T., Fabio, R., Stefano, T., Ludovic, V., Maxime, R., et al. (2016). SAR tomography for the retrieval of forest biomass and height: cross-validation at two tropical forest sites in French Guiana. Remote Sens. Environ. 175, 138–147.
Dong, L. B., Shao, W. W., Tian, D. Y., Liu, Z. G. (2023). Height curve of natural Larix gmelinii in the Daxing’anling Mountains of northeastern China based on forest classification. J. Beijing Forestry Univ. 45, 88–96.
Du, Z., Chen, Z. X., Ma, K., Liu, Z. W., Gu, X. G. (2021). Estimating standing volume in southern collective forest region based on the unmanned aerial vehicle LiDAR characteristic variables. For. Resour. Manage. 4, 157–165.
Eisfelder, C., Kuenzer, C., Dech, S. (2012). Derivation of biomass information for semi-arid areas using remote-sensing data. Int. J. Remote Sens. 33, 2937–2984.
Emilien, A. V., Thomas, C., Thomas, H. (2021). UAV & satellite synergies for optical remote sensing applications: A literature review. Sci. Remote Sens. 3, 100019.
Fu, L. Y., Liu, Q. W., Sun, H. (2018). Developing a system of compatible individual tree diameter and aboveground biomass prediction models using error-in-variable regression and airborne LiDAR data. Remote Sens. 10, 325.
Guo, Z. X., Cao, C., Liu, P. (2022). Construction of biomass models of Cunninghamia lanceolata plantation based on continuous forest inventory in Guangdong. J. Cent. South Univ. Forestry Technol. 42, 78–89.
He, Q., Chen, E., An, R., Li, Y. (2013). Above-ground biomass and biomass components estimation using LiDAR data in a coniferous forest. Forests 4, 984–1002.
Holmgren, J. (2004). Prediction of tree height, basal area and stem volume in forest stands using airborne laser scanning. Scandinavian J. For. Res. 19, 543–553.
Huang, J. J., Liu, X. T., Zhang, Y. R., Li, H. K. (2022). Stand biomass growth model of broadleaved forest with parameter classification in Guangdong Province of southern China. J. Beijing Forestry Univ. 44, 19–33.
Jiang, Y., Hu, Z., Han, Z., Zhang, J., Han, S., Hao, L. (2022). Growth characteristics of Cunninghamia lanceolata in China. Sci. Rep. 12, 18179.
Khosravipour, A., Skidmore, A. K., Wang, T. J., Isenburg, M., Khoshelham, K. (2015). Effect of slope on treetop detection using a LiDAR canopy height model. ISPRS J. Photogrammetry Remote Sens. 104, 44–52.
Li, Y. C., Li, C., Li, M. Y., Liu, Z. Z. (2019). Influence of variable selection and forest type on forest aboveground biomass estimation using machine learning algorithms. Forests 10 1073.
Li, M., Liu, Q. W., Feng, Y. M., Li, Z. Y. (2022). Analysis of estimation models of plantation stand heights using UAV LiDAR. Natl. Remote Sens. Bull. 26, 2665–2678.
Lim, K. S., Treitz, P. M. (2004). Estimation of aboveground forest biomass from airborne discrete return laser scanner data using canopy-based quantile estimators. Scandinavian J. For. Res. 19, 558–570.
Liu, S. R., Dai, L. M., Wen, Y. H., Wang, H. (2015). A review on forest ecosystem management towards ecosystem services: status, challenges, and future perspectives. Acta Ecologica Sin. 35, 1–9.
Maltamo, M., Eerikäinen, K., Pitkänen, J., Hyyppä, J., Vehmas, M. (2004). Estimation of timber volume and stem density based on scanning laser altimetry and expected tree size distribution functions. Remote Sens. Environ. 90, 319–330.
Mao, P., Ding, J. J., Jiang, B. Q., Qin, L. J., Qiu, G. Y. (2022). How can UAV bridge the gap between ground and satellite observations for quantifying the biomass of desert shrub community? IBARKRS J. Photogrammetry Remote Sens. 192, 361–376.
Mutwiri, F. K., Odera, P. A., Kinyanjui, M. J. (2017). Estimation of tree height and forest biomass using airborne LiDAR data: a case study of londian forest block in the Mau Complex, Kenya. Open J. Forestry 7, 255–269.
Næsset, E., Gobakken, T. (2005). Estimating forest growth using canopy metrics derived from airborne laser scanner data. Remote Sens. Environ. 96, 453–465.
Noordermeer, L., Bollandsås, O. M., Gobakken, T., Næsset, E. (2018). Direct and indirect site index determination for Norway struck and Scots pine using bitemporal airborne laser scanner data. For. Ecol. Manage. 428, 104–114.
Organization, A (2017). FAO Voluntary Guidelines on National Forest Monitoring (Italy: Food and Agriculture Organization of the United Nations).
Pawe, H., Piotr, T., Piotr, W. (2017). Area-based estimation of growing stock volume in Scots pine stands using ALS and airborne image-based point clouds. Forestry 5, 686–696.
Pinheiro, J. C., Bates, D. M. (2000). Mixed-effects models in S and S-plus (New York: Spring Verlag).
Qu, Y. T., Wang, Y., Liu, G. C., Fan, W. Y. (2014). The inversion of forest biomass based on GLAS laser radar. Bull. Surveying Mapp. 11, 73–77.
Song, X., Zhou, G., Jiang, H., Yu, S., Fu, J., Li, W., et al. (2011). Carbon sequestration by Chinese bamboo forests and their ecological benefits: assessment of potential, problems, and future challenges. Environ. Rev. 19, 418–428.
Stovall, A. E., Vorster, A. G., Anderson, R. S., Evangelista, P. H., Shugart, H. H. (2017). Non-destructive aboveground biomass estimation of coniferous trees using terrestrial LiDAR. Remote Sens. Environ. 200, 31–42.
Sun, Y., Li, F., Xie, L., Dong, L. (2023). Construction of the stand-level biomass model of Larix oogenesis plantations based on stand and topographic factors. J. Nanjing Forestry University(Natural Sci. Edition) 47, 129–136.
Tang, X., Liu, D., Wang, Z., Jia, M., Dong, Z. (2012). Estimation of forest aboveground biomass based on remote sensing data: A review. Chin. J. Ecol. 31, 1311–1318.
Trofymow, J. A., Coops, N. C., Hayhurst, D. (2014). Comparison of remote sensing and ground-based methods for determining residue burn pile wood volumes and biomass. Can. J. For Res. 44, 182–194.
Wallace, L., Lucieer, A., Malenovský, Z., Turner, D., Vopěnka, P. (2016). Assessment of forest structure using two UAV techniques: a comparison of airborne laser scanning and structure from motion (SfM)point clouds. Forests 7, 62.
Wang, M., Borders, B. E., Zhao, D. (2008). An empirical comparison of two subject-specific approaches to dominant heights modeling, the dummy variable method and the mixed model method. For. Ecol. Manage. 255, 2659–2669.
White, J. C., Stepper, C., Tompalski, P., Coops, N. C., Wulder, M. A. (2015). Comparing ALS and image-based point cloud metrics and modelled forest inventory attributes in a complex coastal forest environment. Forests 6, 3704–3732.
Xian, L. H., Zhu, X. R., Lu, D. H., Chen, H. Y., Gu, D. Q. (2024). Estimation models of forest stand biomass using combined multi-spectral and LiDAR technologies. J. Northeast Forestry Univ. 52, 85–94.
Xiang, W. H., Li, L. H., Xiao, W. F., Zeng, L. X., Chen, L., Lei, P. F., et al. (2021). Effects of stand age on tree biomass partitioning and allometric equations in Chinese fir (Cunninghamia lanceolata) plantations. Eur. J. For. Res. 140, 317–332.
Xie, D., Huang, H., Feng, L., Sharma, R. P., Chen, Q., Liu, Q., et al. (2023). Aboveground biomass prediction of arid shrub-dominated community based on airborne LiDAR through parametric and nonparametric methods. Remote Sens. 15, 3344.
Xie, Y. Y., Wang, B., Yao, Y., Yang, L., Gao, Y., Zhang, Z. M., et al. (2020). Quantification of vertical community structure of subtropical evergreen broad-leaved forest community using UAV-Lidar data. Acta Ecologica Sin. 40, 940–951.
Xu, Z. Q., Cao, L., Ruan, H. H., Li, W. Z., Jiang, S. (2015). Inversion of subtropical forest stand characteristics by integrating very high-resolution imagery acquired from UAV and LiDAR point-cloud. Chin. J. Plant Ecol. 39, 694–703.
Yan, W., Guan, H., Cao, L., Yu, Y., Li, C., Lu, J. A. (2020). Self-adaptive mean shift tree-segmentation method using UAV LiDAR data. Remote Sens. 12, 515.
Yu, S. H., Chen, X. Y., Huang, X., Chen, Y. C., Hu, Z. Y., Liu, J., et al. (2023). Research on the estimation of Chinese fir stand volume based on UAV-LiDAR technology. Forests 14, 1252.
Yu, Z., Li, C., Huang, Y. (2023). Height growth changes of Cunninghamia lanceolata stands based on airborne LiDAR. Guangxi Forestry Sci. 52, 581–588.
Yu, Y., Yao, H., Xiao, W., Wang, Q., Ye, J. (2024). Estimation of forest carbon storage in Chinese fir plantation by UAV-Lidar. J. Northwest Forestry Univ. 39, 131–137.
Yuan, Y., Peng, D., Wang, W., Zeng, W. (2021). Estimating standing stocks of the typical conifer stands in Northeast China based on airborne LiDAR data. Chin. J. Appl. Ecol. 32, 836–844.
Zeng, W. S. (2013). Generalized tree biomass equations of Chinese fir in China. Cent. South For. Inventory Plann. 32, 4–15.
Zeng, W., Sun, X., Wang, L., Wang, W., Pu, Y. (2021). Development of forest stand volume models based on airborne laser scanning data. Sci. Silv Sin. 57, 31–38.
Zhang, W., Qi, J., Wan, P., Wang, H., Xie, D., Wang, X., et al. (2016). An easy-to-use airborne LiDAR data filtering method based on cloth simulation. Remote Sens. 8, 501.
Zhang, Z., Tian, Y., Deng, J., Yao, G., Li, Y. (2024). Biomass inversion of typical mangrove forests in Qinzhou Bay based on LiDAR. Ecol. Sci. 43, 203–210.
Zhao, P., Lu, D., Wang, G., Liu, L., Li, D., Zhu, J., et al. (2016). Forest aboveground biomass estimation in Zhejiang Province using the integration of Landsat TM and ALOS PALSAR data. Int. J. Appl. Earth Observation Geoinformation 53, 1–15.
Zhao, S. Y., Wang, R. H., Liu, K. L. (2020). Effects of thinning on growth and understory vegetation diversity of Chinese fir plantation at different ages. J. Cent. South Univ. Forestry Technol. 40, 34–43,82.
Zhou, X., Li, C., Dai, H., Yu, Z., Li, Z., Su, et al. (2023). Effects of point cloud density on the estimation accuracy of large-Area subtropical forest inventory attributes using airborne LiDAR data. Scientia Silvae Sinicae 59, 23–33.
Zhou, Y., Zhang, Z., Zhu, B., Cheng, X., Yang, L., Gao, M., et al. (2021). MaxEnt modeling based on CMIP6 models to project potential suitable zones for Cunninghamia lanceolata in China. Forests 12, 752.
Keywords: airborne LiDAR, forest biomass, regression modeling, age grouping, dummy variable modeling
Citation: Zhu X, Huang T, Liu Z, Bai L, Yang Y, Ye J, Wang Q, Sharma RP and Fu L (2025) Developing a generalized nonlinear mixed-effects biomass model at stand-level under different age conditions for Chinese fir based on LiDAR and ground survey data in southern China. Front. Plant Sci. 16:1532138. doi: 10.3389/fpls.2025.1532138
Received: 21 November 2024; Accepted: 14 April 2025;
Published: 08 May 2025.
Edited by:
Kai Huang, Jiangsu Academy of Agricultural Sciences (JAAS), ChinaReviewed by:
Zongzheng Chai, Guizhou University, ChinaYuanshuo Hao, Northeast Forestry University, China
Zhibin Sun, Colorado State University, United States
Qingfen Li, South China Agricultural University, China
Copyright © 2025 Zhu, Huang, Liu, Bai, Yang, Ye, Wang, Sharma and Fu. This is an open-access article distributed under the terms of the Creative Commons Attribution License (CC BY). The use, distribution or reproduction in other forums is permitted, provided the original author(s) and the copyright owner(s) are credited and that the original publication in this journal is cited, in accordance with accepted academic practice. No use, distribution or reproduction is permitted which does not comply with these terms.
*Correspondence: Liyong Fu, ZnVseUBpZnJpdC5hYy5jbg==