 Abdolrahim Zandi1
 Seyedali Hosseinirad2
 Hossein Kashani Zadeh3Kouhyar Tavakolian1
 Byoung-Kwan Cho4Fartash Vasefi2Moon S. Kim5Pantea Tavakolian1,3*
- 1Biomedical Engineering Department, College of Engineering and Mines, University of North Dakota, Grand Forks, ND, United States
- 2SafetySpect Inc., Grand Forks, ND, United States
- 3Mechanical Engineering Department, University of North Dakota, Grand Forks, ND, United States
- 4Department of Smart Agricultural Systems, Chungnam National University, Daejeon, Republic of Korea
- 5U.S Department of Agriculture/Agricultural Research Service (USDA/ARS) Environmental Microbial and Food Safety Laboratory, Beltsville Agricultural Research Center, Beltsville, MD, United States
Introduction: Detecting plant stress is a critical challenge in agriculture, where early intervention is essential to enhance crop resilience and maximize yield. Conventional single-mode approaches often fail to capture the complex interplay of plant health stressors.
Methods: This review integrates findings from recent advancements in Multi-Mode Analytics (MMA), which employs spectral imaging, image-based phenotyping, and adaptive computational techniques. It integrates machine learning, data fusion, and hyperspectral technologies to improve analytical accuracy and efficiency.
Results: MMA approaches have shown substantial improvements in the accuracy and reliability of early interventions. They outperform traditional methods by effectively capturing complex interactions among various abiotic stressors. Recent research highlights the benefits of MMA in enhancing predictive capabilities, which facilitates the development of timely and effective intervention strategies to boost agricultural productivity.
Discussion: The advantages of MMA over conventional single-mode techniques are significant, particularly in the detection and management of plant stress in challenging environments. Integrating advanced analytical methods supports precision agriculture by enabling proactive responses to stress conditions. These innovations are pivotal for enhancing food security in terrestrial and space agriculture, ensuring sustainability and resilience in food production systems.
1 Introduction
Early prediction of plant stress accurately presents complexity due to dynamic interactions among spatial and spectral data, variability in plant responses to environmental stimuli, and limitations in real-time measurements. Furthermore, Improving the tolerance of crop species to abiotic stresses that limit plant growth and productivity is essential for mitigating the emerging problems of global warming (Anshori et al., 2023). Farmers can intuitively detect plant stress events by observing several apparent indicators. For instance, leaf rolling often occurs as plants curl their leaves to conserve water during drought conditions (Kozlowski, 1968). Color changes, such as yellowing leaves, can signal nutrient deficiencies (Marschner and Rengel, 2023), while browning might indicate overwatering or disease (Desai, 2004). Wilting is another clear sign, as drooping leaves or stems suggest insufficient water supply (Jones, 2022). Stunted growth can indicate poor soil conditions or a lack of nutrients, while premature leaf drop often results from environmental stress, such as extreme temperatures. Monitoring a single pattern of stressful events or indicators provides an opportunity to mitigate crop failure.
Multi-mode analytics integrates data from multiple detection modes and spectral bands to model plant stress responses accurately (Coatsworth et al., 2023). It captures real-time data to distinguish transient from prolonged stress while detecting early biochemical shifts in photosynthesis before symptoms appear (Lobos et al., 2021; Wang et al., 2022). Correcting for overlapping spectral signals, such as chlorophyll and non-photosynthetic pigments, enhances accuracy (Miao et al., 2020). Multi-mode systems also track recurrent stress patterns, distinguishing adaptive responses from new stressors and identifying concurrent nutrient and water deficiencies (Li et al., 2024; Iqbal and Munir, 2024). Figure 1 depicts early biotic stress patterns on apples, cherries, grapes, peaches, peppers, potatoes, squash, and strawberries that can benefit from Multi-mode analytical stress detection.
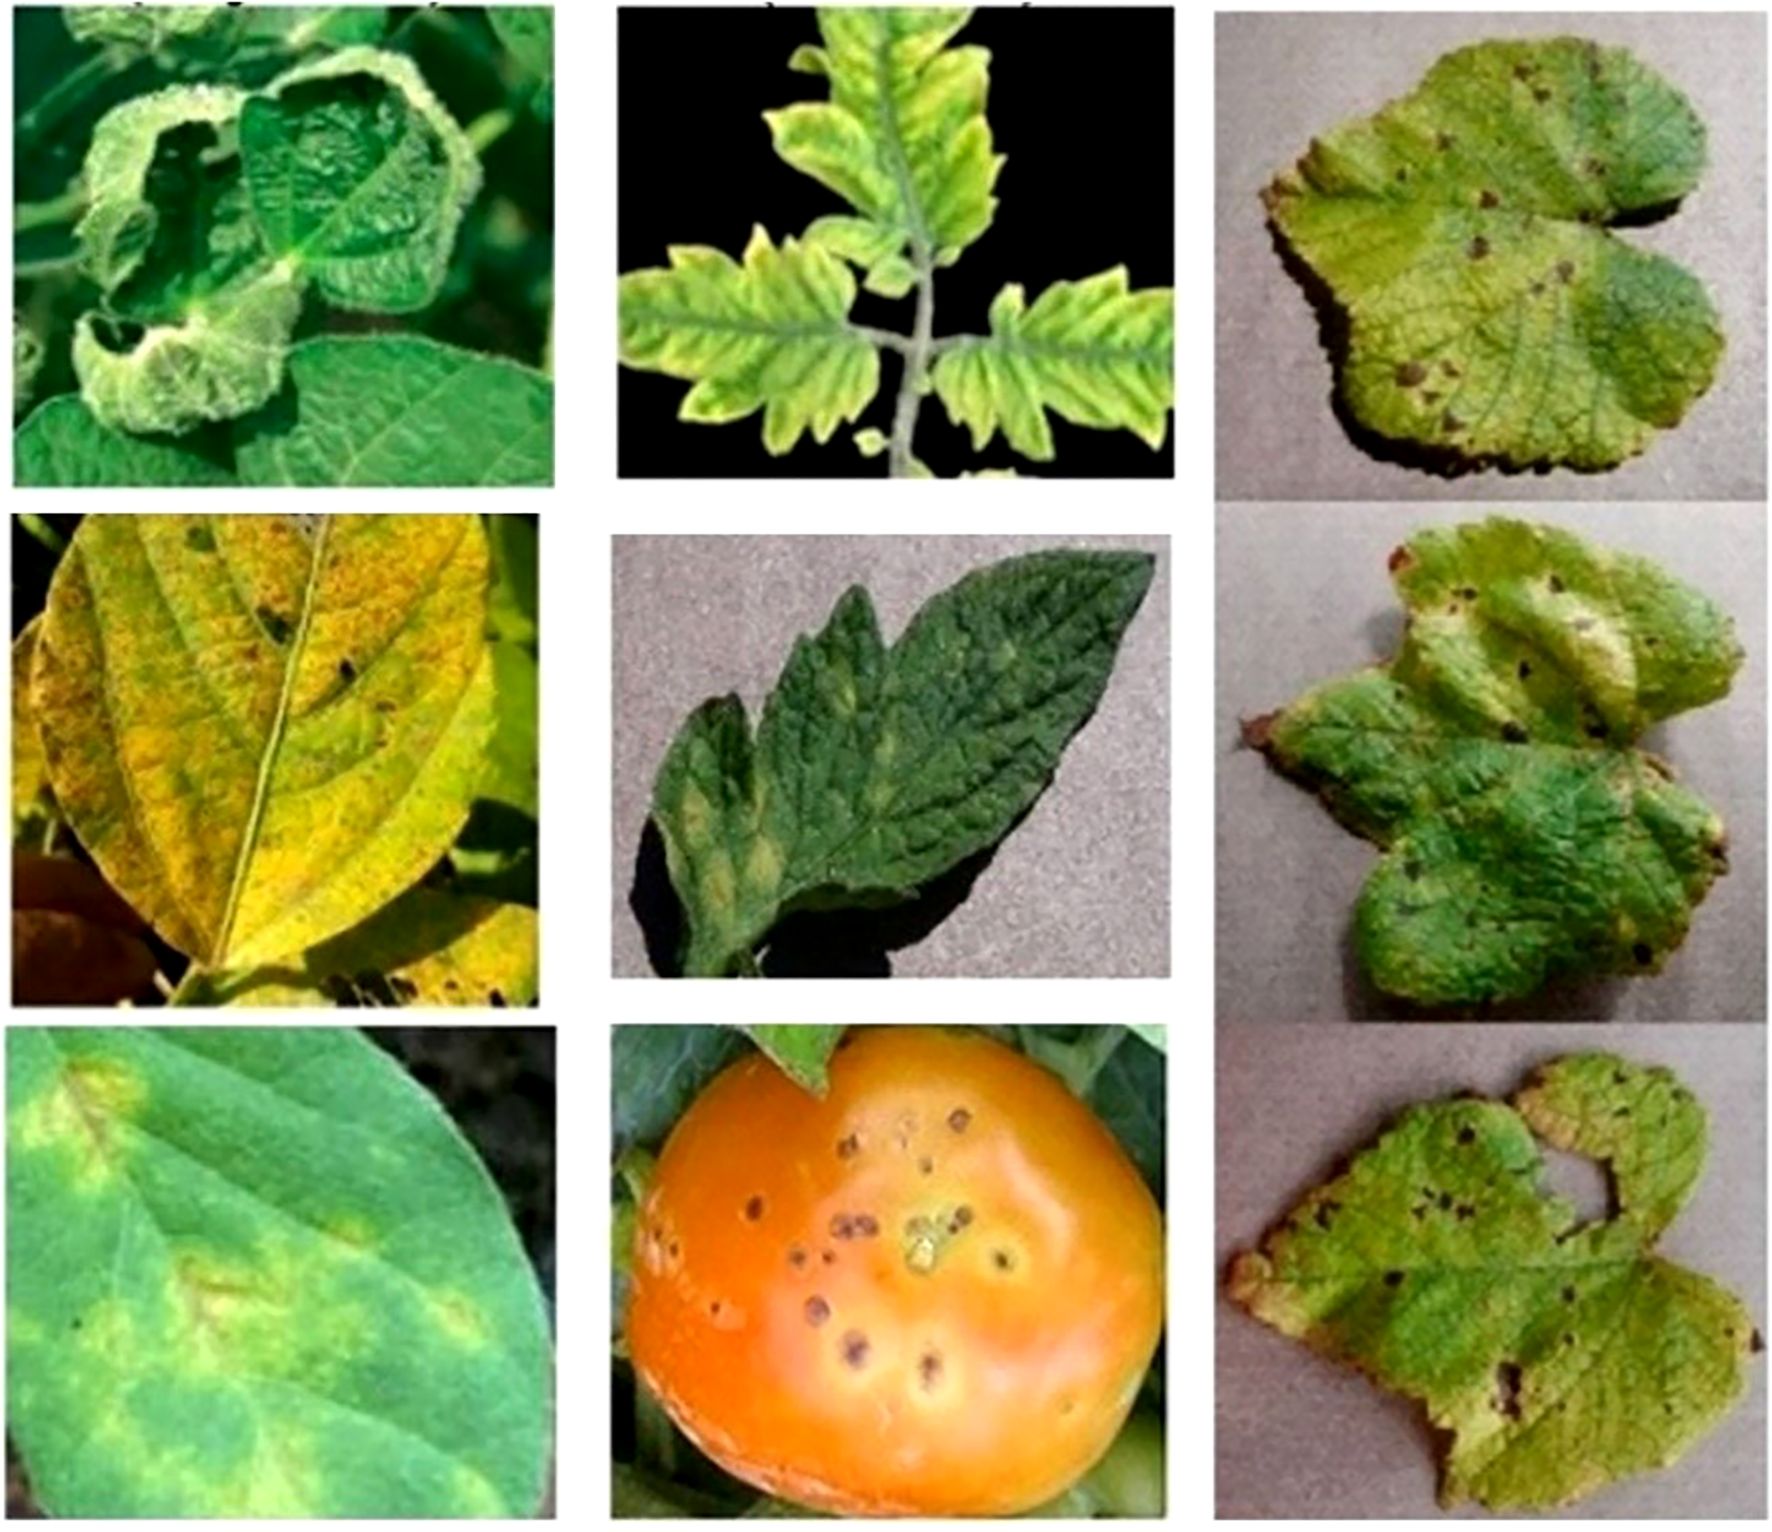
Figure 1. Early stress pattern recognition and mapping the correct indices to the events are crucial for accurate and timely intervention. ([Left column: Bacterial Blight in soybean, top: leaf curling, middle: yellowing, and bottom: structural decay. Shannon, 2021; Hossain, 2023; Tarakanov et al., 2022], [Middle column: Mosaic Virus in tomato, top: stunted and yellow, middle: mosaic appearance, and bottom: Irregular spots. Wolters, 2021; Zhao, 2021; Osdaghi et al., 2021], [Right column: blight disease in grape, appearance and structural change. Yang 2024]).
Single-mode analytics (e.g., UV, IR, Raman) fail to assess multiple stressors simultaneously, limiting plant health insights. Raman spectroscopy detects molecular vibrations but provides limited physiological data. In contrast, multi-mode analytics (MMA) integrates hyperspectral reflectance imaging (HRI), hyperspectral fluorescence imaging (HFI), LiDAR, and Machine Learning (ML) for enhanced stress detection and mapping (Mu et al., 2020). This approach enables near-real-time monitoring of plant responses to biotic and abiotic factors.
—MMA domain includes combinatorial microstate stress patterns, hyperspectral, statistical, and multi-dimensional eigenvector data reduction (Gu et al., 2021) such as Principle Component Analysis (PCA), Partial Least Square Regression, hybrid data fusion, significantly enhance the accuracy of stress indicators, predict the root causes of stress events, expedite data processing, and increase crop yield in terrestrial and space environments.
2 Review methodology and strategy
We searched Web of Science (1956 records) and PubMed (418 records) for studies from 2002 to 2024 using keywords related to multimodal plant stress analysis. After removing duplicates, 2,368 records remained. We screened 600 abstracts and selected 350 full-text studies, excluding those focused on single-mode spectroscopy, non-agricultural stress, or non-spectral imaging. The review followed the PRISMA framework for transparency and rigor.
3 Plant stress types and responses
3.1 Plants respond to stress
Plants respond to stress through various mechanisms and response times. Stress types include abiotic factors like drought, salinity, and heat and biotic factors like pathogens and herbivores (Zhang et al., 2023). Responses such as stomatal closure and antioxidant production can be immediate or delayed, like root elongation and leaf abscission. Mechanisms include morphological changes (e.g., altered root-to-shoot ratio) (Luong and Loik, 2022), physiological adjustments (e.g., osmoregulation), biochemical responses (e.g., antioxidant production, hormone signaling), and molecular changes (e.g., stress-responsive gene expression) (Seok et al., 2023). Outcomes include tolerance through physiological adjustments, avoidance via strategies like stomatal closure, resistance through structural defenses, or escape by completing the life cycle before stress intensifies. Additionally, plants may exhibit hormesis, a beneficial response to low stress levels that enhance growth, development or stress resilience. These adaptations and responses collectively help plants survive and thrive in challenging environments.
In contrast, biotic stresses like pathogenic attacks often manifest over a more extended period, progressing from initial symptoms such as leaf curling to color changes, wilting, and the appearance of lesions or spots. The onset of these symptoms can span several days to weeks, making early detection more challenging. For example, bacterial leaf streaks in rice are caused by Xanthomonas oryzae pv. oryzicola, initiates as thin, water-soaked streaks that gradually turn yellowish-brown, with symptoms developing over several days (Fang et al., 2019). In maize (Zea mays), late wilt disease caused by Magnaporthiopsis maydis develops late in the growing season, with symptoms including rapid wilting and plant death, often after flowering (Degani et al., 2021). These examples underscore the importance of early detection and tailored management strategies for different crops and stress types (Hekimhan and Aydoğdu, 2024). Table 1 provides classifications of plant stress types and their typical responses ranging from minutes to hours and days.
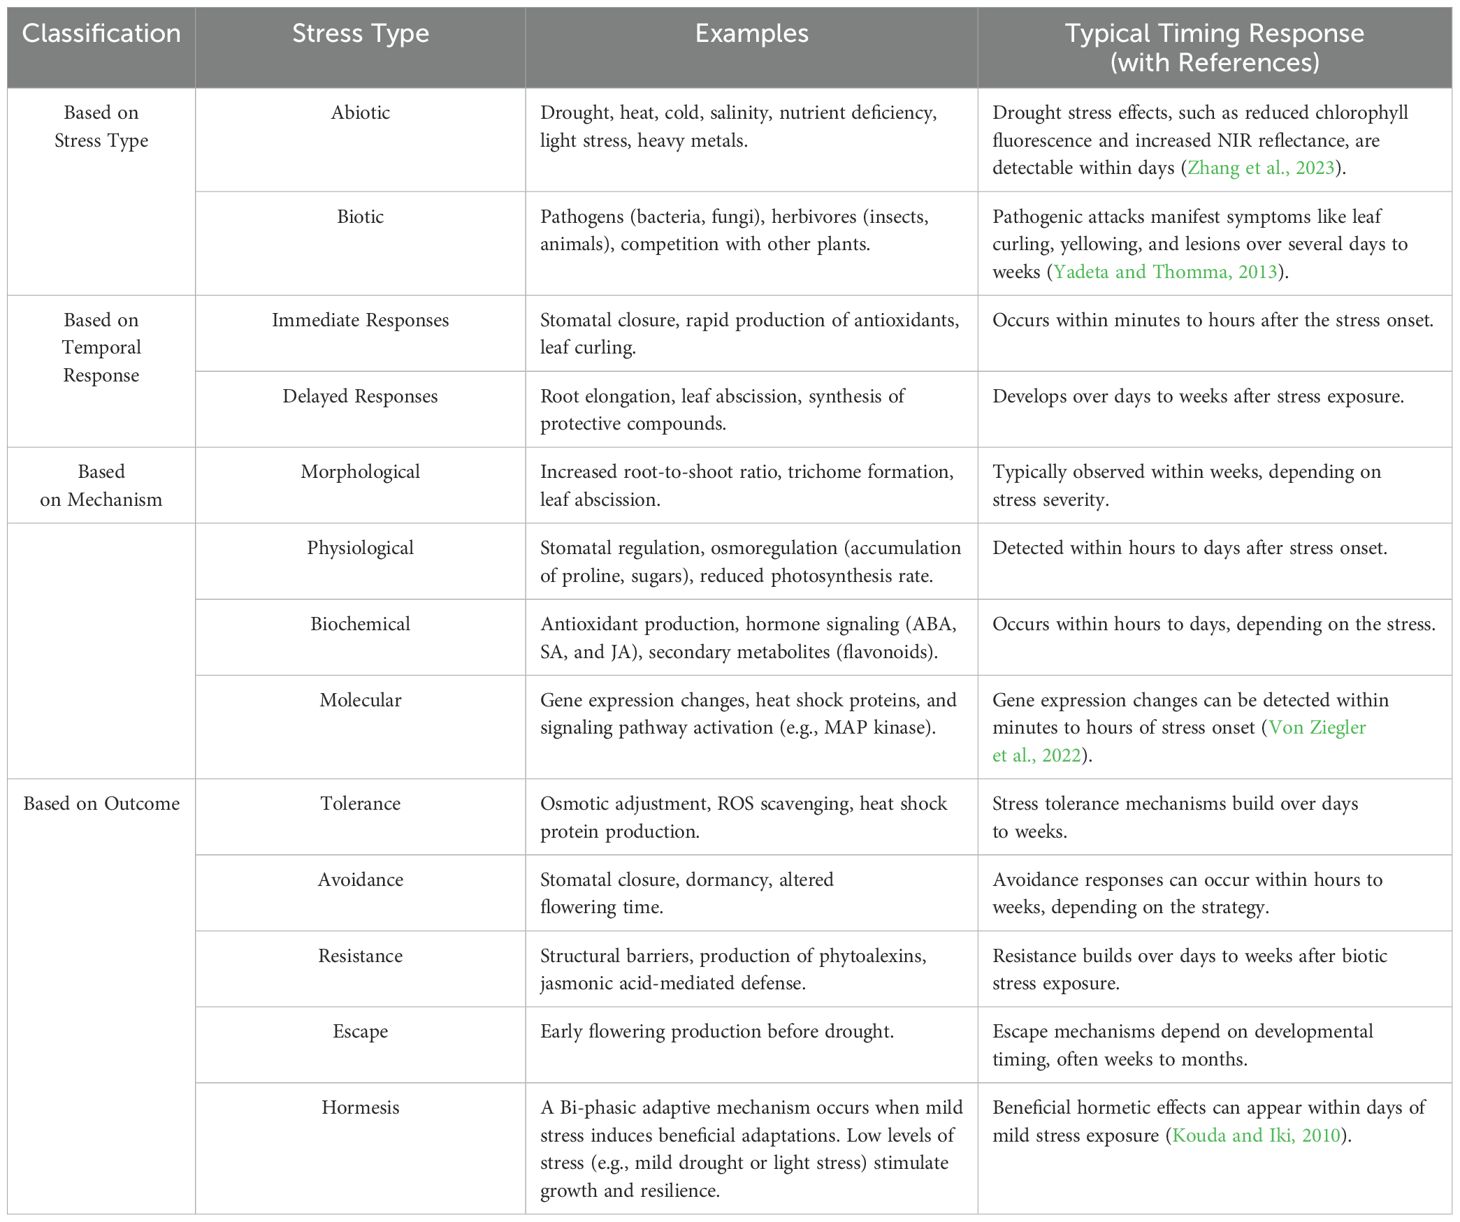
Table 1. Plant stress types and responses.
3.2 Stress response time
Plants exhibit stress responses that vary in timing and detectability, depending on the stress type and severity. Stress responses depend on environmental variability, sensors, calibration, MMA methods, and sensing devices. Under drought conditions, physiological changes such as reduced chlorophyll concentration can occur within days, detectable through decreased chlorophyll fluorescence in the visible red spectrum and increased leaf reflectance in the near-infrared (NIR) region. For instance, studies have shown that chlorophyll fluorescence parameters can indicate drought stress effects on photosynthesis and secondary metabolism within a week (Zhang et al., 2018). In contrast, biotic stresses like pathogenic attacks often manifest over a more extended period, progressing from initial symptoms such as leaf curling to color changes, wilting, and the appearance of lesions or spots. The onset of these symptoms can span several days to weeks, making early detection more challenging. For example, the progression of vascular wilt diseases involves a series of symptoms that develop over time, complicating timely diagnosis (Yadeta and Thomma, 2013).
3.3 Environmental variability
Environmental variability significantly affects the accuracy of MMA methods for plant stress detection and response time assessment. Temperature fluctuations can alter the refractive indices of optical materials, leading to measurement inaccuracies in hyperspectral imaging (Wang et al., 2020). Pressure and humidity changes influence light propagation in multi-mode fibers, affecting the precision of optical coherence tomography (Hyvärinen and Oja, 2000). Moreover, environmental factors modulate plant stress responses, impacting detection times, as observed in crop drought stress studies (Mertens et al., 2023). Advances in electronic technology and software development can enhance the accuracy of MMA, enabling more robust and reliable plant stress detection (Khonina et al., 2023).
3.4 Early detection
The key features of early stress detection include detecting non-visible indicators such as altered chlorophyll fluorescence emission, leaf reflectance/absorption, or thermal signature, often observable within days of stress onset (Zhang et al., 2018). Figure 2 depicts some of the visible indicators of plant stresses. Early detection precedes signs of stress and enables preventive actions like adjusting irrigation or applying treatments to avoid long-term damage. Stress-specific patterns, such as drought-induced photosynthesis reductions or pathogenic attacks’ sequential symptoms, require tailored detection approaches. By preserving plant health, minimizing resource use, and improving precision agriculture, early detection is critical for optimizing productivity (Yadeta and Thomma, 2013). Figure 3 provides examples of various types of plant stress. Early detection means predicting plant stress before visible signs of stress appear.
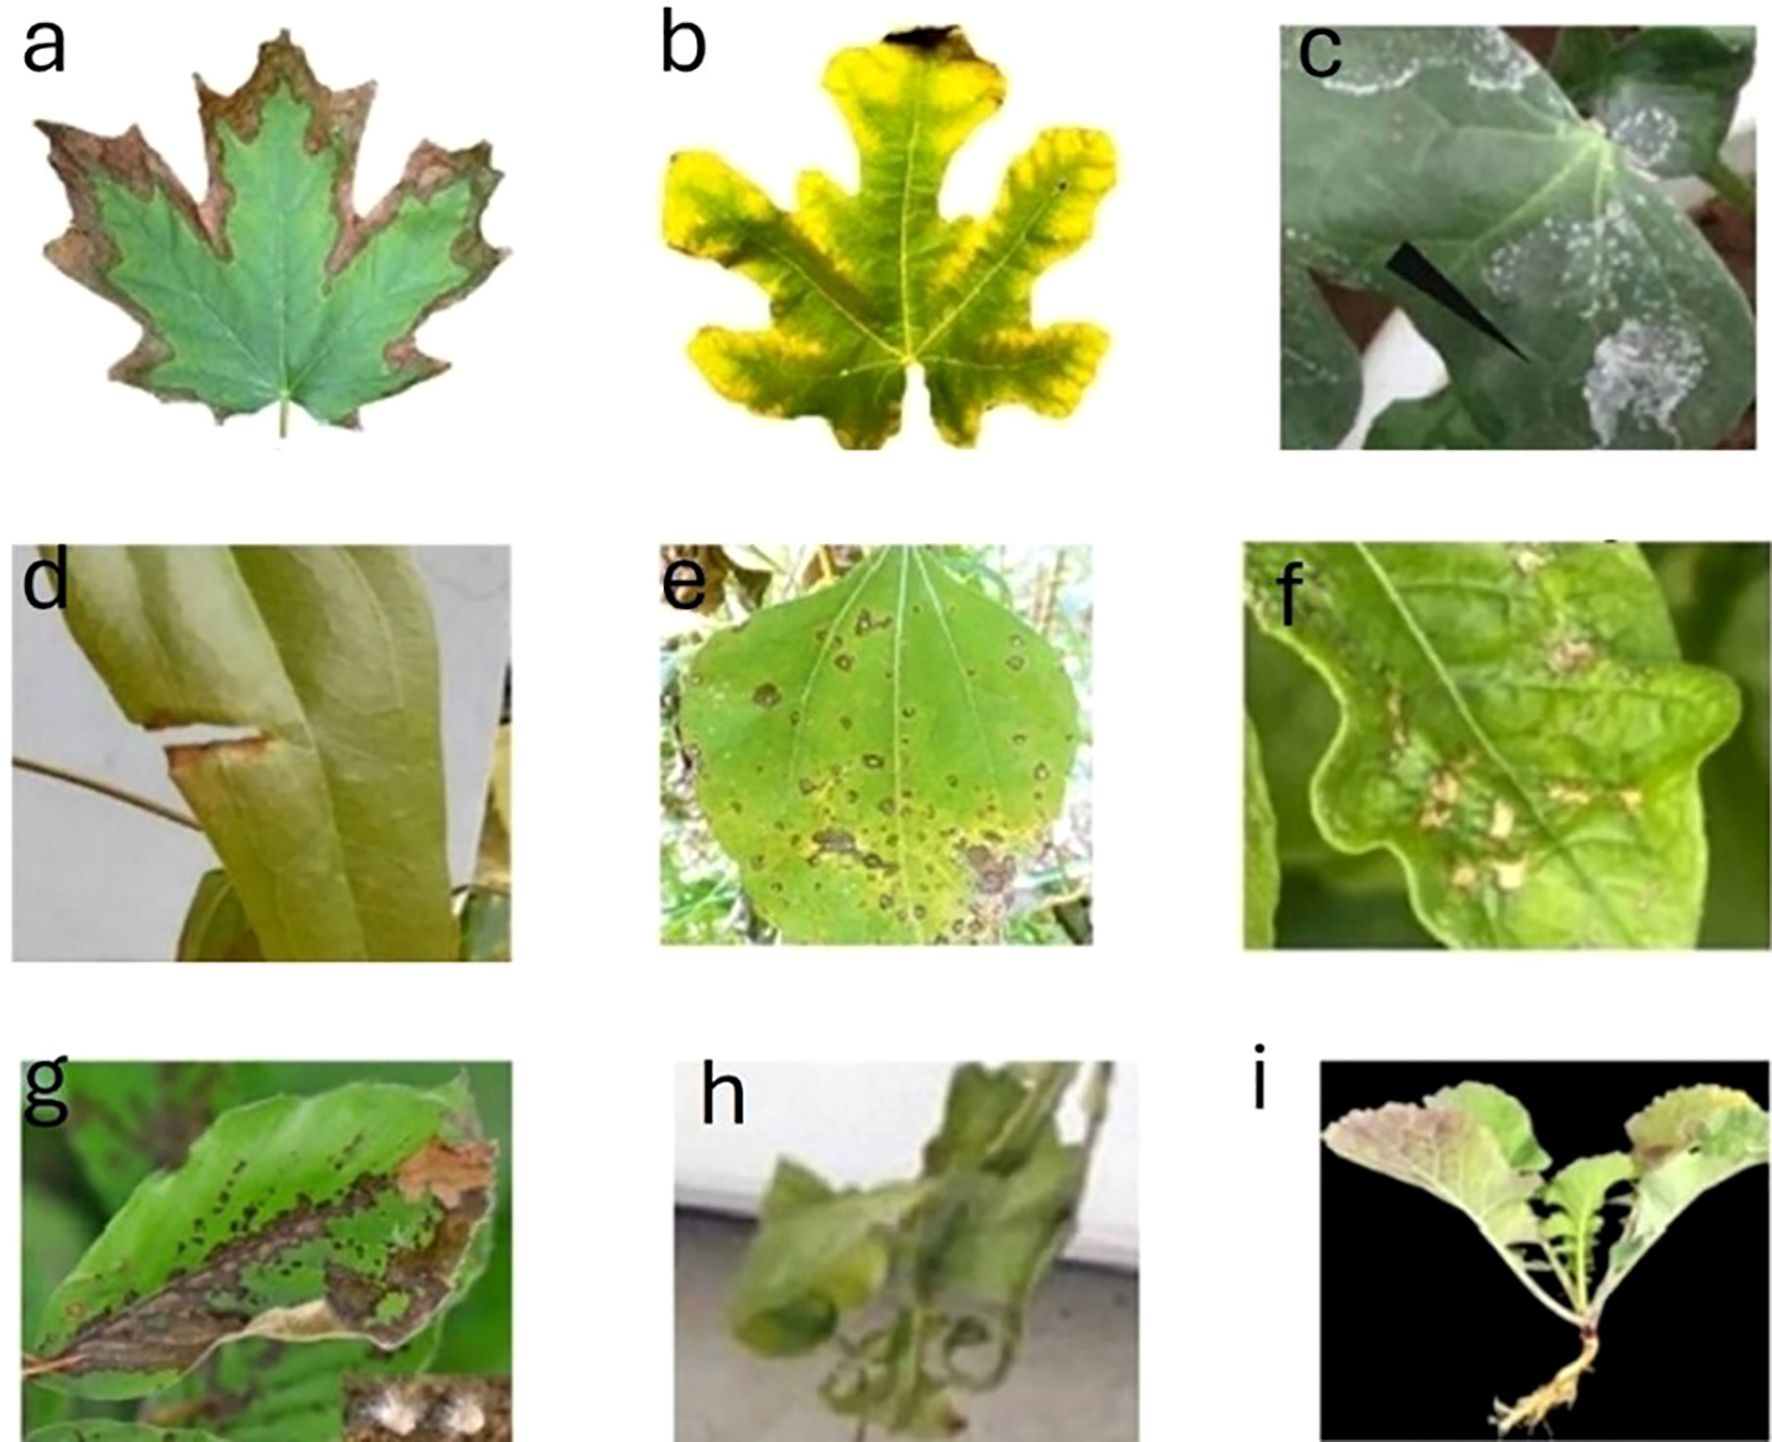
Figure 2. Early detection precedes visible indicators of plant stresses. ((A) drought stress [wang, 2023], (B) nutrient deficiency [Garza-Alonso et al., 2019], (C) salinity [Peng et al., 2016], (D) heat stress [Bi et al., 2020], (E) pathogen attack [Shafique et al., 2022], (F) pest infection [Li et al., 2024], (G) fungal infection [Gossner et al., 2021], (H) cold stress [Primo-Capella et al., 2021], and (I) waterlogging [Hong et al., 2024]).
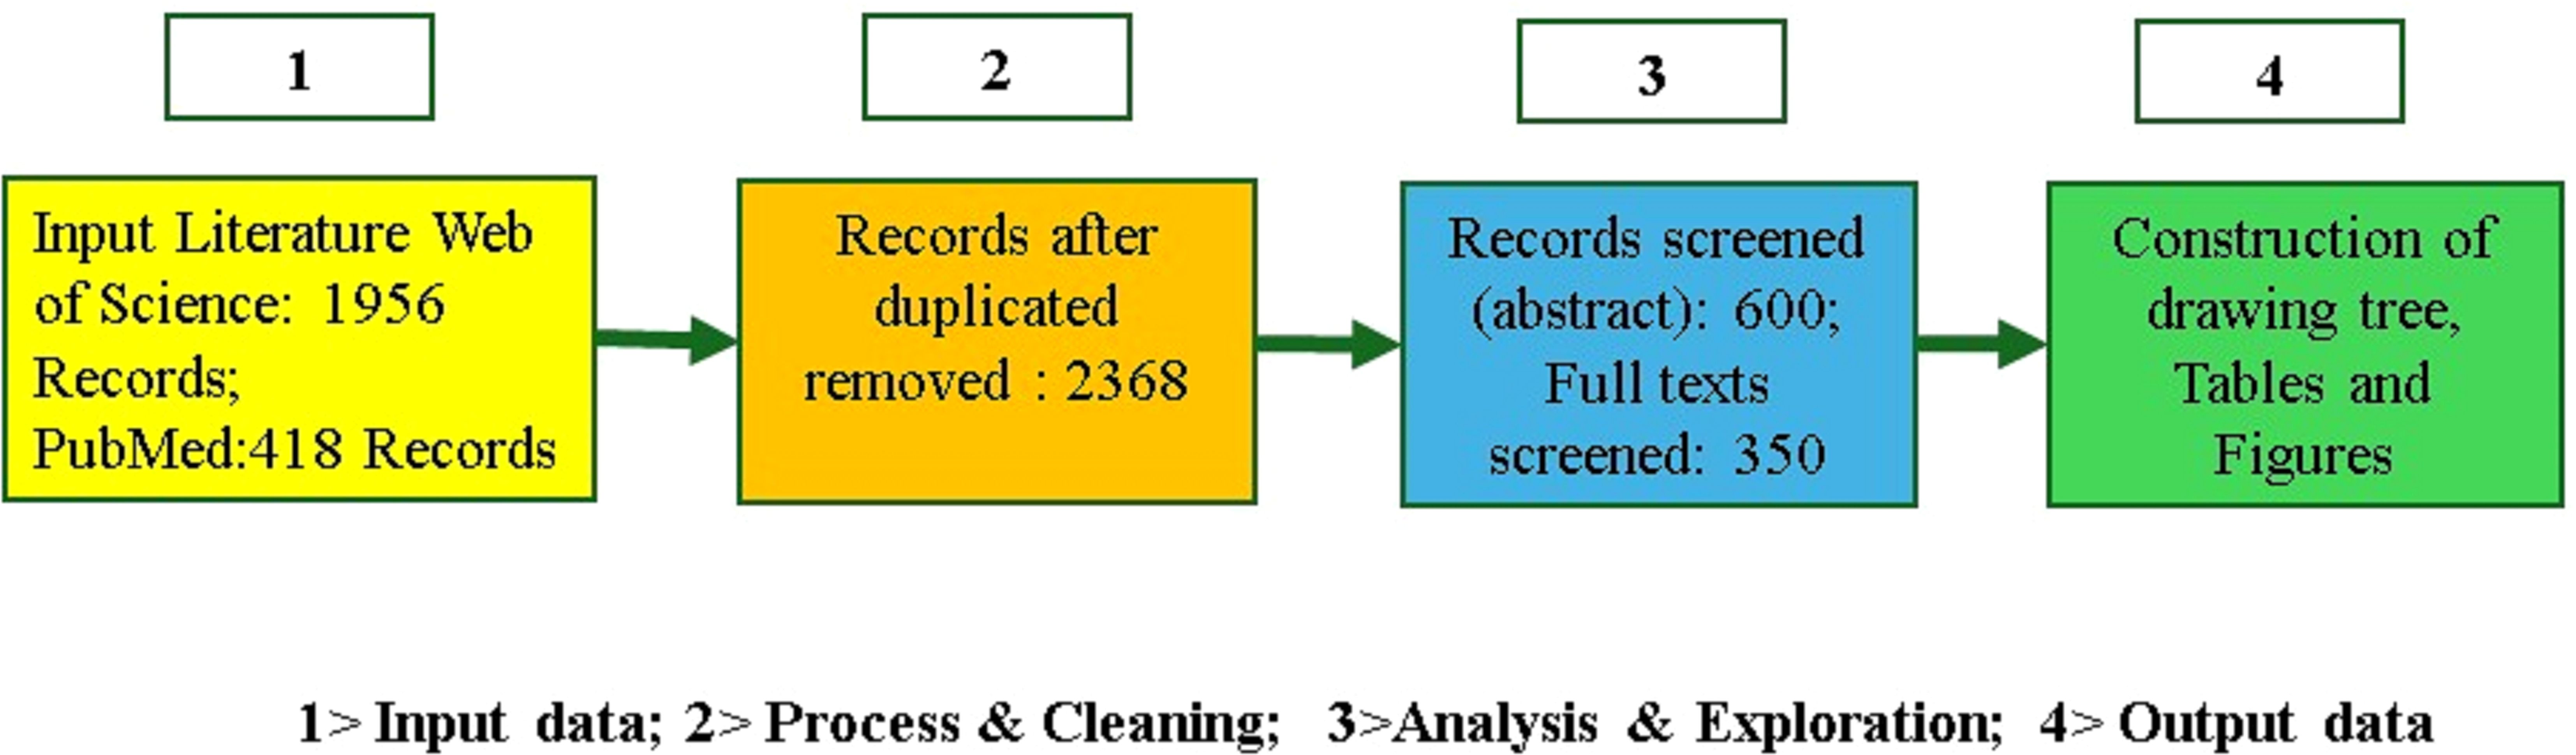
Figure 3. Block diagram of the systematic approach used to review the topic of multi-mode analytics.
4 Value of multi-mode analytics
Analytics systematically analyzes plant health, growth, and stress data to support informed agricultural decisions (Kamilaris et al., 2017). This process collects and interprets data from sensors, satellite imagery, and laboratory tests to identify patterns that guide management practices (Sarfraz et al., 2023). It enables early stress detection, allowing timely interventions (Aina et al., 2024). Lenk et al. (2007) used multispectral fluorescence and reflectance imaging to assess leaf-level stress responses, identifying fluorescence signatures linked to chlorophyll and other pigments. Lang et al. (1996) demonstrated that fluorescence imaging detects physiological changes by analyzing red and far-red chlorophyll fluorescence under drought stress. Leufen et al. (2014) combined fluorescence indices and reflectance data to differentiate abiotic and biotic stressors, enhancing stress monitoring precision.
The shift from single-mode to multi-mode approaches has improved plant stress detection by integrating multiple spectral bands and detection modes. Thermal imaging enhances water stress monitoring in almonds, aiding targeted irrigation (García-Tejero et al., 2018). Hyperspectral and thermal imaging combined improve drought stress and transpiration assessments (Mertens et al., 2023). Chlorophyll fluorescence detects phosphorus deficiency (Frydenvang et al., 2015), while AI-assisted fluorescence identifies nutrient deficiencies (Aleksandrov, 2019). Key multi-mode analytics features include stress pattern recognition and indicator mapping.
-One of the critical features of the multimodal analytical approach is stress pattern recognition and stress indicator mapping, which enables early detection and differentiation of biotic and abiotic stressors (Fiorani and Schurr, 2013). Additionally, it integrates diverse detection modes—such as hyperspectral reflectance, fluorescence, and thermal imaging—to capture complementary information about plant physiology (Mertens et al., 2023). This approach enhances the sensitivity and specificity of stress detection by leveraging data from multiple spectral bands (e.g., VIS, NIR, SWIR) and combining optical and non-optical datasets. Multimodal analytics also supports advanced ML techniques for refining analysis and automating processes while addressing practical challenges like calibration, data management, and cost efficiency (Fiorani and Schurr, 2013; Jones et al., 2019). Multi-mode Analytics increases the possibility of Predicting the Root Cause of plant stress. Cross-modal contribution is another essential feature unavailable in single-mode analytics, which leads to monitoring errors.
4.1 Mapping and pattern recognition
Pattern recognition identifies the sequence of stress indicators, while mapping quantifies their severity and distribution. For instance, a typical water stress pattern might involve initial leaf edge curling, followed by an increase in near-infrared reflectance as seen in the Normalized Difference Vegetation Index (NDVI), and a subsequent decrease in Chlorophyll Content Index (CCI) (Zubler and Yoon, 2020). Mapping these indicators allows researchers to develop a framework for early water stress detection, which can be vital in environments where resource limitations or mission constraints make rapid interventions necessary (Farella et al., 2022).
4.2 Integration
MMA enhances plant stress detection by integrating diverse sensing methods. Hyperspectral Fluorescence Imaging (HFI) captures chlorophyll fluorescence, revealing early stress indicators (Moustaka and Moustakas, 2023). Hyperspectral Reflectance Imaging (HRI) assesses pigment concentrations and water content, while thermal imaging detects canopy temperature changes linked to water stress. LiDAR provides structural data, improving the interpretation of reflectance and fluorescence signals (Meemken, Becker-Reshef, et al., 2024). This synergy enhances sensitivity and specificity, linking physiological responses to structural changes for comprehensive plant monitoring.
4.3 Enhanced sensitivity and specificity
Multi-HRI offers detailed spectral information by capturing a wide range of wavelengths that provide insights into various aspects of plant physiology, including the health of plant pigments, water content, and cellular structure (Maimaitijiang et al., 2020). This capability identifies subtle changes that might indicate stress before visible symptoms become apparent.
4.4 Predicting plant stress root causes
Predicting plant stress root causes relies on ML and multimodal data fusion (MMDF) to analyze complex datasets and identify hidden patterns (Li & Zhao, 2022). MMDF integrates diverse data streams for clearer insights (Bokade et al., 2021). For instance, correlating NDVI with the Red-Edge Inflection Point (REIP) helps detect water stress early by linking chlorophyll loss to canopy impairment (Arief et al., 2023). Similarly, combining the LiDAR-derived Leaf Area Index (LAI) with the Photochemical Reflectance Index (PRI) reveals nitrogen deficiency patterns (Lefsky et al., 2002). Such integrations enhance early and precise stress detection.
4.5 Cross-modal contribution
Chappelle et al. (1992) determined that the contribution of chlorophyll fluorescence in the Red-NIR (680-750 nm) region of the reflectance spectra can be as great as 23% of reflectance at 685 nm and 4% at 740 nm. for soybeans and fluorescence changes in reflectance have minimal contribution to the “red edge shift” effect. Kim et al. (1993) developed the Ratio Analysis of Reflectance Spectra (RARS) algorithm to estimate chlorophyll a, b, and carotenoid concentrations in plant leaves. This process amplifies the absorption band maxima and minima specific to each pigment. By comparing the ratio spectrum with the absorption spectra of pure pigments, they identified inflection points related to chlorophylls and carotenoids. The RARS algorithm uses these ratio spectra to establish linear solid relationships between absorption bands and pigment concentrations, forming the foundation for accurate equations to estimate these pigment levels in leaves.
5 Photon-leaf interaction
Within the visible spectrum (400-700 nm), chlorophyll absorbs blue and red light for photosynthesis, while reflected green light gives leaves their color (Gitelson et al., 2020). Some absorbed energy is re-emitted as fluorescence, but most drives chemical reactions. In the NIR region (0.7-1.3 µm), absorption decreases, and internal leaf structures enhance reflectance, regulating leaf temperature (Jacquemoud and Ustin, 2001). In the SWIR range (1.3-2.5 µm), water and biochemical compounds absorb photons, reducing reflectance and revealing hydration status and biochemical composition (Ceccato et al., 2001).
5.1 Visible spectrum (VIS: 400-700 nm)
Red, Green, and Blue Reflectance (RGB) offer insights into plant health. Reflectance in the red band (620-750 nm) assesses photosynthetic activity because chlorophyll absorbs this band heavily (Tucker, 1979). High reflectance in the green band (495-570 nm) typically indicates a healthy, chlorophyll-rich plant, while low reflectance may suggest stress or disease (Huete et al., 2002). The blue band (450-495 nm) also relates to chlorophyll absorption and is an additional plant health indicator. Variations in these reflectance values are often early indicators of stress before visual symptoms appear, making VIS a valuable tool for plant monitoring (Elvidge and Chen, 1995).
5.2 NIR (0.7-1.1 µm)
NIR (0.7-1.1 µm) reflects plant structure and water content, aiding biomass and health estimation (Pohl and Van Genderen, 2016). Red-edge reflectance (680-750 nm) is sensitive to chlorophyll changes and stress (Krezhova, 2011). High NIR reflectance signals healthy vegetation, while declines indicate stress (Keshava and Mustard, 2002). NIR fluorescence detects secondary metabolites and structural changes, revealing stress responses beyond the visible spectrum (Kumar et al., 2024).
5.3 Shortwave infrared (SWIR: 1.1–2.5 µm)
The spectrum is essential for assessing plant water content and structural attributes. Reflectance in this region decreases with increased leaf water content, making it a reliable indicator for detecting drought stress and optimizing irrigation (Ceccato et al., 2001). Additionally, SWIR bands are sensitive to plant biochemical properties, including lignin and cellulose, providing insights into plant structure and biomass (Asner, 1998). These features make SWIR crucial for understanding water use efficiency and evaluating plant resilience under environmental stress.
5.4 Longwave infrared (LWIR: 8–14 µm)
The Longwave Infrared (LWIR) spectrum focuses on thermal emissions and canopy temperature directly linked to plant transpiration and water stress. Elevated canopy temperatures, observed through LWIR, often signal reduced transpiration due to water stress or stomatal closure, enabling early detection and precise irrigation scheduling (Jones et al., 2009). Furthermore, LWIR data can identify thermal anomalies caused by plant diseases or pest infestations, offering a non-invasive diagnostic tool for plant health (Oerke et al., 2014). These capabilities make LWIR indispensable for monitoring plant-environment interactions and managing stress-related impacts effectively. Table 2 lists the Reflectance detection mode and their function across multiple spectral bands.
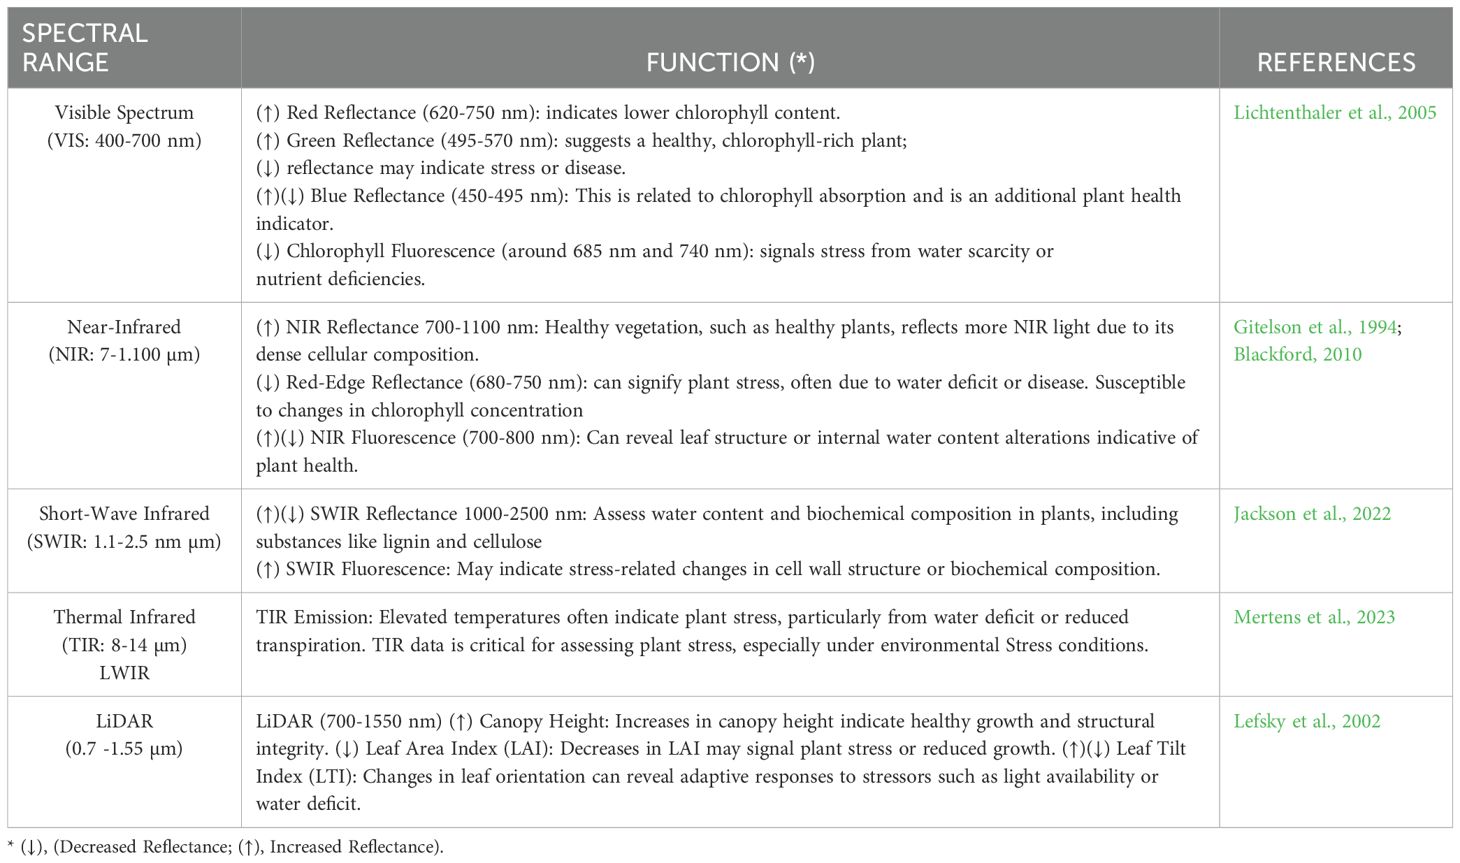
Table 2. Reflectance detection mode across multiple spectral bands.
6 Stress Indicators In Different Spectral Bands
6.1 Hyperspectral fluorescence imaging
Indices (Table 3) correlate fluorescence emission of chlorophyll or Xanthophyl within one or more spectral bands. Table 3 provides a partial list of indices related to chlorophyll pigments in a plant. Each index quantifies certain aspects of plant health. Chlorophyll a (Chl a) converts light energy into chemical energy and plays a role in the Calvin cycle and redox signaling pathways during stress (Foyer and Shigeoka, 2011). Chlorophyll b (Chl b) maximizes light absorption and adjusts to varying light conditions (Bennett, 1983). Beta-carotene acts as an antioxidant, stabilizing membranes and protecting against oxidative stress. Xanthophylls are involved in photoprotection and regulating energy dissipation (Quaas et al., 2015). Chl a serves as the primary pigment for converting light energy into chemical energy during photosynthesis, while Chl b works in tandem to widen the absorption spectrum (Bennett, 1983).
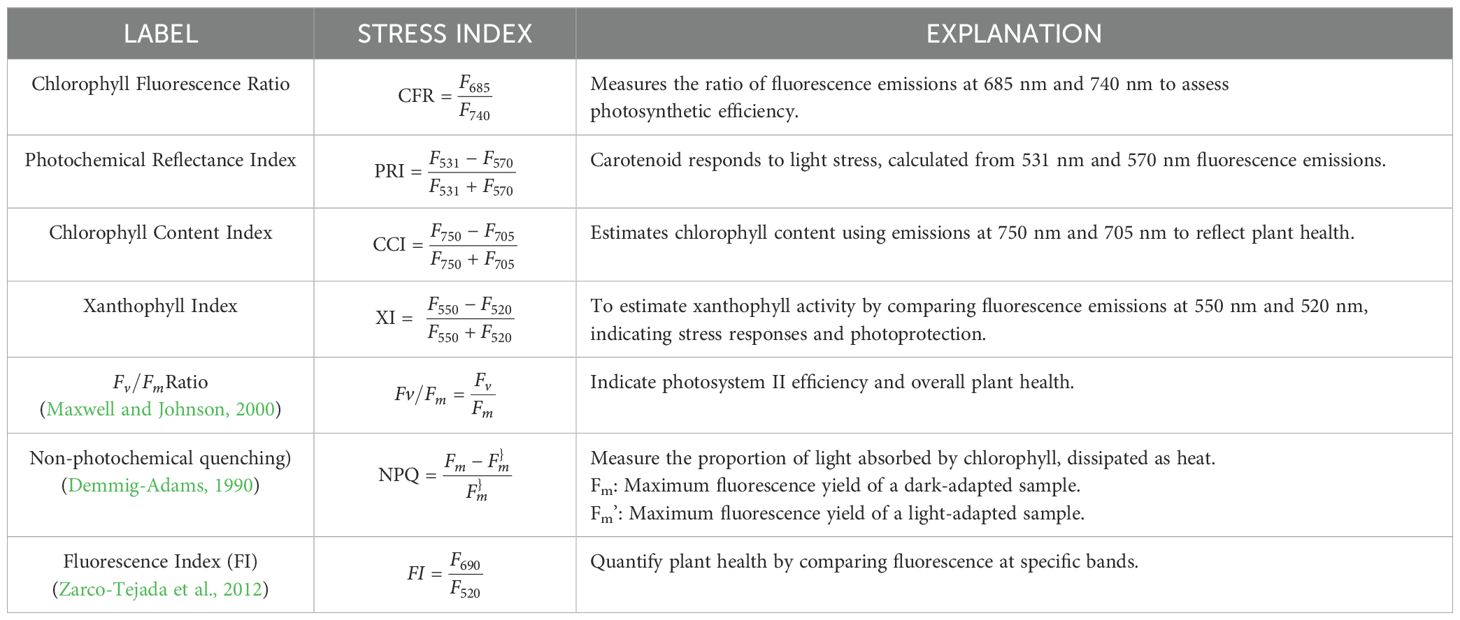
Table 3. Stress indices due to HFI on chlorophyll pigments.
6.2 Hyperspectral reflectance imaging
Hyperspectral Reflectance Imaging (HRI) indices track plant stress by analyzing changes in absorption and reflectance patterns. Reduced chlorophyll levels alter these patterns, signaling stress. Water in leaves absorbs light in the Shortwave Infrared (SWIR) region (1.1–2.5 µm), making SWIR crucial for detecting dehydration and drought stress (Ceccato et al., 2001). Leaf cellular structure, including mesophyll thickness and air spaces, scatters light in the Near Infrared (NIR) region (0.7–1.3 µm), where minimal absorption enhances reflectance, revealing biomass and structural integrity (Jacquemoud et al., 2009). Non-pigment components like lignin and cellulose influence SWIR reflectance, providing insights into plant structure and maturity. Table 4 Lists HRI modes, indices, and their corresponding stress analysis functions.
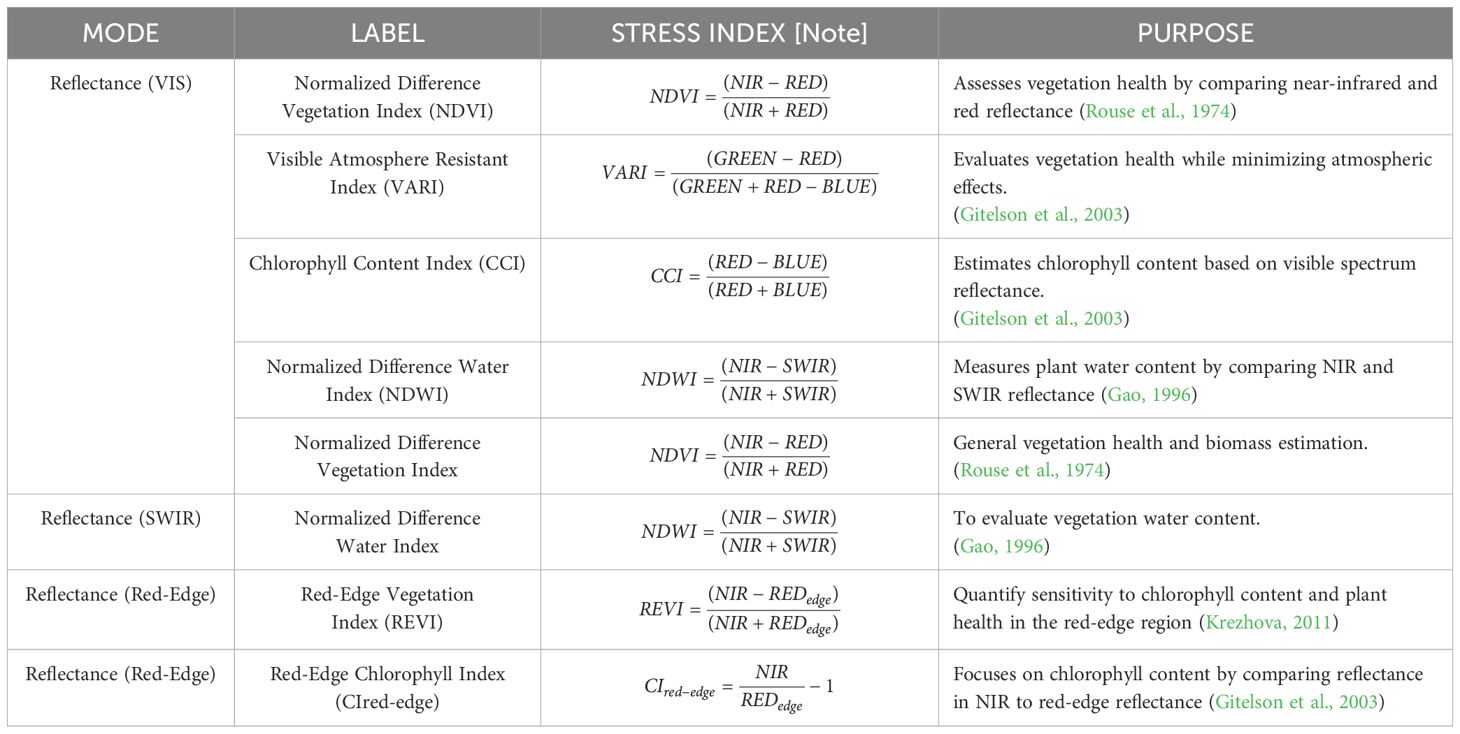
Table 4. HRI indices provide pathways for stress analysis.
6.3 Red edge shift in the VIS band
Red Edge Shift in the VIS Band (Figure 4) refers to the alteration in the wavelength of the peak reflectance in the red-edge region of the electromagnetic spectrum (approximately 680-750 nm). Red Edge detects vegetative stress earlier in the plant growth cycle. As plants experience stress, chlorophyll concentration often declines, leading to decreased light absorption in the red region (around 680 nm) and increased reflectance at longer wavelengths. The shift toward the infrared part of the spectrum (700 nm and beyond) indicates changes in plant health, biochemical composition, and physiological status (Tucker, 1979). The first derivative of the reflectance spectrum enhances the detection of subtle shifts by highlighting peaks and inflection points, making it easier to observe changes in plant health and stress responses.
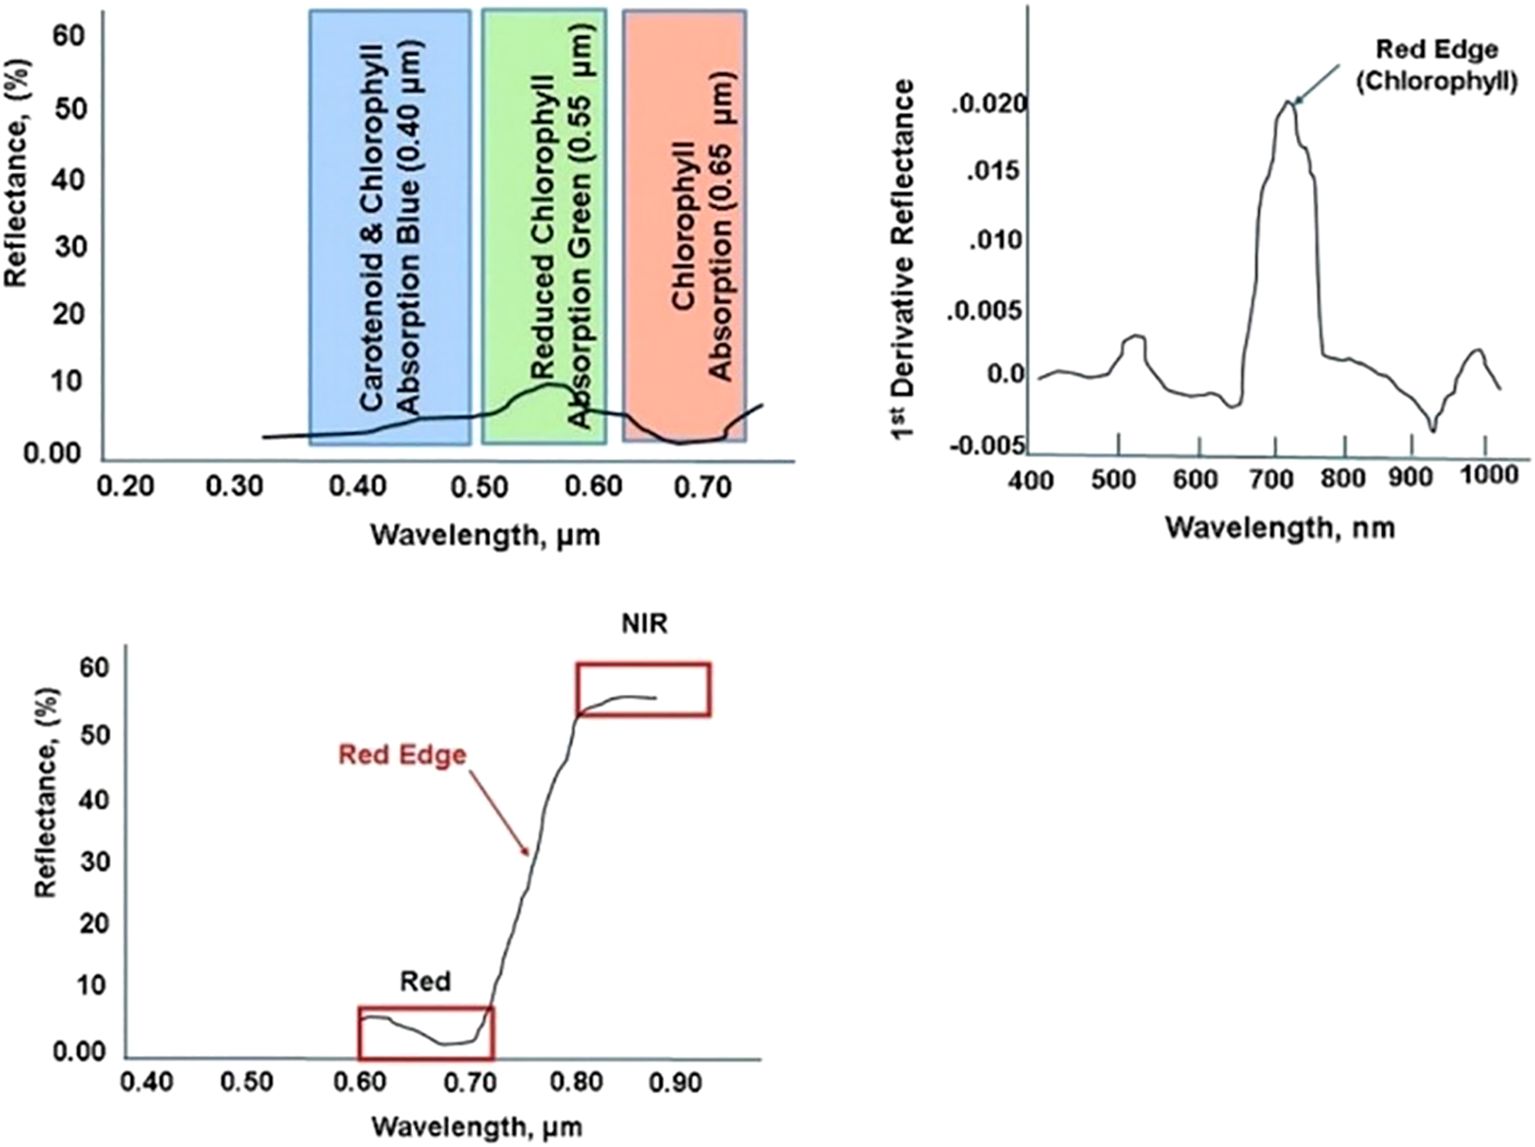
Figure 4. Stress within Visual (Blue, Green, Red) bands (upper left); Red Edge transition within Visible Near Infrared bands (lower middle); Red Edge (upper right) first derivative to enhance detection sensitivity (Horler et al., 1986; Filella et al., 1992).
6.4 Longwave infrared, LWIR (8 -14 µm)
LWIT measures plant thermal emission to assess canopy and leaf temperatures. Elevated temperatures indicate stress conditions, such as reduced transpiration due to water deficit (Farella et al., 2022). TIR can identify specific areas of a crop affected by drought stress, enabling targeted irrigation practices that optimize water use efficiency by revealing localized heat patterns. Table 5 depicts standard thermal and LIDAR indices.
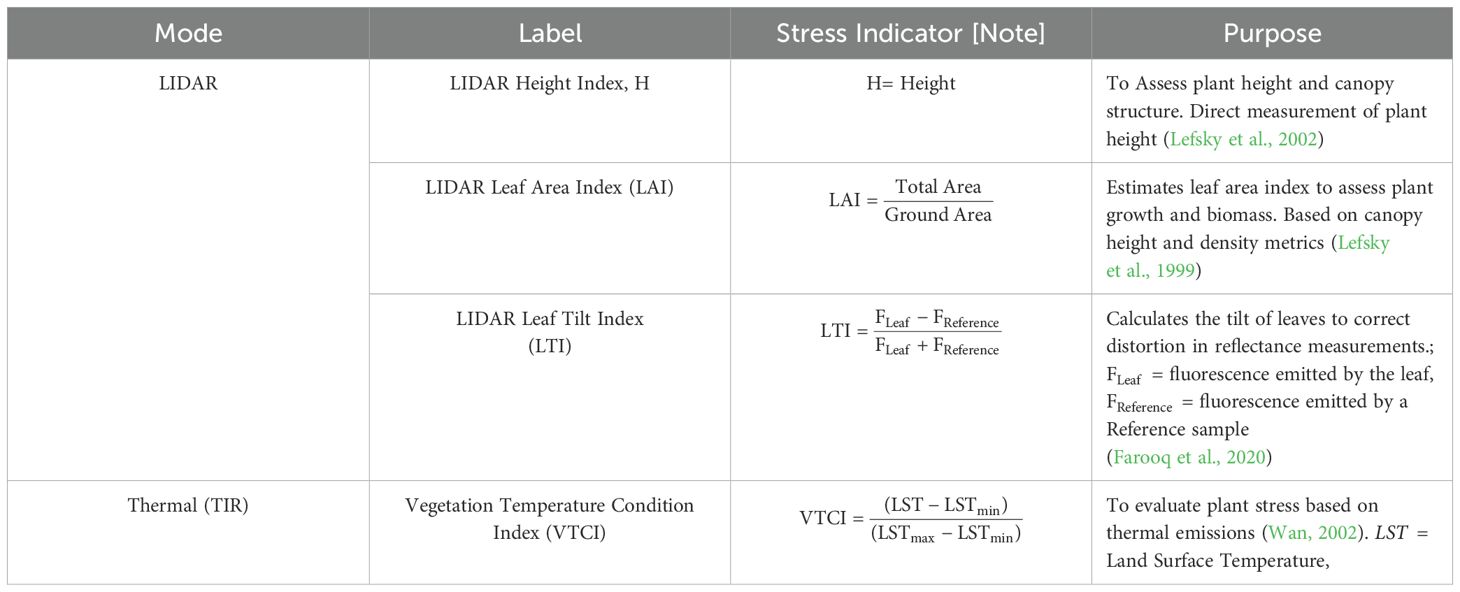
Table 5. LWIR and LiDAR indices.
6.5 LIDAR (0.7–1.55 µm)
LIDAR (0.7–1.55 µm) uses NIR laser pulses to generate high-resolution 3D plant data by measuring pulse return times. This method estimates key parameters like Leaf Area Index (LAI) and Leaf Tilt Index (LTI), which indicate plant health and productivity. LAI, representing leaf area per ground unit, reflects photosynthetic capacity, influencing growth, transpiration, and soil moisture dynamics (Chen and Cihlar, 1995). It regulates energy balance, affecting absorption, reflection, and climate modeling. LTI quantifies leaf orientation, refining photosynthetic modeling and improving water use efficiency and stress response estimations (Hopkinson et al., 2013).
7 Multi-mode analytical methods
Multi-mode analytical methods integrate diverse tools like Dimensionality Reduction (e.g., PCA, PLSR) to extract meaningful patterns from complex datasets. Combining hyperspectral analysis, data fusion, and ML techniques enhances stress detection by identifying subtle changes in plant health. These methods detect stressful events earlier, recognize stress patterns, and provide actionable insights for precision agriculture and ecosystem management, improving plant resilience and productivity.
7.1 Dimensionality reduction
Dimensionality Reduction (Table 6) simplifies datasets by reducing variables while preserving essential information. These methods identify maximum variation in stress indicators, aiding in trend detection and mitigating overfitting. Many rely on eigenvalues and eigenvectors to transform data into a new space. PCA captures variance through principal components (Van der Maaten et al., 2009), while LDA maximizes class separability (Lu et al., 2011). PLSR models latent variable relationships, and CCA uncovers dataset correlations. ICA separates mixed signals (Hyvärinen and Oja, 2000), while nonlinear methods like t-SNE and UMAP maintain neighborhood structures for visualization.
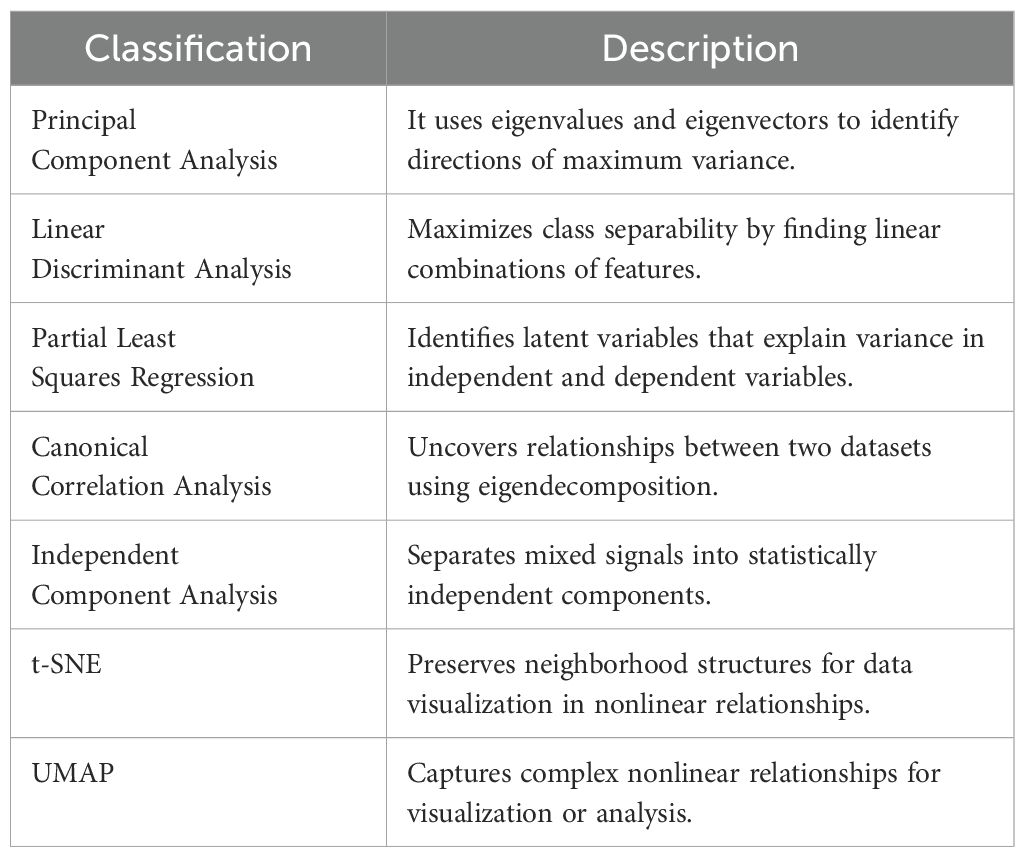
Table 6. Classification of dimensionality reduction methods.
7.2 Data fusion
Data Fusion (Table 7) highlights data fusion as a method for integrating spatial, spectral, and temporal data to enhance plant stress analysis. Spatial data from LiDAR captures canopy structure, including leaf orientation and density, influencing light interception (Berger et al., 2022). Spectral data from hyperspectral imaging detects biochemical changes, such as pigment and water content variations. Temporal data from repeated measurements tracks stress progression and recovery. ML models integrate these dimensions, linking spectral reflectance (chlorophyll content) with spatial anomalies (canopy gaps) and temporal trends (drought stress), improving detection accuracy (Sagi et al., 2020).
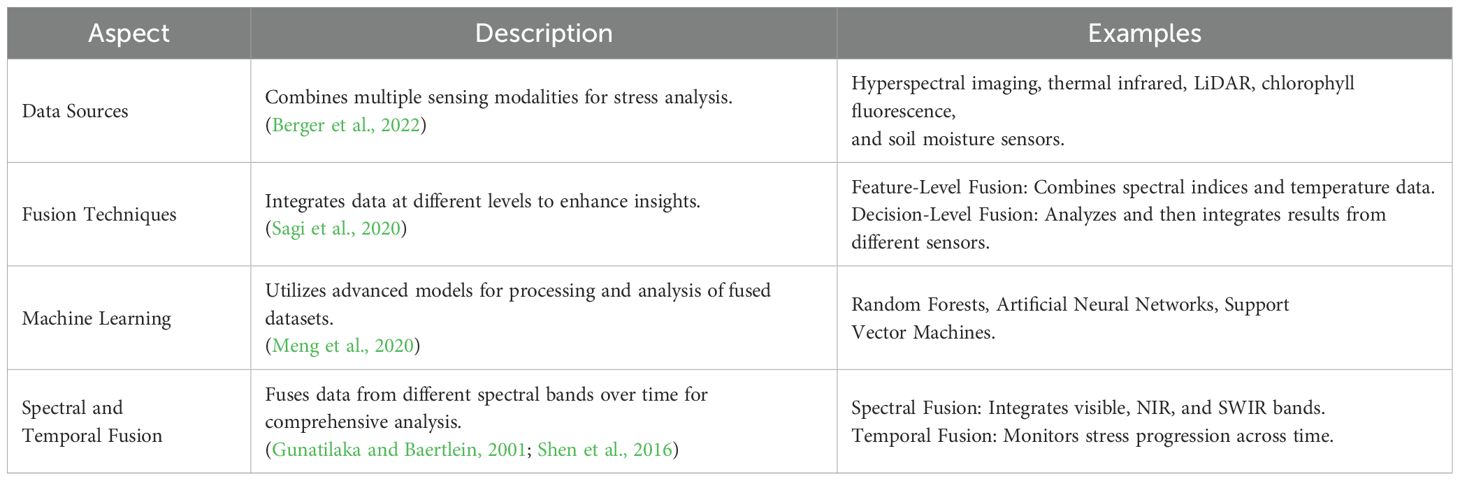
Table 7. Data fusion techniques in plant stress analysis.
7.3 Variability in spectral data interpretation
Variability in spectral data interpretation across different environments arises from atmospheric conditions, soil composition, and plant phenotypes, affecting measurement consistency. Differences in light intensity and angle influence reflectance values, requiring adaptive (dynamic correction) calibration techniques to ensure accuracy (Xie et al., 2023). Additionally, spectral shifts due to environmental stressors necessitate robust ML/AI models to account for regional variations and improve data reliability (Hilbert, 2016). MMA devices address these challenges by integrating multiple spectral bands, combining reflectance, fluorescence, and LiDAR data to cross-validate results, and applying AI-driven correction algorithms to enhance consistency across diverse conditions.
Levels of Data Fusion. Data fusion is typically categorized into three levels: low-level, mid-level, and high-level fusion, each defined by the stage at which data integration occurs and the type of information processed (Table 8).
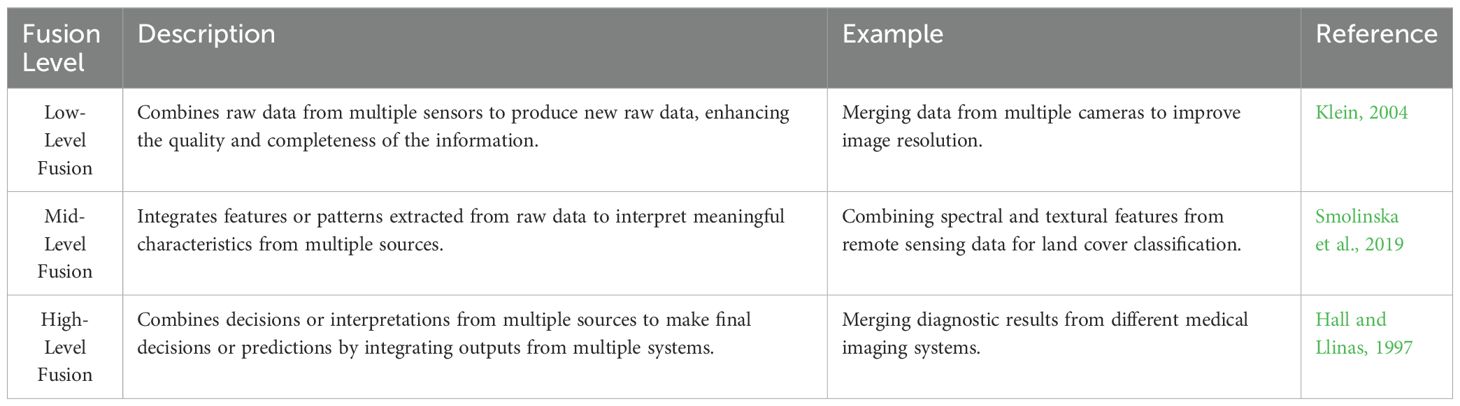
Table 8. Data fusion levels.
7.4 Hyperspectral imaging
The hyperspectral analysis represents a crucial subset of multi-mode analysis, distinguished by its comprehensive examination of plant health through essential elements: spectral, spatial, and temporal. Integrating ML algorithms with image data sets enables precise spectral-spatial-temporal disease identification, facilitating timely detection, predictive modeling, and effective disease management (Razzaq et al., 2024). The term “hyperspectral” derives from the method’s ability to capture and analyze many contiguous spectral bands across various wavelengths, allowing for detailed characterization of plant responses to multiple stressors (Gao et al., 2020).
Spectral analysis enhances plant stress detection through specific spectral indices, unmixing methods, and matching techniques. The NDVI is well-known for its effectiveness in assessing overall vegetation health and stress levels by exploiting the differences between near-infrared and red reflectance (Rouse et al., 1974). The PRI is sensitive to changes in carotenoid pigments linked to photosynthetic stress, while the Red-Edge Position (REP) indicates shifts in chlorophyll content and health (Gitelson et al., 2003; Zarco-Tejada et al., 2012). Spectral unmixing methods like the Fractional Cover Index (FCI) estimate the proportions of varying vegetation components within pixels. At the same time, the Spectral Angle Mapper (SAM) score quantifies the similarity between pixel and reference spectra to highlight specific stress indicators (Lowe et al., 2017).
Temporal analysis monitors plant health and detects stress by evaluating changes in spectral data over time, mainly about specific phenological events. This method employs time-series indices such as the Vegetation Condition Index (VCI) and the Normalized Difference Moisture Index to track vegetation’s dynamic responses to environmental changes and stressors. For example, VCI compares current NDVI values against historical data to assess relative stress levels and identify stress onset and progression (Friedl and Brodley, 1997).
Spatial analysis examines the spatial patterns and relationships within remote sensing images. Techniques like Object-Based Image Analysis allow researchers to segment imagery into meaningful objects, such as leaves or plant canopies, to analyze their spatial characteristics and assess vegetation health (Kureel et al., 2022). The VFI quantifies the proportion of vegetation within image segments, enabling accurate assessments of vegetation cover and identification of stress areas (Pettorelli et al., 2018).
8 Machine learning
ML is a subset of AI that enables computer systems to learn from data and improve their performance on specific tasks without explicit programming. This approach utilizes algorithms and statistical models to identify patterns within data, allowing systems to make predictions or decisions based on new input (Ratner, 2017). Shahoveisi et al. (2023) reported using image processing and transfer learning for rust detection, evaluating the performance of four different pre-trained CNN models: Xception, ResNet50, EfficientNetB4, and MobileNet. Furthermore, adaptive phenotyping, such as IBP, can utilize ML/AI to integrate high-throughput imaging, automation, and data analytics to assess plant stress responses across growth stages (Anshori et al., 2023).
8.1 Edge computing
Edge computing processes data at the network’s edge, enabling real-time analysis and decision-making (Shi et al., 2023). It reduces latency, lowers bandwidth costs, enhances security by processing data locally, and improves system reliability and scalability (Wijesinghe and Kariyawasam, 2024). In space applications, edge devices process data on space stations or lunar bases, enabling immediate environmental adjustments without relying on Earth-based transmission (Dudukovich et al., 2022). In precision agriculture, edge computing supports drones and sensors for real-time plant health and soil monitoring, optimizing resource use and management (Lee et al., 2024).
8.2 Standardizing MMA methods
Standardizing MMA methods remains challenging due to many interdependent factors. Environmental variations, including temperature, pressure, light, and humidity, directly influence stress responses, requiring adaptable analytical approaches (Bocklitz et al., 2020). Hardware discrepancies in accuracy and robustness introduce variability, making standardization difficult (Pérez-Patricio et al., 2024). Researchers select analytical and data reduction techniques, such as principal component analysis and eigenvector methods, based on application-specific needs, complicating uniform standardization (Olivieri et al., 2006). MMA integrates multiple bands, modes, and indices, requiring flexible frameworks to handle complex datasets. Application-specific spectral signatures further complicate standardization—normalizing melanin absorption in tissues differs from analyzing scattering effects in plants for early stress detection. Mapping and pattern recognition techniques vary across applications, demanding customized analytical models (Pérez-Patricio et al., 2024). Cross-mode variable contributions shift based on medium properties and sample populations, requiring unique calibration strategies (Bocklitz et al., 2020). Hardware and software components, including device calibration and firmware, dictate sensitivity and responsivity, further preventing universal standards. Image processing techniques rely on specific hardware and software configurations, necessitating tailored filtering, masking, and normalization for each application. While general calibration protocols, such as white or dark normalization, noise reduction, and baseline correction, apply broadly, MMA requires flexible, context-specific protocols (Ajuzieogu, 2017). to reproduce consistent results with field data.
9 Findings and results
This review identifies multi-mode analytics as a transformative approach to plant stress assessment, integrating hyperspectroscopy, time-frequency analysis, and advanced techniques for precise detection. Unlike single-mode methods, multi-mode analytics maps stress patterns across spectral bands, enabling earlier and more accurate identification of stress and its root causes. Predicting plant stress remains complex due to spatial, spectral, and physiological interactions. While farmers rely on visual cues like wilting, multi-mode analytics scientifically detects early stress by combining optical, structural, and temporal data.
—This review highlights several key insights that address the questions posed at the outset. Conventional single-mode spectroscopy often fails to capture the multifaceted nature of plant stress by concentrating primarily on isolated indicators, such as reflectance or temperature alone. For example, single-mode approaches may not simultaneously detect complex stress interactions involving drought, salinity, and temperature, as each stressor affects different biochemical pathways. In contrast, the integrated approach of multi-mode analytics significantly enhances accuracy in stress detection by allowing simultaneous assessment of multiple physiological parameters. This multifaceted approach provides a comprehensive overview of plant responses, thus addressing the limitations of single-mode techniques (Table 9). ML and AI training begins with establishing ground truth—in this case, tested and verified mappings and patterns to identify plant health anomalies and stress events or pathways. This foundation can accurately predict stress and potential root causes using multiple indices from different spectral bands and detection modalities (Gómez-Chova et al., 2015).
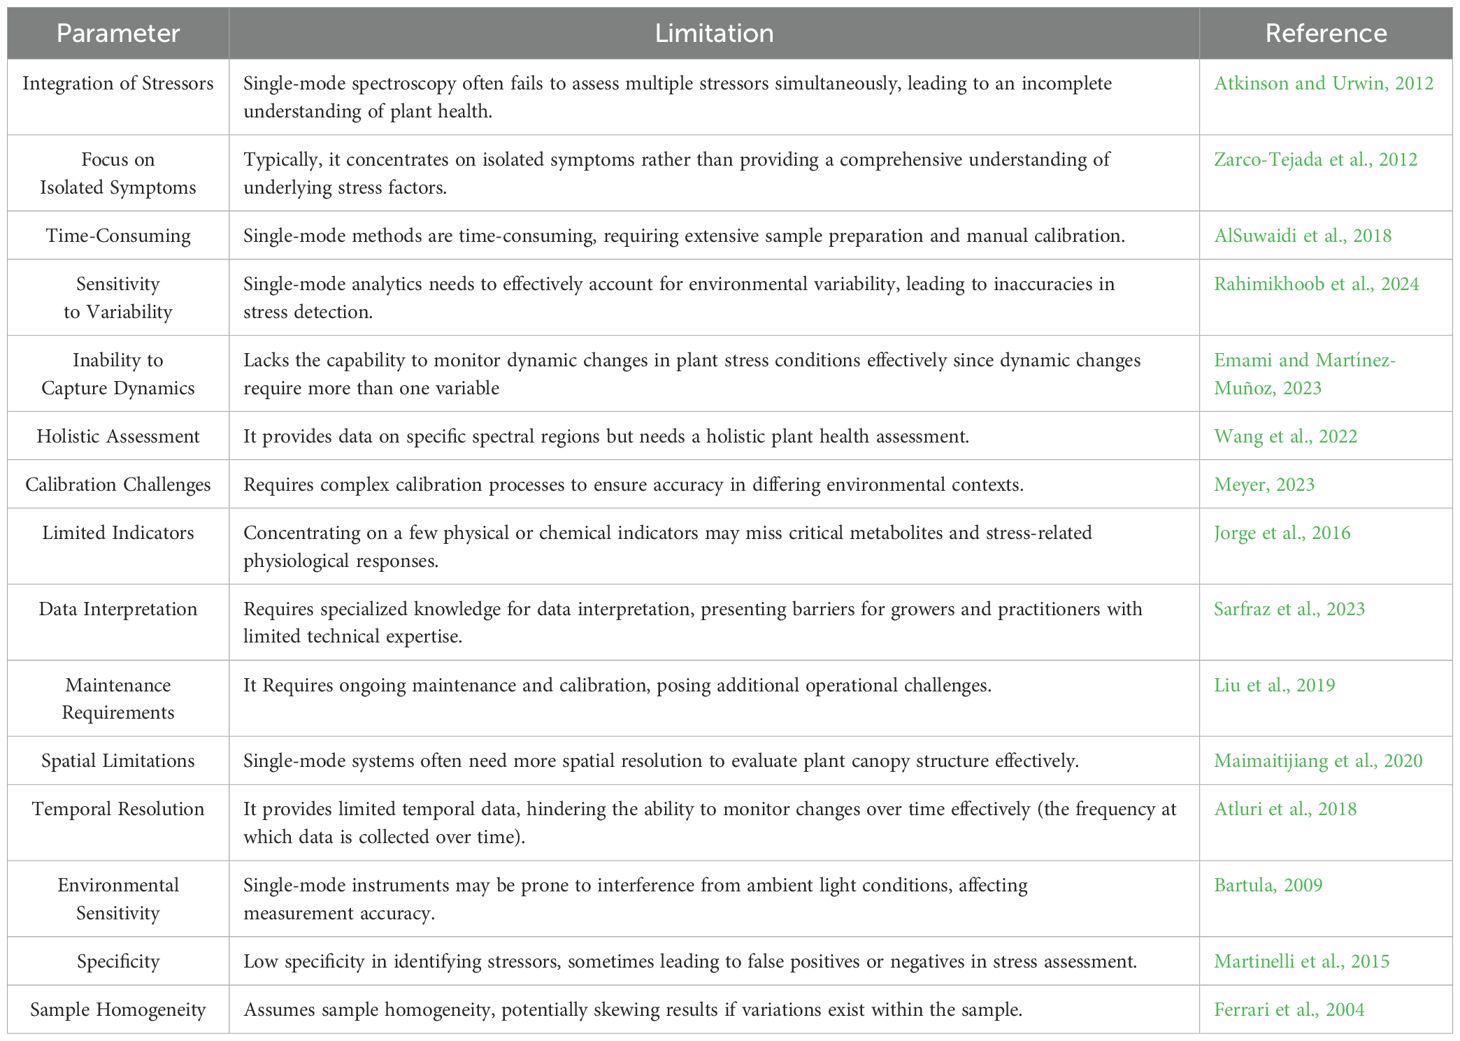
Table 9. Limitations of single mode analytics for plant stress assessment.
In response to the advantages of multi-mode spectroscopy (Table 10), this review details how combining techniques like HRI, HFI, and Light LiDAR allows for a more thorough examination of plant physiological responses. Each mode has distinct advantages: HRI reveals detailed spectral changes, HFI detects early shifts in photosynthetic activity, and LiDAR captures structural data like leaf orientation. Integrating these methods improves the detection of subtle health indicators, such as chlorophyll content changes or metabolite fluctuations, enabling the early identification of stress that might otherwise go unnoticed.
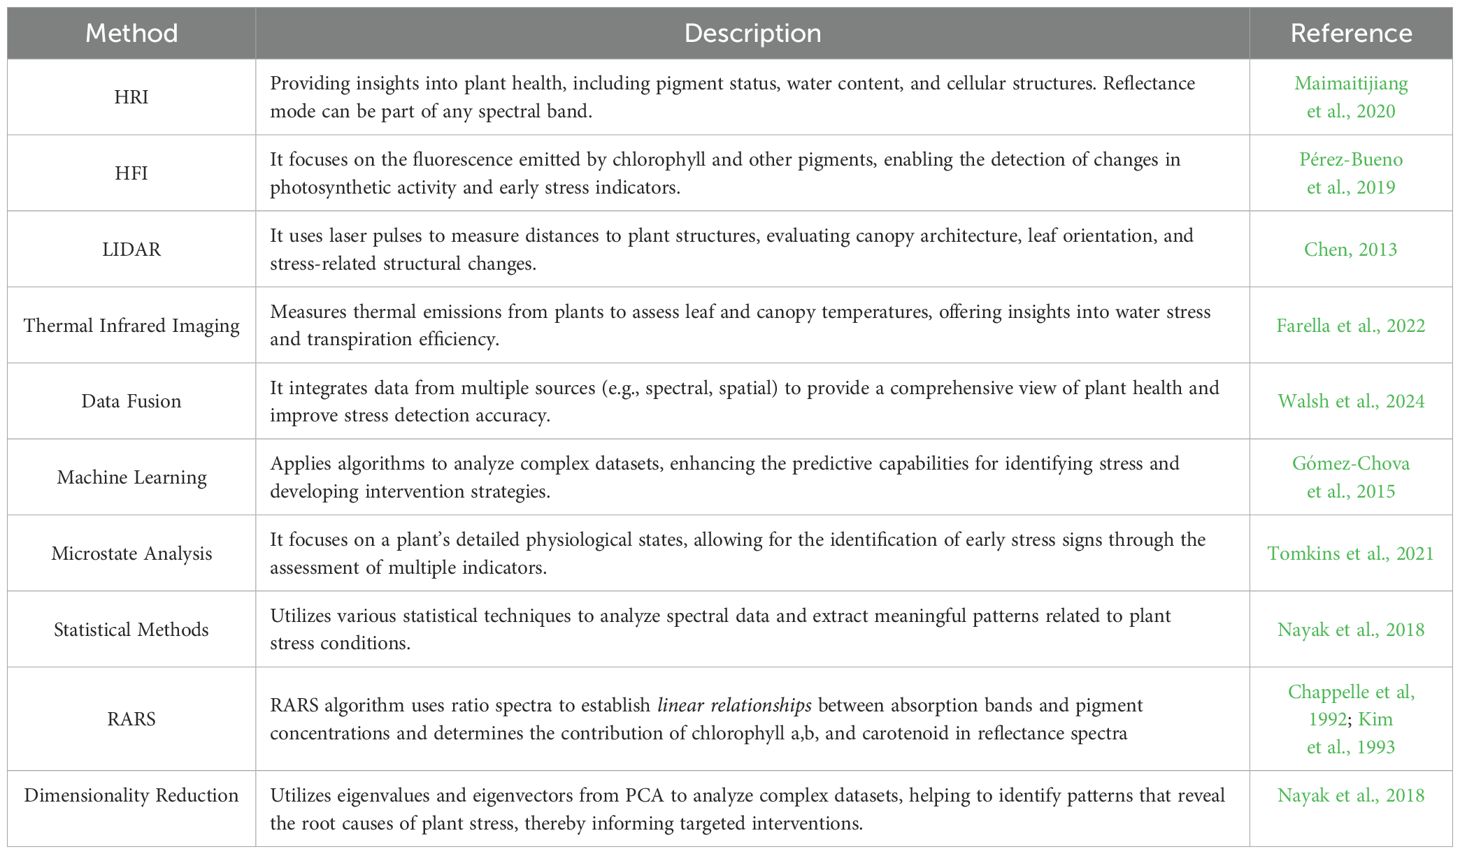
Table 10. Multi-mode analytics methods in plant stress assessment.
The review further addresses how advanced analytical methods can enhance predictive capabilities in stress detection. ML and data fusion are valuable in processing complex datasets from multimodal systems, uncovering patterns and correlations that inform predictions about stress causes. For instance, ML algorithms can link FTIR spectroscopy data to physiological stress, offering more profound insights into how molecular changes correlate with stress responses.
Finally, integrating time and frequency domain analysis allows models to capture dynamic, cyclical stress patterns impacting plant health, such as temperature or irrigation cycles. These advanced analytical techniques contribute to a real-time, adaptive approach that improves timely interventions. Based on these findings, the review recommends a coordinated effort toward developing precision multimodal devices to bridge current research gaps, emphasizing that integrated analytical techniques are essential for advancing sustainable agricultural practices in terrestrial and space environments.
9.1 Enhanced monitoring
Integrating MMA datasets with sophisticated analytical techniques (Kour et al., 2024) enhances precision farming. These methods promote agricultural sustainability, especially in long-duration space missions, as they significantly mitigate the risks of crop failure. Technologies like hyperspectral imaging, ML, and advanced sensors promote precise crop health monitoring, allowing early detection of stress and nutrient deficiencies for timely interventions (Gao et al., 2020). This level of precision enhances resource efficiency, which is essential for sustainability in space.
Based on these findings, the review recommends the adoption of multimodal analytics (Table 10) for devices that integrate different sensing spectral bands and modalities. This approach will bridge research gaps and promote sustainable agricultural practices by enhancing the understanding of plants’ intricate chemical and physiological responses to stressors. Overall, the findings reinforce the transition from traditional single-mode methods towards a more holistic, multimodal strategy that adequately addresses the complexities of plant health challenges.
9.2 Challenges in multi-mode analytics
Multi-mode analytics (MMA) provides a cost-effective alternative to expensive methods like X-ray or Raman spectroscopy for plant stress analysis. These systems lower operational costs and simplify technology integration (Meyer, 2023). However, implementation challenges persist, particularly in sensor calibration, cost, and data processing. High-resolution data can cause information overload, complicating actionable insights (Hilbert, 2016). Additionally, maintaining and calibrating sensitive sensors requires technical expertise, which is often scarce in agricultural regions, adding to operational costs (Liu et al., 2019). The affordability of MMA remains a barrier for small-scale farmers, who may lack access to advanced software and trained personnel. Furthermore, data processing demands significant computational resources, potentially limiting adoption in regions with inadequate infrastructure. Environmental variability also affects measurement accuracy, necessitating frequent recalibrations and adaptive models to maintain reliability. To succeed in high-output and small-scale farming, MMA must address cost-effectiveness, ease of use, and scalable data solutions.
9.3 Future works
MMA ensure crop viability in extraterrestrial and terrestrial settings, where meticulous resource management becomes essential (Maity and Saxena, 2024). During prolonged space missions, space crews can effectively manage water and nutrient cycles to sustain life and crop productivity. The capability to foresee and mitigate stress factors—such as water shortages, nutrient deficiencies, and environmental challenges—directly contributes to protecting plant health and fulfilling the overarching objectives of long-term human space exploration and habitation. The demand for -devices integrating HFI, HRI, LiDAR, thermal imaging, ML/AI, data Fusion, IBP, time and frequency domain, eigenvectors, and microstate analysis is surging in agricultural (vertical and horizontal farming, horticulture, micro crop plantation) and food industry applications. Multimodal analytics is a Meta-framework, which is pivotal for assessing meat freshness, detecting adulteration in poultry and fish, verifying the purity of olive oil, and identifying pathogens in various food products (Artavia et al., 2021). Their capability for precise, non-destructive testing delivers crucial data that greatly enhances product safety, quality control, and traceability (Vasefi et al., 2018). In terrestrial and space agriculture, these tools are indispensable for monitoring plant health and detecting early signs of disease, sustaining crop yield and quality. In the food sector, they can authenticate product contents, spot adulterants, ensure compliance with safety standards, safeguard consumer health, and support ethical trade practices (Li et al., 2019).
Data availability statement
Publicly available datasets were analyzed in this study. This data can be found here: NA.
Author contributions
AZ: Conceptualization, Data curation, Formal analysis, Funding acquisition, Investigation, Methodology, Project administration, Resources, Software, Supervision, Validation, Visualization, Writing – original draft, Writing – review & editing. SH: Writing – review & editing. HK: Writing – review & editing. KT: Conceptualization, Supervision, Writing – review & editing. B-KC: Writing – review & editing. FV: Conceptualization, Supervision, Writing – review & editing. MK: Supervision, Writing – review & editing. PT: Conceptualization, Funding acquisition, Resources, Supervision, Writing – original draft, Writing – review & editing.
Funding
The author(s) declare that financial support was received for the research and/or publication of this article. The authors acknowledge the University of North Dakota for the seed fund provided to Pantea Tavakolian.
Conflict of interest
HK, SH, FV, and KT are employees of, consultants to, or holders of stocks or stock options in SafetySpect Inc.
The remaining authors declare that the research was conducted in the absence of any commercial or financial relationships that could be construed as a potential conflict of interest.
Generative AI statement
The author(s) declare that no Generative AI was used in the creation of this manuscript.
Publisher’s note
All claims expressed in this article are solely those of the authors and do not necessarily represent those of their affiliated organizations, or those of the publisher, the editors and the reviewers. Any product that may be evaluated in this article, or claim that may be made by its manufacturer, is not guaranteed or endorsed by the publisher.
References
Aina, O., Bakare, O. O., Fadaka, A. O., Keyster, M., Klein, A. (2024). Plant biomarkers as early detection tools in stress management in food crops: a review. Planta 259, 60. doi: 10.1007/s00425-024-04333-1
Ajuzieogu, U. C. (2017). Multimodal generative AI for climate adaptation and agricultural innovation.
Aleksandrov, V. (2019). Identification of nutrient deficiency in bean plants by prompt chlorophyll fluorescence measurements and Artificial Neural Networks. arXiv preprint arXiv:1906.03312.
AlSuwaidi, A., Grieve, B., Yin, H. (2018). Feature-ensemble-based novelty detection for analyzing plant hyperspectral datasets. IEEE J. Selected Topics Appl. Earth Observations Remote Sens. 11, 1041–1055. doi: 10.1109/JSTARS.4609443
Anshori, M. F., Dirpan, A., Sitaresmi, T., Rossi, R., Farid, M., Hairmansis, A., et al. (2023). An overview of image-based phenotyping as an adaptive 4.0 technology for studying plant abiotic stress: A bibliometric and literature review. Heliyon 9.
Artavia, G., Cortés-Herrera, C., Granados-Chinchilla, F. (2021). Selected instrumental techniques applied in food and feed: Quality, safety and adulteration analysis. Foods 10, 1081. doi: 10.3390/foods10051081
Asner, G. P. (1998). Biophysical and biochemical sources of variability in canopy reflectance. Remote Sens. Environ. 64, 234–253. doi: 10.1016/S0034-4257(98)00014-5
Atkinson, N. J., Urwin, P. E. (2012). The interaction of plant biotic and abiotic stresses: from genes to the field. J. Exp. Bot. 63, 3523–3543. doi: 10.1093/jxb/ers100
Atluri, G., Karpatne, A., Kumar, V. (2018). Spatio-temporal data mining: A survey of problems and methods. ACM Computing Surveys (CSUR) 51, 1–41. doi: 10.1145/3161602
Bennett, J. (1983). Regulation of photosynthesis by reversible phosphorylation of the light-harvesting chlorophyll a/b protein. Biochem. J. 212, 1. doi: 10.1042/bj2120001
Berger, K., Machwitz, M., Kycko, M., Kefauver, S. C., Van Wittenberghe, S., Gerhards, M., et al. (2022). Multi-sensor spectral synergies for crop stress detection and monitoring in the optical domain: A review. Remote Sens. Environ. 280, 113198. doi: 10.1016/j.rse.2022.113198
Bi, H., Zhao, Y., Li, H., Liu, W. (2020). Wheat heat shock factor TaHsfA6f increases ABA levels and enhances transgenic plants' tolerance to multiple abiotic stresses. Int. J. Mol. Sci. 21, 3121. doi: 10.3390/ijms21093121
Blackford, J. C. (2010). Predicting the impacts of ocean acidification: Challenges from an ecosystem perspective. J. Mar. Syst. 81, 12–18. doi: 10.1016/j.jmarsys.2009.12.016
Bocklitz, T., Schmitt, M., Popp, J. (2020). Optical molecular spectroscopy in combination with artificial intelligence for process analytical technology.
Bokade, R., Navato, A., Ouyang, R., Jin, X., Chou, C. A., Ostadabbas, S., et al. (2021). A cross-disciplinary comparison of multimodal data fusion approaches and applications: Accelerating learning through trans-disciplinary information sharing. Expert Syst. Appl. 165, 113885. doi: 10.1016/j.eswa.2020.113885
Ceccato, P., Flasse, S., Tarantola, S., Jacquemoud, S., Grégoire, J. M. (2001). Detecting vegetation leaf water content using reflectance in the optical domain. Remote Sens. Environ. 77, 22–33. doi: 10.1016/S0034-4257(01)00191-2
Chappelle, E. W., Kim, M. S., McMurtrey, J. E., III (1992). Ratio analysis of reflectance spectra (RARS): an algorithm for the remote estimation of the concentrations of chlorophyll a, chlorophyll b, and carotenoids in soybean leaves. Remote Sens. Environ. 39, 239–247. doi: 10.1016/0034-4257(92)90089-3
Chen, J. M. (2013). “Remote sensing of leaf area index of vegetation covers,” in Remote Sensing of Natural Resources (CRC Press, Boca Raton, FL, USA), 375–398.
Chen, J. M., Cihlar, J. (1995). Plant canopy gap-size analysis theory for improving optical measurements of leaf-area index. Appl. optics 34, 6211–6222. doi: 10.1364/AO.34.006211
Coatsworth, P., Gonzalez-Macia, L., Collins, A. S. P., Bozkurt, T., Güder, F. (2023). Continuous monitoring of chemical signals in plants under stress. Nat. Rev. Chem. 7, 7–25. doi: 10.1038/s41570-022-00443-0
Demmig-Adams, B. (1990). Carotenoids and photoprotection in plants: a role for the xanthophyll zeaxanthin. Biochim. Biophys. Acta (BBA)-Bioenergetics 1020, 1–24. doi: 10.1016/0005-2728(90)90088-L
Dudukovich, R., Gormley, D., Kancharla, S., Wagner, K., Short, R., Brooks, D., et al. (2022). Toward the development of a multi-agent cognitive networking system for the lunar Environment. IEEE J. Radio Frequency Identification 6, 269–283. doi: 10.1109/JRFID.2022.3162952
Elvidge, C. D., Chen, Z. (1995). Comparison of broad-band and narrow-band red and near-infrared vegetation indices. Remote Sens. Environ. 54, 38–48. doi: 10.1016/0034-4257(95)00132-K
Emami, S., Martínez-Muñoz, G. (2023). A gradient boosting approach for training convolutional and deep neural networks. IEEE Open J. Signal Process. 4, 313–321. doi: 10.1109/OJSP.2023.3279011
Fang, Y., Wang, H., Liu, X., Xin, D., Rao, Y., Zhu, B. (2019). Transcriptome analysis of Xanthomonas oryzae pv. oryzicola exposed to H2O2 reveals horizontal gene transfer contributes to its oxidative stress response. PloS One 14, e0218844.
Farella, M. M., Fisher, J. B., Jiao, W., Key, K. B., Barnes, M. L. (2022). Thermal remote sensing for plant ecology from leaf to globe. J. Ecol. 110, 1996–2014. doi: 10.1111/1365-2745.13957
Farooq, T. H., Yan, W., Chen, X., Shakoor, A., Rashid, M. H. U., Gilani, M. M., et al. (2020). Dynamics of canopy development of Cunninghamia lanceolata mid-age plantation in relation to foliar nitrogen and soil quality influenced by stand density. Global Ecol. Conserv. 24, e01209. doi: 10.1016/j.gecco.2020.e01209
Ferrari, M., Mottola, L., Quaresima, V. (2004). Principles, techniques, and limitations of near-infrared spectroscopy. Can. J. Appl. Physiol. 29, 463–487. doi: 10.1139/h04-031
Fiorani, F., Schurr, U. (2013). Future scenarios for plant phenotyping. Annu. Rev. Plant Biol. 64, 267–291. doi: 10.1146/annurev-arplant-050312-120137
Foyer, C. H., Shigeoka, S. (2011). Understanding oxidative stress and antioxidant functions to enhance photosynthesis. Plant Physiol. 155, 93–100. doi: 10.1104/pp.110.166181
Friedl, M. A., Brodley, C. E. (1997). Decision tree classification of land cover from remotely sensed data. Remote Sens. Environ. 61, 399–409. doi: 10.1016/S0034-4257(97)00049-7
Frydenvang, J., et al. (2015). Sensitive detection of phosphorus deficiency in plants using chlorophyll a fluorescence. Plant Physiol. 169, 353–361. doi: 10.1104/pp.15.00823
Gao, B. C. (1996). NDWI—A normalized difference water index for remote sensing of vegetation liquid water from space. Remote Sens. Environ. 58, 257–266. doi: 10.1016/S0034-4257(96)00067-3
Gao, Z., Luo, Z., Zhang, W., Lv, Z., Xu, Y. (2020). Deep learning application in plant stress imaging: a review. AgriEngineering 2, 29. doi: 10.3390/agriengineering2030029
García-Tejero, I. F., et al. (2018). Thermal imaging to monitor the crop-water status in almonds by using the non-water stress baselines. Scientia Hortic. 238, 91–97. doi: 10.1016/j.scienta.2018.04.045
Garza-Alonso, C. A., Olivares-Sáenz, E., Gutiérrez-Díez, A., Vázquez-Alvarado, R. E., López-Jiménez, A. (2019). Visual symptoms, vegetative growth, and mineral concentration in fig tree (Ficus carica L.) under macronutrient deficiencies. Agronomy 9, 787.
Gitelson, A. A., et al. (1994). Signature analysis of leaf reflectance spectra: Algorithm and applications. Remote Sens. Environ. 47, 300–305.
Gitelson, A. A., Gritz, Y., Merzlyak, M. N. (2003). Relationships between leaf chlorophyll content and spectral reflectance and algorithms for non-destructive chlorophyll assessment in higher plant leaves. J. Plant Physiol. 160, 271–282. doi: 10.1078/0176-1617-00887
Gitelson, A., Solovchenko, A., Viña, A. (2020). Foliar absorption coefficient derived from reflectance spectra: A gauge of the efficiency of in situ light-capture by different pigment groups. J. Plant Physiol. 254, 153277. doi: 10.1016/j.jplph.2020.153277
Gómez-Chova, L., Tuia, D., Moser, G., Camps-Valls, G. (2015). Multimodal classification of remote sensing images: A review and future directions. Proc. IEEE 103, 1560–1584. doi: 10.1109/JPROC.2015.2449668
Gossner, M. M., Beenken, L., Arend, K., Begerow, D., Peršoh, D. (2021). Insect herbivory facilitates the establishment of an invasive plant pathogen. ISME Commun. 1, 6. doi: 10.1038/s43705-021-00004-4
Gu, Y., Liu, T., Gao, G., Ren, G., Ma, Y., Chanussot, J., et al. (2021). Multimodal hyperspectral remote sensing: An overview and perspective. Sci. China Inf. Sci. 64, 1–24. doi: 10.1007/s11432-020-3084-1
Gunatilaka, A. H., Baertlein, B. A. (2001). Feature-level and decision-level fusion of noncoincidently sampled sensors for land mine detection. IEEE Trans. Pattern Anal. Mach. Intell. 23, 577–589. doi: 10.1109/34.927459
Hall, D. L., Llinas, J. (1997). An introduction to multisensor data fusion. Proc. IEEE 85, 6–23. doi: 10.1109/5.554205
Hekimhan, H., Aydoğdu, M. (2024). “. Fungal and Bacterial Diseases of Wheat,” in Advances in Wheat Breeding: Towards Climate Resilience and Nutrient Security (Springer Nature Singapore, Singapore), 315–357.
Hilbert, M. (2016). Big data for development: A review of promises and challenges. Dev. Policy Rev. 34, 135–174. doi: 10.1111/dpr.2016.34.issue-1
Hong, B., Zhou, B., Zhao, D., Liao, L., Chang, T., Wu, X., et al. (2024). Yield, cell structure and physiological and biochemical characteristics of rapeseed under waterlogging stress. BMC Plant Biol. 24, 941. doi: 10.1186/s12870-024-05599-z
Hopkinson, C., Lovell, J., Chasmer, L., Jupp, D., Kljun, N., van Gorsel, E. (2013). Integrating terrestrial and airborne lidar to calibrate a 3D canopy model of effective leaf area index. Remote Sens. Environ. 136, 301–314. doi: 10.1016/j.rse.2013.05.012
Huete, A., Didan, K., Miura, T., Rodriguez, E. P., Gao, X., Ferreira, L. G. (2002). Overview of the radiometric and biophysical performance of the MODIS vegetation indices. Remote Sens. Environ. 83, 195–213. doi: 10.1016/S0034-4257(02)00096-2
Hyvärinen, A., Oja, E. (2000). Independent component analysis: algorithms and applications. Neural Networks 13, 411–430. doi: 10.1016/S0893-6080(00)00026-5
Iqbal, Z., Munir, M. (2024). Multifaceted natural drought response mechanisms in three elite date palm cultivars uncovered by expressed sequence tags analysis. Sci. Rep. 14, 23186. doi: 10.1038/s41598-024-74422-4
Jackson, J., Lawson, C. S., Adelmant, C., Huhtala, E., Fernandes, P., Hodgson, R., et al. (2022). Short-range multispectral imaging is an inexpensive, fast, and accurate approach to estimate biodiversity in a temperate calcareous grassland. Ecol. Evol. 12 (12), e9623.
Jacquemoud, S., et al. (2009). PROSPECT + SAIL models: A review of use for vegetation characterization. Remote Sens. Environ. 113, S56–S66. doi: 10.1016/j.rse.2008.01.026
Jacquemoud, S., Ustin, S. L. (2001). Leaf optical properties: A review. Remote Sens. Environ. 83, 195–216.
Jones, H. G., et al. (2019). Thermal imaging for quantifying and managing crop stress. J. Exp. Bot. 70, 662–672.
Jones, R. R., Hooper, D. C., Zhang, L., Wolverson, D., Valev, V. K. (2019). Raman techniques: fundamentals and frontiers. Nanoscale Res. Lett. 14, 231. doi: 10.1186/s11671-019-3039-2
Jones, T. K. L. (2022). A Collision of Maize Stressors: Drought and Dalbulus maidis, Vector of Corn Stunt Disease (Doctoral dissertation).
Jones, H. G., Serraj, R., Loveys, B. R., Xiong, L., Wheaton, A., Price, A. H. (2009). Thermal infrared imaging of crop canopies for the remote diagnosis and quantification of plant responses to water stress in the field. Funct. Plant Biol. 36, 978–989. doi: 10.1071/FP09123
Jorge, T. F., Rodrigues, J. A., Caldana, C., Schmidt, R., van Dongen, J. T., Thomas-Oates, J., et al. (2016). Mass spectrometry-based plant metabolomics: Metabolite responses to abiotic stress. Mass spectrometry Rev. 35, 620–649. doi: 10.1002/mas.21449
Kamilaris, A., Kartakoullis, A., Prenafeta-Boldú, F. X. (2017). A review on the practice of big data analysis in agriculture. Comput. Electron. Agric. 143, 23–37. doi: 10.1016/j.compag.2017.09.037
Keshava, N., Mustard, J. F. (2002). Spectral unmixing. IEEE Signal Process. magazine 19, 44–57. doi: 10.1109/79.974727
Khonina, S. N., Kazanskiy, N. L., Butt, M. A. (2023). Optical fibre-based sensors—An assessment of current innovations. Biosensors 13, 835. doi: 10.3390/bios13090835
Kim, M. S., Chappelle, E. W., Corp, L., McMurtrey, J. E. (1993). “The contribution of chlorophyll fluorescence to the reflectance spectra of green vegetation,” in Proceedings of IGARSS'93-IEEE International Geoscience and Remote Sensing Symposium. 1321–1324.
Klein, L. A. (2004). Sensor and data fusion: a tool for information assessment and decision making (Vol. 138) (SPIE press).
Kouda, K., Iki, M. (2010). Beneficial effects of mild stress (hormetic effects): dietary restriction and health. J. Physiol. Anthropol. 29, 127–132. doi: 10.2114/jpa2.29.127
Kour, S., Sharma, N., Khajuria, A., Kumar, D., Ohri, P. (2024). “Elucidating the Role of Flavonoids in Countering the Effect of Biotic Stress in Plants,” in Plant Phenolics in Biotic Stress Management (Springer Nature Singapore, Singapore), 121–148.
Kozlowski, T. T. (1968). Water deficit and plant growth. Vol. 2. Plant water consumption and response.
Krezhova, D. (2011). Spectral remote sensing of the responses of soybean plants to environmental stresses. Soybean-Genetics Novel Techniques Yield Enhancement. InTech Publ 5, 215–265.
Kumar, R., Sharma, A., Roy, C., Al-Farouni, M., Suyal, J., Kumar, K. P. (2024). “The impactful analysis of DL algorithms isolated observing support models design: A systematic review,” in 2024 4th International Conference on Advance Computing and Innovative Technologies in Engineering (ICACITE). 1037–1041.
Kureel, N., Sarup, J., Matin, S., Goswami, S., Kureel, K. (2022). Modeling vegetation health and stress using hyperspectral remote sensing data. Modeling Earth Syst. Environ., 1–16.
Lang, M., Lichtenthaler, H. K., Sowinska, M., Heisel, F., Miehé, J. A. (1996). Fluorescence imaging of water and temperature stress in plant leaves. J. Plant Physiol. 148, 613–621. doi: 10.1016/S0176-1617(96)80082-4
Lee, S., Seo, Y. E., Choi, J., Yan, X., Kim, T., Choi, D., et al. (2024). Nucleolar actions in plant development and stress responses. Plant Cell Environ. 47, 5189–5204. doi: 10.1111/pce.v47.12
Lefsky, M. A., Cohen, W. B., Acker, S. A., Parker, G. G., Spies, T. A., Harding, D. J. (1999). Lidar remote sensing of the canopy structure and biophysical properties of Douglas-fir western hemlock forests. Remote Sens. Environ. 70, 339–361. doi: 10.1016/S0034-4257(99)00052-8
Lefsky, M. A., Cohen, W. B., Harding, D. J., Parker, G. G., Acker, S. A., Gower, S. T. (2002). Lidar remote sensing of above-ground biomass in three biomes. Global Ecol. biogeography 11, 393–399. doi: 10.1046/j.1466-822x.2002.00303.x
Lenk, S., Chaerle, L., Pfündel, E. E., Langsdorf, G., Hagenbeek, D., Lichtenthaler, H. K., et al. (2007). Multispectral fluorescence and reflectance imaging at the leaf level and its possible applications. J. Exp. Bot. 58, 807–814. doi: 10.1093/jxb/erl207
Leufen, G., Noga, G., Hunsche, M. (2014). Fluorescence indices for the proximal sensing of powdery mildew, nitrogen supply, and water deficit in sugar beet leaves. Agriculture 4, 58–78. doi: 10.3390/agriculture4020058
Li, X., Fu, X., Li, H. (2024). A CARS-SPA-GA feature wavelength selection method based on hyperspectral imaging with potato leaf disease classification. Sensors 24, 6566. doi: 10.3390/s24206566
Li, Y., Huang, C., Ding, L., Li, Z., Pan, Y., Gao, X. (2019). Deep learning in bioinformatics: Introduction, application, and perspective in the big data era. Methods 166, 4–21. doi: 10.1016/j.ymeth.2019.04.008
Lichtenthaler, H. K., Langsdorf, G., Lenk, S., Buschmann, C. (2005). Chlorophyll fluorescence imaging of photosynthetic activity with the flash-lamp fluorescence imaging system. Photosynthetica 43, 355–369. doi: 10.1007/s11099-005-0060-8
Liu, X., Zhou, Y., Zhao, J., Yao, R., Liu, B., Zheng, Y. (2019). “Siamese convolutional neural networks for remote sensing scene classification,” in IEEE Geoscience and Remote Sensing Letters, Vol. 16. 1200–1204.
Lowe, A., Harrison, N., French, A. P. (2017). Hyperspectral image analysis techniques for the detection and classification of the early onset of plant disease and stress. Plant Methods. doi: 10.1186/s13007-017-0233-z
Luong, J. C., Loik, M. E. (2022). Adjustments in physiological and morphological traits suggest drought-induced competitive release of some California plants. Ecol. Evol. 12, e8773. doi: 10.1002/ece3.8773
Maimaitijiang, M., Sagan, V., Sidike, P., Hartling, S., Esposito, F., Fritschi, F. B. (2020). Soybean yield prediction from UAV using multimodal data fusion and deep learning. Remote Sens. Environ. 237, 111599. doi: 10.1016/j.rse.2019.111599
Maity, T., Saxena, A. (2024). Challenges and innovations in food and water availability for a sustainable Mars colonization. Life Sci. Space Res. doi: 10.1016/j.lssr.2024.03.008
Marschner, P., Rengel, Z. (2023). “Nutrient availability in soils,” in Marschner's Mineral Nutrition of Plants (Academic press), 499–522.
Martinelli, F., Scalenghe, R., Davino, S., Panno, S., Scuderi, G., Ruisi, P., et al. (2015). Advanced methods of plant disease detection. A review. Agron. Sustain. Dev. 35, 1–25. doi: 10.1007/s13593-014-0246-1
Maxwell, K., Johnson, G. N. (2000). Chlorophyll fluorescence—a practical guide. J. Exp. Bot. 51, 659–668. doi: 10.1093/jexbot/51.345.659
Meemken, E. M., Becker-Reshef, I., Klerkx, L., Kloppenburg, S., Wegner, J. D., Finger, R. (2024). Digital innovations for monitoring sustainability in food systems. Nature Food 5 (8), 656–660.
Meng, T., Jing, X., Yan, Z., Pedrycz, W. (2020). A survey on machine learning for data fusion. Inf. Fusion 57, 115–129. doi: 10.1016/j.inffus.2019.12.001
Mertens, S., Verbraeken, L., Sprenger, H., De Meyer, S., Demuynck, K., Cannoot, B., et al. (2023). Monitoring of drought stress and transpiration rate using proximal thermal and hyperspectral imaging in an indoor automated plant phenotyping platform. Plant Methods 19, 132. doi: 10.1186/s13007-023-01102-1
Meyer, B. E. (2023). “The Tripartite Structure of Sustainability: a new educational approach to bridge the gap to wise and sustainable action,” in Frontiers in Education, vol. 8. (Frontiers Media SA), 1224303.
Miao, Y., Lv, J., Huang, H., Cao, D., Zhang, S. (2020). Molecular characterization of root exudates using Fourier transform ion cyclotron resonance mass spectrometry. J. Environ. Sci. 98, 22–30. doi: 10.1016/j.jes.2020.05.011
Moustaka, J., Moustakas, M. (2023). Early-stage detection of biotic and abiotic stress on plants by chlorophyll fluorescence imaging analysis. Biosensors 13 (8), 796.
Mu, S., Cui, M., Huang, X. (2020). Multimodal data fusion in learning analytics: A systematic review. Sensors (Basel). 20, 6856. doi: 10.3390/s20236856
Nayak, P., Mukherjee, A. K., Pandit, E., Pradhan, S. K. (2018). Application of statistical tools for data analysis and interpretation in rice plant pathology. Rice Sci. 25, 1–18. doi: 10.1016/j.rsci.2017.07.001
Oerke, E. C., Steiner, U., Dehne, H. W. (2014). Thermal imaging for disease detection in precision crop production. J. Agric. Food Chem. 62, 3061–3069. doi: 10.1021/jf403215y
Olivieri, A. C., Faber, N. M., Ferré, J., Boqué, R., Kalivas, J. H., Mark, H. (2006). Uncertainty estimation and figures of merit for multivariate calibration (IUPAC Technical Report). Pure Appl. Chem. 78, 633–661. doi: 10.1351/pac200678030633
Osdaghi, E., Jones, J. B., Sharma, A., Goss, E. M., Abrahamian, P., Newberry, E. A., et al. (2021). A centenary for a bacterial spot of tomato and pepper. Mol. Plant Pathol. 22, 1500. doi: 10.1111/mpp.13125
Peng, Z., He, S., Sun, J., Pan, Z., Gong, W., Lu, Y., et al. (2016). Na+ compartmentalization related to salinity stress tolerance in upland cotton (Gossypium hirsutum) seedlings. Sci. Rep. 6, 34548. doi: 10.1038/srep34548
Pérez-Patricio, M., Osuna-Coutiño, J. D. J., Ríos-Toledo, G., Aguilar-González, A., Camas-Anzueto, J. L., Morales-Navarro, N. A., et al. (2024). Plant stress detection using a three-dimensional analysis from a single RGB image. Sensors 24, 7860. doi: 10.3390/s24237860
Pérez-Bueno, M. L., Pineda, M., Barón, M. (2019). Phenotyping plant responses to biotic stress by chlorophyll fluorescence imaging. Front. Plant Sci. 10, 1135.
Pettorelli, N., Schulte to Bühne, H., Tulloch, A., Dubois, G., Macinnis-Ng, C., Queirós, A. M., et al. (2018). Satellite remote sensing of ecosystem functions: opportunities, challenges and way forward. Remote Sens. Ecol. Conserv. 4, 71–93. doi: 10.1002/rse2.2018.4.issue-2
Primo-Capella, A., Martínez-Cuenca, M. R., Forner-Giner, M.Á. (2021). Cold stress in Citrus: A molecular, physiological and biochemical perspective. Horticulturae 7, 340. doi: 10.3390/horticulturae7100340
Quaas, T., Berteotti, S., Ballottari, M., Flieger, K., Bassi, R., Wilhelm, C., et al. (2015). Non-photochemical quenching and xanthophyll cycle activities in six green algal species suggest mechanistic differences in the process of excess energy dissipation. J. Plant Physiol. 172, 92–103. doi: 10.1016/j.jplph.2014.07.023
Rahimikhoob, H., Sohrabi, T., Delshad, M. (2024). Variance-based global sensitivity analysis and uncertainty quantification of the AquaCrop model parameters for basil (Ocimum basilicum L.) under different nitrogen fertilizer rates. J. Plant Nutr. 47, 628–645. doi: 10.1080/01904167.2023.2280142
Ratner, B. (2017). Statistical and machine-learning data mining: Techniques for better predictive modeling and analysis of big data (Chapman and Hall/CRC).
Rouse, J. W., Haas, R. H., Schell, J. A., Deering, D. W. (1974). Monitoring vegetation systems in the Great Plains with ERTS. NASA Spec. Publ 351, 309.
Sagi, T., Lehahn, Y., Bar, K. (2020). Artificial intelligence for ocean science data integration: current state, gaps, and way forward. Elem Sci. Anth 8, 21. doi: 10.1525/elementa.418
Sarfraz, S., Ali, F., Hameed, A., Ahmad, Z., Riaz, K. (2023). “Sustainable agriculture through technological innovations,” in Sustainable agriculture in the era of the OMICs revolution (Springer International Publishing, Cham), 223–239.
Seok, H. Y., Lee, S. Y., Sarker, S., Bayzid, M., Moon, Y. H. (2023). Genome-wide analysis of stress-responsive genes and alternative splice variants in arabidopsis roots under osmotic stresses. Int. J. Mol. Sci. 24, 14580. doi: 10.3390/ijms241914580
Shafique, S., Javed, A., Shafique, S., Hussain, A., Rafique, R., Mubarak, A. (2022). Isolation and identification of Pithomyces sacchari as a leaf spot pathogen of Helianthus annuus from Pakistan. Sci. Rep. 12, 22033. doi: 10.1038/s41598-022-25890-z
Shahoveisi, F., Taheri Gorji, H., Shahabi, S., Hosseinirad, S., Markell, S., Vasefi, F. (2023). Application of image processing and transfer learning for the detection of rust disease. Sci. Rep. 13, 5133. doi: 10.1186/s13007-017-0233-z
Shen, H., Meng, X., Zhang, L. (2016). An integrated framework for the spatio–temporal–spectral fusion of remote sensing images. IEEE Trans. Geosci. Remote Sens. 54, 7135–7148. doi: 10.1109/TGRS.2016.2596290
Shi, W., Chen, L., Zhu, X. (2023). Task offloading decision-making algorithm for vehicular edge computing: a deep-reinforcement-learning-based approach. Sensors 23, 7595. doi: 10.3390/s23177595
Smolinska, A., Engel, J., Szymanska, E., Buydens, L., Blanchet, L. (2019). “General framing of low-, mid-, and high-level data fusion with examples in the life sciences,” in Data Handling in Science and Technology, vol. 31. (Elsevier), 51–79.
Tarakanov, R. I., Lukianova, A. A., Evseev, P. V., Toshchakov, S. V., Kulikov, E. E., Ignatov, A. N., et al. (2022). Bacteriophage Control of Pseudomonas savastanoi pv. glycinea in Soybean. Plants 11, 938.
Tomkins, M., Hughes, A., Morris, R. J. (2021). An update on passive transport in and out of plant cells. Plant Physiol. 187, 1973–1984. doi: 10.1093/plphys/kiab406
Tucker, C. J. (1979). Red and photographic infrared linear combinations for monitoring vegetation. Remote Sens. Environ. 8, 127–150. doi: 10.1016/0034-4257(79)90013-0
Van der Maaten, L., Postma, E., van den Herik, J. (2009). Dimensionality reduction: A comparative review. J. Mach. Learn. Res.
Vasefi, F., Booth, N., Hafizi, H., Farkas, D. L. (2018). “Multi-mode hyperspectral imaging for food quality and safety,” in Hyperspectral Imaging in Agriculture, Food and Environment (IntechOpen).
Von Ziegler, L. M., Floriou-Servou, A., Waag, R., et al. (2022). Multiomic profiling of the acute stress response in the mouse hippocampus. Nat. Commun. 13, 1824. doi: 10.1038/s41467-022-29367-5
Walsh, J. J., Mangina, E., Negrão, S. (2024). Advancements in imaging sensors and AI for plant stress detection: A systematic literature review. Plant Phenomics 6, 0153. doi: 10.34133/plantphenomics.0153
Wan, Z. (2002). Estimate of noise and systematic error in early thermal infrared data of the Moderate Resolution Imaging Spectroradiometer (MODIS). Remote Sens. Environ. 80, 47–54. doi: 10.1016/S0034-4257(01)00266-8
Wang, X., Liu, X., Wang, L., Yang, J., Wan, X., Liang, T. (2022). A holistic assessment of spatiotemporal variation, driving factors, and risks influencing river water quality in the northeastern Qinghai-Tibet Plateau. Sci. Total Environ. 851, 157942. doi: 10.1016/j.scitotenv.2022.157942
Wijesinghe, S., Kariyawasam, M. (2024). Exploring advanced data architectures and security frameworks to optimize analytics efficiency, cross-domain integration, and decision-making precision in complex systems. SAGE Sci. Rev. Appl. Mach. Learn. 7, 1–12.
Xie, P., Du, R., Ma, Z., Cen, H. (2023). Generating 3D multispectral point clouds of plants with fusion of snapshot spectral and RGB-D images. Plant Phenomics 5, 0040. doi: 10.34133/plantphenomics.0040
Yadeta, K. A., Thomma, B. P. H. J. (2013). The xylem as battleground for plant hosts and vascular wilt pathogens. Front. Plant Sci. 4. doi: 10.3389/fpls.2013.00097
Zarco-Tejada, P. J., González-Dugo, V., Berni, J. A. (2012). Fluorescence, temperature and narrow-band indices acquired from a UAV platform for water stress detection using a micro-hyperspectral imager and a thermal camera. Remote Sens. Environ. 117, 322–337. doi: 10.1016/j.rse.2011.10.007
Zhang, Y., et al. (2018). Phenotyping of arabidopsis drought stress response using kinetic chlorophyll fluorescence and multicolor fluorescence imaging. Front. Plant Sci. 9. doi: 10.3389/fpls.2018.00603
Zhang, Y., Xu, J., Li, R., Ge, Y., Li, Y., Li, R. (2023). Plants' Response to abiotic stress: mechanisms and strategies. Int. J. Mol. Sci. 24, 10915. doi: 10.3390/ijms241310915
Keywords: plant stressor, hyperspectral, -mapping indices, stress pattern, multi-modespectroscopy, -stress pathways, -hyperspectral fluorescence imaging (HFI), hyperspectral reflectance imaging (HRI)
Citation: Zandi A, Hosseinirad S, Kashani Zadeh H, Tavakolian K, Cho B-K, Vasefi F, Kim MS and Tavakolian P (2025) A systematic review of multi-mode analytics for enhanced plant stress evaluation. Front. Plant Sci. 16:1545025. doi: 10.3389/fpls.2025.1545025
Received: 18 December 2024; Accepted: 27 February 2025;
Published: 30 April 2025.
Edited by:
Rajesh Kumar Singh, Guangxi Academy of Agricultural Science, ChinaReviewed by:
Muhammad Fuad Anshori, Hasanuddin University, IndonesiaNikitha S, Visvesvaraya Technological University, India
Copyright © 2025 Zandi, Hosseinirad, Kashani Zadeh, Tavakolian, Cho, Vasefi, Kim and Tavakolian. This is an open-access article distributed under the terms of the Creative Commons Attribution License (CC BY). The use, distribution or reproduction in other forums is permitted, provided the original author(s) and the copyright owner(s) are credited and that the original publication in this journal is cited, in accordance with accepted academic practice. No use, distribution or reproduction is permitted which does not comply with these terms.
*Correspondence: Pantea Tavakolian, UGFudGVhLnRhdmFrb2xpYW5AdW5kLmVkdQ==