 Yuan Feng
 Guanghui Dai1,2,3
 Yangping Qin
- 1Yunnan Academy of Forestry and Grassland, Kunming, Yunnan, China
- 2Yunnan Key Laboratory of Biodiversity of Gaoligong Mountain, Kunming, Yunnan, China
- 3Gaoligong Mountain Forest Ecosystem Observation and Research Station of Yunnan Province, Kunming, Yunnan, China
- 4Southwest Survey and Planning Institute, National Forestry and Grassland Administration, Kunming, Yunnan, China
- 5State Key Laboratory of Efficient Production of Forest Resources, Institute of Forest Resource Information Techniques, Chinese Academy of Forestry, Beijing, China
Keteleeria evelyniana Mast., which is widespread in southwestern China, is valuable for studying under different future climate scenarios to assess potential distribution shifts in response to climate warming. Understanding these changes can provide theoretical support for species conservation, rational utilization, ecological restoration, and management of K. evelyniana habitats. The Maxent model was optimized using the package of ENMeval to adjust the Regularization Multiplier (RM) and Feature Class Combinations (FC) parameters. Utilizing 221 effective distribution points and 33 environmental variables, the potential distribution of K. evelyniana in current and future climate scenarios was predicted, with the key environmental variables analyzed. The model with FC = LQ and RM = 0.5, demonstrated low complexity, minimal overfitting, and high accuracy, achieving an AUC value of 0.946 with a standard deviation of 0.011. Under the current climate conditions, 68% of the suitable areas for K. evelyniana were focused on Yunnan Province, with additional areas in western and southwestern Guizhou, southwestern Sichuan, and the southeastern Xizang Autonomous Region. In various future climate scenarios, the suitable areas for K. evelyniana gradually decreased, with a maximum reduction of 33%. Simultaneously, the centroids of these areas are expected to migrate northward by up to 33 km. Temperature was the dominant factor affecting its distribution (77.8%), whereas the effects of soil variables and altitude were significant. This study clarified the current distribution of K. evelyniana, projected the potential shifts under different future climate scenarios, and identified the main environmental factors affecting the distribution. These findings offer valuable theoretical support for the conservation, ecological restoration, and sustainable use of K. evelyniana.
1 Introduction
Species distribution is closely related to climate, with climate change serving as the primary driver for shifts in these distributions (Paz-Kagan et al., 2021; Lawlor et al., 2024). Climate change not only alters the geographical distribution of species but also significantly affects their abundance, diversity, composition, and ecosystem functioning (Bellard et al., 2012; Dieleman et al., 2015; Feeley et al., 2020; Ruiz-Labourdette et al., 2012). According to the Intergovernmental Panel on Climate Change (IPCC) AR6 Synthesis Report (IPCC, 2023), global warming is attributed to greenhouse gas emissions caused by human activities. From 2011 to 2020, the global average surface temperature was 1.1°C higher than that from 1850 to 1900 and is projected to surpass the 1.5°C threshold by 2021–2040 (Calvin et al., 2023). This trend indicates significant shifts in the suitable ranges of species, with warming likely to drive species toward higher altitudes or latitudes (Wilson et al., 2007; Lawlor et al., 2024), whereas some may face extinction risks (Thomas et al., 2004). Therefore, in-depth study of species distribution patterns related to climate change is crucial for developing scientific strategies for species conservation and germplasm resource management. Such research not only supports biodiversity conservation but also provides a scientific foundation for activities such as species introduction and cultivation.
The Species Distribution Model (SDM), also known as an Ecological Niche Model (ENM), is a mathematical tool adopted to predict the geographic distribution of species based on data on species presence or abundance and environmental factors (Elith and Leathwick, 2009). When combined with global climate models, SDMs can project species range changes in future climate scenarios. Common SDMs methods include Random Forest, Maximum Entropy, eXtreme Gradient Boosting Training, and more than ten others (Thuiller et al., 2012). Among these, Maximum Entropy has been widely applied in areas such as assessing climate change impacts on species distribution (Soilhi et al., 2022; He et al., 2023; Shi et al., 2024), protecting endangered species (Gao et al., 2022; Zhao et al., 2022; Deng et al., 2024), prevention and control of invasive species (Low et al., 2021; Sorbe et al., 2023), pest management (Kuprin et al., 2024; Wei et al., 2024), and geological disaster prediction (Boussouf et al., 2023; Qasimi et al., 2024) because of its advantages such as high predictive accuracy, reliance solely on occurrence data, and robustness to sample size limitations (Pearson et al., 2007; Phillips and Dudık, 2008; Elith et al., 2011).
K. evelyniana, an evergreen tree in the Pinaceae family and genus Keteleeria, is a relict species from the Tertiary period (Du, 2022). It is a valuable timber and reforestation species in the southern plateau region, with significant economic importance and a crucial role in ecological conservation (Du, 2022). According to the Plants of the World Online website, K. evelyniana is distributed throughout East Asia, including China, Laos and Vietnam (https://powo.science.kew.org/). Within China it grows mainly in Yunnan Province, western and southwestern Guizhou, and from the Anning River Basin to the western Dadu River Basin in Sichuan Province (Editorial Committee of flora of China, Chinese Academy of Sciences, 2004). Listed as Near Threatened (NT) on the IUCN Red List, existing research has primarily focused on its chemical composition (Fu et al., 2008; He et al., 2011), silviculture (Wang et al., 2022; Zhou et al., 2023b), plant-fungal symbioses (Ge et al., 2012) and community structure (Li et al., 2013; Tang et al., 2024). However, there is still a knowledge gap regarding how its distribution can vary under future climate scenarios and which environmental factors predominantly influence its range. Based on the environmental variables and distribution data of K. evelyniana, this study aimed to (1) predict its potential distribution in southwest China, (2) analyze the dominant environmental variables influencing its distribution, and (3) explore how its suitable habitats may change under different future climate scenarios. This study provides a theoretical foundation for species conservation, rational resource use, and ecological restoration of K. evelyniana.
2 Materials and methods
2.1 Data sources and processing
2.1.1 Species occurrence data
The main sources of distribution data for K. evelyniana were field surveys, Global Biodiversity Information Facility (GBIF, https://www.gbif.org/), Chinese Virtual Herbarium (CVH, https://www.cvh.ac.cn/), and literature (Tang et al., 2017; Du, 2022). Duplicate and invalid distribution points were removed, and to reduce spatial autocorrelation and prevent overfitting, a grid cell size of 2.5′×2.5′ latitude and longitude (consistent with the spatial resolution of environmental variables) was used with one record per cell (Yan et al., 2021). A total of 221 geographical occurrences of K. evelyniana were included in further analysis (Figure 1), 85 from field surveys, 77 from GBIF, 3 from CVH and 56 from literature.
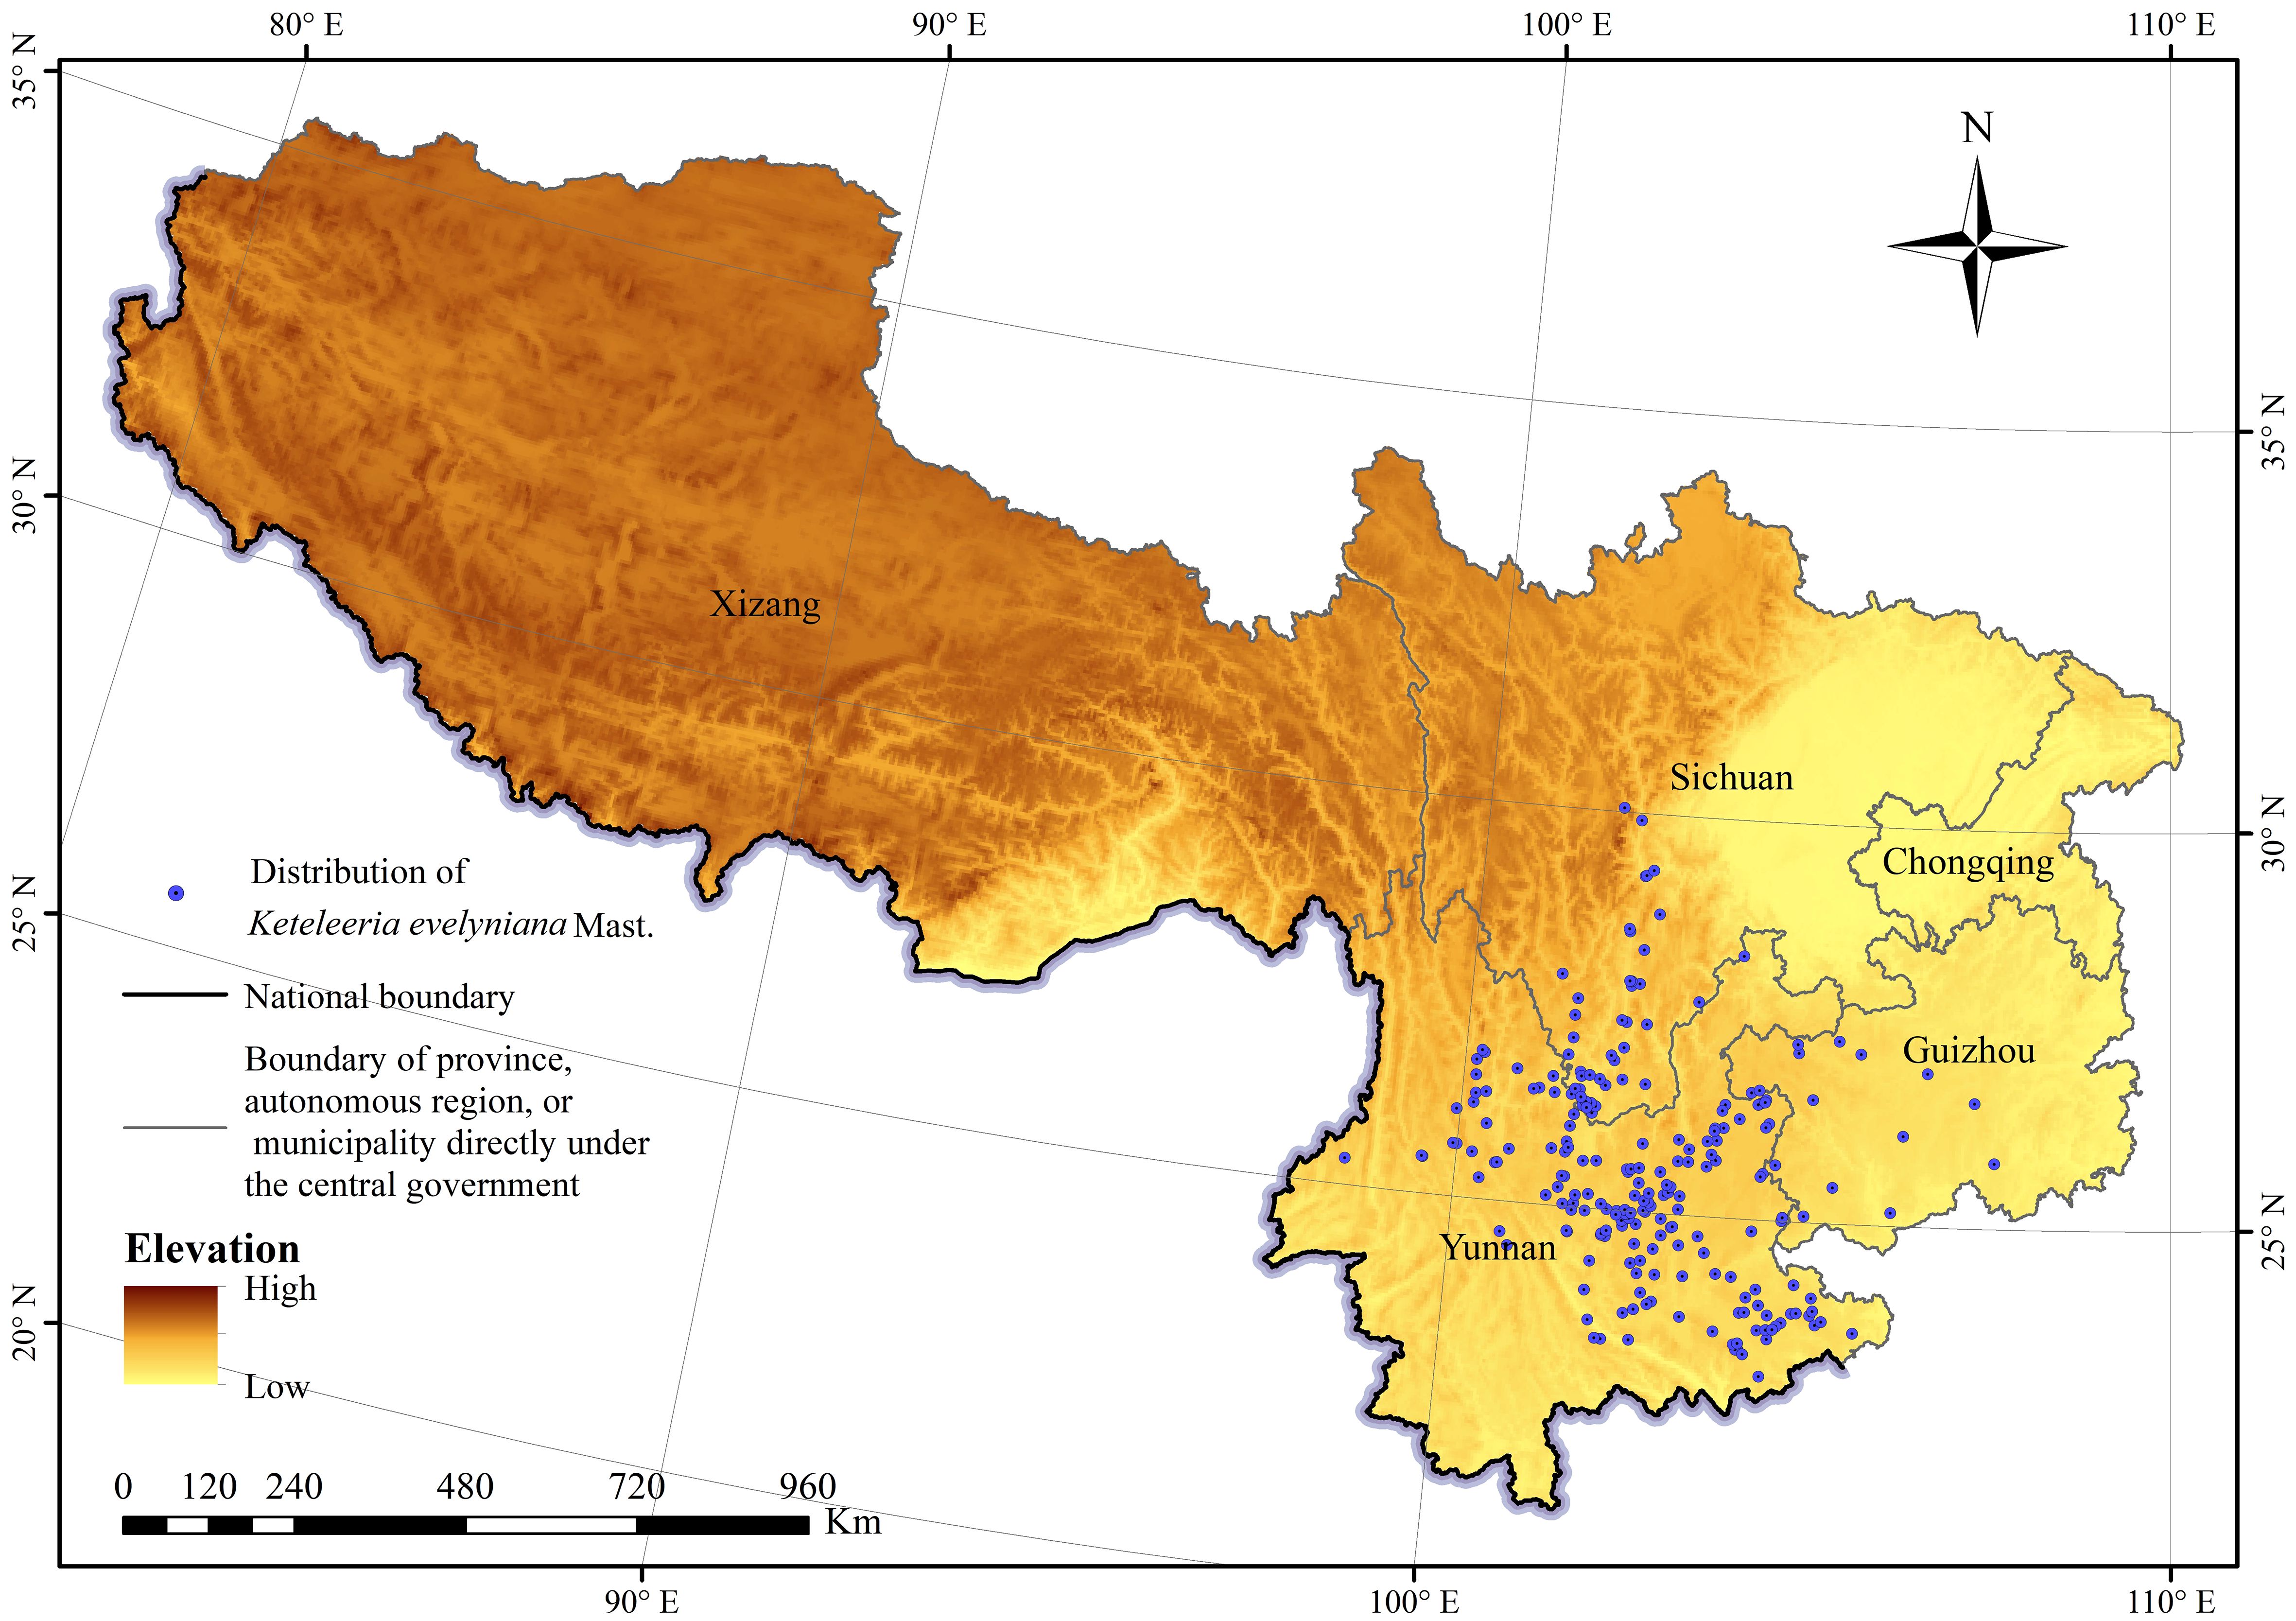
Figure 1. Distribution of Keteleeria evelyniana Mast. in southwest China.
2.1.2 Environmental variables
To study the potential distribution of K. evelyniana, 33 environmental variables were used, including 19 bioclimatic, 3 topographic, and 11 soil variables, as detailed in Appendix Table S1. The bioclimatic variables included both current data and future climate scenario projections for the following periods: the current period and four subsequent 20-year intervals from 2021 to 2100. Current bioclimatic data were extracted from WorldClim 2.1, averaged over 1970–2000 (Fick and Hijmans, 2017), whereas future bioclimatic data were obtained using the Beijing Climate Center Climate System Model 2 Medium Resolution (BCC-CSM2-MR) under the Coupled Model Intercomparison Project Phase 6 (CMIP6). The scenarios of SSP5-8.5, SSP2-4.5, and SSP1-2.6 were selected to project the future distribution of K. evelyniana, representing the conventional, moderate, and sustainable development pathways with radiative forcings of 8.5, 4.5, and 2.6 W/m2, respectively, by 2100 (He et al., 2023; Shi et al., 2023). Each scenario involved two time periods: 2021–2040 (2030s) and 2061–2080 (2070s). The elevation data were sourced from WorldClim 2.1, whereas the aspect and slope were derived from the spatial analysis using GIS software. Soil data were obtained from the SoilGrids 250 m system, with each soil variable (except Ocs) divided into six profile depths (Poggio et al., 2021), weighted, and averaged by depth to obtain the final values. The spatial resolution of all environmental variables was 2.5 arc minutes.
Environmental variables often exhibit varying degrees of collinearity. To prevent model overfitting and enhance simulation accuracy and practical usability, these variables should be screened before being used in the Maxent model (Miller, 2010). Variables that exhibited a correlation of less than 0.8 (Appendix Figure A1), and an initial contribution value greater than 1% to Maxent’s prediction was maintained (Appendix Table S1). Finally, six environmental variables were adopted, as listed in Table 1.
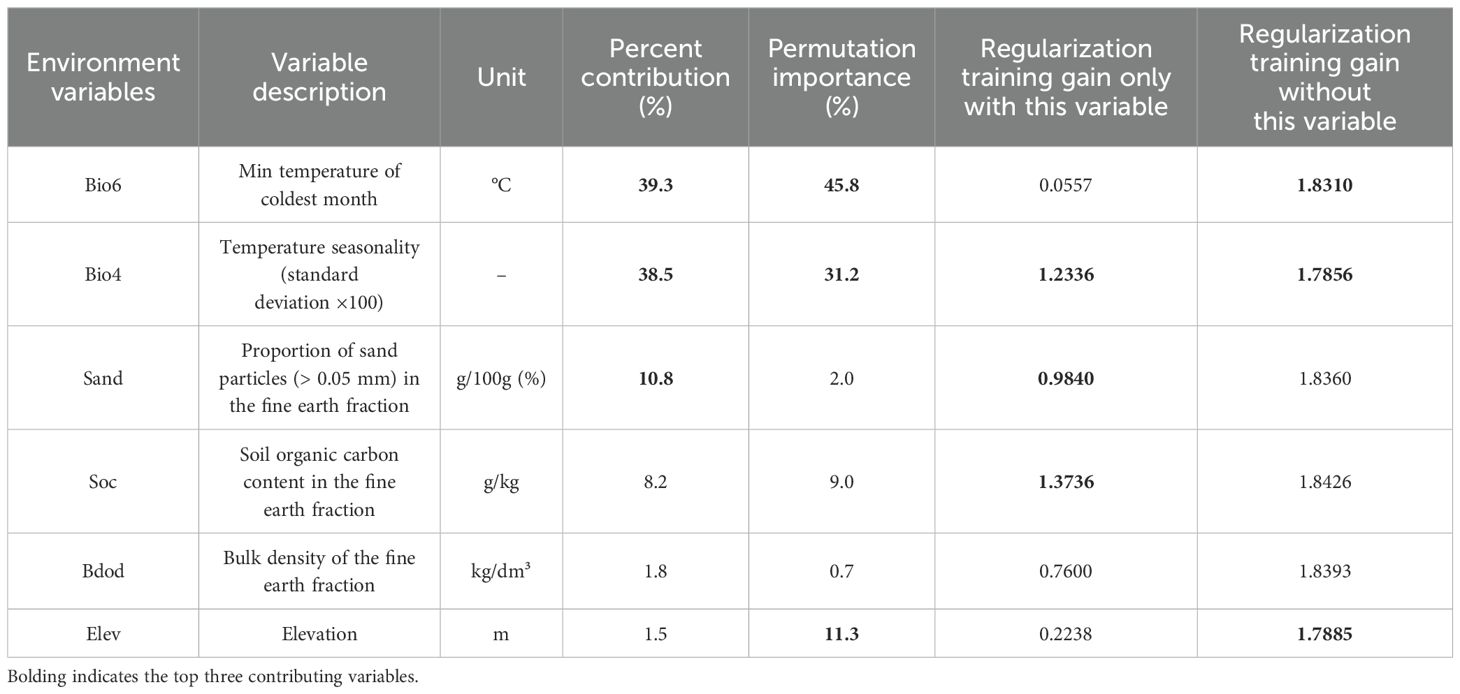
Table 1. Contribution of the six environmental variables to the K. evelyniana Maxent prediction model.
Administrative division base maps in this study were sourced from the Standard Map Service Platform (http://bzdt.ch.mnr.gov.cn/index.html) with the map approval number GS (2016) 2923. The base maps were used without modification.
2.2 Maxent model optimization, construction, and evaluation
2.2.1 Maxent model optimization
Default parameter settings for Maxent models are commonly used in species distribution modeling, but they can result in overly complex models that are prone to overfitting (Shi et al., 2024; Warren et al., 2014; Zhao et al., 2021b). Among the parameters influencing Maxent model outcomes, the Regularization Multiplier (RM) and Feature Class Combinations (FC) have the greatest impact. In this study, we tuned these parameters using the ENMeval package (Kass et al., 2021), setting the RM values from 4 to 0.5 in 0.5 decrements and the FC values to LQHPT, LQHP, LQH, H, LQ, and L, creating 48 parameter combinations, following previous studies (Shi et al., 2024; Zhao et al., 2021a). The model performance was evaluated using the 10% training omission rate (OR10), the difference between the training and test AUC (AUC.DIFF), and Akaike Information Criterion correction (AICc) (Pearson et al., 2007; Warren and Seifert, 2011). The AICc reflects the model’s complexity and goodness of fit, with the model having the smallest AICc value (delta.AICc = 0) considered optimal, and models with delta.AICc < 2 considered highly reliable. In addition, AUC.DIFF and OR10 were used to assess the degree of overfitting.
2.2.2 Maxent model construction
The 221 occurrence records of K. evelyniana and six environmental variables were input into Maxent V 3.4.4 (https://biodiversityinformatics.amnh.org/open_source/maxent/) to predict its potential distribution across different time periods, with the cross-validation method repeated 10 times. RM and FC applied the previously optimized parameters, whereas the other settings adhered to Maxent’s default values. The model outputs (.asc) were converted into raster data using ArGIS software, and the potential distribution of K. evelyniana was categorized into four suitability groups using the Jenks natural breaks method (He et al., 2023; Shi et al., 2024): unsuitable area (0-0.11), low suitable area (0.11–35), medium suitable area (0.35–0.63), and high suitable area (0.63–1.00). Use the “Raster to Polygon” tool to convert the classified raster data to vector data, define the projection, and calculate the area of each suitability group. Additionally, the SDM toolbox tool was applied to analyze the centroid location and migration trends of suitable areas for K. evelyniana across different future time periods (Brown et al., 2017).
2.2.3 Maxent model evaluation
The area under the Receiver Operating Characteristic curve (AUC), which ranged from 0 to 1, was used to evaluate the accuracy of the model (Elith et al., 2006). A higher AUC value indicates better predictive performance. An AUC value greater than 0.9 reflects the excellent predictive performance, a value between 0.7 and 0.9 indicates the good predictive ability, and an AUC from 0.5 to 0.7 signifies the average predictive ability (Swets, 1988). Equation 1 shows the calculation of AUC.
Where, if Y > X, then = 1, if Y = X, then = 0.5, otherwise, = 0. Xi and Yj are the predicted values for the unmeasured sample i and the measured sample j, respectively. Additionally, a denotes the true positive (TP), b the false positive (FP), c the false negative (FN), and d the true negative (TN).
A combination of percentage contribution, permutation importance, and jackknife tests was used to identify the dominant environmental factors.
3 Results
3.1 Model optimization and accuracy evaluation
RM and FC were optimized in this study to reduce model complexity and improve fit. With RM set to 1 and FC set to LQHPT as the default, the model had a delta.AICc of 47.95. In contrast, the model with RM set to 0.5 and FC set to LQ had the smallest delta.AICc value of 0 (Figure 2A), indicating the lowest complexity. Further comparison showed that under FC=LQ and RM=0.5, the AUC.DIFF increased by 4.48% (Figure 2B), whereas OR10 decreased by 20.00% (Figure 2C) compared to the default settings. Therefore, FC=LQ and RM=0.5 were selected as the optimal settings.
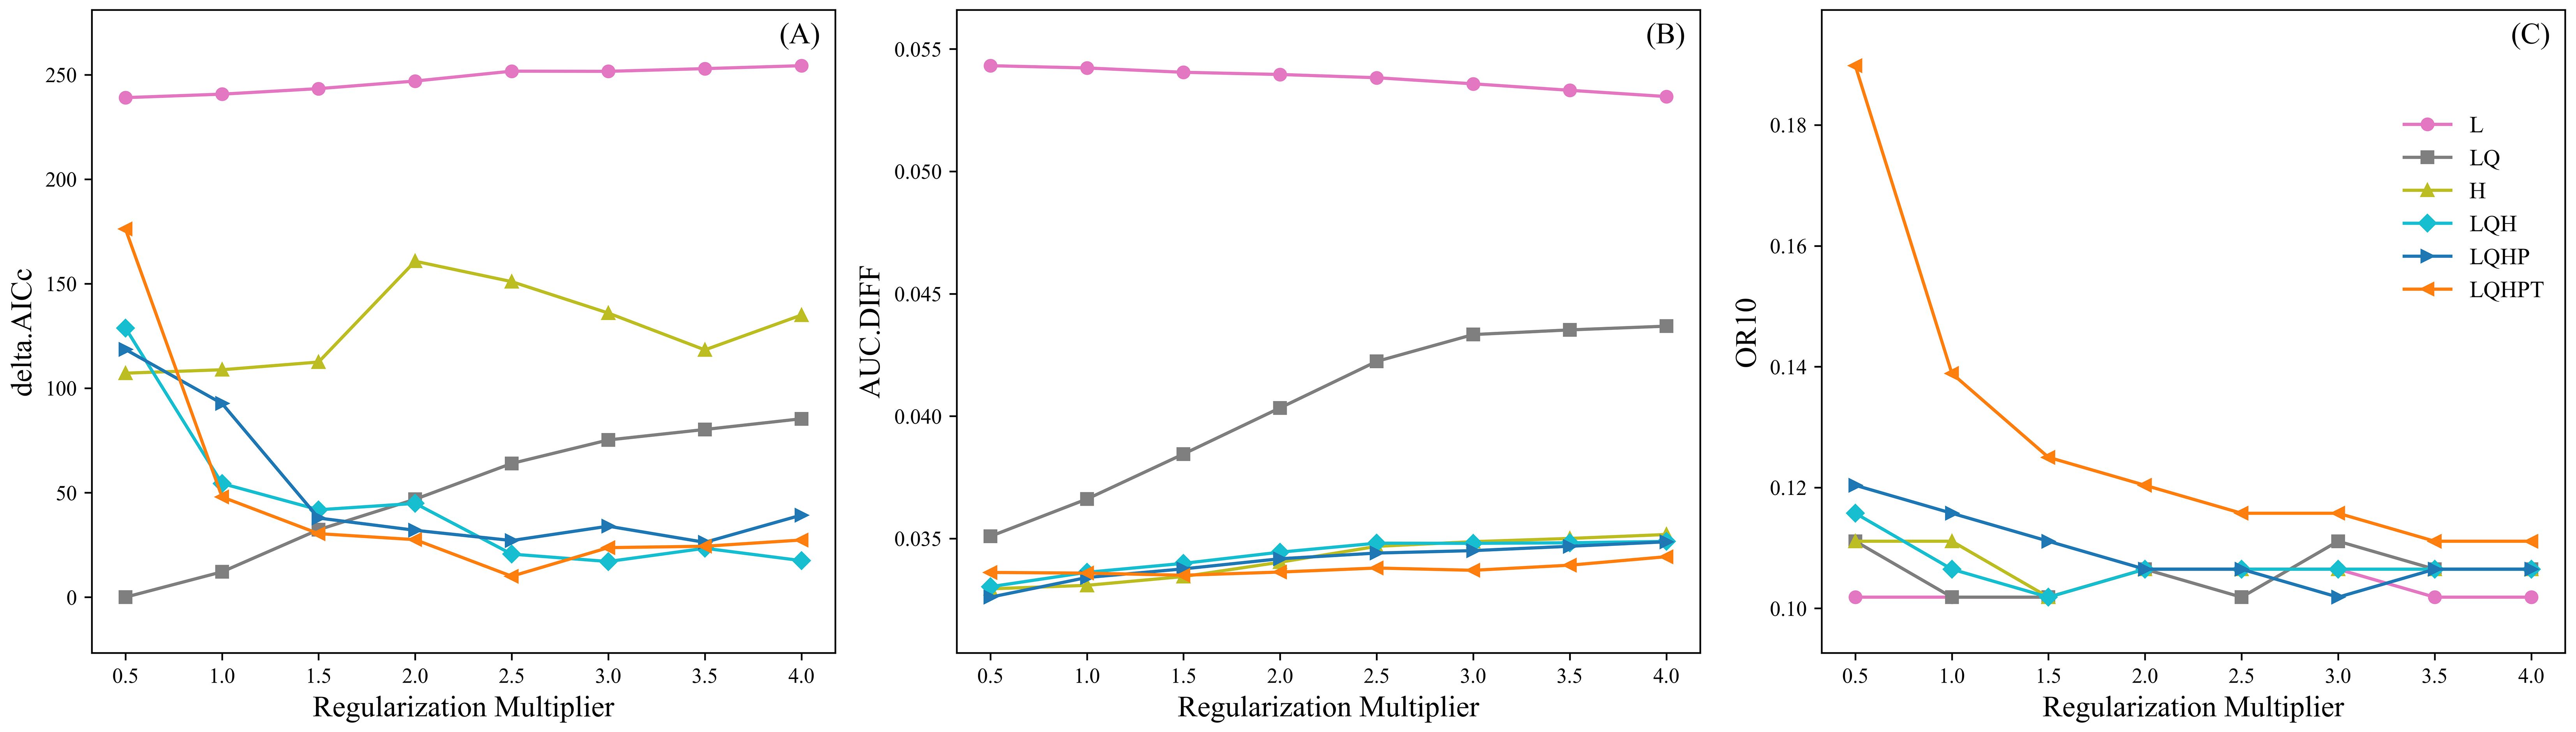
Figure 2. Changes in delta.AICc (A), AUC.DIFF (B), and OR10 (C) of the K. evelyniana Maxent model under different parameter combinations of FC and RM.
The ROC curve of the K. evelyniana Maxent model is shown in Figure 3, with an AUC value of 0.946 and a standard deviation of 0.011. This demonstrated that the model presented excellent predictive ability and accurately predicted of the potential distribution of K. evelyniana.
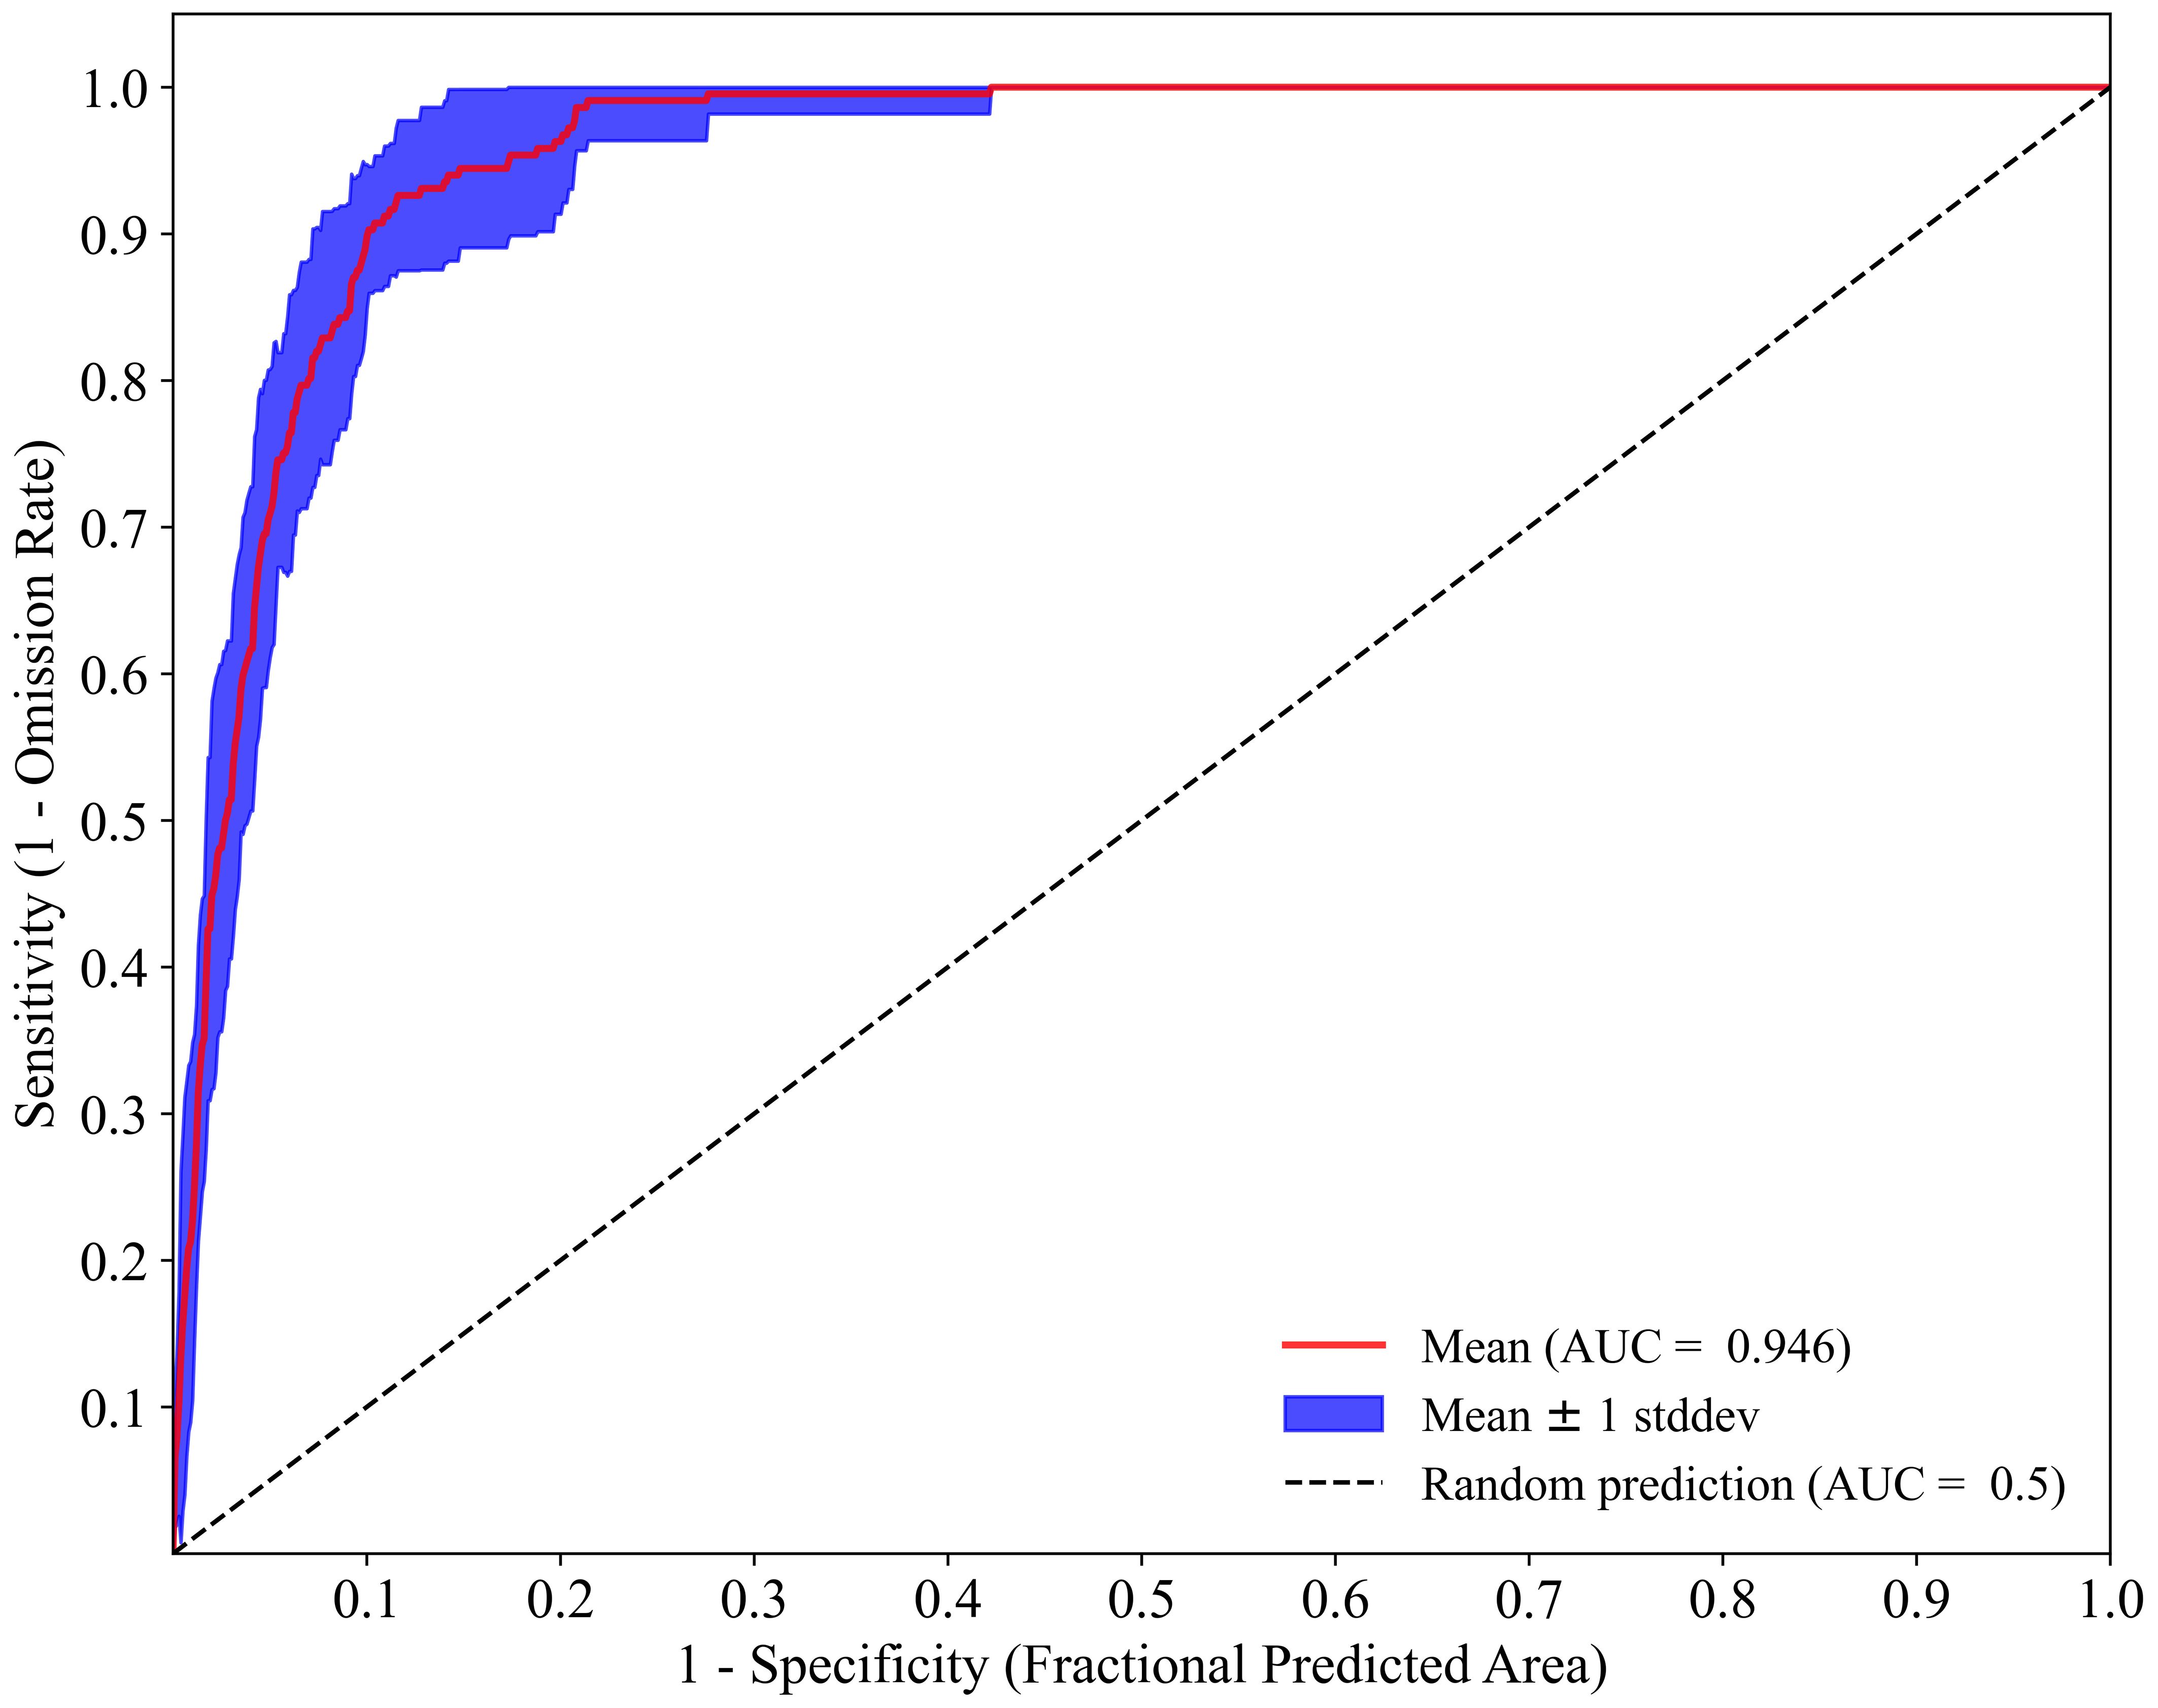
Figure 3. ROC analysis of Maxent model for predicting the distribution of K. evelyniana.
3.2 Dominant environmental variables and response curve analysis
The contributions of each environmental variable to the K. evelyniana Maxent model are presented in Table 1. The top three contributing variables were the lowest temperature of the coldest month (Bio6), temperature seasonality (Bio4), and the proportion of sand particles (> 0.05 mm) in the fine earth fraction (Sand), with a combined contribution of 88.6%. The highest permutation importance was attributed to Bio6, Bio4, and elevation (Elev), with a cumulative contribution of 88.3%. When considering individual variables for prediction, soil organic carbon (Soc), Bio4, and Sand were the most significant. Removing Bio4, Elev, and Bio6 from the model resulted in the greatest loss of regularization training gain. Overall, temperature variables (Bio4 and Bio6) were the most critical environmental factors influencing the distribution of K. evelyniana, contributing 77.8%, whereas soil variables and elevation also played significant roles.
Figure 4 illustrates the response curves of the probability of K. evelyniana presence on the dominant environmental variables. According to previous studies (Shi et al., 2024; Zhao et al., 2021b), when the probability of presence exceeds 0.5, the corresponding environmental variable value can be considered favorable for plant cultivation. Based on this, suitable ranges for K. evelyniana growth were identified with Bio4 ranging from 370 to 550 (Figure 4A), Bio6 from -1.93 to 5.65 °C (Figure 4B), Elev from 1373.8 to 2490.5 m (Figure 4C), Bdod from 0 to 1.44 kg/dm³ (Figure 4D), Sand from 0 to 27.79% (Figure 4E), and Soc from 0 to 14.07 g/kg (Figure 4F).
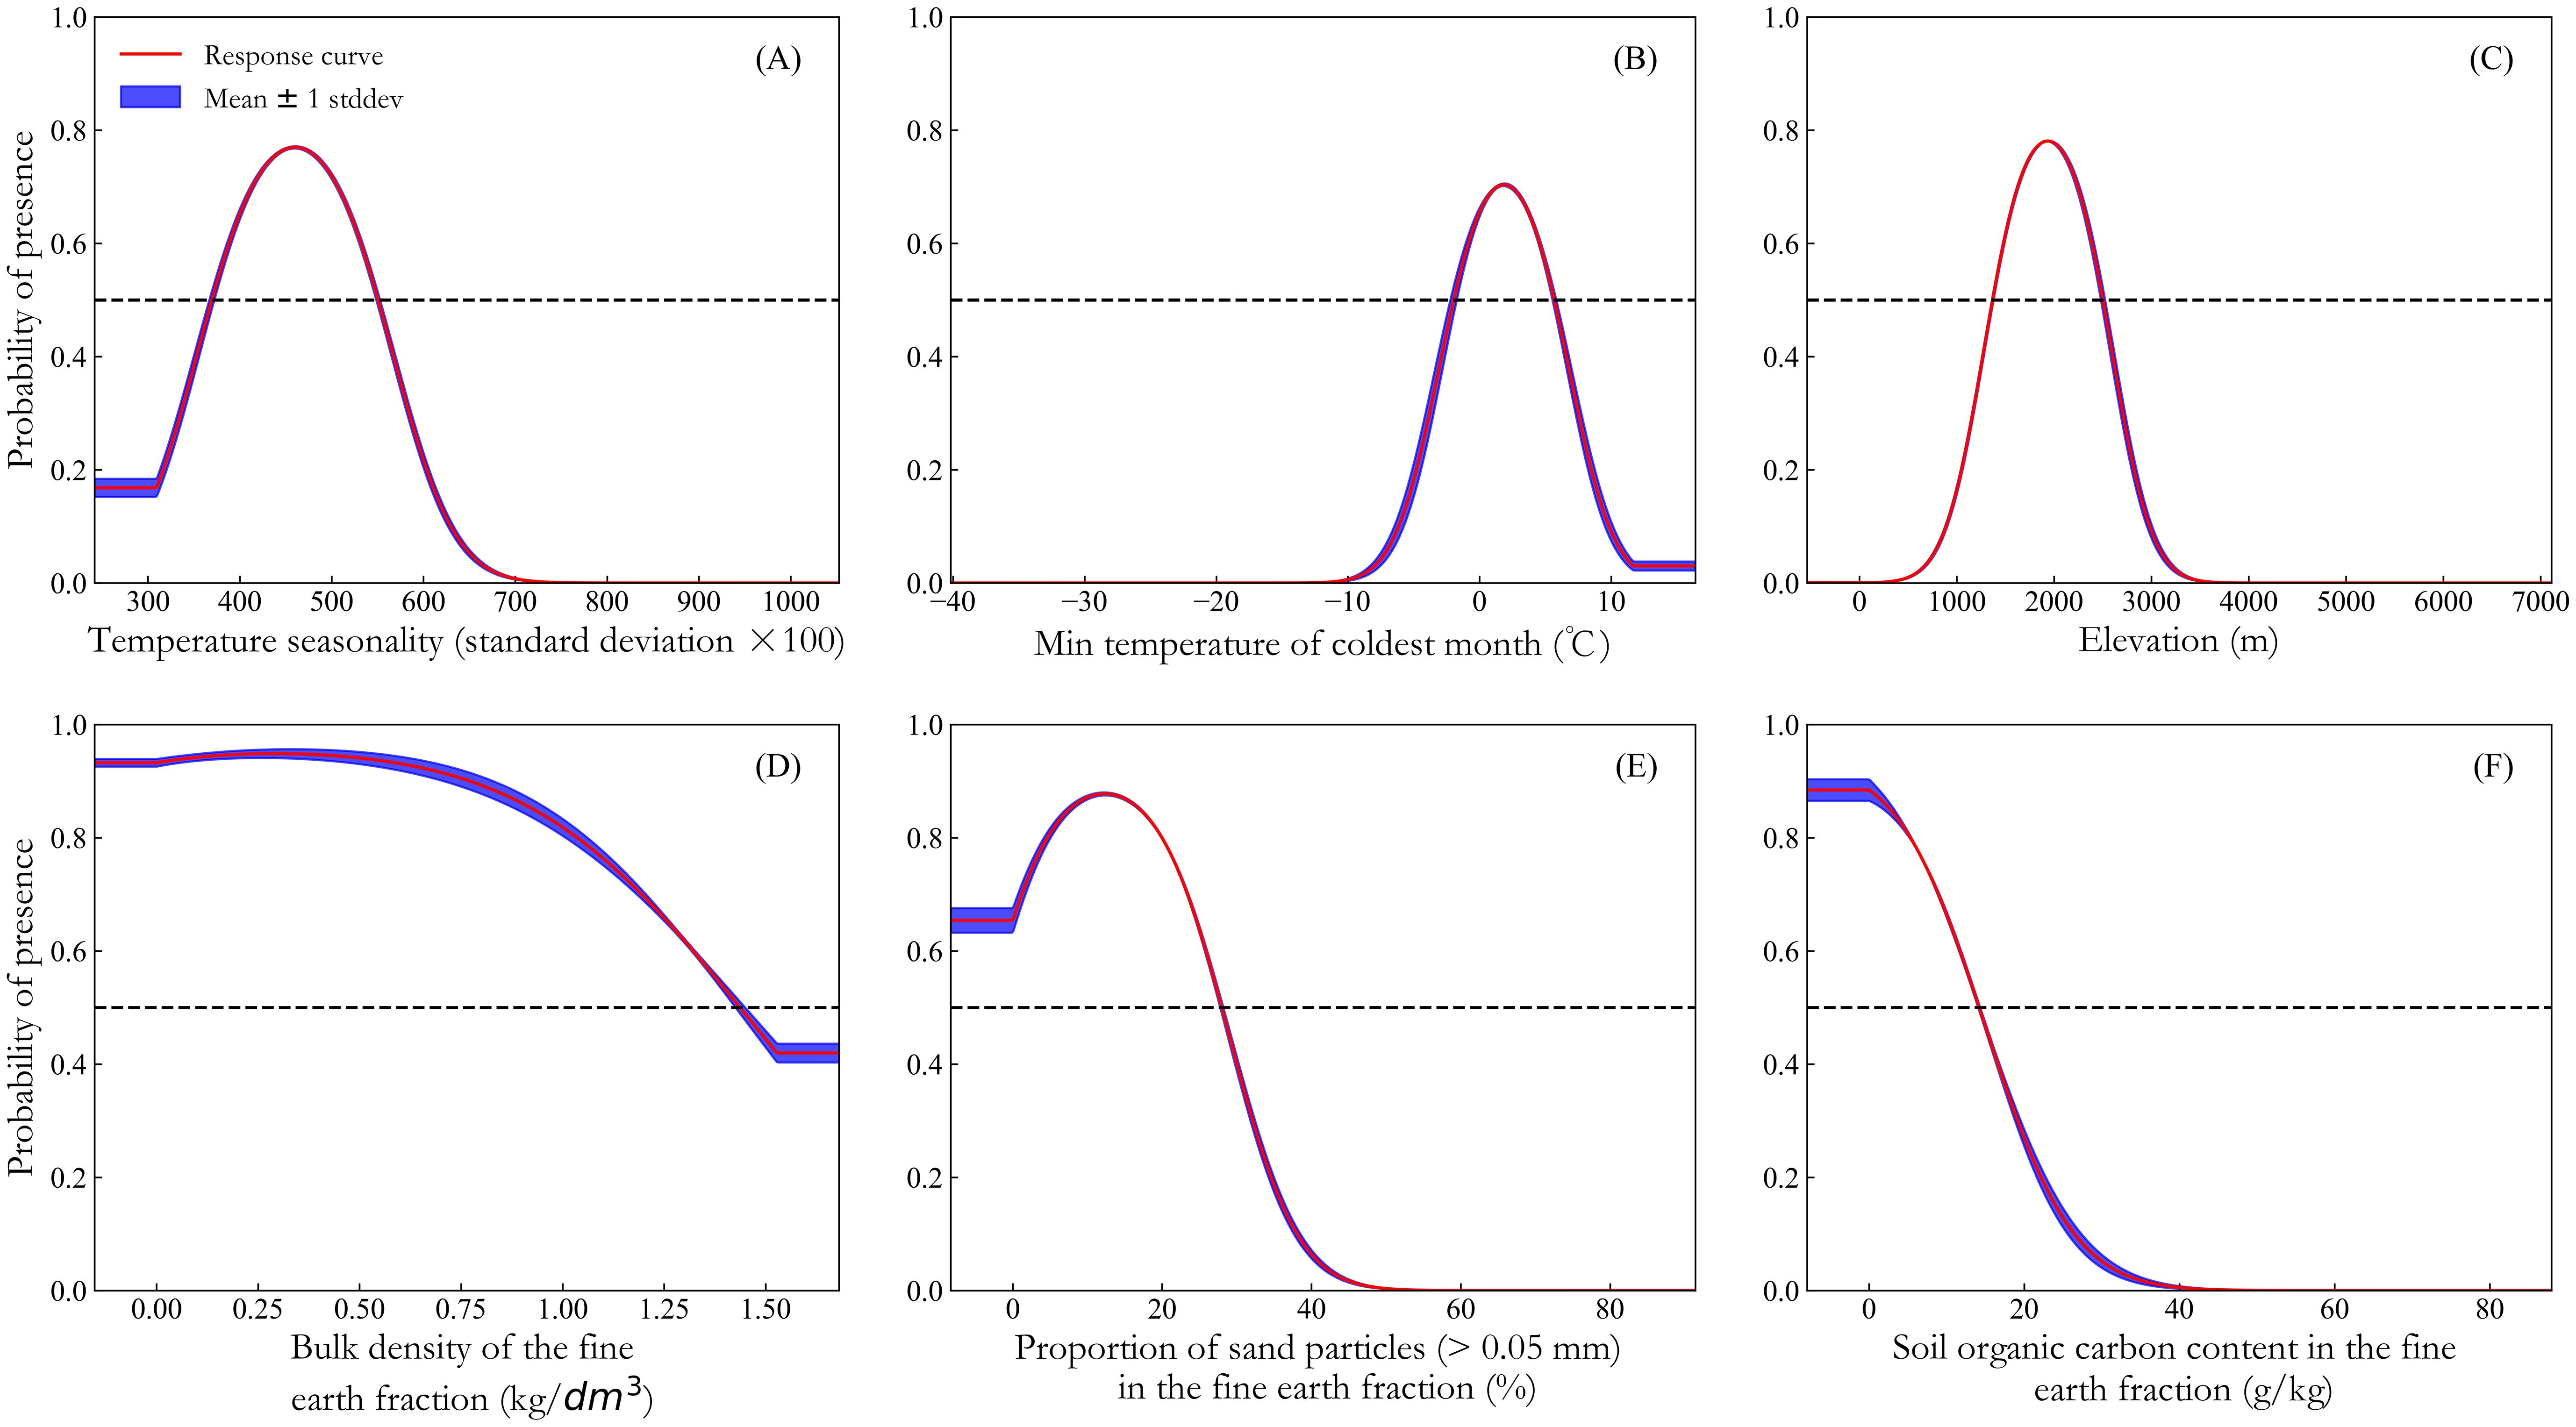
Figure 4. Response curves of dominant environmental variables: (A) temperature seasonality; (B) min temperature of coldest month; (C) elevation; (D) bulk density of the fine earth fraction; (E) proportion of sand particles (> 0.05 mm) in the fine earth fraction; (F) soil organic carbon content in the fine earth fraction.
3.3 Potential distribution and dynamic changes of K. evelyniana
3.3.1 Potential distribution of K. evelyniana under current climate conditions
The suitable areas for K. evelyniana, attributed to the Maxent model prediction under current climate conditions, are presented in Table 2 and Figure 5A. The total suitable area was 40.94×10⁴ km2, with a 9.13×10⁴ km2 high suitable area, 12.01×10⁴ km2 medium suitable area, and 19.80×10⁴ km2 low suitable area. In southwest China, the potential distribution was primarily concentrated in Yunnan Province, which accounted for 68% of the suitable area. Others were located in western and southwestern Guizhou Province, southwestern Sichuan Province, and southeastern Xizang Autonomous Region, whereas no suitable areas were found in the Chongqing Municipality.
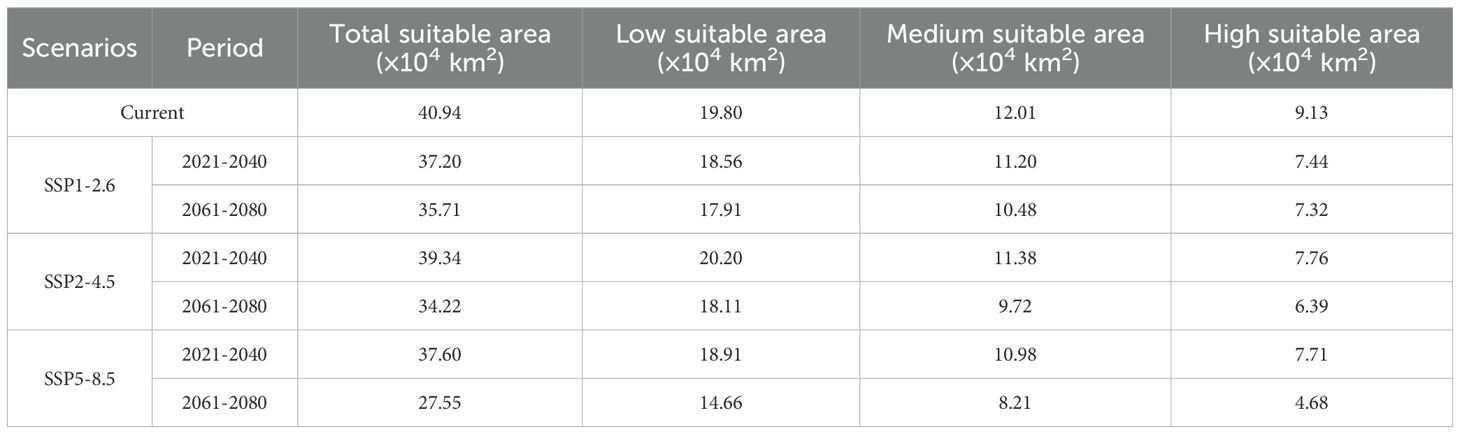
Table 2. Suitable area for K. evelyniana under current and different future climate scenarios.
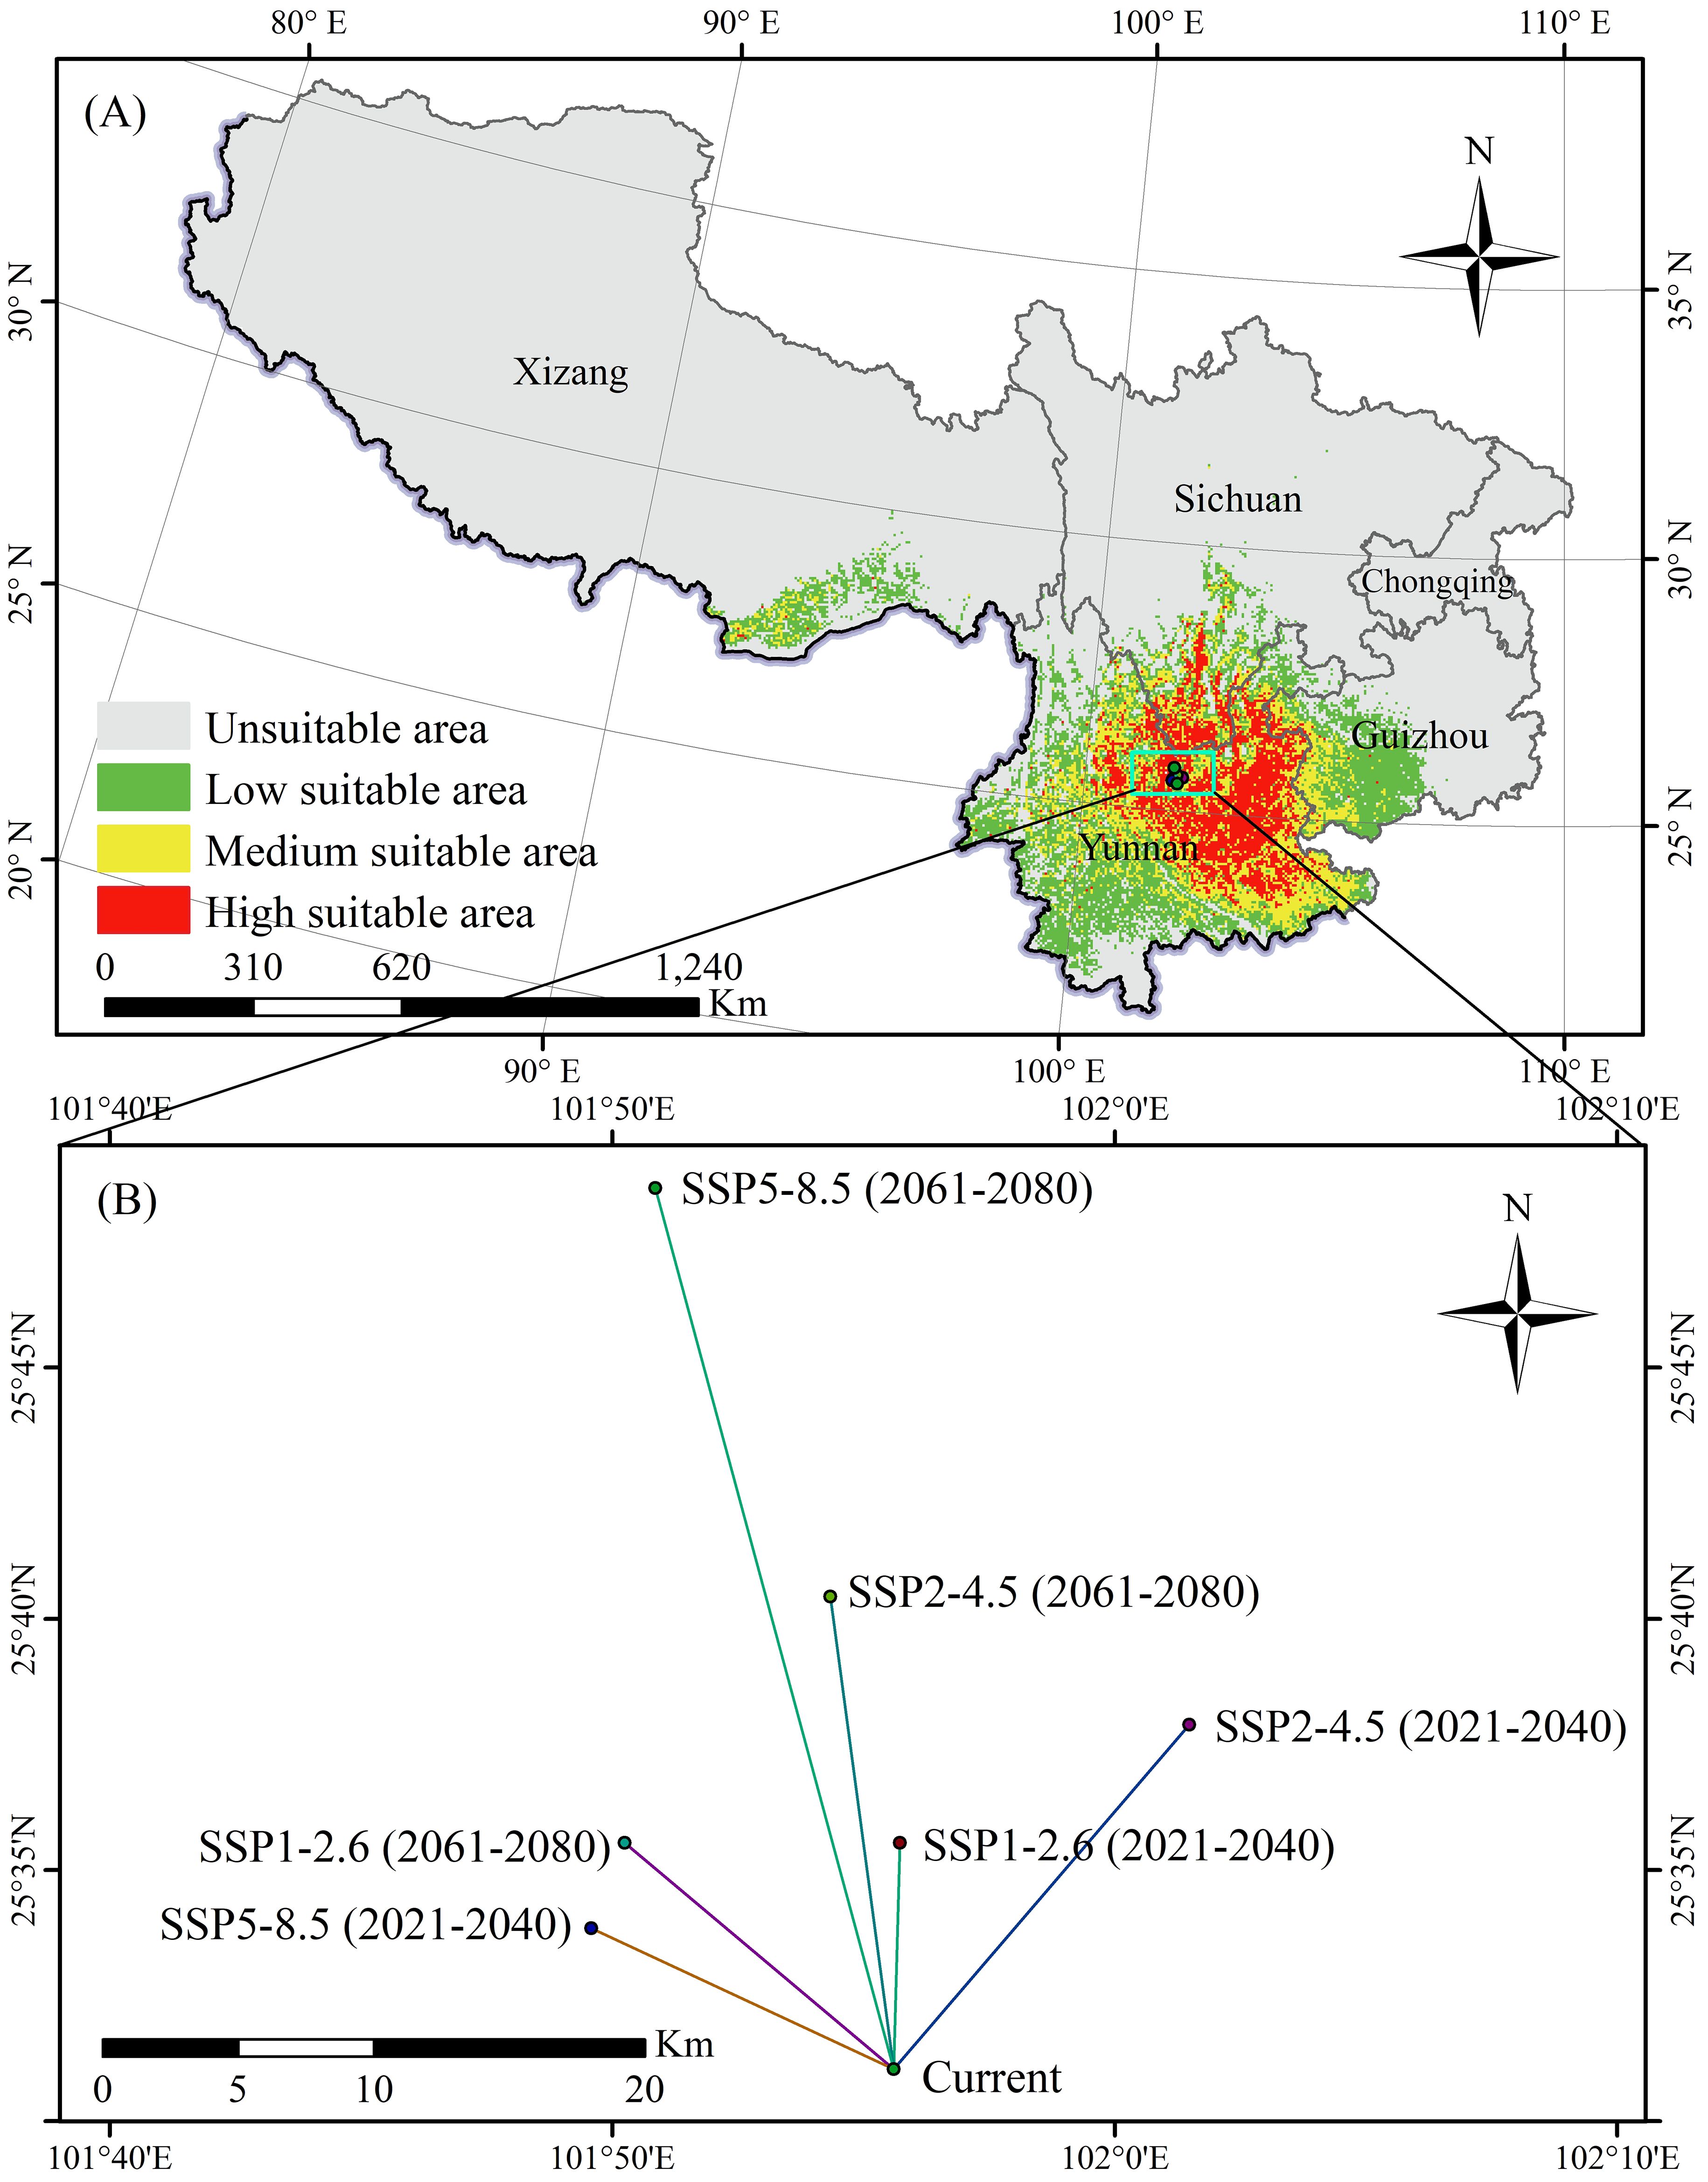
Figure 5. Potential distribution of K. evelyniana under current climate conditions (A) and centroid migration under future climate scenarios (B).
3.3.2 Potential distribution of K. evelyniana under future climate scenarios
The Maxent model was implemented to predict the suitable areas for K. evelyniana under various future climate scenarios, and the results are shown in Table 2 and Figure 6. Compared with the current climate conditions, the future scenarios indicated a decreasing trend in suitable areas for K. evelyniana. Under SSP5-8.5 scenarios, the dominant significant reduction was observed during the 2061–2080 period, with a 33% decline in the suitable area.
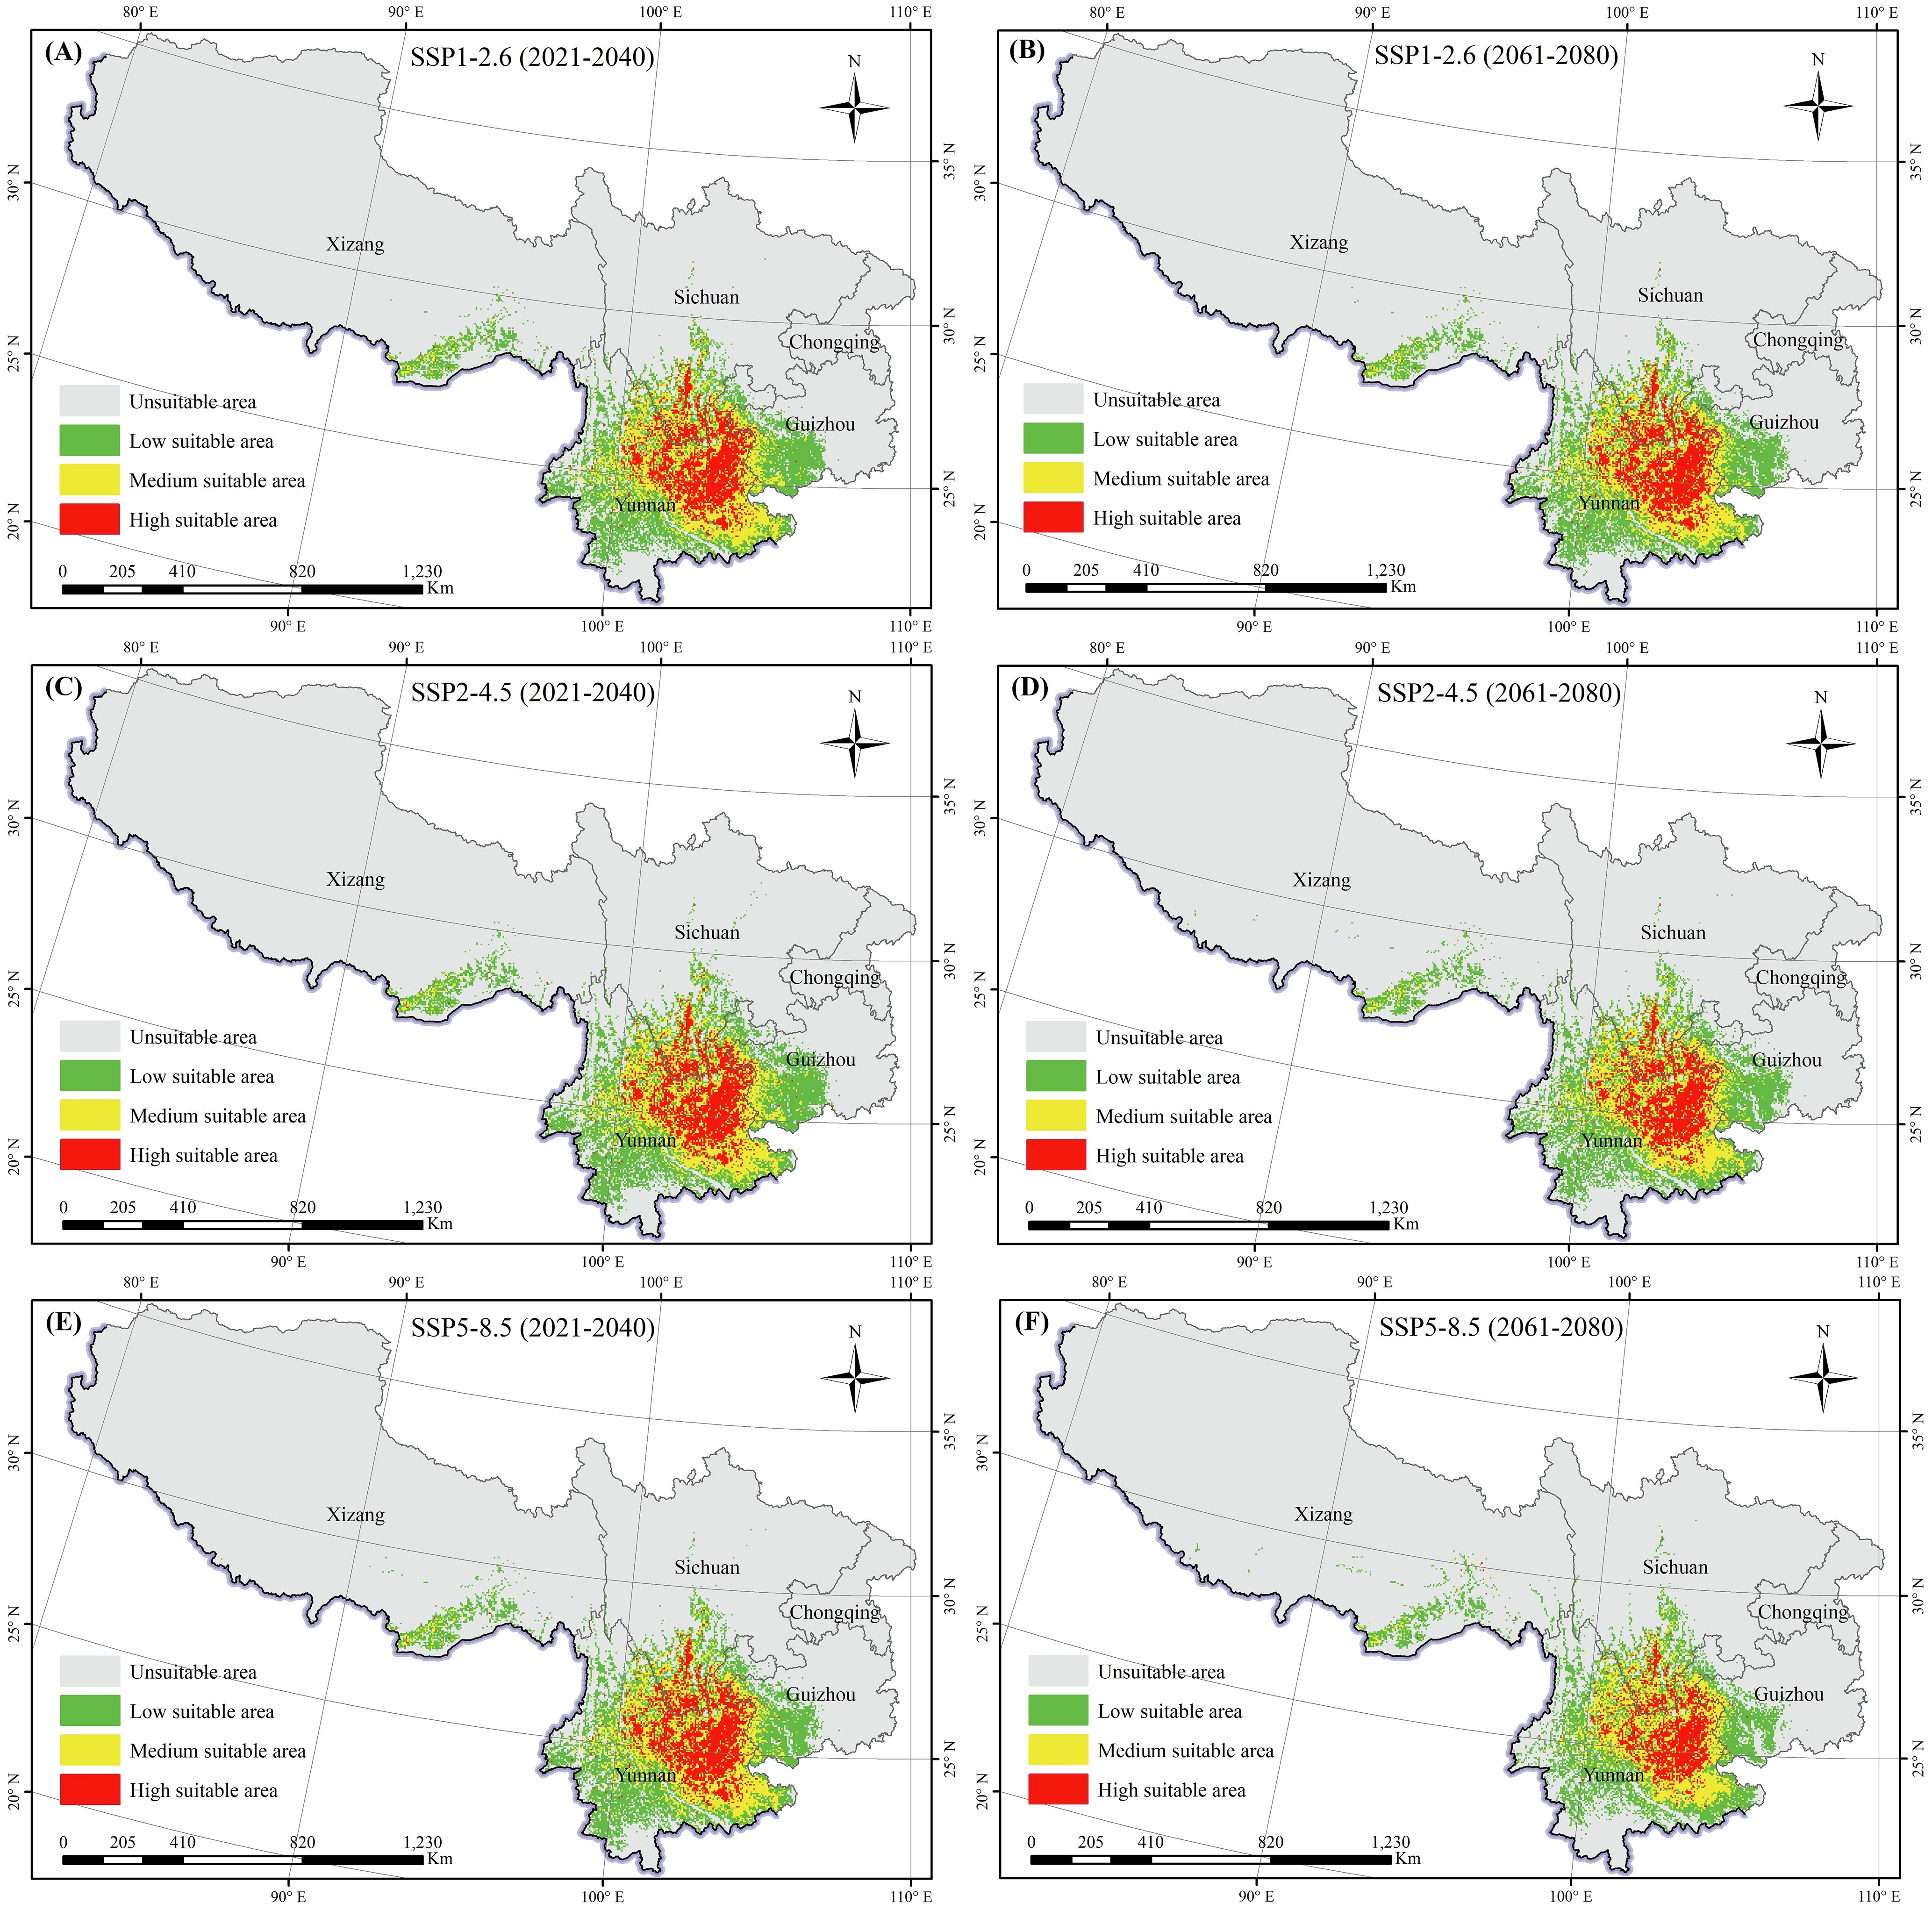
Figure 6. Potential distribution of K. evelyniana under future climate scenarios: (A, C, E) represent scenarios SSP1-2.6, SSP2-4.5, and SSP5-8.5 for the period 2021-2040; (B, D, F) represent scenarios SSP1-2.6, SSP2-4.5, and SSP5-8.5 for the period 2061-2080.
To describe the spatial variations in suitable areas for K. evelyniana due to climate change, the binary maps of the current climate scenarios were compared with those from the 2030s and 2070s under various future climate scenarios (Table 3; Figure 7). The results indicated that suitable areas for K. evelyniana expanded and contracted across different future periods, whereas the contraction areas consistently exceeded the expansion areas, reducing the total suitable area. During 2021–2040, the changes in the area under SSP5-8.5, SSP2-4.5, and SSP1-2.6 were -1.19×10⁴, -0.09×10⁴, and -1.44×10⁴ km², respectively, with the smallest decrease occurring under SSP2-4.5. By 2061-2080, the decline in suitable area intensified, with the reductions of 5.74×10⁴, 2.82×10⁴, and 2.24×10⁴ km2 under SSP5-8.5, SSP2-4.5, and SSP1-2.6, respectively.
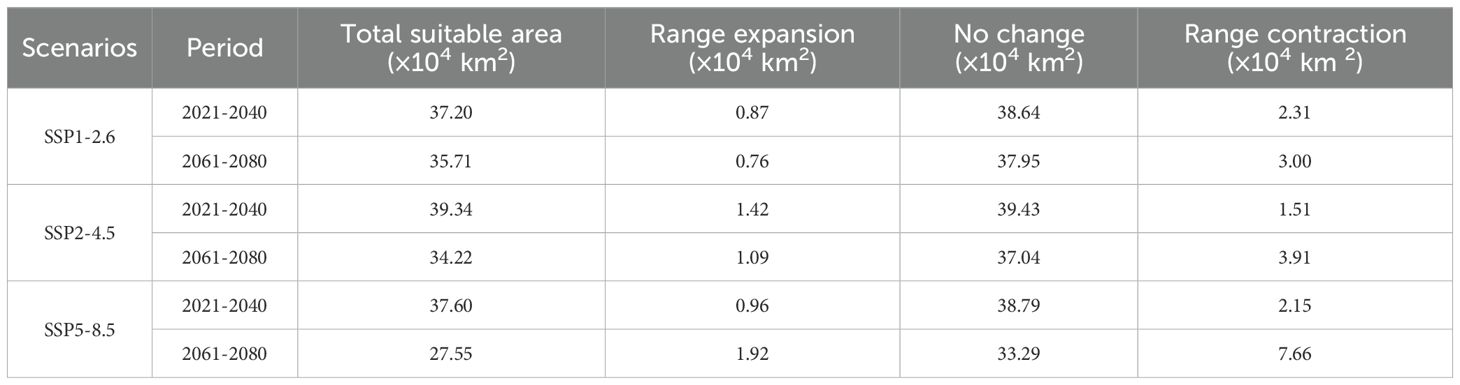
Table 3. Changes in suitable area for K. evelyniana under different future climate scenarios compared to current conditions.
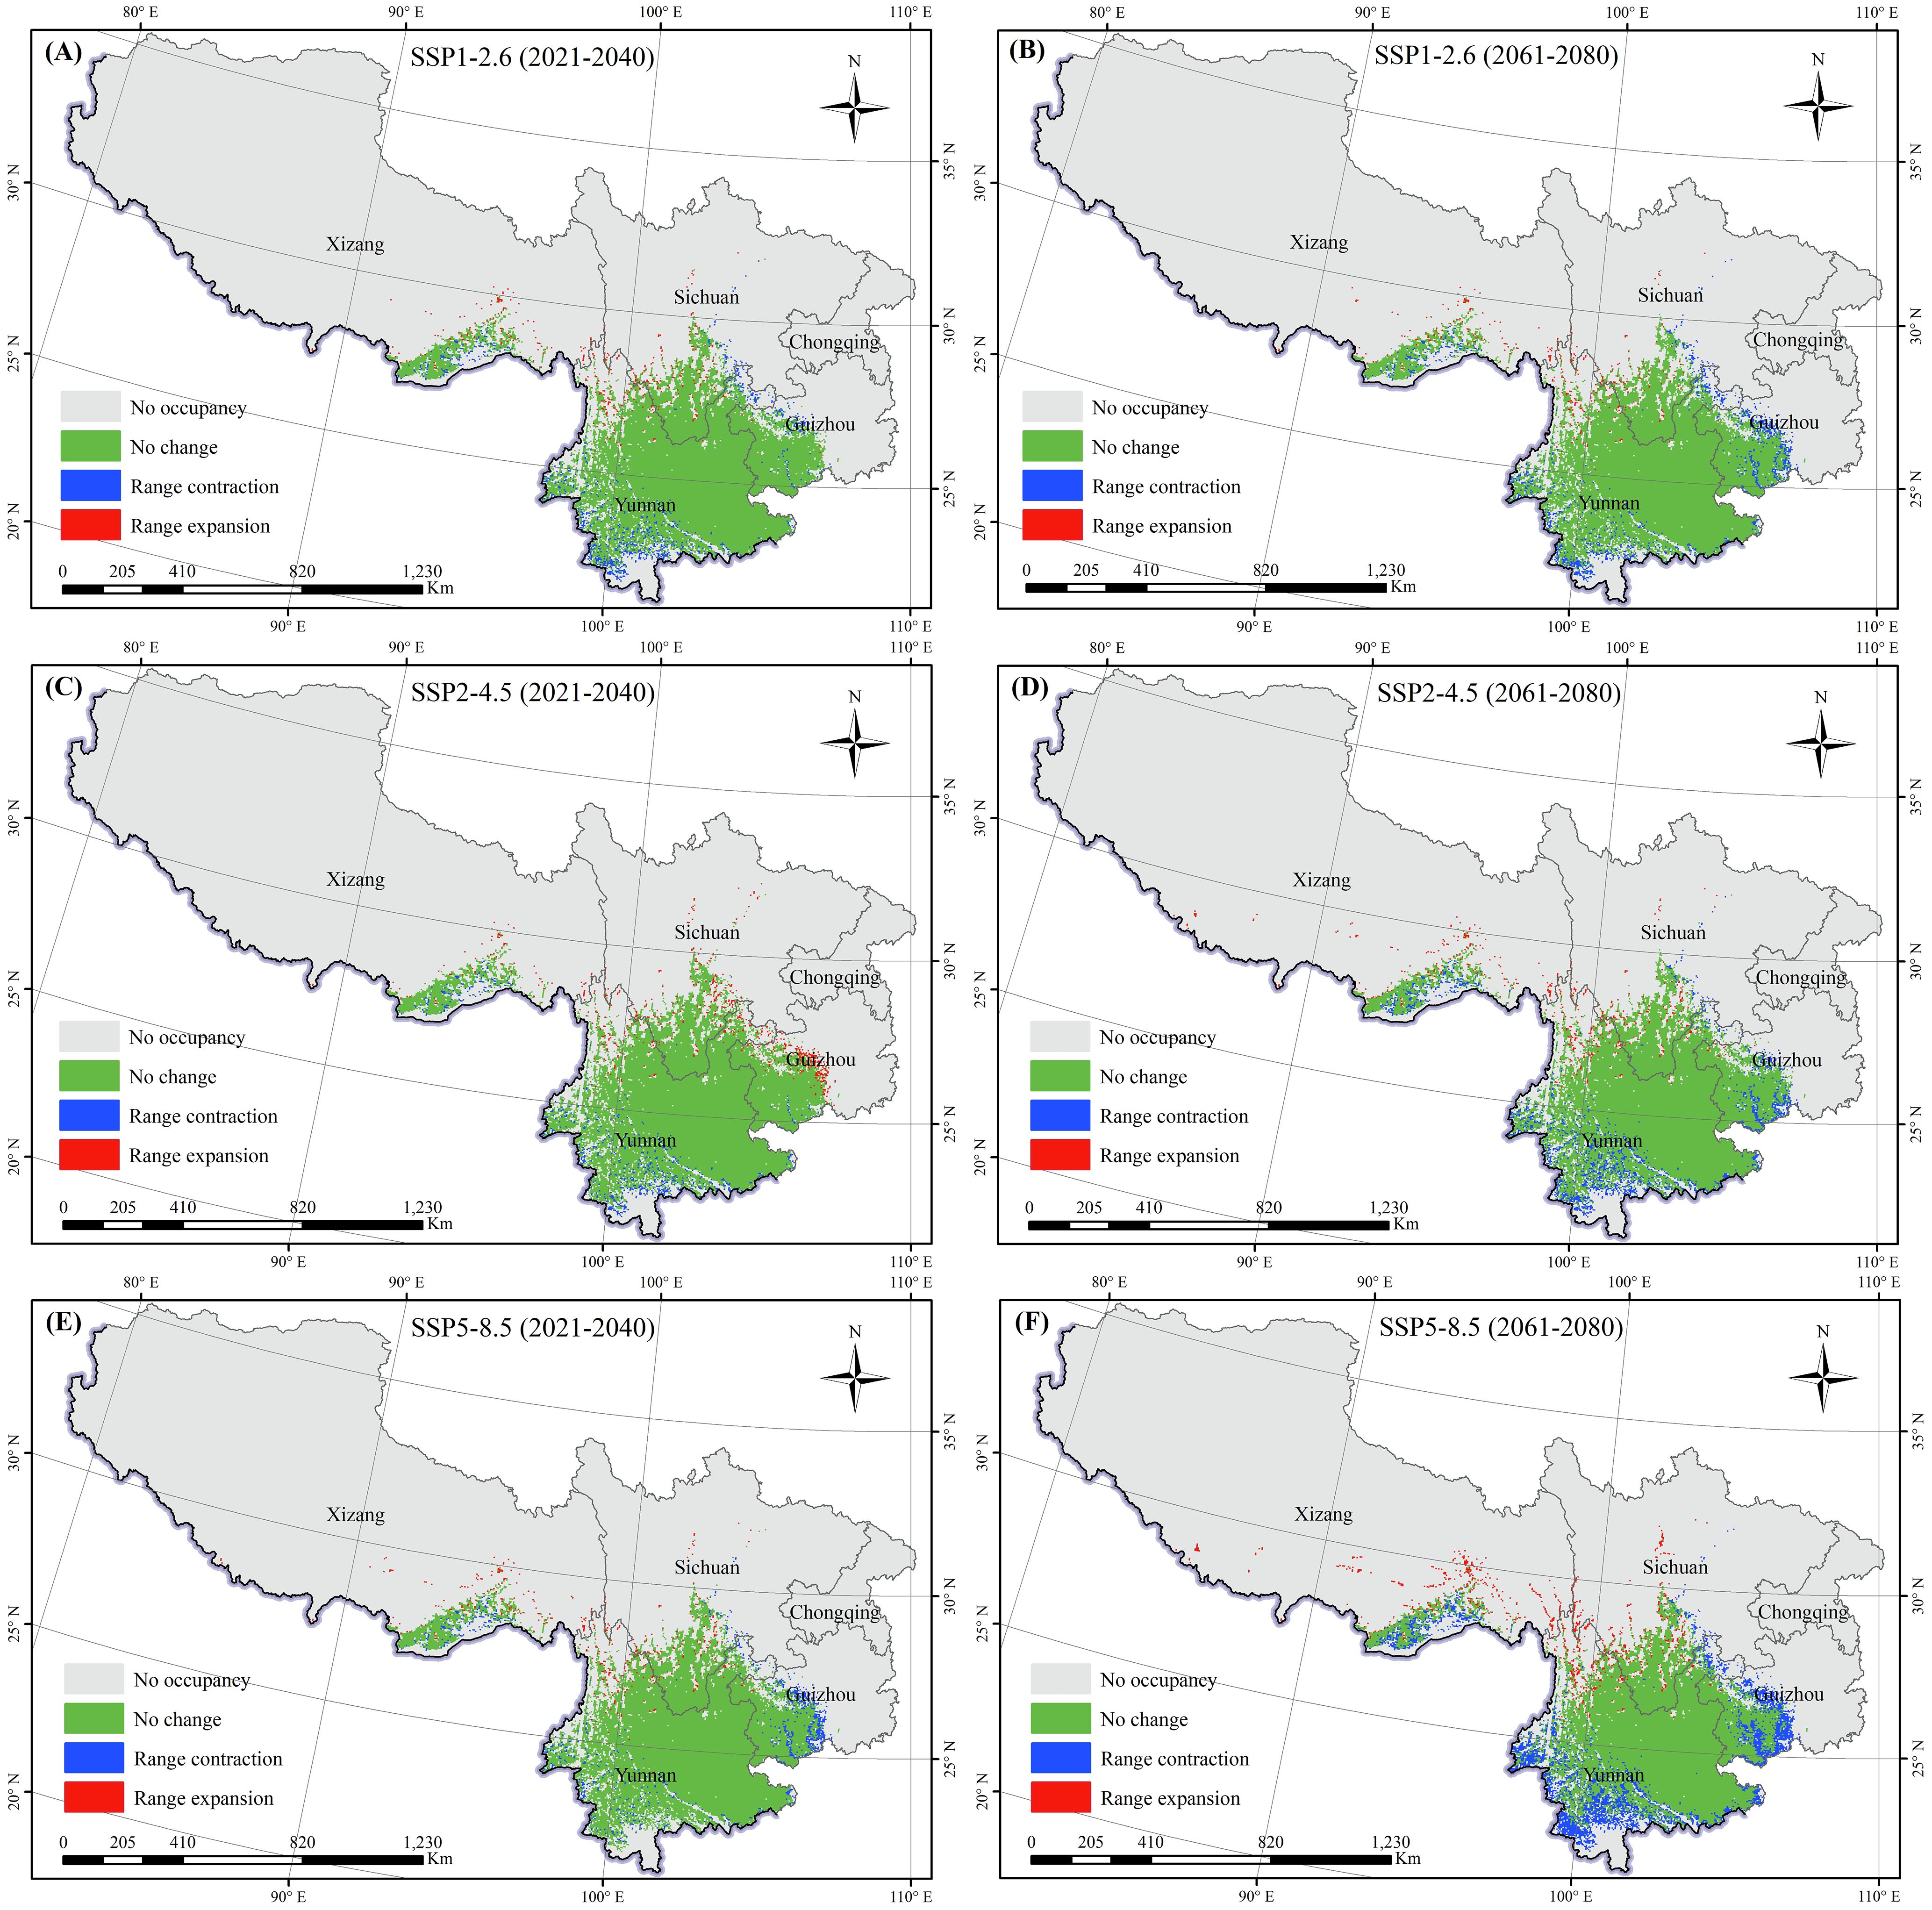
Figure 7. Changes in the potential distribution of K. evelyniana under future climate scenarios: (A, C, E) represent scenarios SSP1-2.6, SSP2-4.5, and SSP5-8.5 for the period 2021-2040; (B, D, F) represent scenarios SSP1-2.6, SSP2-4.5, and SSP5-8.5 for the period 2061-2080.
3.3.3 Centroid migration of K. evelyniana under future climate scenarios
The shape of the suitable area for K. evelyniana was irregular. To measure the changes in its distribution, the centroid was defined, and its migration was calculated and analyzed under different scenarios (Figure 5B). Under the current conditions, the centroid was located in Yuanmou County, Yunnan Province (101.927E, 25.517N). In the future climate scenarios, the centroid gradually migrated to the northeast, north, and northwest, with migration distances ranging from 8.33 to 33.40 km. Additionally, for the same climate scenario, the migration distance between 2061 and 2080 is greater than that between 2021 and 2040.
4 Discussion
4.1 Accuracy and reliability of the K. evelyniana Maxent model
This study utilized the Maxent model to predict the potential distribution of K. evelyniana in southwest China. After performing 10-fold cross-validation on the environmental factors and distribution data, the model achieved an AUC value of 0.946 (± 0.011), demonstrating its excellent predictive ability. This was consistent with AUC values between 0.9 and 0.98 reported in related studies on conifer species, affirming the accuracy and reliability of the results (Zhao et al., 2021b; Duan et al., 2022; Feng et al., 2023; He et al., 2023). According to the model predictions, K. evelyniana was primarily distributed in Yunnan Province, with additional suitable areas in western and southwestern Guizhou, southwestern Sichuan, and the southeastern Xizang Autonomous Region (Figure 5A). The predicted distribution of K. evelyniana was closely aligned with its description in the Flora of China (Editorial Committee of flora of China, Chinese Academy of Sciences, 2004). To prevent overfitting and improve the model’s migration capability, this study, following similar research (Li et al., 2020; Shi et al., 2024; Zhao et al., 2021b), adjusted the Maxent model parameters and analyzed the model complexity using the ENMeval package. The parameter with the lowest complexity was selected to run the Maxent model to ensure more accurate predictions. With the model parameters set to FC=LQ and RM=0.5, the Maxent model produced the smallest delta.AICc value of 0 (Figure 2A), indicating the lowest complexity. In summary, the reliability and accuracy of the K. evelyniana Maxent model were validated using effective methods, parameter optimization, and robust results.
4.2 Dominant environmental factors influencing the K. evelyniana distribution
Based on a comprehensive analysis of percent contribution, permutation importance, regularization training gain only with this variable and regularization training gain without this variable (Table 1), temperature was identified as the most crucial environmental variable affecting the potential distribution of K. evelyniana, with a cumulative contribution of 77.8%. Similar results have been demonstrated for other conifer species. For instance, Zhao et al. (2021b) suggested that temperature was the primary factor affecting the distribution of Cunninghamia lanceolata (Lamb.), contributing 64.24%, whereas Feng et al. (2023) identified Bio4 as a key factor for Pinus yunnanensis Franch. Zhang et al. (2023) also reported that two of the three most significant factors influencing the distribution of Keteleeria davidiana (C. E. Bertrand) Beissn were temperature-related. K. evelyniana exhibited the most sensitivity to min temperature of coldest month (Bio6), indicating that extremely low temperatures may be a critical limiting factor for its distribution. Low temperatures can cause frost damage, impair membrane function, and reduce photosynthesis, thereby significantly hindering plant growth (Ladwig et al., 2016). In this study, the temperature seasonality (Bio4) range of 370–550 was found to favor the expansion of K. evelyniana’s suitable areas, as temperature seasonality plays a vital role in plant growth, development, and flowering, with many species requiring a warm-cold-warm cycle to complete their annual life cycle (Khodorova and Boitel-Conti, 2013).
Soil plays a crucial role in regulating nutrients necessary for plant growth, making it essential for plant development (Dighton, 2014). In this study, Sand, Soc, and Bdod were found to significantly influence the potential distribution of K. evelyniana, with a cumulative contribution of 20.5%. Although elevation had a smaller contribution to the final model, its importance was highlighted in the regularization training gain without this variable (Table 1). Elevation can primarily affect species distribution patterns through its indirect effect on temperature and precipitation (Yin et al., 2023).
4.3 Potential distribution change and centroid migration of K. evelyniana under future climate scenarios
The low, medium, and high suitability areas for K. evelyniana exhibited the decreasing trends (Table 2; Figure 6). The most significant decline occurred under the SSP5-8.5 scenario during 2061–2080, with a 33% reduction in the suitable area. In the same scenario, the decrease in suitable areas was greater in 2061–2080 than in 2021–2040. Additionally, for both periods, the reduction was smaller in the low-emission scenario and larger in the high-emission scenario. Under the future conditions, the distribution of K. evelyniana could demonstrate not only a reduction in suitable areas but also significant shifts in spatial patterns, particularly at the edges of suitable regions (Figure 7). In high emission scenarios, marked by dramatic and irregular changes in temperature and precipitation, along with more frequent extreme events, the impact on K. evelyniana could be substantial, leading to increased habitat fragmentation (Fan et al., 2021; Zhang et al., 2021).
Under climate change scenarios, shifts in the distribution centroid of K. evelyniana’s suitable area can reflect its movement in both distance and direction. Compared to current climate conditions, the centroid was projected to move to higher latitudes in the north, northeast, and northwest under various greenhouse gas emission scenarios during 2021–2040 and 2061–2080, with the longest migration distance reaching 33.40 km (Figure 5B). This is consistent with previous studies indicating that a warming climate prompts plant migration to higher latitudes and altitudes (Chi et al., 2023; Shi et al., 2023; Zhou et al., 2023a). Such shifts in species distribution may be an adaptive response to global warming, because rising temperatures render the original habitats too warm, forcing them to move to cooler areas. This migration helps species maintain the temperature range and ecological niche essential for their survival (Chen et al., 2011; Dullinger et al., 2012).
4.4 Future conservation strategies and research perspectives for the K. evelyniana
Several strategies should be implemented to alleviate the impact of climate change on the K. evelyniana populations. For areas lost due to climate change, it is necessary to re-evaluate conservation strategies and adopt measures such as ex-situ conservation and germplasm preservation (Wang et al., 2024). Maintaining suitable areas is also crucial, as these regions serve as refuges and shelters for future climate change. Prioritizing the conservation and management of K. evelyniana habitats is essential. This involves, first, protecting existing habitats to provide a stable base for species survival, second, restoring and enhancing degraded habitats to improve their resilience to climate change, and third, developing adaptive management strategies (Guignabert et al., 2024), such as adjusting conservation objectives and methods to address new challenges posed by climate change. For newly suitable areas, it is crucial to establish ecological corridors to facilitate species migration and gene flow and to consider planned assisted translocations (Ding, 2023; Twardek et al., 2023).
Studies have shown that species misidentification (Phillips et al., 2009), sampling bias (Leitão et al., 2011; Beck et al., 2014), temporal or spatial bias (Graham et al., 2008; Meyer et al., 2015) and sampling strategy (Hirzel and Guisan, 2002) in species occurrence data can lead to uncertainty in species distribution models. In addition, the quality of environmental data (Graham et al., 2008), model assumptions (Chen et al., 2019) and biological interactions (Wisz et al., 2013) also contribute to uncertainty in these models. Future research should focus on improving the quality of species distribution data, including enhancing species identification methods, optimizing sampling design, and filling data gaps. At the same time, the accuracy of environmental data should be improved, and their uncertainty taken into account. In terms of model development, it is recommended to adopt multi-model comparisons and dynamic simulation approaches, incorporating biological interactions to improve ecological rationality.
Örücü et al. (2023) found that land-use change affects species’ migration speed and distribution range by altering habitat structure and availability, with more pronounced impacts in tropical regions. Population density was positively correlated with the distribution probability of Pinus massoniana, indicating that Pinus massoniana was more widely distributed in densely populated areas (He et al., 2023). The construction of large-scale ecological engineering projects may indirectly affect species distribution ranges by changing local climate conditions (Wang and Guan, 2023). Only topographic, soil, and bioclimatic factors were considered, excluding important factors such as human disturbance, land use and cover changes. Future research should incorporate more environmental variables and continue to optimize the model to enhance its predictive accuracy.
5 Conclusion
Based on 33 environmental variables and 221 distribution points, this study utilized the Maxent model to simulate suitable areas for K. evelyniana in southwest China under current and future climate scenarios, while analyzing the dominant environmental factors that could affect its distribution. The total suitable area for K. evelyniana was 40.94×10⁴ km2, with 68% concentrated in Yunnan Province. Other suitable areas were distributed in western and southwestern Guizhou, southwestern Sichuan, and southeastern Xizang Autonomous Region, with no suitable areas in the Chongqing Municipality. Under the future scenarios, the suitable area is projected to gradually decrease, with a 33% reduction during 2061–2080 under the SSP5-8.5. Currently, the centroid was located in Yuanmou County, Yunnan Province (101.927E, 25.517N), but it is expected to shift northeast, north, and northwest, with migration distances ranging from 8.33 to 33.40 km under different climate scenarios. Temperature (Bio4 and Bio6), soil, and elevation jointly influenced species distribution, with temperature having the most significant effect (77.8%). Our findings provide a theoretical foundation for conservation, ecological restoration, and sustainable use of K. evelyniana.
Data availability statement
Publicly available datasets were analyzed in this study. This data can be found here: Global Biodiversity Information Facility (GBIF, https://www.gbif.org/), the Chinese Virtual Herbarium (CVH, https://www.cvh.ac.cn/), and the literature (Tang et al., 2017; Du, 2022).
Author contributions
YF: Conceptualization, Writing – original draft, Writing – review & editing, Methodology, Software, Visualization. GD: Funding acquisition, Software, Writing – review & editing. HL: Methodology, Writing – review & editing. YC: Methodology, Writing – review & editing. RB: Visualization, Writing – review & editing. MW: Methodology, Software, Writing – review & editing. CL: Data curation, Software, Writing – review & editing. YQ: Methodology, Supervision, Writing – original draft, Writing – review & editing.
Funding
The author(s) declare that financial support was received for the research and/or publication of this article. This study was supported by the National Natural Science Foundation of China (No.32260105), Yunnan Fundamental Research Projects (grant NO. 202201BC070001) and Candidates of the Young and Middle-Aged Academic Leaders of Yunnan Province of China (No. 202205 AC160041).
Acknowledgments
We appreciate the valuable comments and constructive suggestions from two reviewers and the editor.
Conflict of interest
The authors declare that the research was conducted in the absence of any commercial or financial relationships that could be construed as a potential conflict of interest.
Generative AI statement
The author(s) declare that no Generative AI was used in the creation of this manuscript.
Publisher’s note
All claims expressed in this article are solely those of the authors and do not necessarily represent those of their affiliated organizations, or those of the publisher, the editors and the reviewers. Any product that may be evaluated in this article, or claim that may be made by its manufacturer, is not guaranteed or endorsed by the publisher.
Supplementary material
The Supplementary Material for this article can be found online at: https://www.frontiersin.org/articles/10.3389/fpls.2025.1561031/full#supplementary-material
References
Beck, J., Böller, M., Erhardt, A., Schwanghart, W. (2014). Spatial bias in the GBIF database and its effect on modeling species’ geographic distributions. Ecol. Inf. 19, 10–15. doi: 10.1016/j.ecoinf.2013.11.002
Bellard, C., Bertelsmeier, C., Leadley, P., Thuiller, W., Courchamp, F. (2012). Impacts of climate change on the future of biodiversity. Ecol. Lett. 15, 365–377. doi: 10.1111/j.1461-0248.2011.01736.x
Boussouf, S., Fernández, T., Hart, A. B. (2023). Landslide susceptibility mapping using maximum entropy (MaxEnt) and geographically weighted logistic regression (GWLR) models in the Río Aguas catchment (Almería, SE Spain). Nat. Hazards. 117, 207–235. doi: 10.1007/s11069-023-05857-7
Brown, J. L., Bennett, J. R., French, C. M. (2017). SDMtoolbox 2.0: the next generation Python-based GIS toolkit for landscape genetic, biogeographic and species distribution model analyses. PeerJ 5, e4095. doi: 10.7717/peerj.4095
Calvin, K., Dasgupta, D., Krinner, G., Mukherji, A., Thorne, P. W., Trisos, C., et al. (2023). IPCC 2023: Climate Change 2023: Synthesis Report. Contribution of Working Groups I, II and III to the Sixth Assessment Report of the Intergovernmental Panel on Climate Change (IPCC, Geneva, Switzerland: Intergovernmental Panel on Climate Change (IPCC). Available online at: https://www.ipcc.ch/report/ar6/syr/ (Accessed June 26, 2024).
Chen, X., Dimitrov, N. B., Meyers, L. A. (2019). Uncertainty analysis of species distribution models. PloS One 14, e0214190. doi: 10.1371/journal.pone.0214190
Chen, I.-C., Hill, J. K., Ohlemüller, R., Roy, D. B., Thomas, C. D. (2011). Rapid range shifts of species associated with high levels of climate warming. Science 333, 1024–1026. doi: 10.1126/science.1206432
Chi, Y., Wang, G. G., Zhu, M., Jin, P., Hu, Y., Shu, P., et al. (2023). Potentially suitable habitat prediction of Pinus massoniana Lamb. in China under climate change using Maxent model. Front. For. Glob. Change 6. doi: 10.3389/ffgc.2023.1144401
Deng, Z., Xia, X., Zhang, M., Chen, X., Ding, X., Zhang, B., et al. (2024). Predicting the spatial distribution of the mangshan pit viper (Protobothrops mangshanensis) under climate change scenarios using MaxEnt modeling. Forests 15, 723. doi: 10.3390/f15040723
Dieleman, C. M., Branfireun, B. A., McLaughlin, J. W., Lindo, Z. (2015). Climate change drives a shift in peatland ecosystem plant community: Implications for ecosystem function and stability. Global Change Biol. 21, 388–395. doi: 10.1111/gcb.12643
Dighton, J. (2014). “Introduction: Soils and their promotion of plant growth,” in Interactions in Soil: Promoting Plant Growth. Eds. Dighton, J., Krumins, J. A. (Springer Netherlands, Dordrecht), 1–26. doi: 10.1007/978-94-017-8890-8_1
Ding, G. (2023). Protecting and constructing ecological corridors for biodiversity conservation: A framework that integrates landscape similarity assessment. Appl. Geogr. 160, 103098. doi: 10.1016/j.apgeog.2023.103098
Du, M. (2022). Forest types, structure and regenerationdynamics of Keteleeria evelyniana in China (Kunming Yunnan: Yunnan University).
Duan, X., Li, J., Wu, S. (2022). MaxEnt modeling to estimate the impact of climate factors on distribution of Pinus densiflora. Forests 13, 402. doi: 10.3390/f13030402
Dullinger, S., Gattringer, A., Thuiller, W., Moser, D., Zimmermann, N. E., Guisan, A., et al. (2012). Extinction debt of high-mountain plants under twenty-first-century climate change. Nat. Clim Change 2, 619–622. doi: 10.1038/nclimate1514
Editorial Committee of flora of China, Chinese Academy of Sciences (2004). Flora of China (Beijing: Science Press).
Elith, J., Graham, C. H., Anderson, R. P., Dudík, M., Ferrier, S., Guisan, A., et al. (2006). Novel methods improve prediction of species’ distributions from occurrence data. Ecography 29, 129–151. doi: 10.1111/j.2006.0906-7590.04596.x
Elith, J., Leathwick, J. R. (2009). Species distribution models: Ecological explanation and prediction across space and time. Annu. Rev. Ecol. Evol. Syst. 40, 677–697. doi: 10.1146/annurev.ecolsys.110308.120159
Elith, J., Phillips, S. J., Hastie, T., Dudík, M., Chee, Y. E., Yates, C. J. (2011). A statistical explanation of MaxEnt for ecologists: Statistical explanation of MaxEnt. Diversity Distrib. 17, 43–57. doi: 10.1111/j.1472-4642.2010.00725.x
Fan, X., Miao, C., Duan, Q., Shen, C., Wu, Y. (2021). Future climate change hotspots under different 21st century warming scenarios. Earth’s. Future 9, e2021EF002027. doi: 10.1029/2021EF002027
Feeley, K. J., Bravo-Avila, C., Fadrique, B., Perez, T. M., Zuleta, D. (2020). Climate-driven changes in the composition of New World plant communities. Nat. Clim. Change 10, 965–970. doi: 10.1038/s41558-020-0873-2
Feng, J., Wang, B., Xian, M., Zhou, S., Huang, C., Cui, X. (2023). Prediction of future potential distributions of Pinus yunnanensis varieties under climate change. Front. For. Glob. Change 6. doi: 10.3389/ffgc.2023.1308416
Fick, S. E., Hijmans, R. J. (2017). WorldClim 2: new 1-km spatial resolution climate surfaces for global land areas. Int. J. Climatol. 37, 4302–4315. doi: 10.1002/joc.5086
Fu, Z., Zhang, Y., Tan, N., Chu, H., Ji, C. (2008). Chemical constituents of Keteleeria evelyniana. Natural Product. Res. Dev., 257–261 + 277. doi: 10.16333/j.1001-6880.2008.02.022
Gao, X., Liu, J., Huang, Z. (2022). The impact of climate change on the distribution of rare and endangered tree Firmiana kwangsiensis using the Maxent modeling. Ecol. Evol. 12, e9165. doi: 10.1002/ece3.9165
Ge, Z.-W., Smith, M. E., Zhang, Q.-Y., Yang, Z. L. (2012). Two species of the Asian endemic genus Keteleeria form ectomycorrhizas with diverse fungal symbionts in southwestern China. Mycorrhiza 22, 403–408. doi: 10.1007/s00572-011-0411-1
Graham, C. H., Elith, J., Hijmans, R. J., Guisan, A., Townsend Peterson, A., Loiselle, B. A., et al. (2008). The influence of spatial errors in species occurrence data used in distribution models. J. Appl. Ecol. 45, 239–247. doi: 10.1111/j.1365-2664.2007.01408.x
Guignabert, A., Jonard, M., Messier, C., Andr´e, F., de Coligny, F., Doyon, F., et al. (2024). Adaptive forest management improves stand-level resilience of temperate forests under multiple stressors. Sci. Total. Environ. 948, 174168. doi: 10.1016/j.scitotenv.2024.174168
He, W. J., Fu, Z. H., Han, H. J., Yan, H., Zeng, G. Z., Ji, C. J., et al. (2011). Benzoic acid allopyranosides and lignan glycosides from the twigs of Keteleeria evelyniana. Z. Naturforschung. B. 66, 733–739. doi: 10.1515/znb-2011-0715
He, Y., Ma, J., Chen, G. (2023). Potential geographical distribution and its multi-factor analysis of Pinus massoniana in China based on the maxent model. Ecol. Indic. 154, 110790. doi: 10.1016/j.ecolind.2023.110790
Hirzel, A., Guisan, A. (2002). Which is the optimal sampling strategy for habitat suitability modelling. Ecol. Model. 157, 331–341. doi: 10.1016/S0304-3800(02)00203-X
IPCC (2023). “Climate Change 2023: Synthesis Report. Contribution of Working Groups I, II and III to the Sixth Assessment Report of the Intergovernmental Panel on Climate Change,” eds. Core Writing Team, H. Lee, and J. Romero (Geneva, Switzerland: IPCC).
Kass, J. M., Muscarella, R., Galante, P. J., Bohl, C. L., Pinilla-Buitrago, G. E., Boria, R. A., et al. (2021). ENMeval 2.0: Redesigned for customizable and reproducible modeling of species’ niches and distributions. Methods Ecol. Evol. 12, 1602–1608. doi: 10.1111/2041-210X.13628
Khodorova, N., Boitel-Conti, M. (2013). The role of temperature in the growth and flowering of geophytes. Plants 2, 699–711. doi: 10.3390/plants2040699
Kuprin, A., Shevchenko, N., Baklanova, V. (2024). Modelling distribution of an endangered longhorn beetle, Callipogon relictus (Coleoptera: Cerambycidae), in northeast asia. Forests 15, 598. doi: 10.3390/f15040598
Ladwig, L. M., Ratajczak, Z. R., Ocheltree, T. W., Hafich, K. A., Churchill, A. C., Frey, S. J. K., et al. (2016). Beyond arctic and alpine: the influence of winter climate on temperate ecosystems. Ecology 97, 372–382. doi: 10.1890/15-0153.1
Lawlor, J. A., Comte, L., Grenouillet, G., Lenoir, J., Baecher, J. A., Bandara, R. M. W. J., et al. (2024). Mechanisms, detection and impacts of species redistributions under climate change. Nat. Rev. Earth Environ. 5, 351–368. doi: 10.1038/s43017-024-00527-z
Leitão, P. J., Moreira, F., Osborne, P. E. (2011). Effects of geographical data sampling bias on habitat models of species distributions: A case study with steppe birds in southern Portugal. Int. J. Geographical. Inf. Sci. 25, 439–454. doi: 10.1080/13658816.2010.531020
Li, J., Fan, G., He, Y. (2020). Predicting the current and future distribution of three Coptis herbs in China under climate change conditions, using the MaxEnt model and chemical analysis. Sci. Total. Environ. 698, 134141. doi: 10.1016/j.scitotenv.2019.134141
Li, X., Zhao, A., Dang, C., Peng, M. (2013). A study on the structure and regeneration of Keteleeria evelyniana mixed forest in Xishan,Kunming. J. Yunnan. Univ.: Natural Sci. Edition. 35, 549–557.
Low, B. W., Zeng, Y., Tan, H. H., Yeo, D. C. J. (2021). Predictor complexity and feature selection affect Maxent model transferability: Evidence from global freshwater invasive species. Diversity Distrib. 27, 497–511. doi: 10.1111/ddi.13211
Meyer, C., Weigelt, P., Kreft, H. (2015). Multidimensional biases, gaps and uncertainties in global plant occurrence information. 19(8), 992–1006. doi: 10.7287/peerj.preprints.1326v2
Miller, J. (2010). Species distribution modeling. Geogr. Compass. 4, 490–509. doi: 10.1111/j.1749-8198.2010.00351.x
Örücü, Ö. K., Azadi, H., Arslan, E. S., Kamer Aksoy, Ö., Choobchian, S., Nooghabi, S. N., et al. (2023). Predicting the distribution of European Hop Hornbeam: application of MaxEnt algorithm and climatic suitability models. Eur. J. For. Res. 142, 579–591. doi: 10.1007/s10342-023-01543-2
Paz-Kagan, T., Chang, J. G., Shoshany, M., Sternberg, M., Karnieli, A. (2021). Assessment of plant species distribution and diversity along a climatic gradient from Mediterranean woodlands to semi-arid shrublands. GISci. Remote Sens. 58, 929–953. doi: 10.1080/15481603.2021.1953770
Pearson, R. G., Raxworthy, C. J., Nakamura, M., Peterson, A. T. (2007). Predicting species distributions from small numbers of occurrence records: a test case using cryptic geckos in Madagascar. J. Biogeogr. 34, 102–117. doi: 10.1111/j.1365-2699.2006.01594.x
Phillips, S. J., Dudík, M., Elith, J., Graham, C. H., Lehmann, A., Leathwick, J., et al. (2009). Sample selection bias and presence-only distribution models: Implications for background and pseudo-absence data. Ecol. Appl. 19, 181–197. doi: 10.1890/07-2153.1
Phillips, S. J., Dudık, M. (2008). Modeling of species distributions with Maxent: new extensions and a comprehensive evaluation. Ecography 31, 161–175. doi: 10.1111/j.0906-7590.2008.5203.x
Poggio, L., De Sousa, L. M., Batjes, N. H., Heuvelink, G. B. M., Kempen, B., Ribeiro, E., et al. (2021). SoilGrids 2.0: producing soil information for the globe with quantified spatial uncertainty. SOIL 7, 217–240. doi: 10.5194/soil-7-217-2021
Qasimi, A. B., Isazade, V., Berndtsson, R. (2024). Flood susceptibility prediction using MaxEnt and frequency ratio modeling for Kokcha River in Afghanistan. Nat. Hazards. 120, 1367–1394. doi: 10.1007/s11069-023-06232-2
Ruiz-Labourdette, D., Nogués-Bravo, D., Ollero, H. S., Schmitz, M. F., Pineda, F. D. (2012). Forest composition in Mediterranean mountains is projected to shift along the entire elevational gradient under climate change. J. Biogeogr. 39, 162–176. doi: 10.1111/j.1365-2699.2011.02592.x
Shi, X., Wang, J., Zhang, L., Chen, S., Zhao, A., Ning, X., et al. (2023). Prediction of the potentially suitable areas of Litsea cubeba in China based on future climate change using the optimized MaxEnt model. Ecol. Indic. 148, 110093. doi: 10.1016/j.ecolind.2023.110093
Shi, J., Xia, M., He, G., Gonzalez, N. C. T., Zhou, S., Lan, K., et al. (2024). Predicting Quercus gilva distribution dynamics and its response to climate change induced by GHGs emission through MaxEnt modeling. J. Environ. Manage. 357, 120841. doi: 10.1016/j.jenvman.2024.120841
Soilhi, Z., Sayari, N., Benalouache, N., Mekki, M. (2022). Predicting current and future distributions of Mentha pulegium L. @ in Tunisia under climate change conditions, using the MaxEnt model. Ecol. Inf. 68, 101533. doi: 10.1016/j.ecoinf.2021.101533
Sorbe, F., Gränzig, T., Förster, M. (2023). Evaluating sampling bias correction methods for invasive species distribution modeling in Maxent. Ecol. Inf. 76, 102124. doi: 10.1016/j.ecoinf.2023.102124
Swets, J. A. (1988). Measuring the accuracy of diagnostic systems. Science 240, 1285–1293. doi: 10.1126/science.3287615
Tang, C. Q., Du, M., Wang, H., Shi, Y., Zeng, J., Xiao, S., et al. (2024). An unprotected vulnerable relict subtropical conifer-Keteleeria evelyniana: Its forests, populations, growth and endangerment by invasive alien plant species in China. Plant Diversity 24, 648–660. doi: 10.1016/j.pld.2024.02.006
Tang, S., Yang, J., Yuan, M., Li, S., Zhou, Q. (2017). Keteleeria evelyniana: a newly recorded species of Pinaceae in Guiyang. Guizhou. Sci. 35, 19–20.
Thomas, C. D., Cameron, A., Green, R. E., Bakkenes, M., Beaumont, L. J., Collingham, Y. C., et al. (2004). Extinction risk from climate change. Nature 427, 145–148. doi: 10.1038/nature02121
Thuiller, W., Georges, D., Gueguen, M., Engler, R., Breiner, F., Lafourcade, B., et al. (2012). biomod2: Ensemble platform for species distribution modeling 4.2-6–4.2-2. doi: 10.32614/CRAN.package.biomod2
Twardek, W. M., Taylor, J. J., Rytwinski, T., Aitken, S. N., MacDonald, A., Bogaert, R. V., et al. (2023). The application of assisted migration as a climate change adaptation tactic: An evidence map and synthesis. Biol. Conserv. 280, 109932. doi: 10.1016/j.biocon.2023.109932
Wang, M., Guan, Q. (2023). Prediction of potential suitable areas for Broussonetia papyrifera in China using the MaxEnt model and CIMP6 data. J. Plant Ecol. 16, rtad006. doi: 10.1093/jpe/rtad006
Wang, S., Li, L., Liu, C., Jiang, R., Huang, X., He, J., et al. (2022). Effects of exogenous hormone and substrate on seed germination of Keteleeria evelyniana. Chin. Agric. Sci. Bull. 38, 15–21. doi: 10.11924/j.issn.1000-6850.casb2021-0622
Wang, Z., Wang, T., Zhang, X., Wang, J., Yang, Y., Sun, Y., et al. (2024). Biodiversity conservation in the context of climate change: Facing challenges and management strategies. Sci. Total. Environ. 937, 173377. doi: 10.1016/j.scitotenv.2024.173377
Warren, D. L., Seifert, S. N. (2011). Ecological niche modeling in Maxent: the importance of model complexity and the performance of model selection criteria. Ecol. Appl. 21, 335–342. doi: 10.1890/10-1171.1
Warren, D. L., Wright, A. N., Seifert, S. N., Shaffer, H. B. (2014). Incorporating model complexity and spatial sampling bias into ecological niche models of climate change risks faced by 90 C alifornia vertebrate species of concern. Diversity Distrib. 20, 334–343. doi: 10.1111/ddi.12160
Wei, X., Xu, D., Liu, Q., Wu, Y., Zhuo, Z. (2024). Predicting the potential distribution range of Batocera horsfieldi under CMIP6 climate change using the MaxEnt model. J. Econ. Entomol. 117, 187–198. doi: 10.1093/jee/toad209
Wilson, R. J., Gutiérrez, D., Gutiérrez, J., Monserrat, V. J. (2007). An elevational shift in butterfly species richness and composition accompanying recent climate change. Global Change Biol. 13, 1873–1887. doi: 10.1111/j.1365-2486.2007.01418.x
Wisz, M. S., Pottier, J., Kissling, W. D., Pellissier, L., Lenoir, J., Damgaard, C. F., et al. (2013). The role of biotic interactions in shaping distributions and realised assemblages of species: Implications for species distribution modelling. Biol. Rev. 88, 15–30. doi: 10.1111/j.1469-185X.2012.00235.x
Yan, X., Wang, S., Duan, Y., Han, J., Huang, D., Zhou, J. (2021). Current and future distribution of the deciduous shrub Hydrangea macrophylla in China estimated by MaxEnt. Ecol. Evol. 11, 16099–16112. doi: 10.1002/ece3.8288
Yin, D., Gou, X., Yang, H., Wang, K., Liu, J., Zhang, Y., et al. (2023). Elevation-dependent tree growth response to recent warming and drought on eastern Tibetan Plateau. Clim. Change 176, 77. doi: 10.1007/s10584-023-03542-z
Zhang, Q., Shen, X., Jiang, X., Fan, T., Liang, X., Yan, W. (2023). MaxEnt modeling for predicting suitable habitat for endangered tree Keteleeria davidiana (Pinaceae) in China. Forests 14, 394. doi: 10.3390/f14020394
Zhang, G., Zeng, G., Yang, X., Jiang, Z. (2021). Future changes in extreme high temperature over China at 1.5°C–5°C global warming based on CMIP6 simulations. Adv. Atmos. Sci. 38, 253–267. doi: 10.1007/s00376-020-0182-8
Zhao, G., Cui, X., Sun, J., Li, T., Wang, Q., Ye, X., et al. (2021a). Analysis of the distribution pattern of Chinese Ziziphus jujuba under climate change based on optimized biomod2 and MaxEnt models. Ecol. Indic. 132, 108256. doi: 10.1016/j.ecolind.2021.108256
Zhao, Y., Deng, X., Xiang, W., Chen, L., Ouyang, S. (2021b). Predicting potential suitable habitats of Chinese fir under current and future climatic scenarios based on Maxent model. Ecol. Inf. 64, 101393. doi: 10.1016/j.ecoinf.2021.101393
Zhao, Z., Xiao, N., Shen, M., Li, J. (2022). Comparison between optimized MaxEnt and random forest modeling in predicting potential distribution: A case study with Quasipaa boulengeri in China. Sci. Total. Environ. 842, 156867. doi: 10.1016/j.scitotenv.2022.156867
Zhou, W., Li, B., Xu, H., Liang, Z., Lu, X., Yang, L., et al. (2023b). Potential distribution of two economic laver species-Neoporphyra haitanensis and Neopyropia yezoensis under climate change based on MaxEnt prediction and phylogeographic profiling. Ecol. Indic. 150, 110219. doi: 10.1016/j.ecolind.2023.110219
Keywords: Keteleeria evelyniana Mast., Maxent model, climate change, potential distribution, environmental factor
Citation: Feng Y, Dai G, Li H, Chai Y, Bao R, Wang M, Luo C and Qin Y (2025) Assessing the impact of climate change on the potential distribution of Keteleeria evelyniana Mast. in southwest China: a Maxent modeling approach. Front. Plant Sci. 16:1561031. doi: 10.3389/fpls.2025.1561031
Received: 15 January 2025; Accepted: 07 March 2025;
Published: 25 April 2025.
Edited by:
Fengqin Yan, Institute of Geography Science and Natural Resources (CAS), ChinaReviewed by:
Annamalai Muthusamy, Manipal Academy of Higher Education, IndiaYaohui Liu, Shandong Jianzhu University, China
Copyright © 2025 Feng, Dai, Li, Chai, Bao, Wang, Luo and Qin. This is an open-access article distributed under the terms of the Creative Commons Attribution License (CC BY). The use, distribution or reproduction in other forums is permitted, provided the original author(s) and the copyright owner(s) are credited and that the original publication in this journal is cited, in accordance with accepted academic practice. No use, distribution or reproduction is permitted which does not comply with these terms.
*Correspondence: Yangping Qin, eWFuZ3BpbmdxaW5Ac2luYS5jb20=