 Jiaxuan Huang
 Sufang Chen
 Kaikai Meng2
 Mingwan Li
 Qiang Fan
 Wenbo Liao
- 1State Key Laboratory of Biocontrol and Guangdong Provincial Key Laboratory of Plant Resources, School of Life Sciences, Sun Yat-sen University, Guangzhou, China
- 2Guangxi Key Laboratory of Quality and Safety Control for Subtropical Fruits, Guangxi Subtropical Crops Research Institute, Nanning, China
- 3College of Forestry, Henan Agricultural University, Zhengzhou, China
Polyploidy and hybridization are prevalent phenomena within the genus Cotoneaster, leading to blurred species boundaries, particularly in Cotoneaster ser. Pannosi and Cotoneaster ser. Buxifolii. This study seeks to establish a robust phylogenetic framework for these series and their allied taxa to support future taxonomic revisions and investigations of hybridization–polyploidy dynamics. Population-level sampling was conducted across 43 populations located in Sichuan, Taiwan, Yunnan, Tibet (China), and Rasuwa (Nepal), including 17 species from C. ser. Pannosi and C. ser. Buxifolii, along with 10 species from closely related series. Following detailed comparisons with type specimens, six quantitative traits were measured, and 16 qualitative traits were recorded from individual specimens, followed by hierarchical clustering and principal component analyses of the combined dataset. Phylogenetic relationships were reconstructed using two datasets: 1) chloroplast genomes generated through shallow genome sequencing and 2) single-nucleotide polymorphisms (SNPs) obtained from restriction site-associated DNA sequencing (RAD-seq), complemented by genetic structure analyses. The taxonomic framework equally prioritizes nuclear clade monophyly [Shimodaira–Hasegawa approximate likelihood ratio test (SH-aLRT) ≥ 80% and ultrafast bootstrap (UFboot) ≥ 95%] and discrete genetic cluster membership (cluster assignment probability ≥ 95%) as primary delimitation criteria, complemented by morphological discontinuity (≥ 2 traits) and chloroplast phylogeny concordance. Fourteen species satisfied all criteria, corresponding to nine distinct gene pools, while the remaining 13 species displayed admixed genomic compositions and cytonuclear discordances, indicative of hybrid origins. This study identifies putative hybrid taxa and provides a foundational framework for further species delimitation, advancing future research on Cotoneaster systematics, natural hybridization patterns, and taxonomic revision.
1 Introduction
The tribe Maleae Small, comprising approximately 27 genera and 912 species, represents one of the most widely distributed and morphologically diverse taxa within the family Rosaceae Juss., predominantly occurring in temperate Northern Hemisphere regions (Wang et al., 2024). This tribe is characterized by the pome, a unique fruit type that serves as a key adaptive innovation (Potter et al., 2007). Economically significant members include globally cultivated fruit crops such as apples (Malus pumila Mill.) and pears (Pyrus spp.), alongside horticulturally important ornamentals like cotoneasters (Cotoneaster spp.) with their persistent berries, firethorns (Pyracantha spp.) bearing brightly colored pomes, and flowering crabs [Malus spectabilis (Ait.) Borkh.] valued for their showy blossoms. Extensive morphological and molecular evidence reveals pervasive hybridization patterns within and between genera, supported by congruent data from chloroplast/nuclear gene sequences and cytonuclear phylogenetic reconstructions (Liu et al., 2022; Volk et al., 2019; Liston et al., 2021). Molecular systematics indicates the tribe originated through an ancient whole-genome duplication event, likely involving hybridization between two ancestral lineages with distinct chromosomal bases followed by genome doubling (Campbell et al., 2007; Hodel et al., 2022; Sun et al., 2024). Contemporary polyploidization remains evolutionarily significant, with multiple occurrences of tetraploidy and other ploidy variations documented across the tribe (Burgess et al., 2014; Dickinson et al., 2007; Dickinson, 2018; Macková, 2020). This genomic dynamism is further amplified by widespread apomixis, which facilitates rapid reproductive isolation between ploidy variants and hybrid lineages, thereby accelerating speciation processes (Campbell and Dickinson, 1990; Campbell et al., 1991; Cushman et al., 2017). The frequent occurrence of hybridization, polyploidization, and apomixis have collectively obscured species boundaries and generated complex phylogenetic discordances, creating persistent challenges for taxonomic delineation and evolutionary reconstructions.
Cotoneaster Medik. represents one of the most quintessential examples within the tribe Maleae. This genus is extensively distributed across the Northern Hemisphere, encompassing all of Europe, North Africa, and the temperate regions of Asia (excluding Japan), with its diversity hotspot centered in the Himalayas and the mountainous regions surrounding Yunnan and Sichuan provinces in China (Lu and Brach, 2003; Fryer and Hylmö, 2009). Cytogenetic studies demonstrate a polyploid series across the genus: 70%–76% of species are tetraploid (2n = 68), 9%–15% are triploid (2n = 51), and 10%–15% are diploid (2n = 34), with rare occurrences of pentaploid (2n = 85) and hexaploid (2n = 102) cytotypes (Fryer and Hylmö, 2009; Rothleutner et al., 2016). The taxonomy of Cotoneaster has been widely debated due to differing opinions on critical morphological traits, resulting in varying species numbers. Koehne (1893) foundational system classified Cotoneaster into two subgenera, Chaenopetalum (Koehne) G. Klotz (six species) and Cotoneaster (seven species), based on floral traits like the angle of petals opening. Subsequent revisions introduced competing frameworks: Flinck and Hylmö (1966) organized 174 species into a hierarchical system of two sections, four subsections, and 24 series using stamen and pyrene counts; Yu et al. (1974) alternatively proposed three sections (Uniflos, Cotoneaster, and Densiflos) defined by inflorescence dimensions. Lu and Brach (2003) adopted a non-hierarchical approach, circumscribing approximately 90 species (including 59 in China with 37 endemics) through multivariate analysis of inflorescence structure, petal coloration, and foliar morphology. The most recent synthesis by Fryer and Hylmö (2009) integrates growth habit, trichome characteristics, shoot phenology, and reproductive morphology to classify 460 taxa under an expanded system of two subgenera, 11 sections, and 37 series, representing the current taxonomic consensus.
Recent phylogenomic analyses by Meng et al. (2021), integrating chloroplast genomes and 204 low-copy nuclear genes across 69 Cotoneaster species (72 accessions), resolve the genus into two principal clades (Co and Ch) corresponding to the subgeneric divisions Cotoneaster and Chaenopetalum sensu Fryer and Hylmö (2009). The Co clade exhibits prolonged sequential flowering in cymose inflorescences with predominantly erect red petals (occasionally semi-spreading or pink), although lacking internal phylogenetic resolution. Conversely, the Ch clade demonstrates synchronous cymose flowering with fully expanded white petals (rarely pink), subdivided into three well-supported subclades. These molecular phylogenies reveal non-monophyly of most traditionally defined series and pervasive cytonuclear discordance indicative of recurrent hybridization and incomplete lineage sorting during the genus’ radiation. Particular interest surrounds the monophyletic Ch-E–Ch-I subclade within the Ch lineage, which predominantly aggregates taxa from series Pannosi (P) and Buxifolii (B) sensu Fryer and Hylmö (2009), including phylogenetically entangled species such as Cotoneaster dammeri subsp. songmingensis C. Y. Wu & L.-H. Zhou, Cotoneaster morrisonensis Hayata, and Cotoneaster marginatus (Loudon) Schltdl. Chloroplast phylogenies further demonstrate a cohesive grouping of series Pannosi and Buxifolii with Cotoneaster conspicuus Comber ex Marquand (excluding Cotoneaster glaucophyllus Franch. and infraspecific taxa). Notable cytonuclear incongruence emerges in Cotoneaster buxifolius Wall. ex Lindl, where nuclear data position it basally within the Co clade, while chloroplast evidence nests it within series Pannosi–Buxifolii (Supplementary Figure S1). However, comprehensive evaluation of species boundaries and interspecific gene flow remains constrained by sparse taxon sampling (one to three– accessions per species) across this hyperdiverse genus.
The advent of high-throughput genomic methods, particularly restriction site-associated DNA sequencing (RAD-seq), has revolutionized phylogenetic reconstruction in taxonomically complex genera such as Diospyros L. and Salix L., enhancing phylogenetic resolution and providing insights into hybridization events (Wagner et al., 2020; Linan et al., 2021). Recurrent polyploidization and hybridization events have systematically obscured species boundaries, as evidenced by whole-genome analyses revealing intricate reticulate evolution in Helianthus L (Renaut et al., 2014). Contemporary species delimitation frameworks emphasize integrative approaches combining genomic, morphological, and ecological data, as proposed by Liu (2016) and successfully implemented across diverse organismal groups (Ely et al., 2018; Li et al., 2019; Maharachchikumbura et al., 2021; Anjos et al., 2020; Prebus, 2021). These methodologies hold particular urgency for Cotoneaster given its exceptional polyploid prevalence (70%–76% tetraploids) and widespread morphological convergence, with series Pannosi (P) and Buxifolii (B) serving as exemplary case studies (Fryer and Hylmö, 2009). These Hengduan–Himalayan endemic series (15 and nine species) exhibit remarkable ecological versatility: cold/drought tolerance, avian-frugivore mutualisms, and horticultural value exemplified by Cotoneaster lacteus W. W. Smith and Cotoneaster coriaceus Franch (Fryer and Hylmö, 2009). Morphologically, ser. P demonstrates elliptic laminas (6–70 mm) with densely tomentose abaxial surfaces and compact cymes, whereas ser. B comprises dwarf shrubs with reduced foliage (3–17 mm) and 1–25-flowered inflorescences. Subtle yet consistent differentiation persists in lamina shape, indumentum density, and the number of flowers per inflorescence (Figure 1). Zhou and Wu (2001) multidisciplinary revision of ser. B through cytological analysis of type specimens identified four morphologically diagnosable species characterized by erect growth, persistent tomentum on foliar abaxial surfaces/calyces, and typically two pyrenes. However, persistent diagnostic ambiguities arise from trait overlapping and extensive hybrid zones in sympatric populations (Li et al., 2014; Li et al., 2017), underscoring the necessity of genomic-scale data to resolve these evolutionary dynamic lineages.
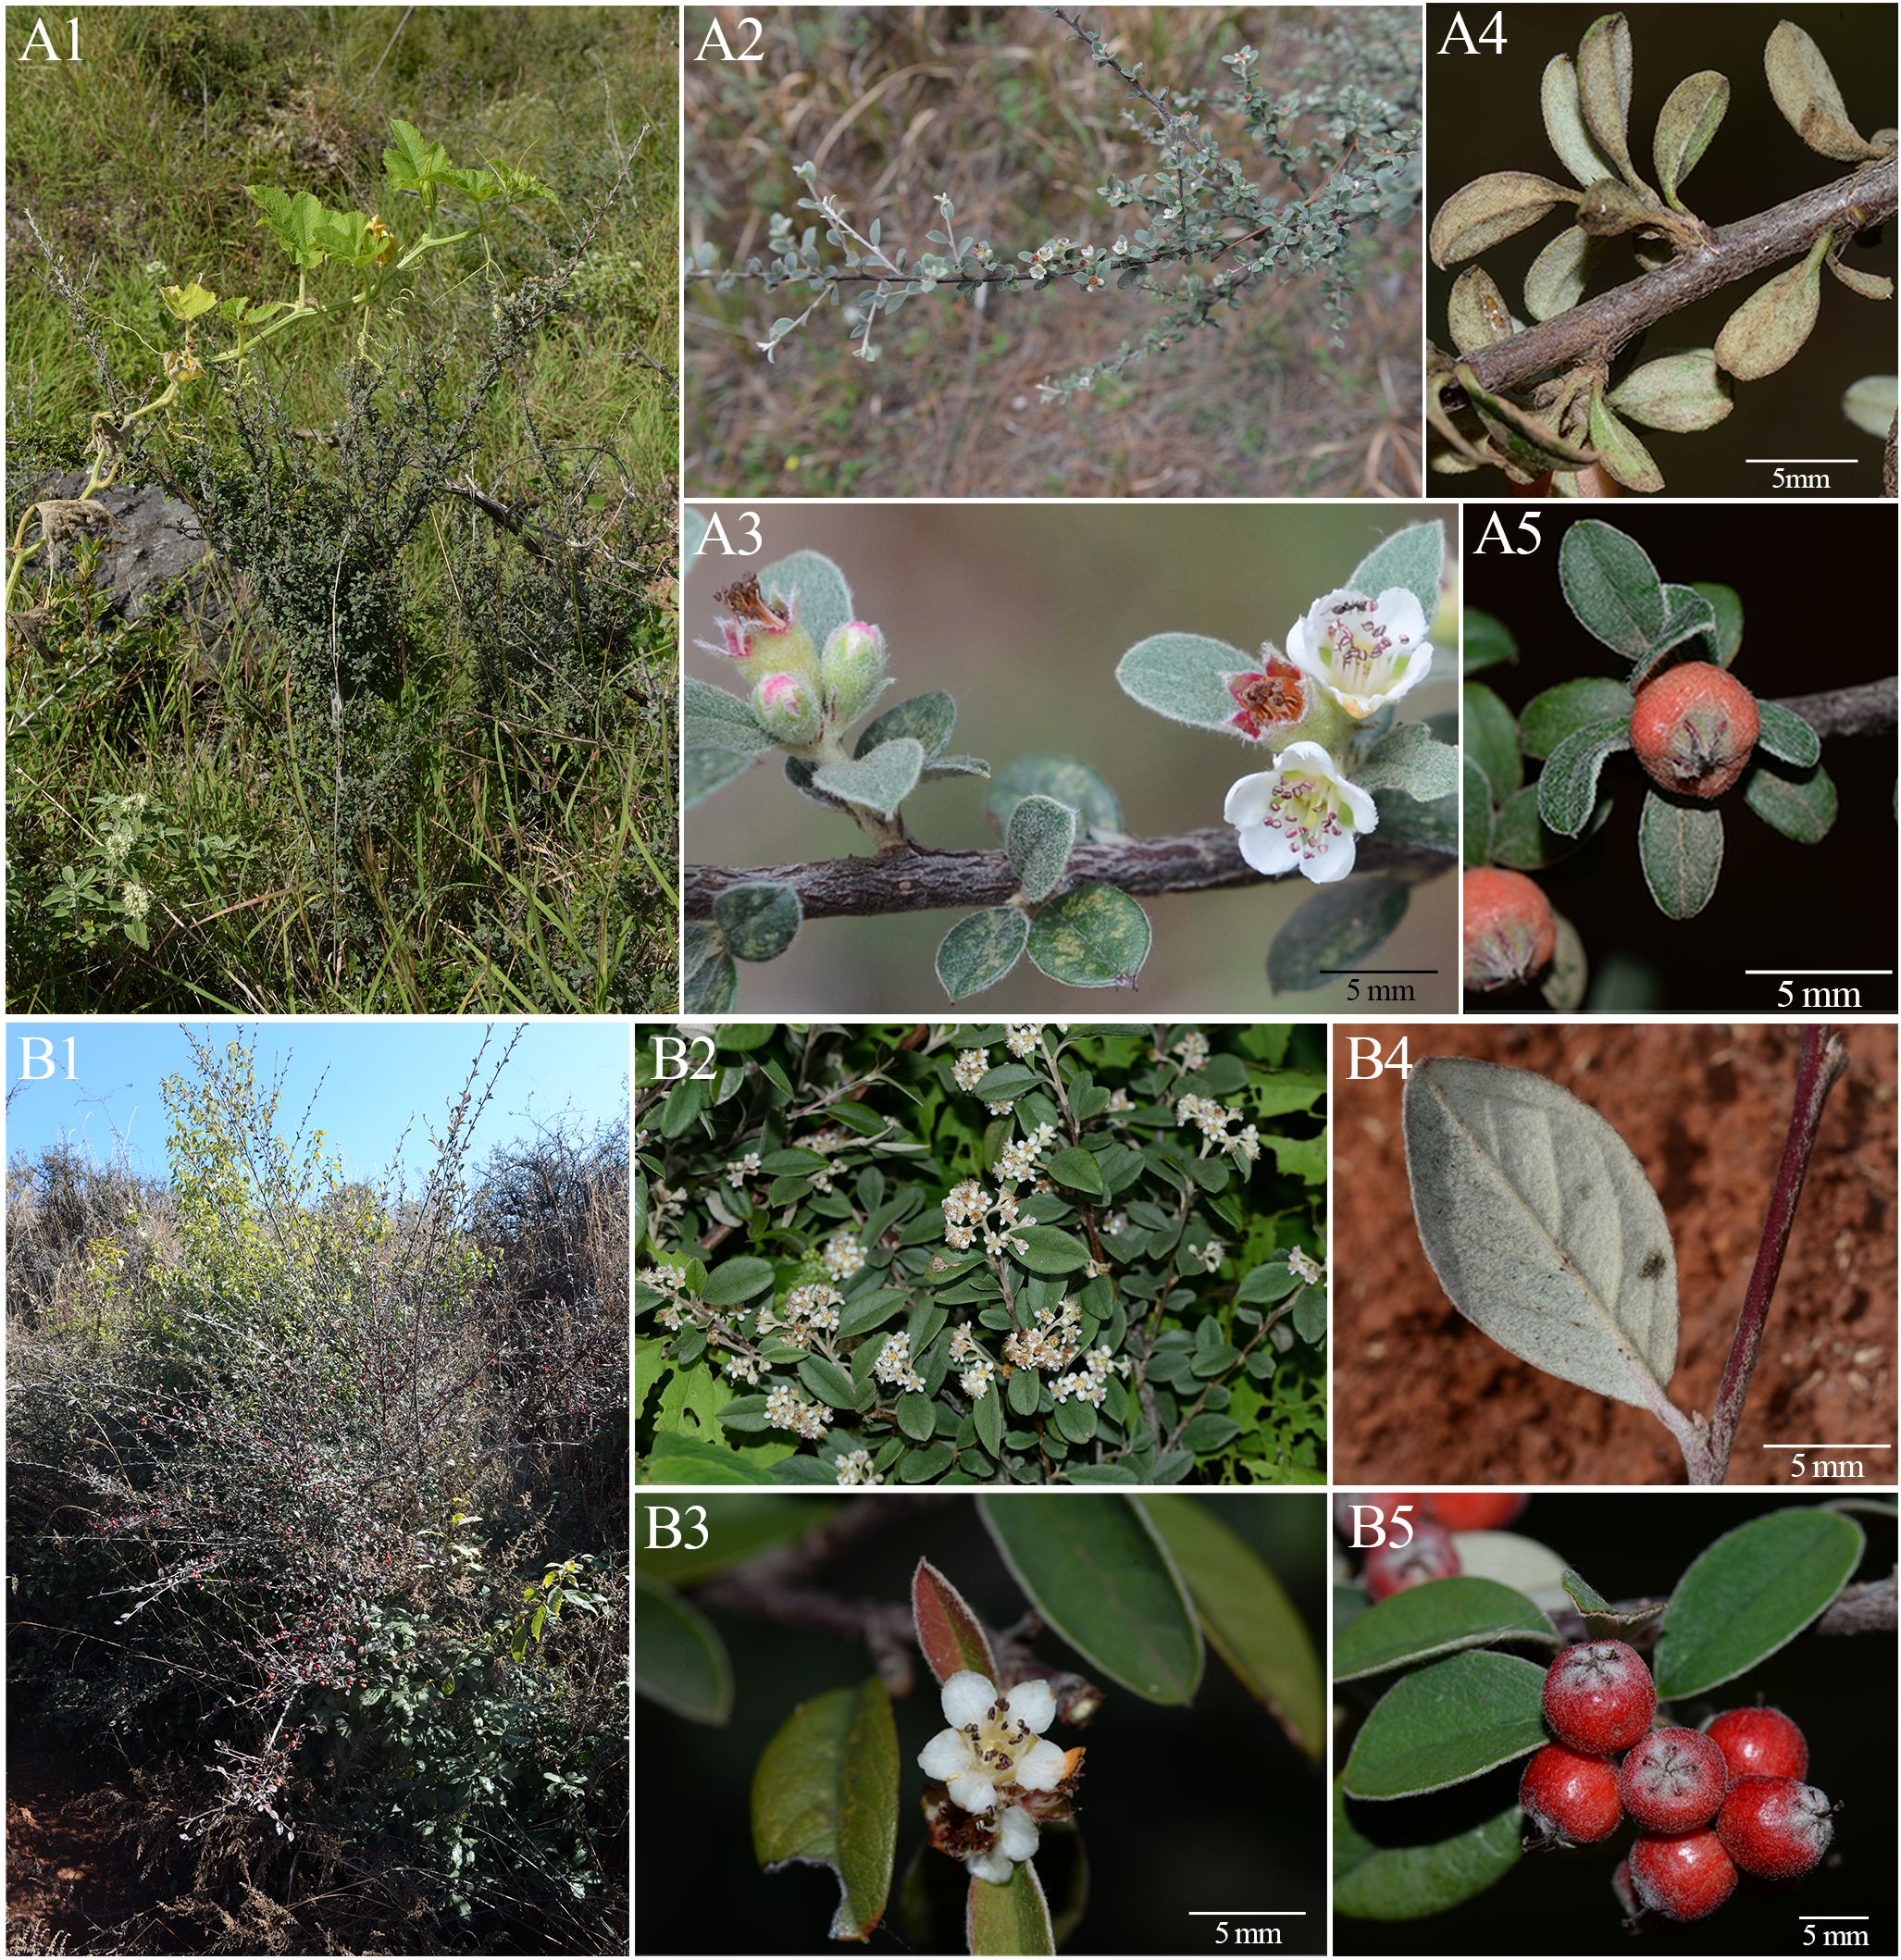
Figure 1. Morphological comparisons between Cotoneaster argenteus and Cotoneaster pannosus in growth habit, leaf morphology, indumentum characteristics, inflorescence, and fruits. (A) C. argenteus. (A1) Dwarf shrub (height: 0.5–1 m). (A2) Fertile branch with spiral branchlets. (A3) Flower bearing ascending petals. (A4) Abaxial leaf surface with slowly deciduous indumentum. (A5) Small globose fruit (diameter: 3.5–5 mm). (B) C. pannosus. (B1) Shrub with 1–5-m height. (B2) Fertile branch bearing inflorescence. (B3) Flower with spreading petals. (B4) Abaxial leaf surface retaining persistent indumentum. (B5) Larger fruits (diameter: 8–9 mm).
This investigation focuses on resolving the phylogenetic relationships and species delimitation within the Ch-E–Ch-I subclade of the Ch lineage encompassing ser. P, ser. B, and allied taxa through integrated morphometric and population genomic approaches (Supplementary Figure S1). We collectively refer to the species within the Ch-E–Ch-I subclade, along with other species in ser. P and ser. B, as a morphologically similar yet phylogenetically ambiguous complex. Given that C. buxifolius is the earliest described species in this group, we designate this complex as the C. buxifolius complex. We sampled a total of 30 populations representing 16 recognized taxa within this complex. We meticulously recorded morphological traits for traditional taxonomic analysis, while we employed double-digest restriction site-associated DNA sequencing (ddRAD-seq) for population genomics studies. Complementary shallow genomic sequencing of representative accessions enabled chloroplast phylogeny reconstruction. By integrating these multidimensional datasets, we aimed to address the persistent challenges: 1) disentangling phylogenetic relationships amid morphological convergence in ser. P, ser. B, and related taxa; 2) establishing biologically meaningful species boundaries; and 3) finding potential gene flow and hybridization events. This multidisciplinary framework advances integrative taxonomy in Cotoneaster by reconciling classical morphological criteria with genomic evidence, ultimately providing a modest reference for refining the genus’ taxonomic architecture.
2 Materials and methods
2.1 Studied species and sample collection
Building upon previous phylogenetic frameworks (Meng et al., 2021; Fryer and Hylmö, 2009), this research sampled 29 taxa including four morphologically ambiguous entities (Table 1). The sampling strategy targeted nine species from ser. P, six from ser. B, and nine additional taxa from phylogenetically adjacent series Salicifolii T. T. Yu (S), Conspicui G. Klotz (C), Radicantes G. Klotz (R), and Microphylli T. T. Yu (M). Field collections spanned 43 natural populations (458 accessions; 2–23 individuals per population) across major distribution areas: Sichuan, Yunnan, Tibet (China), Taiwan (China), and Rasuwa District (Nepal) (Figure 2). Georeferencing was performed using the Ovital Map application, with spatial metadata detailed in Supplementary Table S1. Voucher specimens were deposited at Sun Yat-sen University Herbarium (SYS). Fresh leaves were desiccated in silica gel for subsequent genomic analyses.
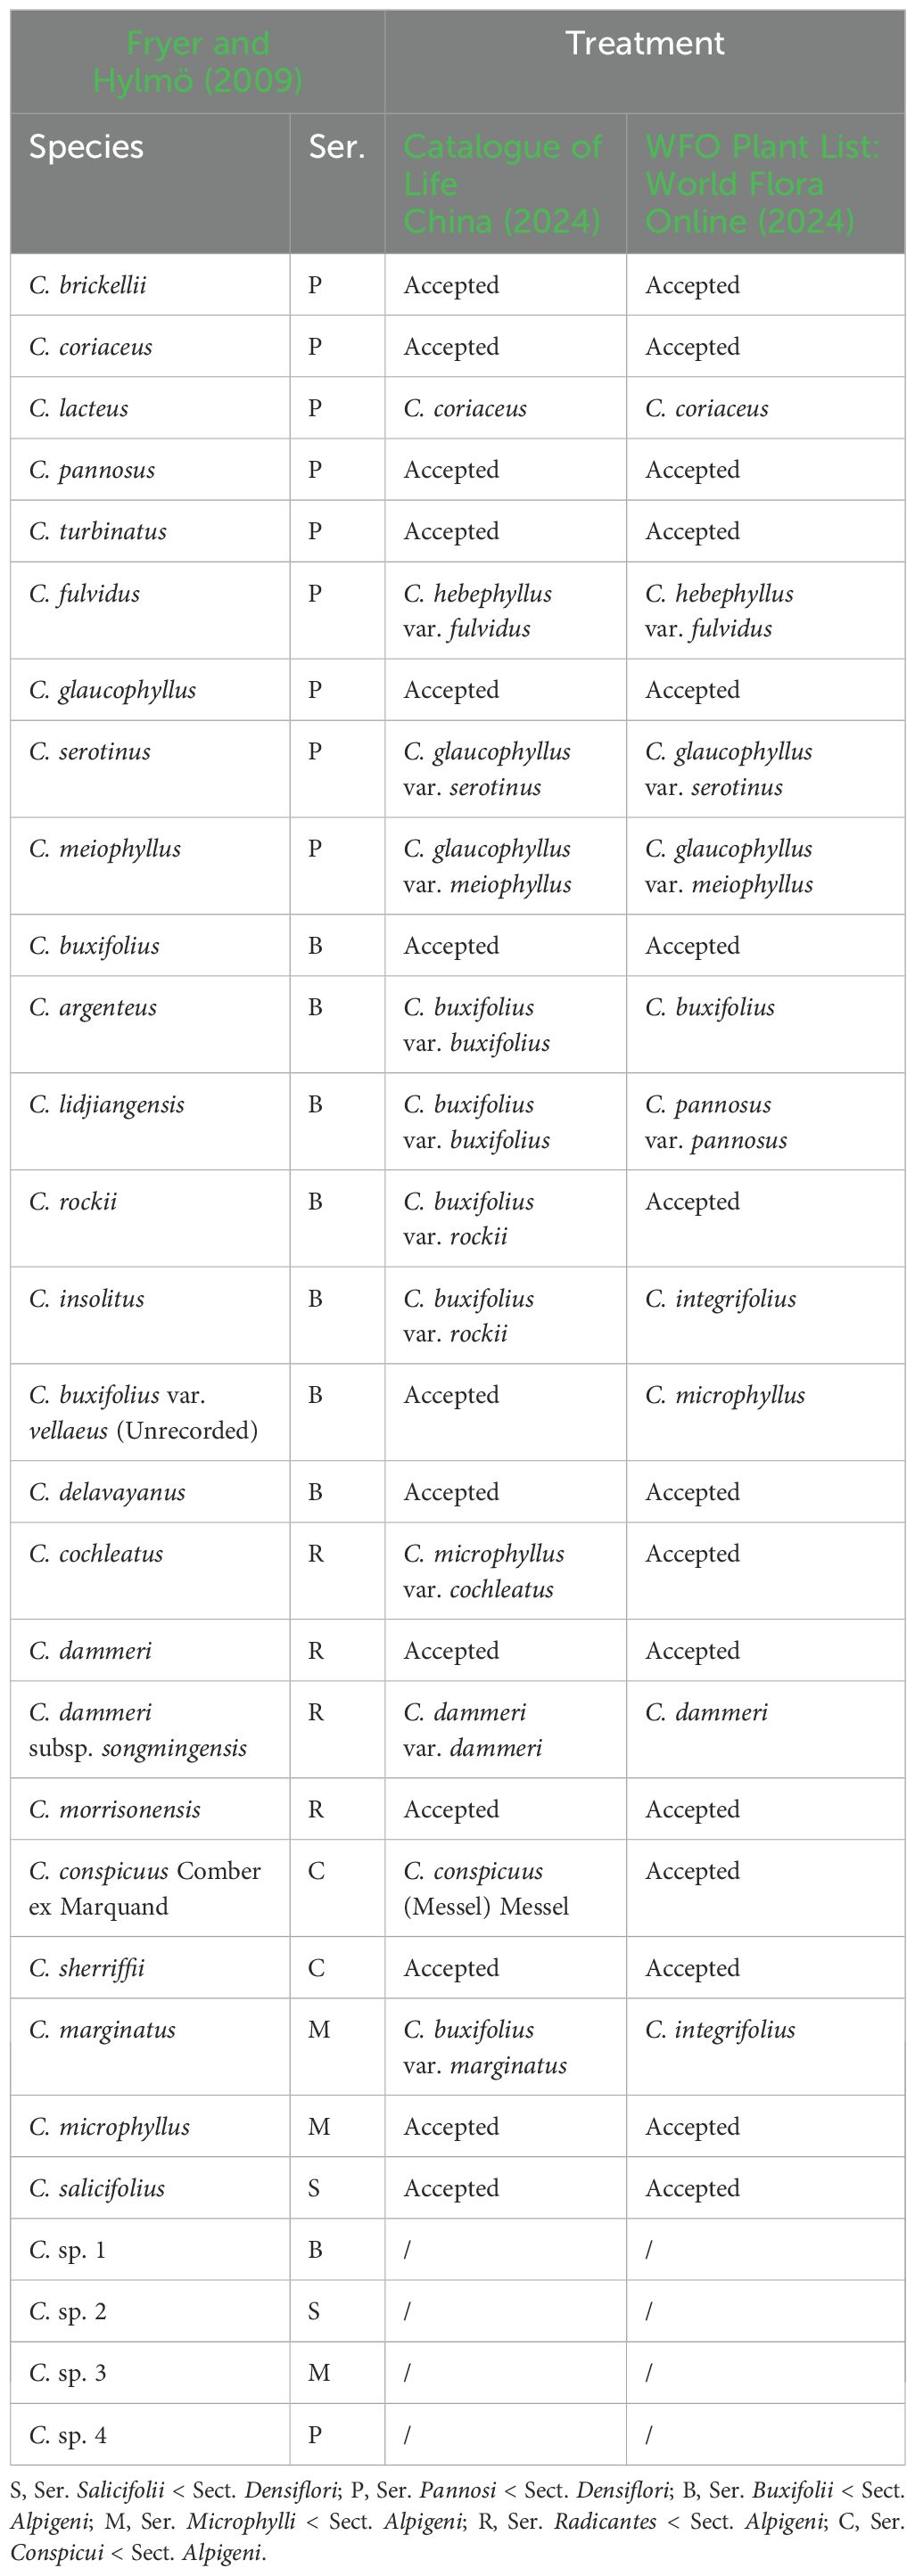
Table 1. Taxonomic status and classification of studied Cotoneaster buxifolius complex and related taxa.
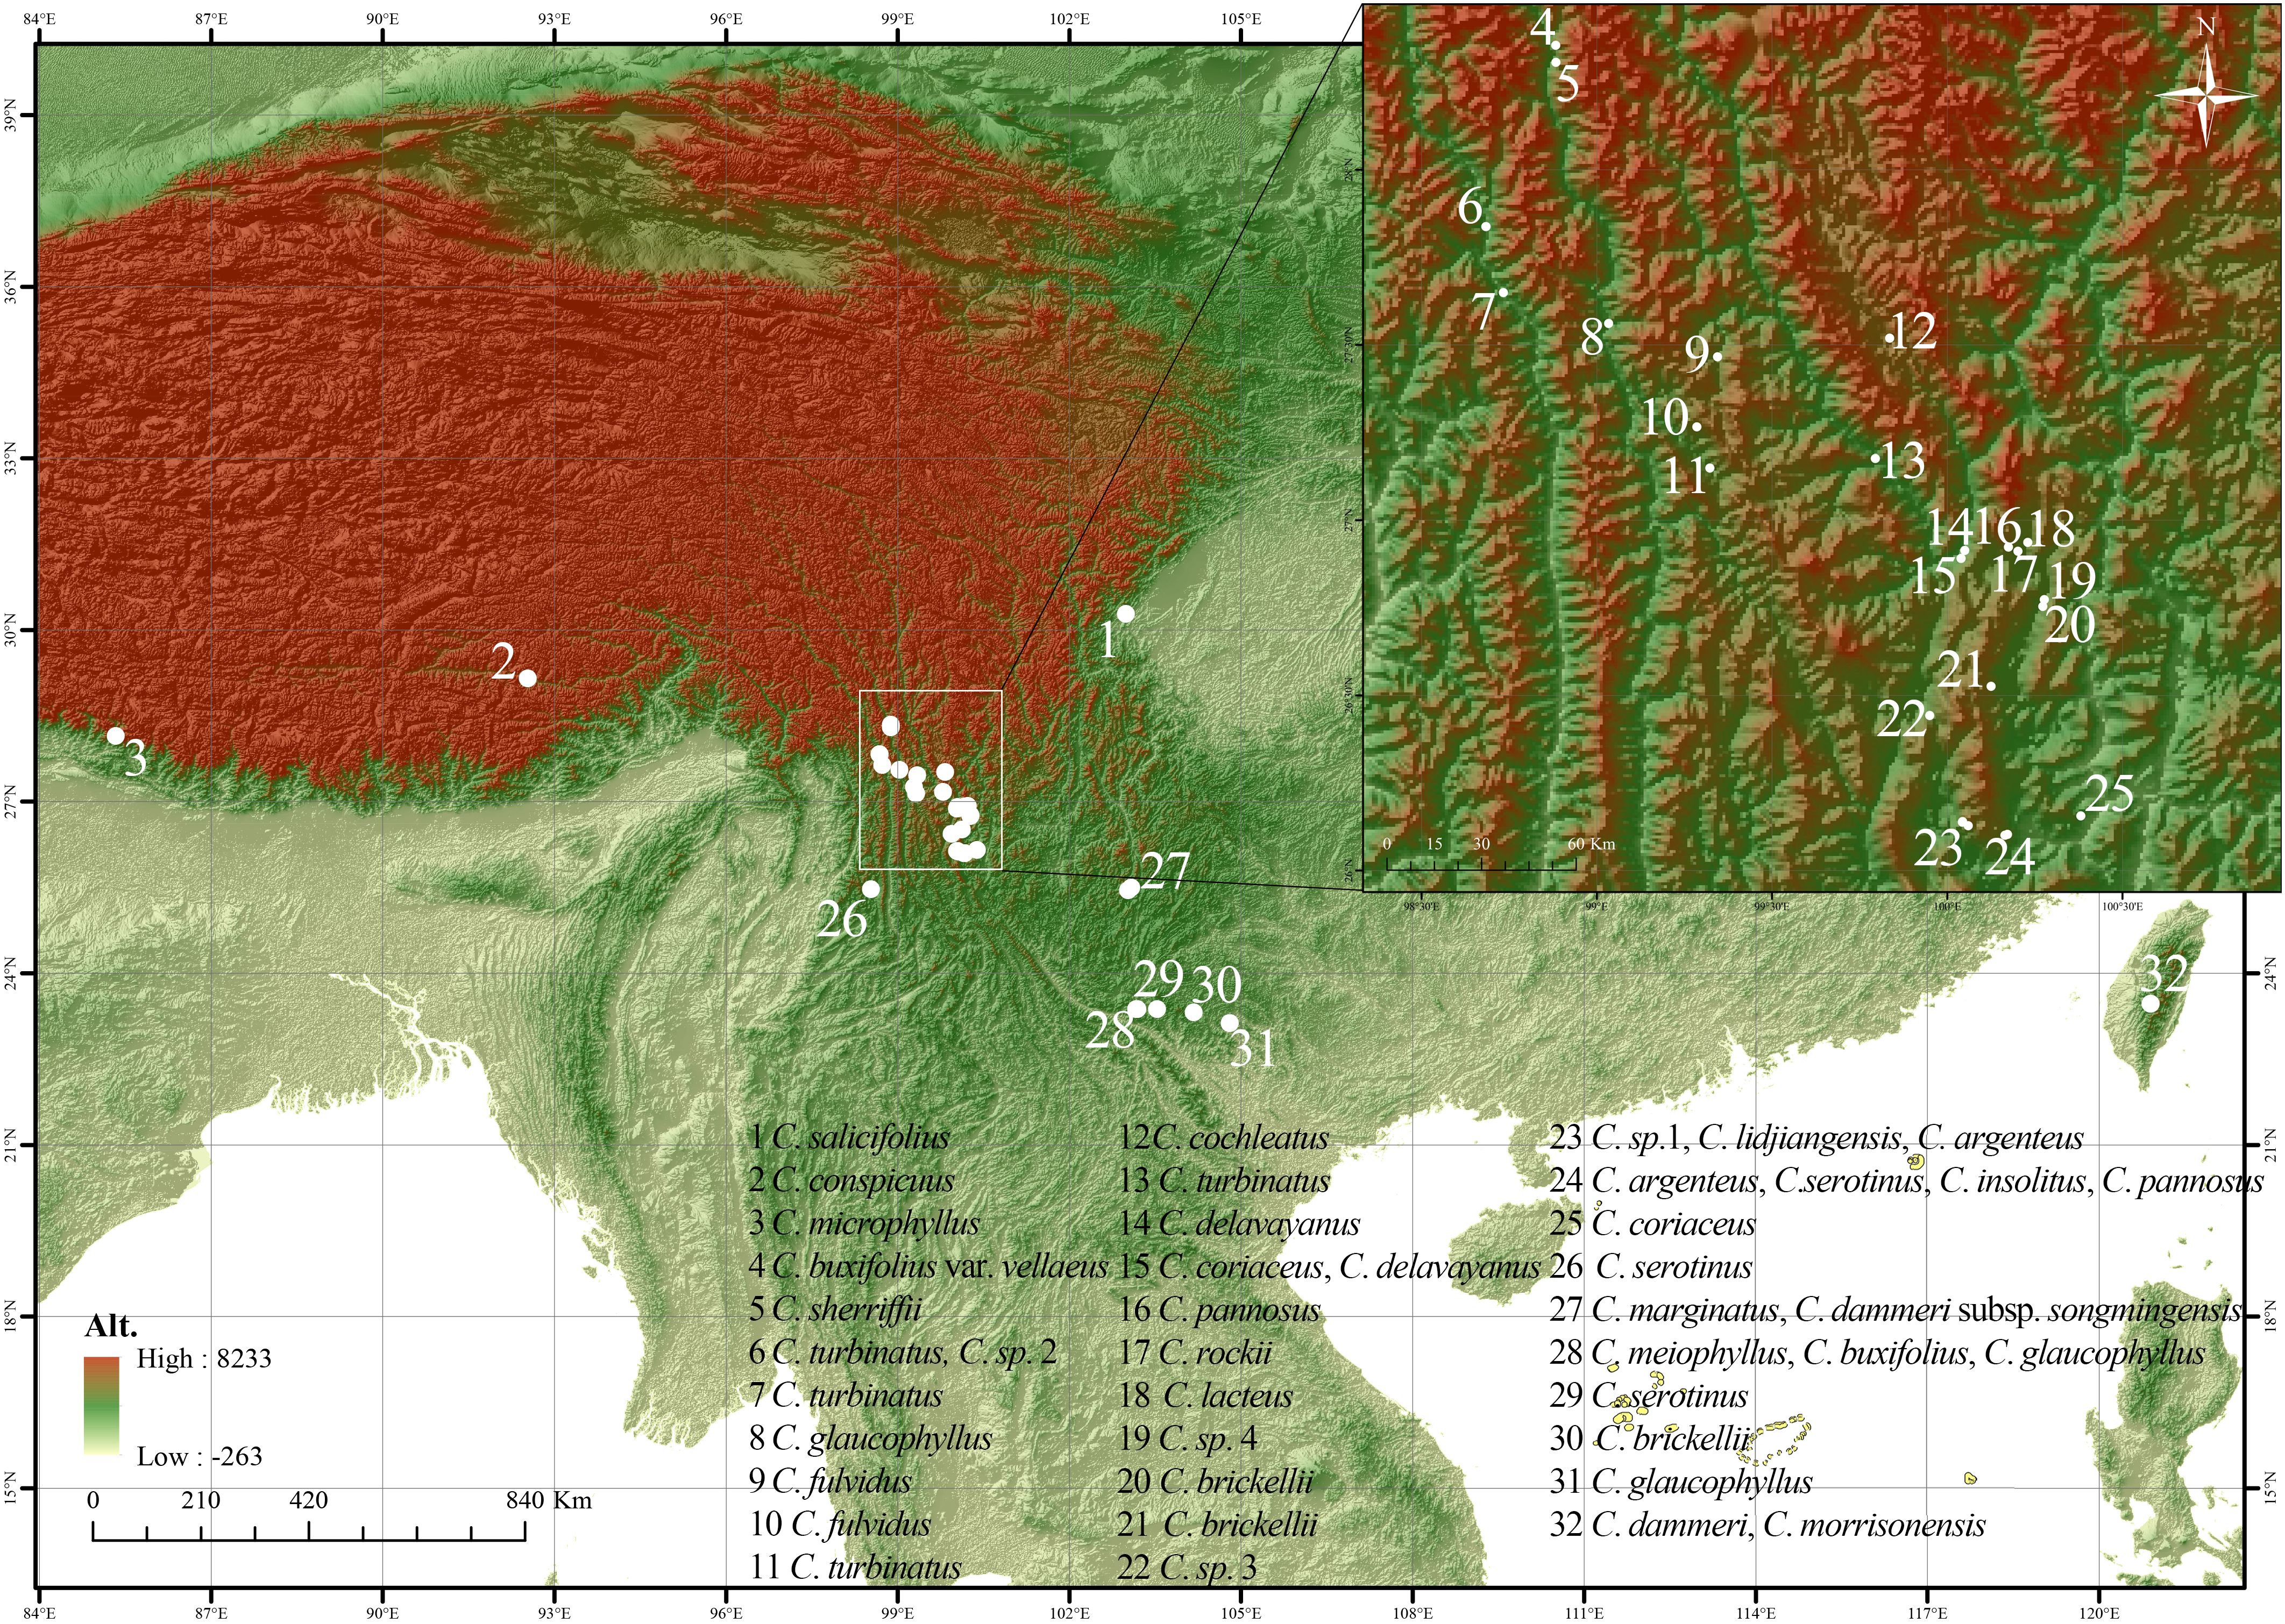
Figure 2. Collection map of the Cotoneaster buxifolius complex and related taxa, with location coded from 1 to 32.
2.2 Morphological characterization and analysis
Detailed morphological observation and analysis incorporated 1–20 specimens per population. Morphological characteristics of the Cotoneaster brickellii J. Fryer and B. Hylmö WS and Cotoneaster meiophyllus (W. W. Sm.) G. Klotz LHS populations were recorded based on field observations and literature descriptions (Fryer and Hylmö, 2009). Six quantitative and 16 qualitative traits were identified for analysis with qualitative traits encoded as integers (Supplementary Table S2). Principal component analysis (PCA) implemented in FactoMineR v2.9 (Lê et al., 2008) utilized all 22 traits (Supplementary Table S3), visualized using biplots showing species distributions in PCA space and trait contributions. Gower’s distance matrix was calculated using gower v0.1.2 (Gower, 1971), based on the mean of four quantitative traits (leaf length, leaf width, leaf length-to-width ratio, and petiole length) and 16 coded qualitative traits (Supplementary Table S4). Hierarchical clustering was performed using the average method by SciPy v. 1.11.2 (Virtanen et al., 2020), and a dendrogram was generated using Matplotlib v. 3.7.2 (Hunter, 2007) to illustrate population relationships.
2.3 Plastid assembly and phylogenetic tree construction
Shallow genome sequencing of one to two– randomly selected individuals per population was conducted on the Illumina NovaSeq platform (150-bp paired-end reads; JieRui BioScience, Guangzhou, China). Chloroplast genome assembly followed a four-stage pipeline: quality trimming with fastp v0.23.4 (Chen et al., 2018), de novo assembly via GetOrganelle v1.7.7.0 (Jin et al., 2020) using C. lacteus (MK605517) as reference, iterative polishing with Pilon v1.24 (Walker et al., 2014), and collinearity verification using MUMmer v4.0.0rc1 (Marçais et al., 2018). The final plastid genome dataset combined 29 newly assembled plastid genomes in this study with 64 publicly available plastid genomes of Cotoneaster species and Eriobotrya deflexa (Hemsl.) Nakai downloaded from the National Center for Biotechnology Information (NCBI) nucleotide database (https://www.ncbi.nlm.nih.gov). The corresponding accession numbers are listed in Supplementary Table S5. Multiple sequence alignment using MAFFT v. 7.505 (Katoh and Standley, 2013) with default settings was refined with Gblocks v0.91b (Castresana, 2000) to remove half-gap regions. IQ-TREE multicore v1.6.12 (Nguyen et al., 2015) was utilized to construct maximum likelihood phylogenetic trees. The Shimodaira–Hasegawa approximate likelihood ratio test (SH-aLRT) and ultrafast bootstrap (UFboot) values were both set to 10,000 to evaluate the reliability of the phylogenetic tree topology and node support.
2.4 RAD sequencing and data processing
Genomic DNA was extracted from silica-dried leaf samples using a modified cetyl-trimethylammonium bromide (CTAB) method as described by Doyle and Doyle (1987) and Yang et al. (2010). Leaf tissues, excluding veins, were flash-frozen in liquid nitrogen for 10 min, homogenized with magnetic beads using a tissue homogenizer, and lysed in 1.5 mL STE buffer (10-min inversion mixing). After centrifugation (5,000 ×g, 5 min), the pellet was resuspended in preheated 3% CTAB buffer (65°C, 45 min, gentle inversion every 10 min). Subsequent steps included chloroform:isoamyl alcohol (24:1) extraction (twice), RNase A treatment (37°C, 30 min), isopropanol precipitation (−20°C, 1 night), and three washes with 70% ethanol. DNA pellets were air-dried and dissolved in 100 μL TE buffer. All centrifugations were performed at 12,000 ×g for 10 min using a pre-cooled centrifuge (4°C). ddRAD libraries were prepared and sequenced by JieRui BioScience Co. Ltd. (Guangzhou, China) on an Illumina NovaSeq platform with 150-bp paired-end reads. A total of 458 individuals from 43 populations were included in the population genomic analysis. The raw ddRAD-seq data for all Cotoneaster taxa generated for this study was uploaded to GenBank under the BioProject PRJNA1196588.
Raw data quality was evaluated using FastQC v0.12.1 (Andrews, 2010) and MultiQC v1.15 (Ewels et al., 2016), followed by adapter and low-quality base trimming using fastp v0.23.4 (Chen et al., 2018) and cutadapt v4.4 (Martin, 2011). Filtered reads were aligned to the genome of C. glaucophyllus (Meng et al., 2024) using the BWA-MEM algorithm with parameters -B 3 and -O 5,5, as implemented in BWA v0.7.17-r1188 (Li, 2013). Variant calling and refinement were performed using an established GATK v4.3.0.0 (McKenna et al., 2010) workflow. Read group information was first incorporated into alignment files using the AddOrReplaceReadGroups module. Per-sample GVCF files were subsequently generated using HaplotypeCaller, followed by the assembly of a consolidated GenomicsDB using GenomicsDBImport for chromosome-specific variant extraction. Merged VCF files underwent rigorous quality filtration via VariantFiltration, retaining only single-nucleotide polymorphisms (SNPs) satisfying the following thresholds: quality by depth (QD) > 2.0, Phred-scaled quality score (QUAL) > 30.0, Fisher’s strand bias (FS) < 60.0, mapping quality (MQ) > 40.0, mapping quality rank sum (MQRankSum) > −12.5, and read position rank sum (ReadPosRankSum) > −8.0. The filtered variant set was further processed using bcftools v1.17 (Danecek et al., 2021) to retain strictly biallelic sites exhibiting ≤ 15% missing data, a minimum minor allele count (MAC) of 3, and minor allele frequency (MAF) ≥ 5%. Fourfold degenerate (4D) sites were systematically identified through iTools v0.25 (He et al., 2013) using coordinate annotations from the C. glaucophyllus reference genome (Meng et al., 2024). Linkage disequilibrium (LD) pruning was implemented in PLINK v1.90b6.26 (Purcell et al., 2007) using a sliding window approach (50-SNP windows advanced in 10-SNP increments), with sites demonstrating pairwise LD (r2) > 0.1 excluded from downstream analyses.
2.5 Phylogenetic analyses and population genetics based on RAD-seq
The maximum likelihood phylogenetic tree was reconstructed using IQ-TREE multicore v1.6.12 (Nguyen et al., 2015) based on 4D sites derived from the RAD-seq dataset, with SH-aLRT and UFboot values set to 5,000 and 10,000, respectively. Population structure inference was implemented through ADMIXTURE v1.3.0 (Alexander et al., 2009) using a curated dataset of non-missing, linkage-pruned 4D sites, testing K = 1–40 with 10 replicates per K. Cross-validation error minimization determined optimal genetic clusters, visualized using pophelper v2.3.1 (Francis, 2017). Principal component analysis (PLINK v1.90b6.26) of SNPs with 85% completeness generated covariance matrices, with Python-customized scripts visualizing dispersion patterns along the first two principal components.
3 Results
3.1 Morphological analyses
PCA was performed on 29 taxa using 22 morphological traits. The first two principal components explained 29% and 18.76% of the total variance. Leaf length, leaf width, rooting habit, and fertile shoot composition significantly contributed to the variance of PC1 and PC2, while traits such as upper leaf surface color showed minimal influence (Supplementary Figure S2). The PCA plot elucidated the relationships among different series (Figure 3). All species in ser. P, together with C. buxifolius, Cotoneaster lidjiangensis G. Klotz and Cotoneaster insolitus G. Klotz (ser. B), Cotoneaster sherriffii G. Klotz (ser. C), and C. marginatus (ser. M), formed a compact and distinct group A. Four additional ser. B species formed Group B, while C. buxifolius var. vellaeus (Franch.) G. Klotz (ser. B) clustered with C. conspicuus (ser. C) and Cotoneaster microphyllus Wall. ex Lindl. (ser. M) in Group C. The four ser. R taxa, split into groups D (C. morrisonensis and C. dammeri C. K. Schneider), F (C. dammeri subsp. songmingensis), and G [Cotoneaster cochleatus (Franchet) G. Klotz], while the two species in ser. S formed groups E (C. sp. 2) and H (Cotoneaster salicifolius Franch.). Hierarchical clustering divided all taxa into three major clades (Figure 4). Clade MC comprised taxa from ser. P and ser. S, further divided into two subgroups: one containing Cotoneaster serotinus Hutch., C. glaucophyllus, and C. meiophyllus clustered with ser. S taxa, while the other encompassed the remaining members of ser. P. Clade MB integrated taxa from ser. B alongside C. sp. 3 and C. marginatus (both morphologically assigned to ser. M). Within this clade, C. lidjiangensis, C. buxifolius, and C. insolitus clustered with C. sp. 3 and C. marginatus, forming one subclade, while the remaining series B taxa—Cotoneaster rockii G. Klotz, C. sp. 1, C. buxifolius var. vellaeus, Cotoneaster argenteus G. Klotz, and Cotoneaster delavayanus G. Klotz—grouped into another distinct subclade. Clade MA consisted of two lineages: an independent branch representing ser. R and the other distinct cluster formed by ser. C taxa and C. microphyllus (classified under ser. M).
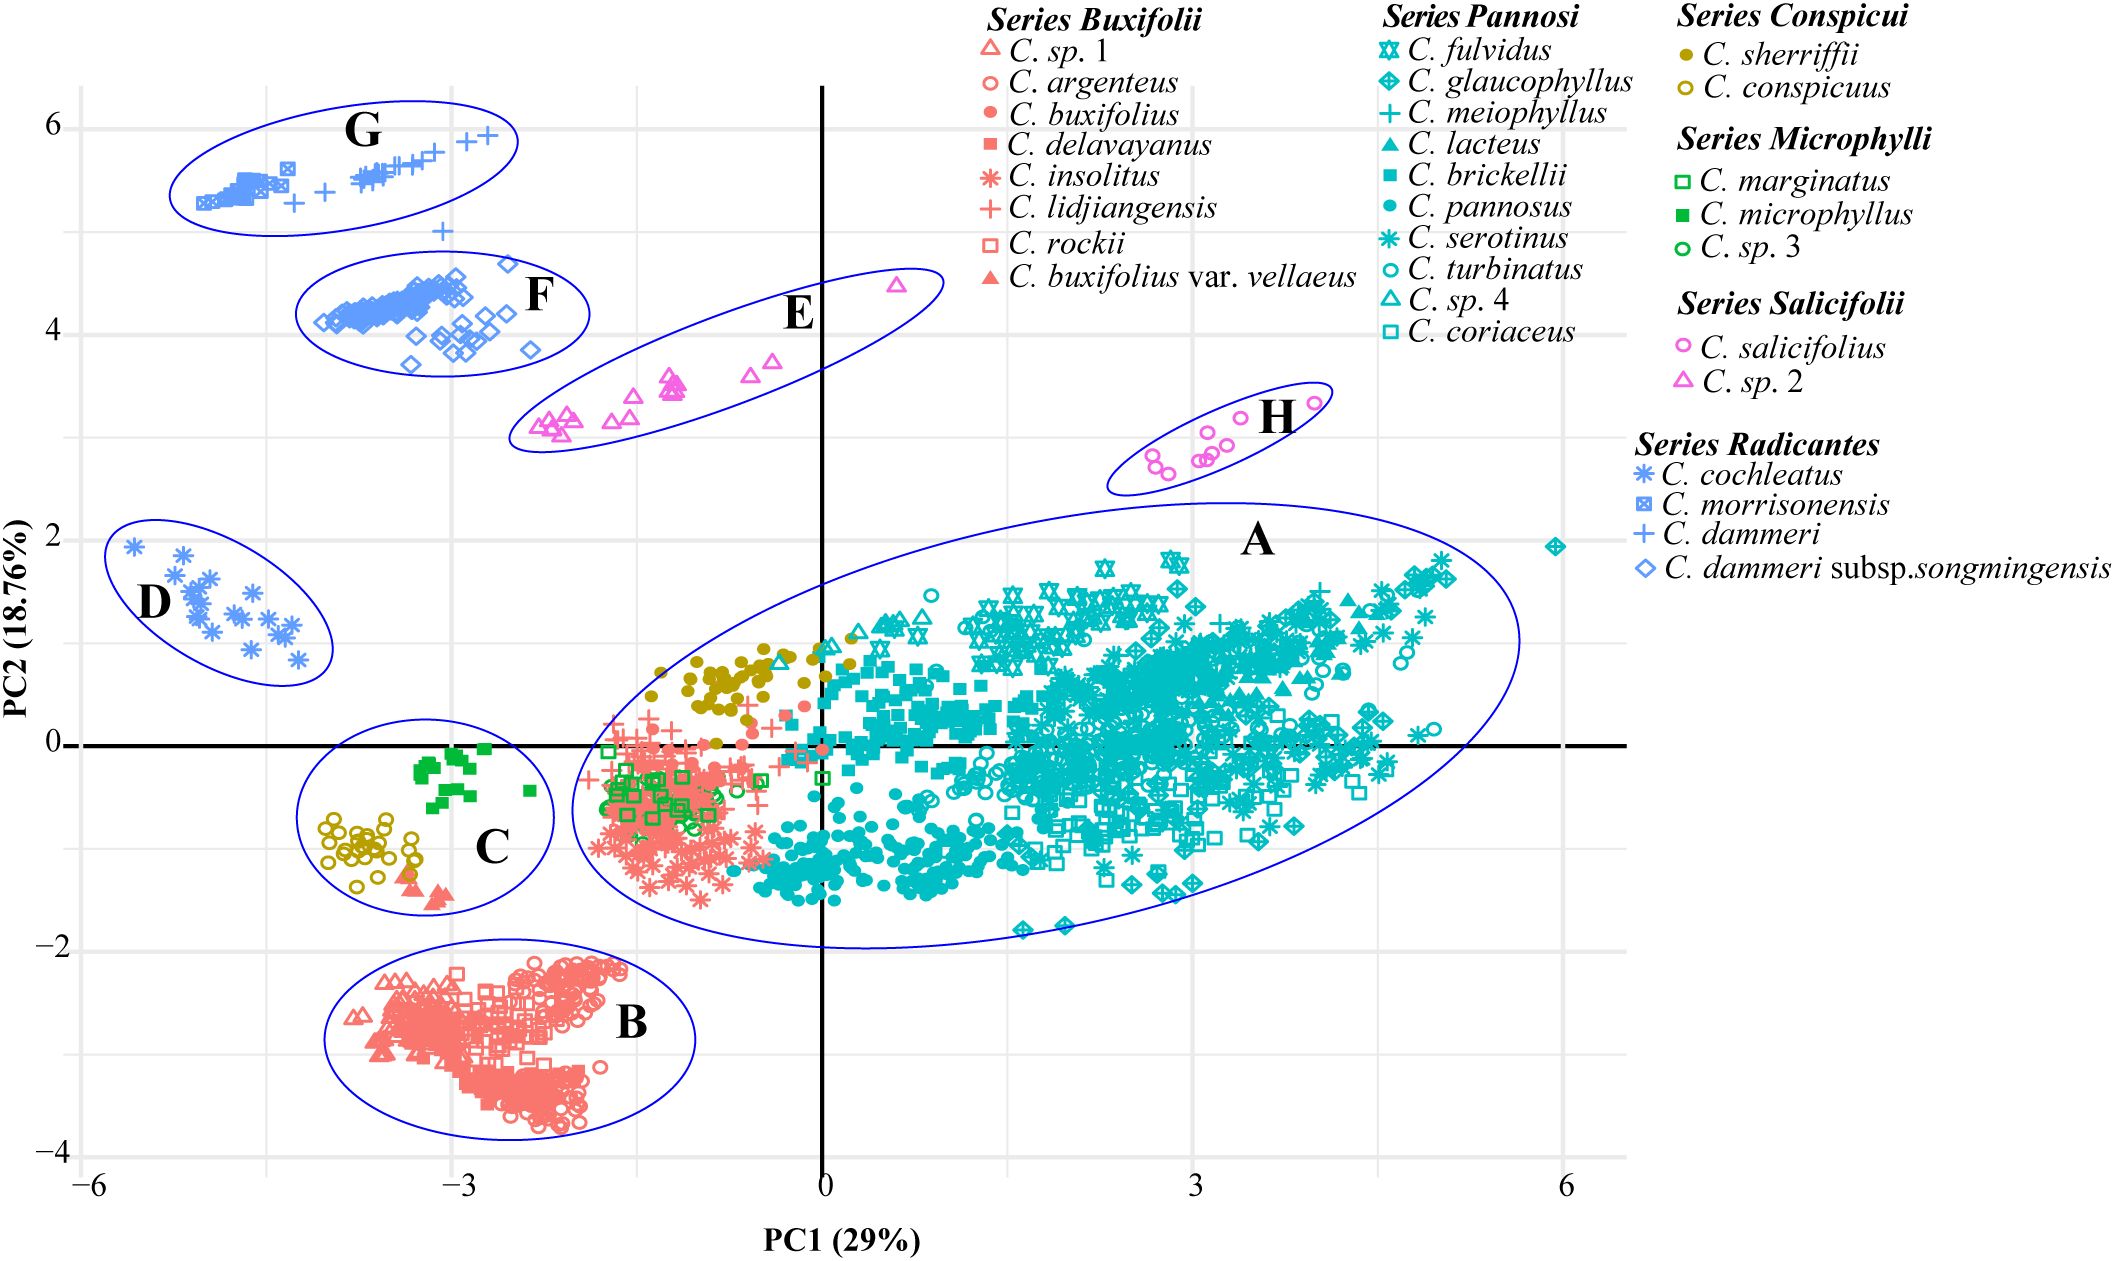
Figure 3. Principal component analysis (PCA) of 43 populations of Cotoneaster buxifolius complex and related taxa based on 22 morphological traits. Six colors denote taxonomic series, with geometric markers differentiating taxa. Clusters are labeled with (A–H) and circles.
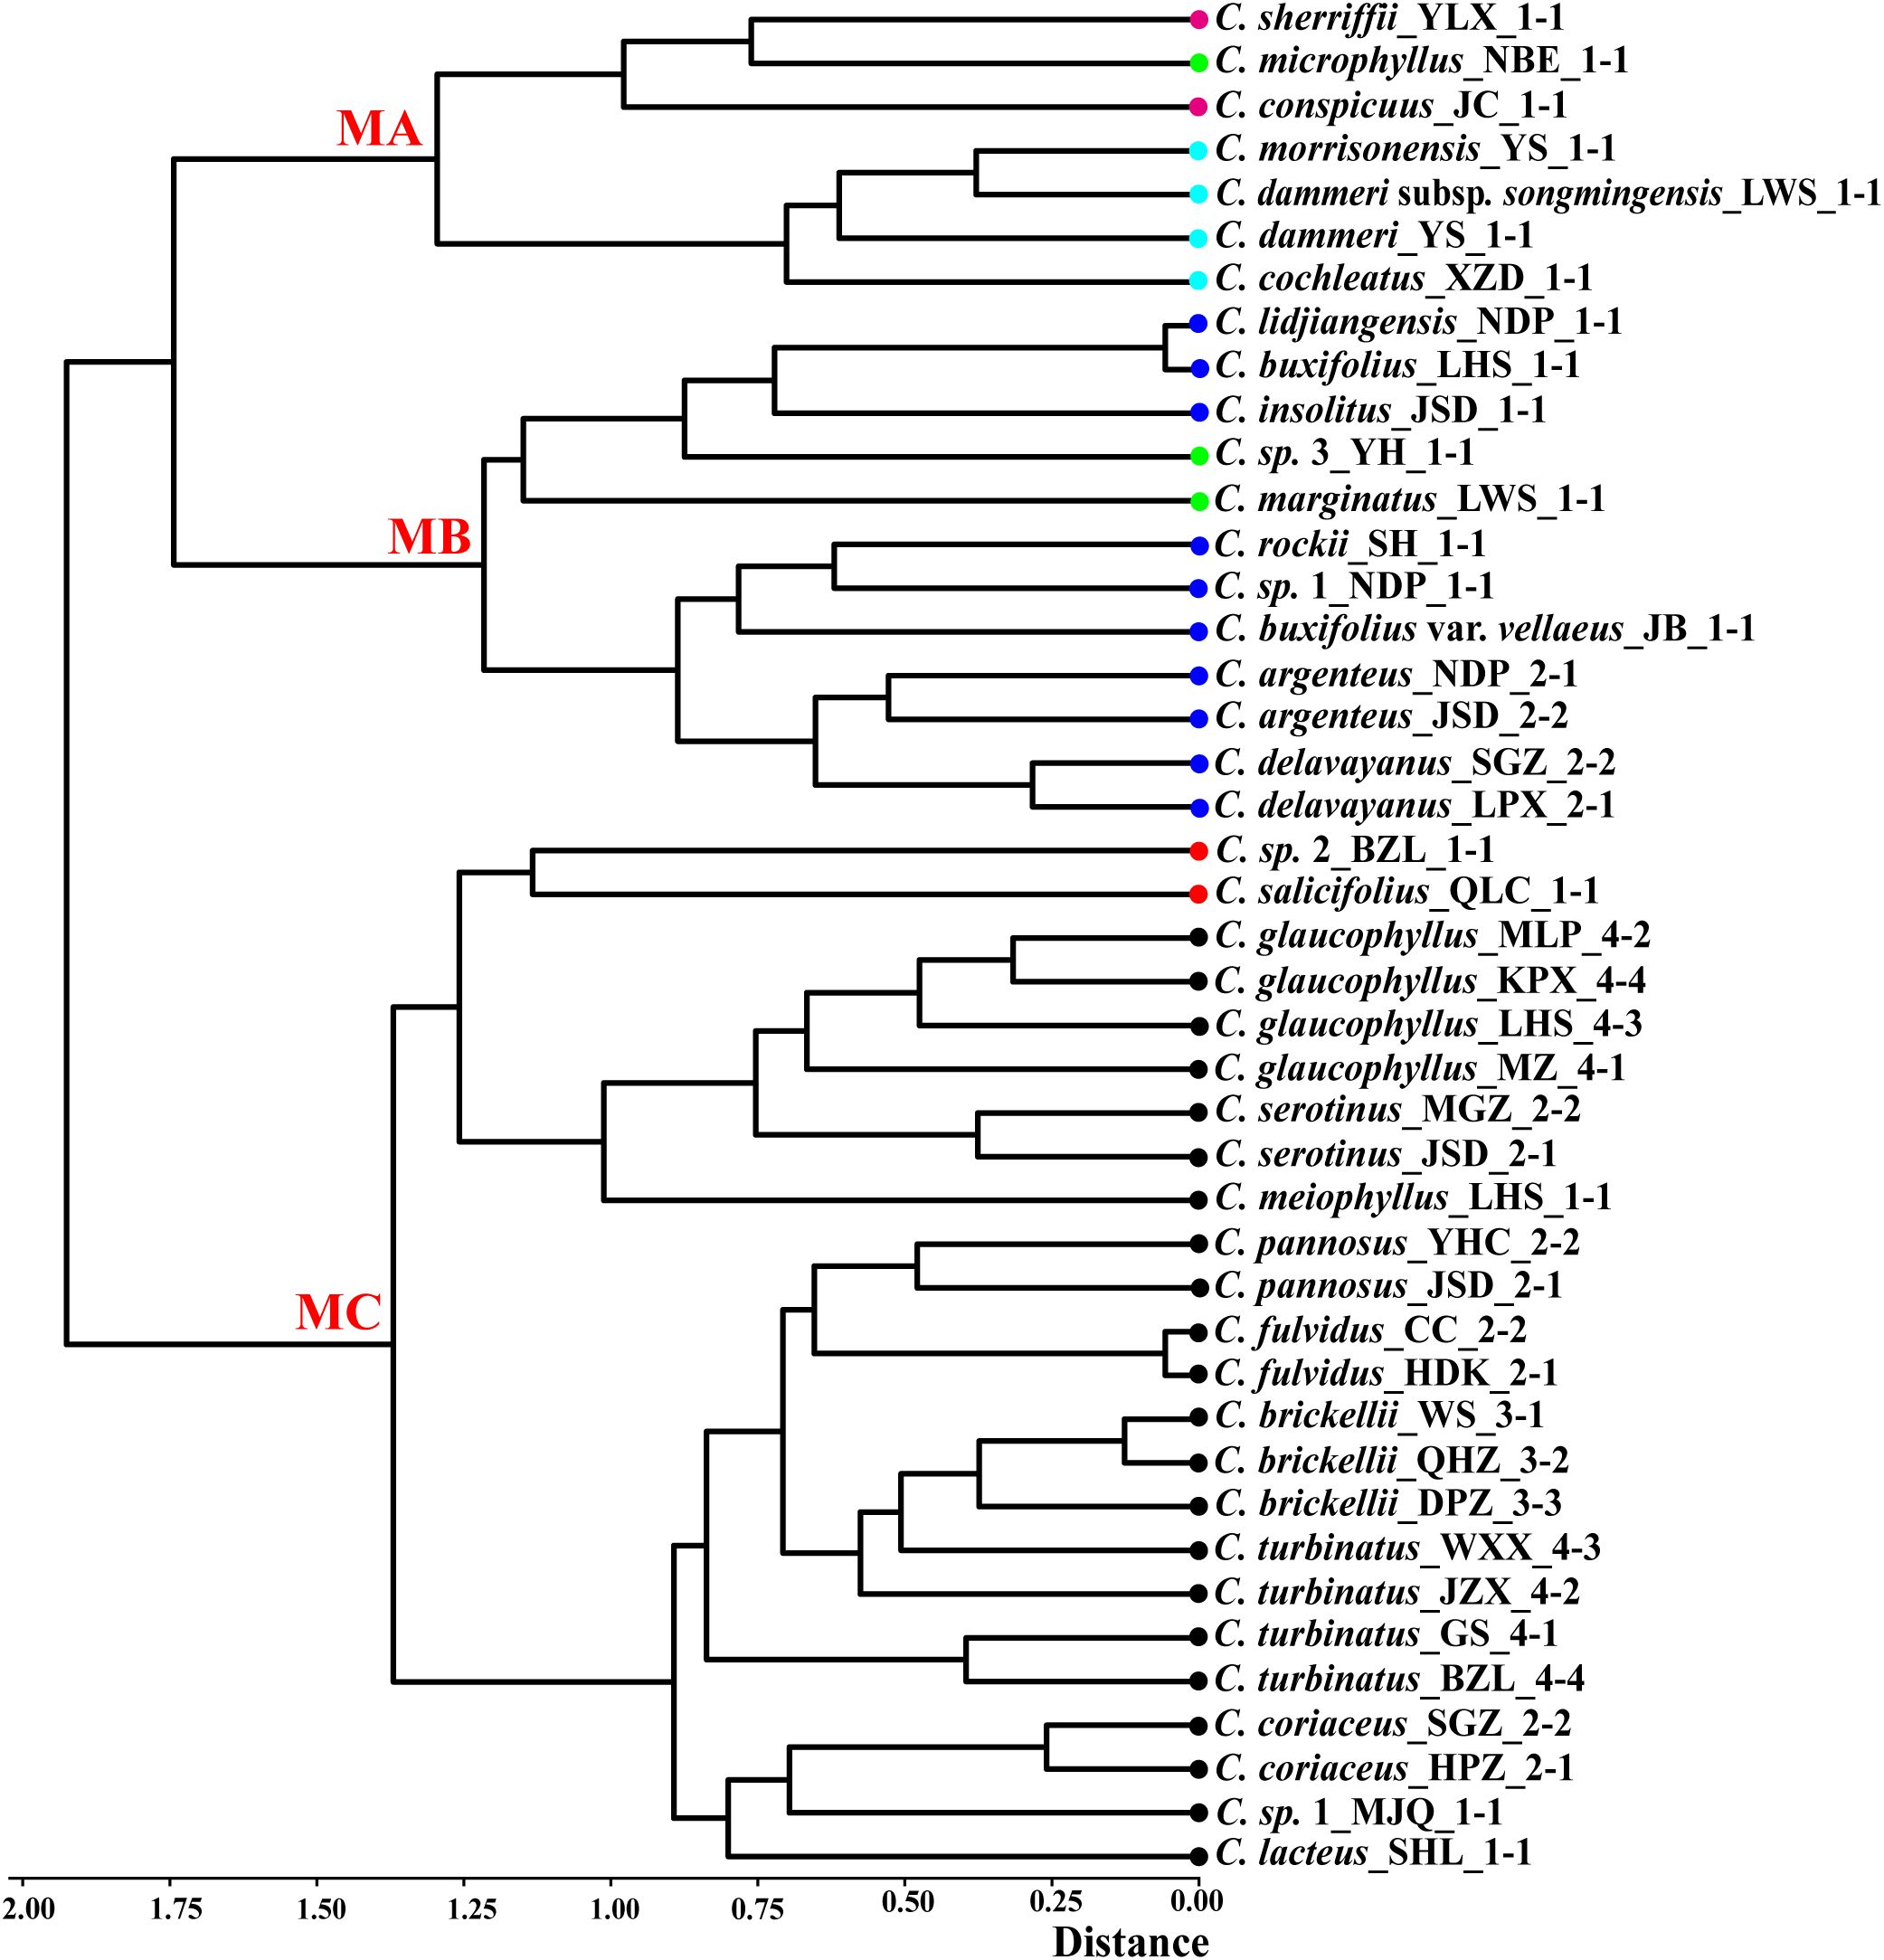
Figure 4. Hierarchical clustering of 43 populations from Cotoneaster buxifolius complex and related taxa based on 20 morphological traits, with major clades labeled MA (morphological group A), MB (morphological group B), and MC (morphological group C). Color dot codes: red = ser. Salicifolii, pink = ser. Conspicui, green = ser. Microphylli, mint blue = ser. Radicantes, blue = ser. Buxifolii, and black = ser. Pannosi.
3.2 Plastid phylogeny
Shallow sequencing produced over 6 Gb per sample, with Guanine-Cytosine (GC) content ranging from 38.42% to 42.47% and Q20 scores surpassing 96%. De novo assembly generated 29 complete circular chloroplast genomes, spanning 159,152 to 159,841 bp in length. Alignment of both NCBI-downloaded and newly assembled chloroplast genomes followed by half-gap region trimming yielded a consensus sequence of 159,394 bp. Using ModelFinder (Kalyaanamoorthy et al., 2017) under the Bayesian information criterion (BIC), the TVM+F+R3 model was identified as the optimal nucleotide substitution model for chloroplast genome phylogenetic reconstruction.
Phylogenetic reconstruction using 93 plastid sequences resolved three primary clades: PA, PB, and PC (Figure 5). Clade PA was predominantly composed of taxa from subgenus Cotoneaster. Within this clade, C. buxifolius var. vellaeus, C. cochleatus, and C. microphyllus formed a fully supported lineage (SH-aLRT/UFboot: 100/100), while C. dammeri was embedded within PA as an independent, maximally supported branch (SH-aLRT/UFboot: 100/100). Clade PB comprised two subclades with strong or moderate phylogenetic support. The first subclade grouped C. glaucophyllus and C. meiophyllus (SH-aLRT/UFboot: 99.8/100). The second subclade contained three lineages: a fully supported monophyletic lineage of Cotoneaster pannosus Franch. (JSD population), C. brickellii (WS population), C. sp. 4, and C. sp. 3 (ser. M; SH-aLRT/UFboot: 100/100); a distinct lineage comprising C. dammeri subsp. songmingensis, C. morrisonensis, and C. marginatus (SH-aLRT/UFboot: 99.4/100); and an independent branch formed by C. salicifolius (SH-aLRT/UFboot: 100/100). Clade PC exhibited polyphyletic structuring of ser. P intermingled with other series. At its base, a moderately supported lineage (SH-aLRT/UFboot: 90.8/95) included Cotoneaster fulvidus (W. W. Sm.) G. Klotz, C. serotinus, Cotoneaster turbinatus Craib (GS population), and C. sp. 2. The majority of ser. P taxa formed a monophyletic group (SH-aLRT/UFboot: 99.9/100) sister to the primary ser. B lineage, which itself was monophyletic except for the exclusion of C. insolitus and C. buxifolius var. vellaeus. C. conspicuus was resolved as basal to clade PC. Taxa from ser. C, R, M, and S showed no monophyletic clustering across the phylogeny.
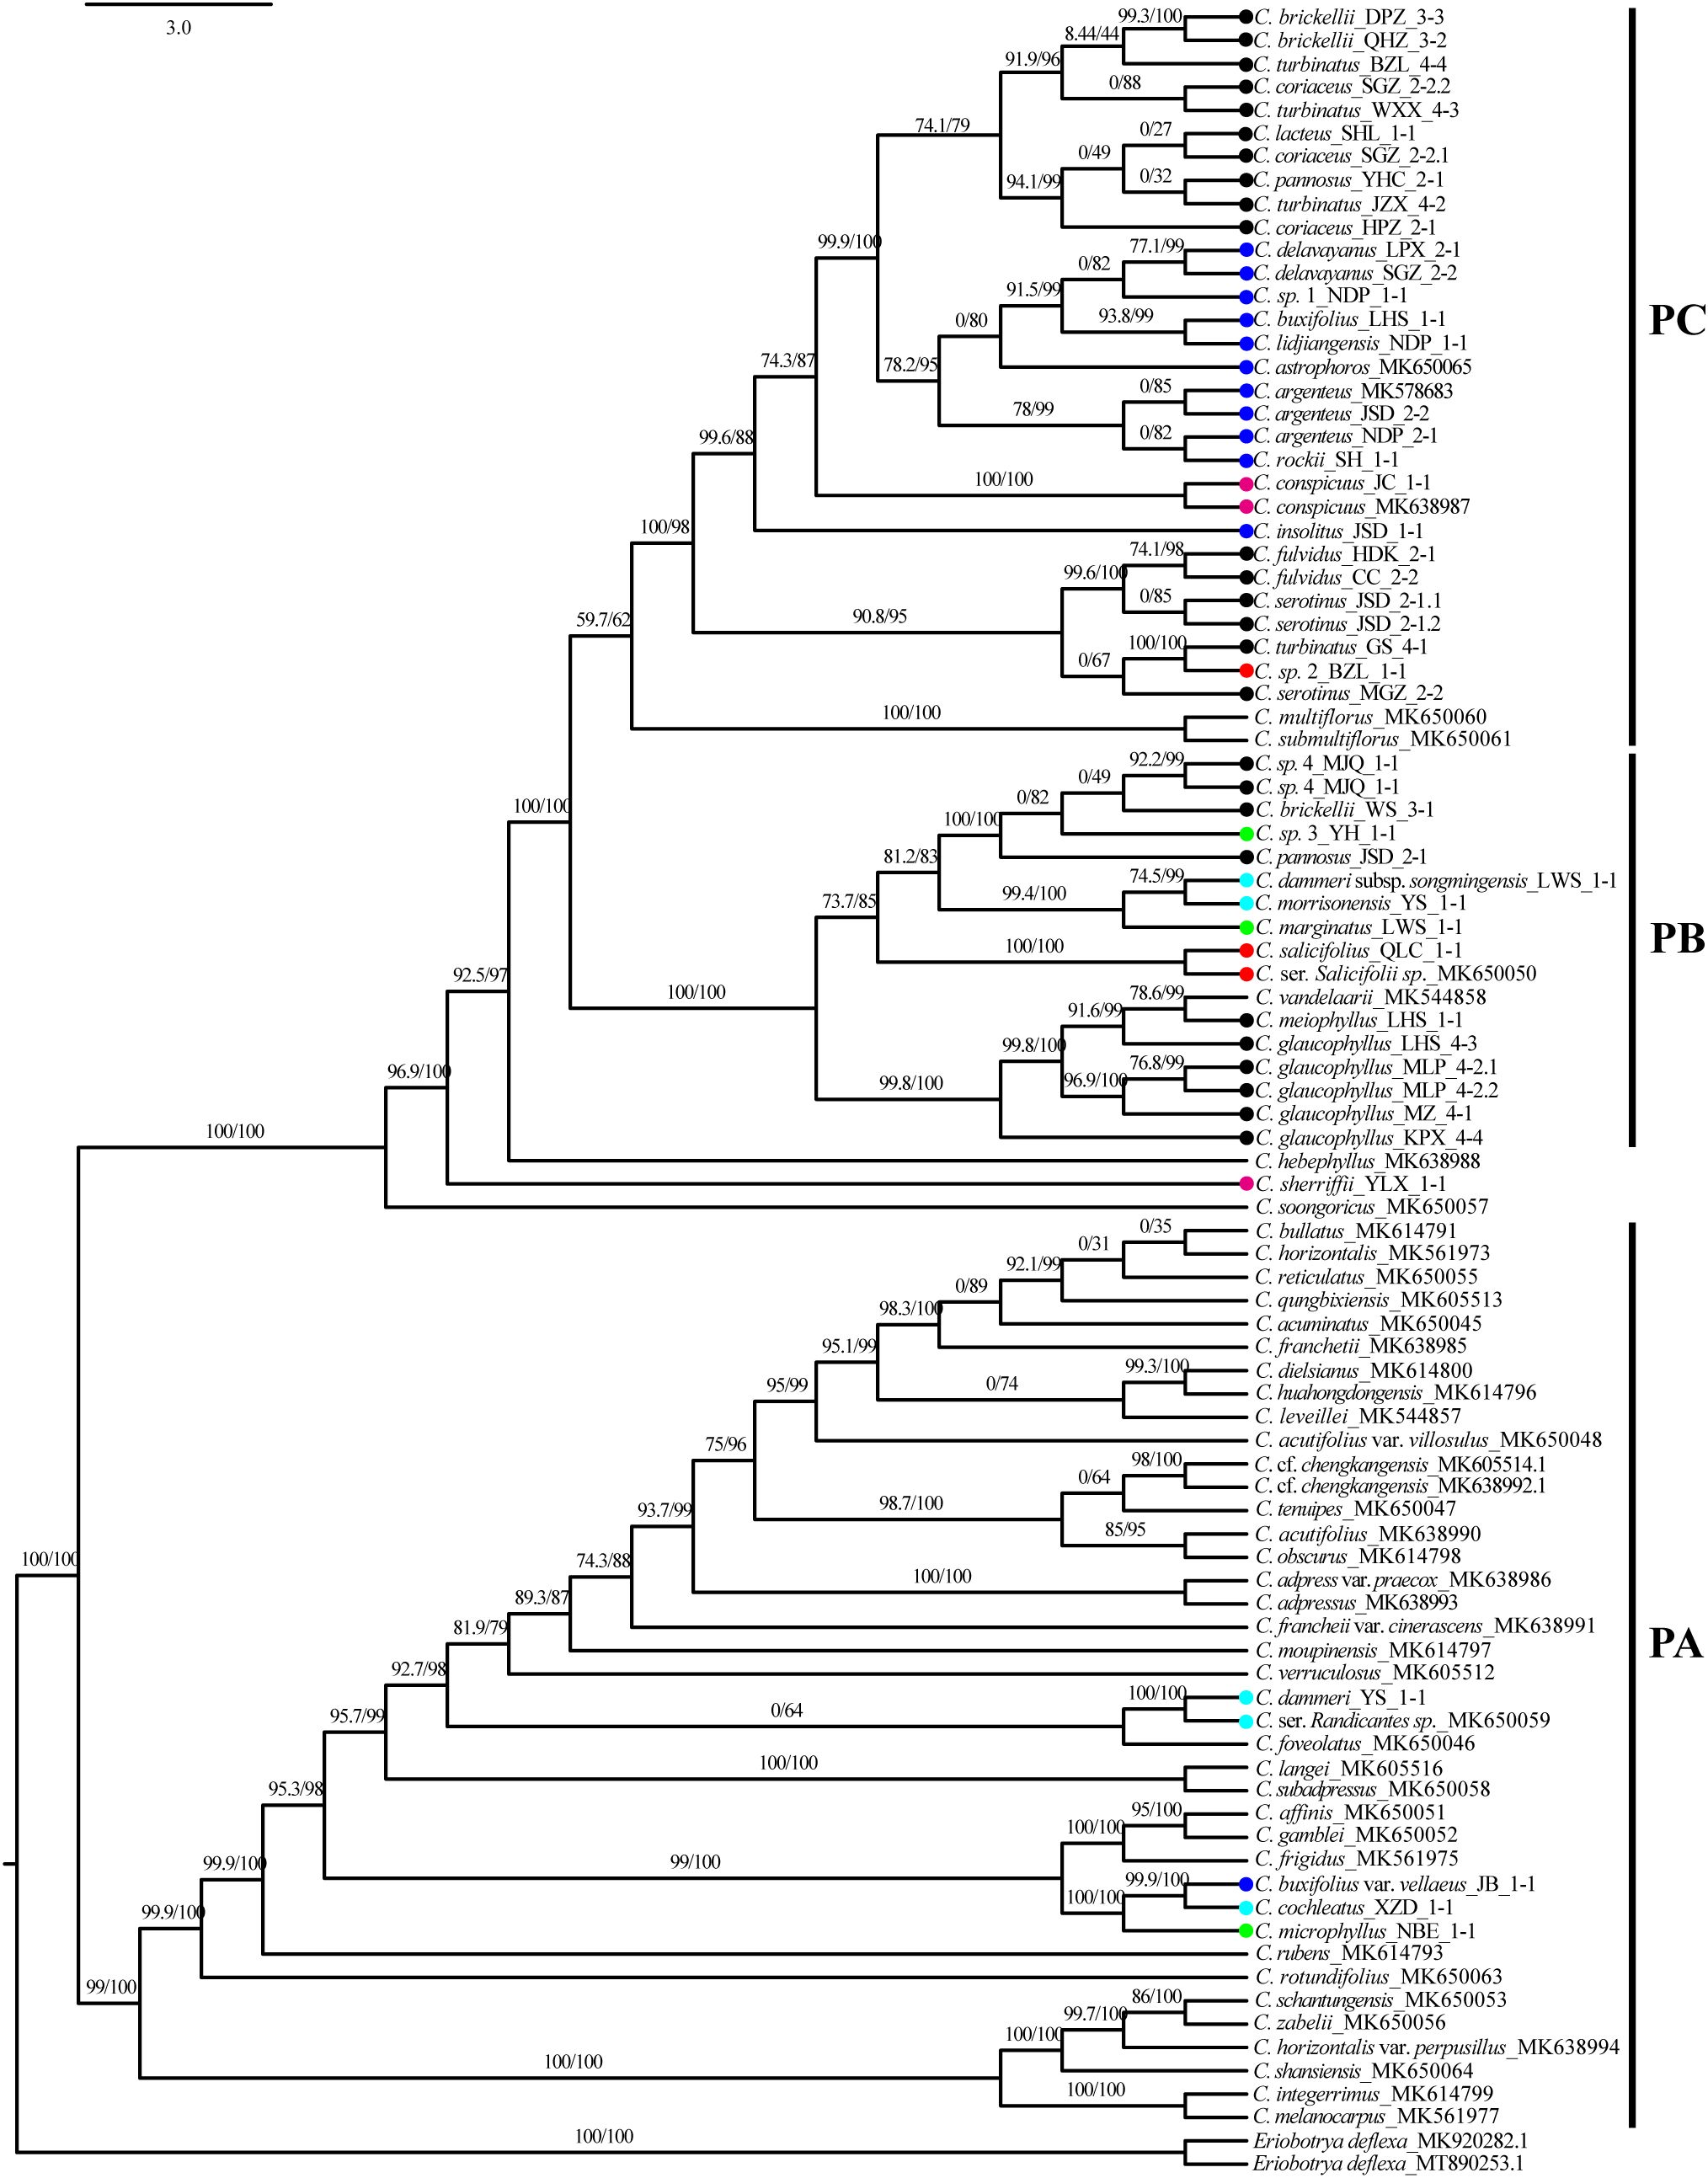
Figure 5. Chloroplast phylogenetic tree, SH-aLRT, and UFboot values shown above the branches, with main clades marked as PA (plastid clade A), PB (plastid clade B), and PC (plastid clade C). Color dot codes: red = ser. Salicifolii, pink = ser. Conspicui, green = ser. Microphylli, mint blue = ser. Radicantes, blue = ser. Buxifolii, and black = ser. Pannosi. SH-aLRT, Shimodaira–Hasegawa approximate likelihood ratio test; UFboot, ultrafast bootstrap.
3.3 Phylogenetic tree based on RAD-seq
Initial variant calling through GATK identified 9,855,426 raw SNPs. These variants underwent rigorous filtering (minor allele count ≥ 3, minor allele frequency ≥ 5%, and genotype completeness ≥ 85%), resulting in 534,022 high-confi dence SNPs. From this filtered dataset, 89,769 4D sites were extracted, and LD pruning further refined the dataset to 100% complete 40,569 unlinked 4D sites.
Maximum likelihood phylogenetic analysis based on the 89,769 4D sites resolved three primary clades (NA, NB, and NC) with robust support, as evidenced by high SH-aLRT and UFboot values for most major clades with SH-aLRT ≥ 80% and UFboot ≥ 95% (Figure 6). Individuals from the same population predominantly formed monophyletic clusters. Clade NA comprised two taxa of ser. C, four taxa from ser. B (C. rockii, C. sp. 1, C. buxifolius var. vellaeus, and C. insolitus), and two taxa from ser. M (C. marginatus and C. microphyllus). Clade NB consisted of three ser. B taxa (C. buxifolius, C. lidjiangensis, and C. argenteus), three ser. P taxa (C. glaucophyllus, C. meiophyllus, and C. serotinus), four taxa of ser. R, and C. salicifolius from ser. S. Clade NC encompassed predominantly ser. P taxa (C. sp. 4, C. brickellii, C. pannosus, C. turbinatus, C. coriaceus, C. lacteus, and C. fulvidus), along with C. delavayanus from ser. B and C. sp. 3 from ser. M. Notably, ser. M, ser. B, and ser. P exhibited polyphyletic distributions across the phylogeny. Additionally, the two C. pannosus populations failed to form a monophyletic group despite the high overall support for major clades.
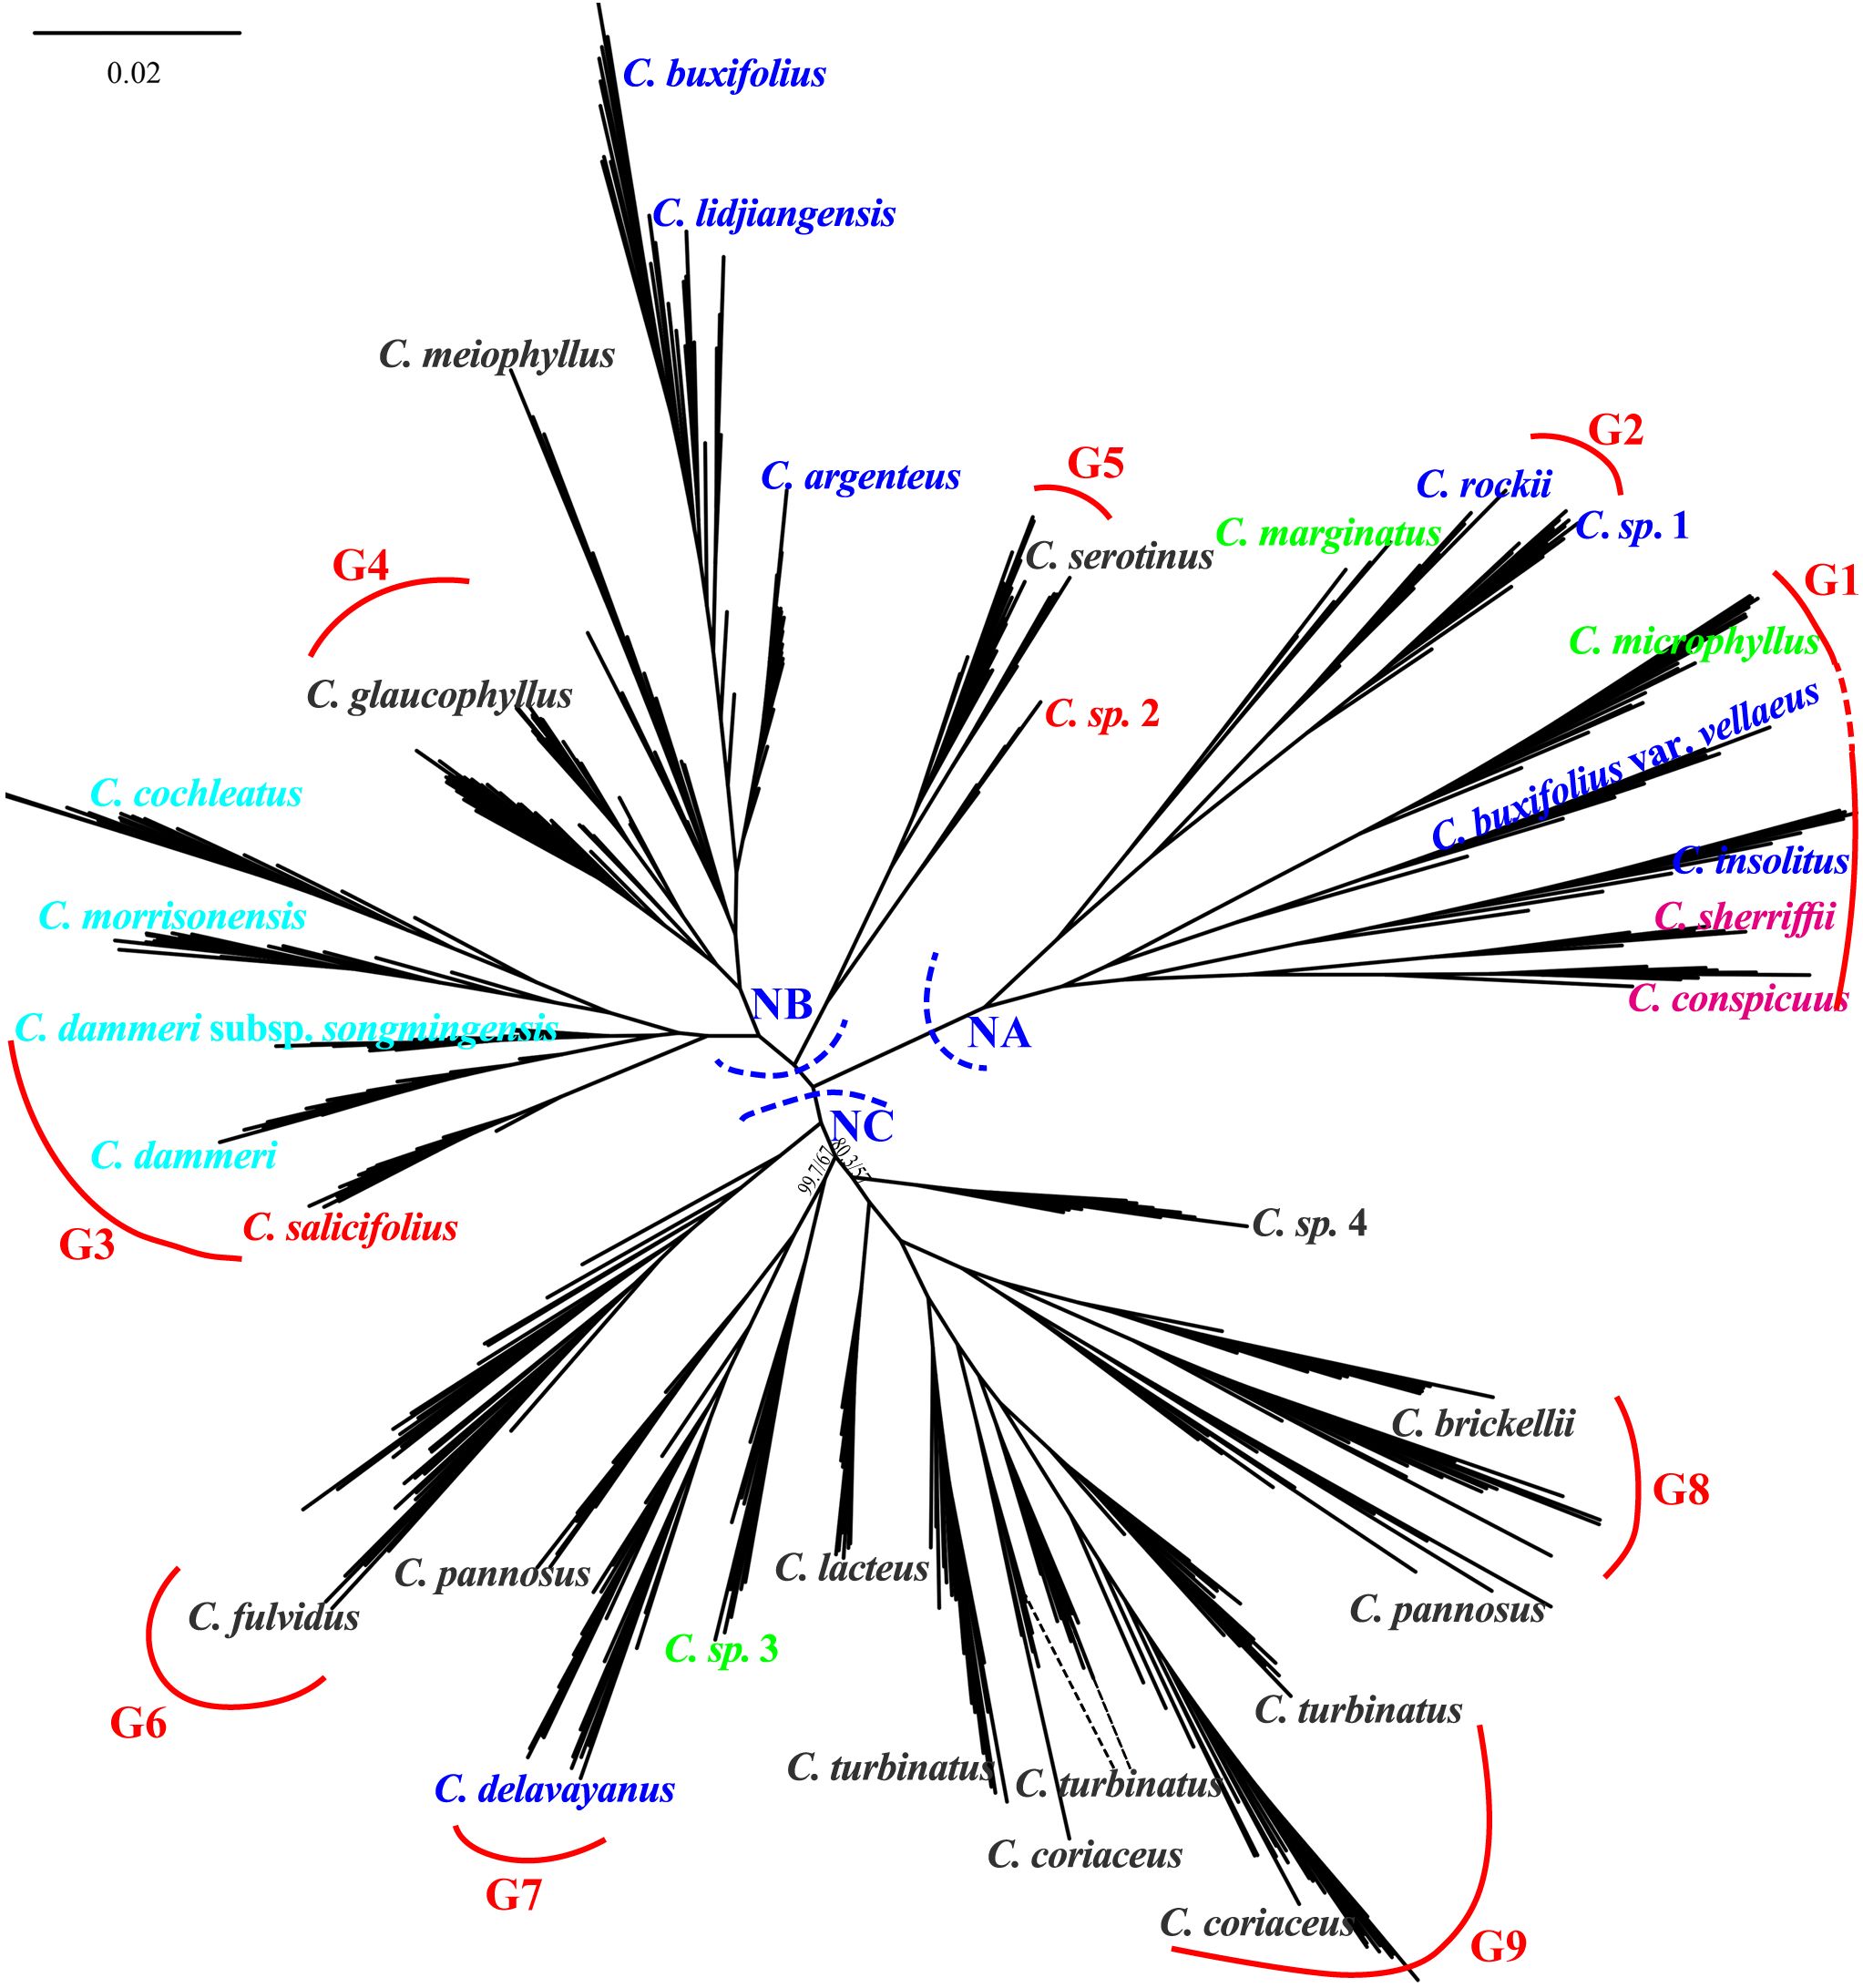
Figure 6. Unrooted phylogenetic tree constructed using 4D sites, with major clades labeled NA (nuclear clade A), NB (nuclear clade B), and NC (nuclear clade C). Main branches are supported by SH-aLRT ≥ 80% and UFboot ≥ 95% unless otherwise indicated. G1 to G9 represent species with independent gene pools at admixture analysis K = 9. Color taxon name codes: red = ser. Salicifolii, pink = ser. Conspicui, green = ser. Microphylli, mint blue = ser. Radicantes, blue = ser. Buxifolii, and black = ser. Pannosi. 4D, fourfold degenerate; SH-aLRT, Shimodaira–Hasegawa approximate likelihood ratio test; UFboot, ultrafast bootstrap.
3.4 Population genomic analysis
Population genetic structure analysis using the Admixture software revealed dynamic clustering patterns across K values. The cross-validation error stabilized at K = 9 and reached its minimum at K = 19 (Supplementary Figure S3). At K = 9, nine distinct genetic clusters were identified: 14 species exhibited near-exclusive ancestry (> 95% assignment to single clusters), except for C. fulvidus (> 70% cluster purity), while the remaining taxa displayed admixture from two or more gene pools (Figure 7). Mapping these clusters onto the nuclear phylogeny demonstrated spatial congruence: gene pools G1 and G2 localized predominantly within clade NA; G3, G4, and G5 were primarily located in clade NB; and G6 through G9 were distributed within clade NC. At K = 19, five species (C. marginatus, C. insolitus, C. pannosus, C. sp. 1, and C. lacteus) still maintained genetic admixture of two or more gene pools, while five pairs of taxa shared identical cluster assignments: C. conspicuus and C. sherriffii, C. dammeri subsp. songmingensis and C. dammeri, C. morrisonensis and C. cochleatus, C. buxifolius and C. lidjiangensis, and C. serotinus and C. sp. 2. Furthermore, seven species, C. microphyllus, C. rockii, C. sp. 1, C. salicifolius, C. meiophyllus, C. argenteus, and C. coriaceus, formed a novel gene pool separately.
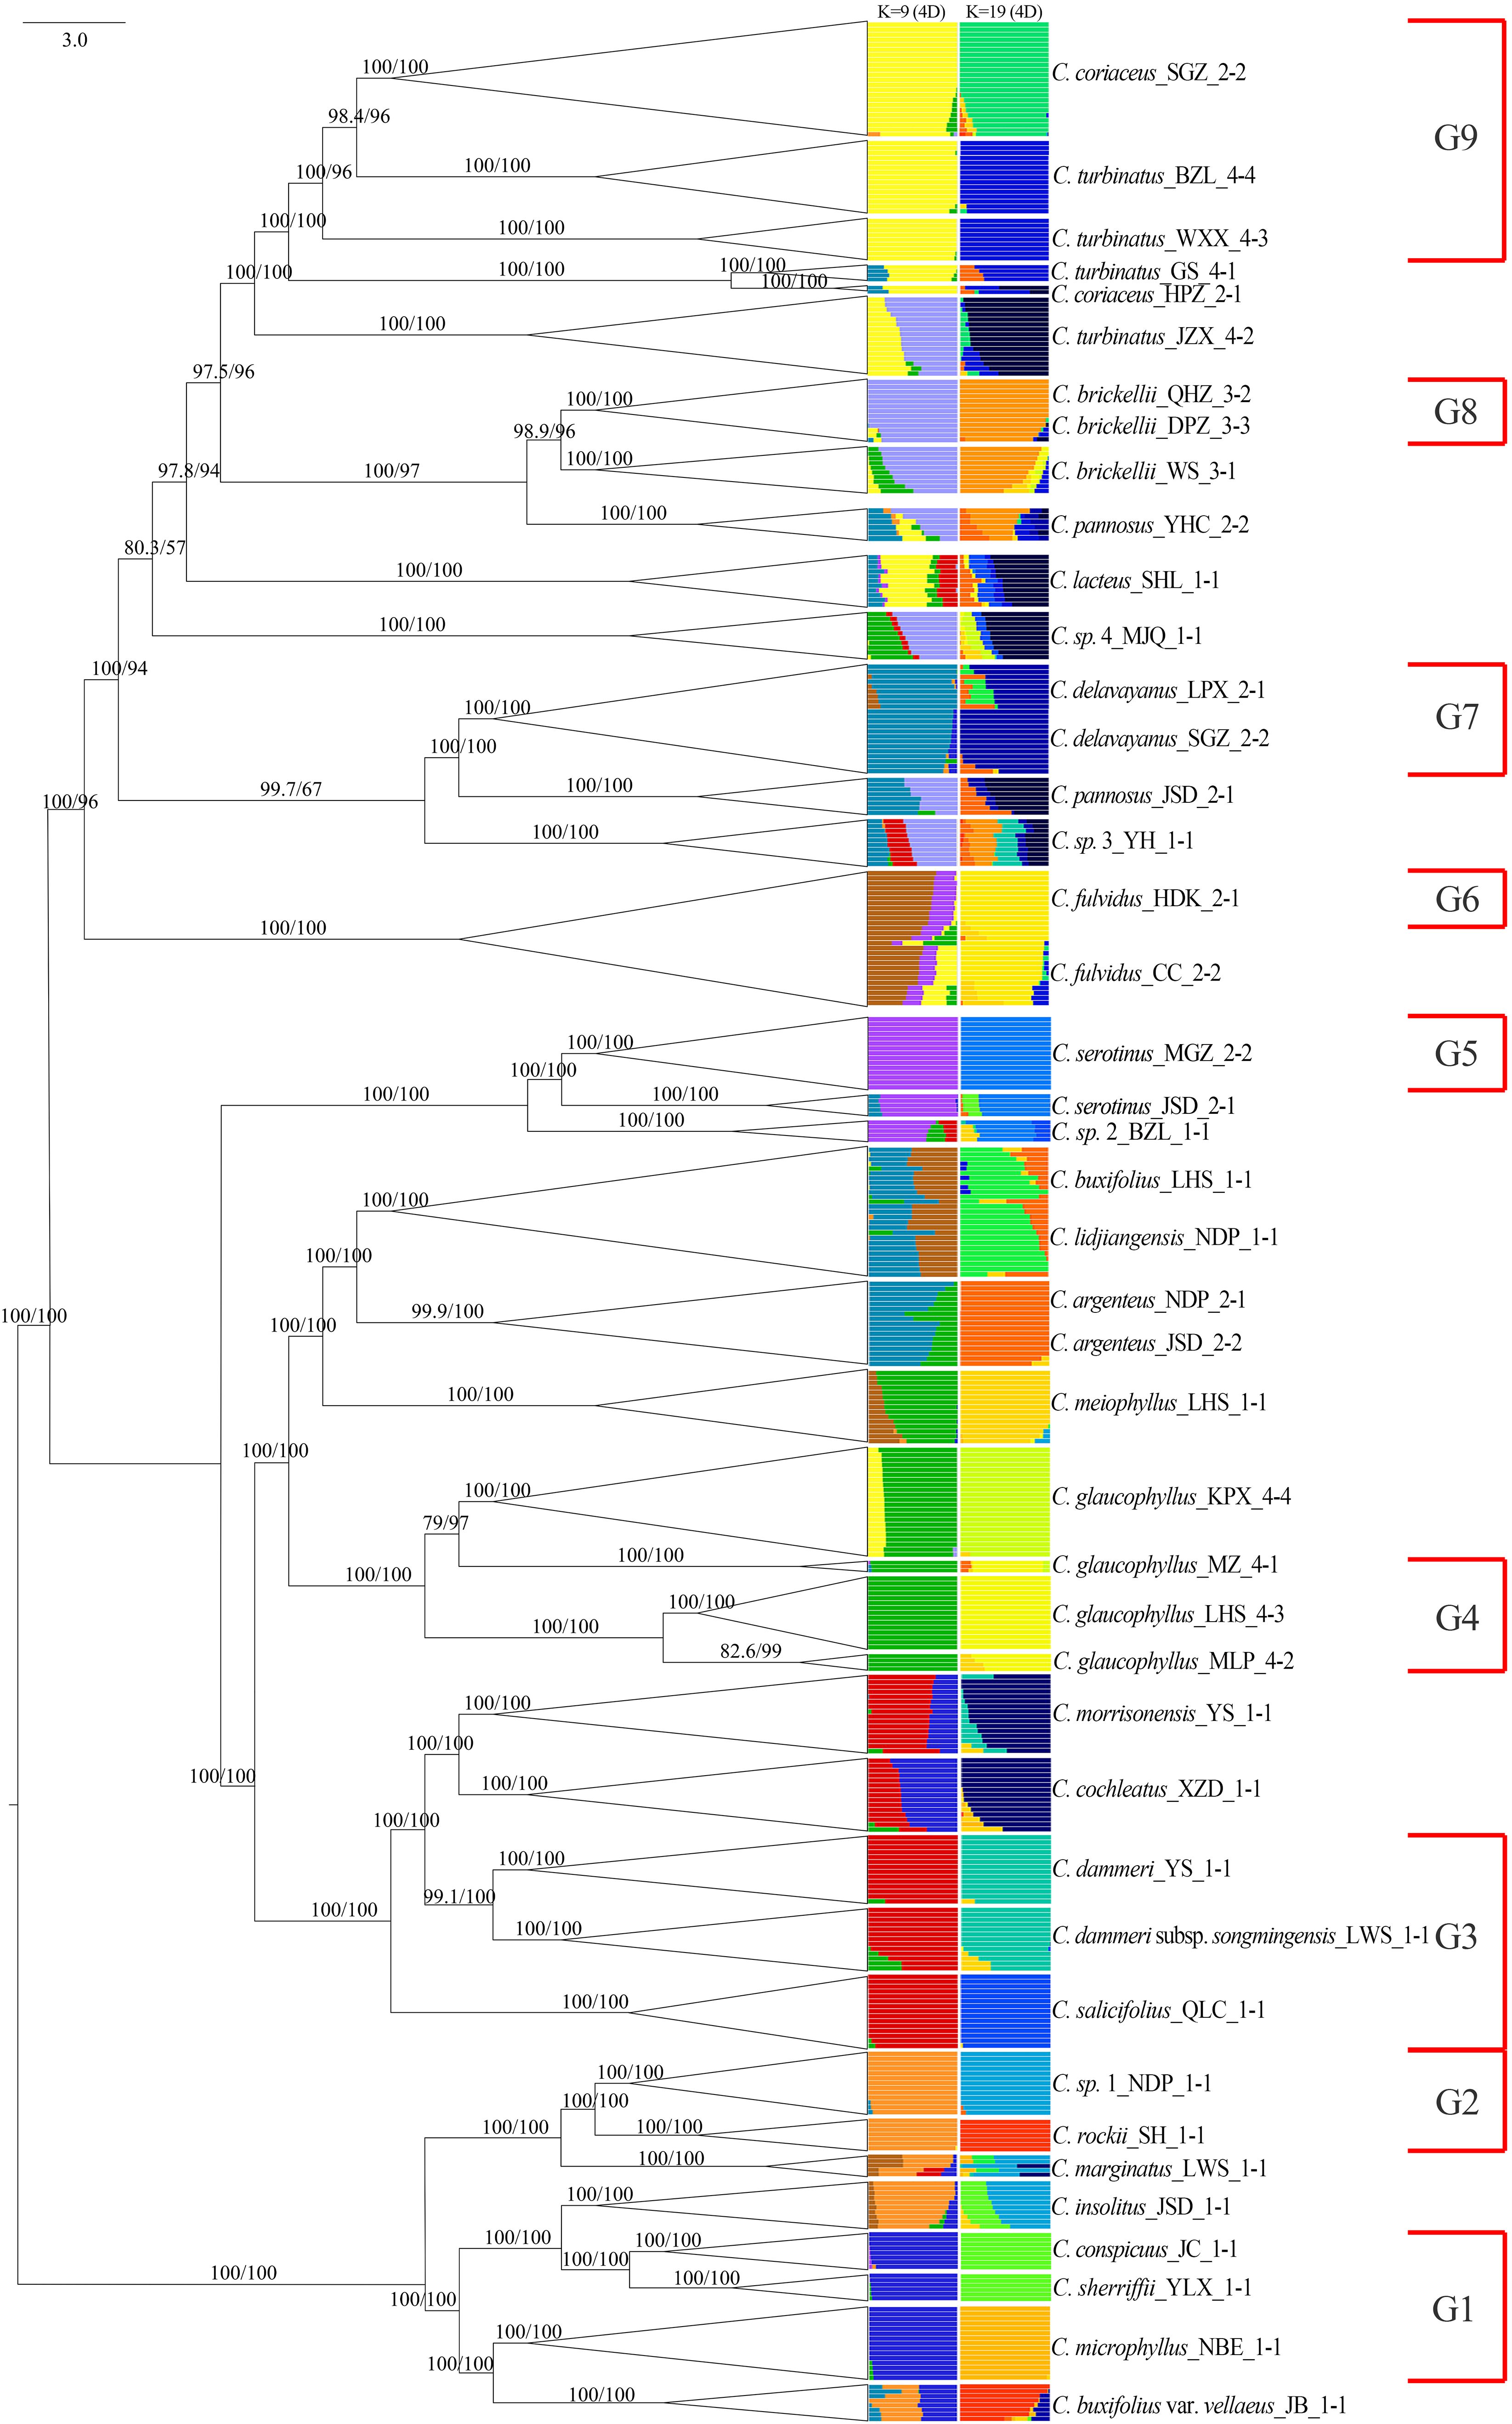
Figure 7. Admixture results (K = 9 and 19) using unlinked 4D sites combined with the phylogenetic tree constructed. G1 to G9 represent species with independent gene pools at admixture analysis K = 9. 4D, fourfold degenerate.
The PCA of 458 individuals (Figure 8) showed partial species differentiation, such as C. microphyllus, C. rockii, and C. sp. 1, although a clear and distinct pattern was not fully established. The distribution of the 14 species representing gene pools G1 to G9 exhibited structured spatial relationships: G8 and G9 demonstrated close proximity, G3 and G4 formed a tightly clustered group, G5–G7 occupied central positions, and G1 and G2 were peripherally distributed. Notably, certain taxa exhibited displayed near-identical genetic profiles in PCA space, as exemplified by C. conspicuus–C. sherriffii and C. dammeri–C. dammeri subsp. songmingensis.
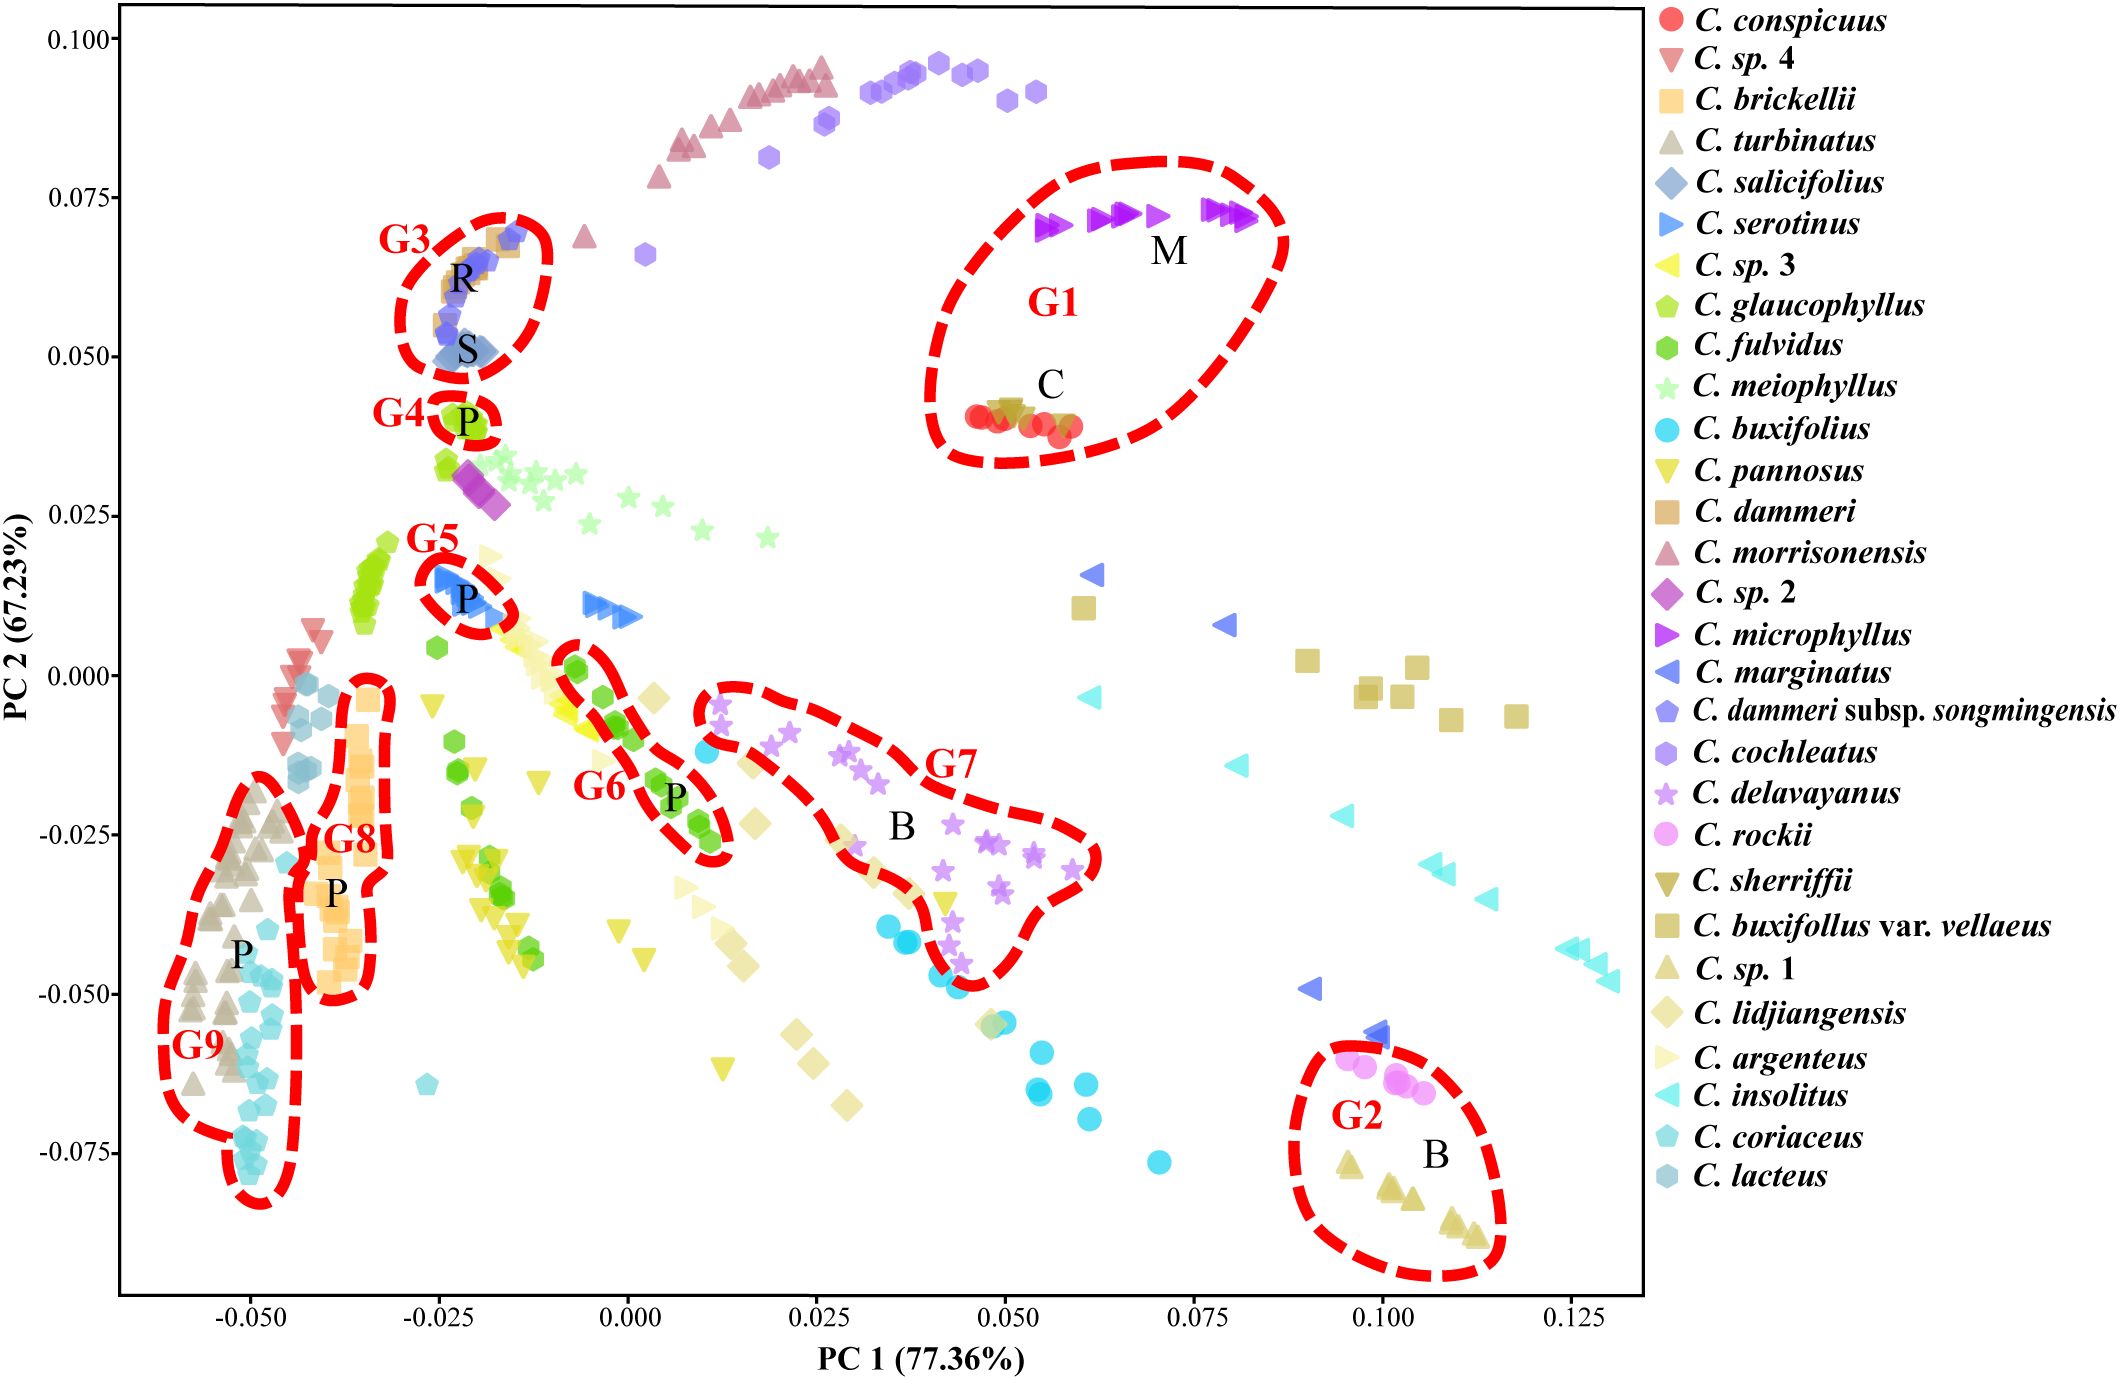
Figure 8. Principal component analysis (PCA) of 43 populations from Cotoneaster buxifolius complex and related taxa based on 85% completeness SNPs, with nine gene pools, G1 to G9, marked by circles. SNPs, single-nucleotide polymorphisms.
3.5 Cytonuclear conflict in phylogenetic trees
Comparative analysis of plastid and nuclear phylogenies revealed cytonuclear discordance in 18 populations spanning 16 species (Figure 9). Among the eight populations in the nuclear clade NA, C. marginatus was assigned to the plastid clade PB, while C. rockii, C. sp. 1, C. insolitus, and C. conspicuus grouped within the plastid clade PC. Of the 17 populations in nuclear clade NB, C. cochleatus and C. dammeri were placed in the plastid clade PA, whereas seven populations of C. serotinus, C. sp. 2, C. argenteus, C. buxifolius, and C. lidjiangensis resided in the plastid clade PC. In the nuclear clade NC (18 populations), C. brickellii (WS), C. pannosus (JSD), C. sp. 3, and C. sp. 4 clustered in the plastid clade PB. Furthermore, three of the 14 species representing nine gene pools, C. dammeri, C. conspicuus, and C. sp. 1, maintained cytonuclear discordance even after the exclusion of putative hybrids (Figure 9).
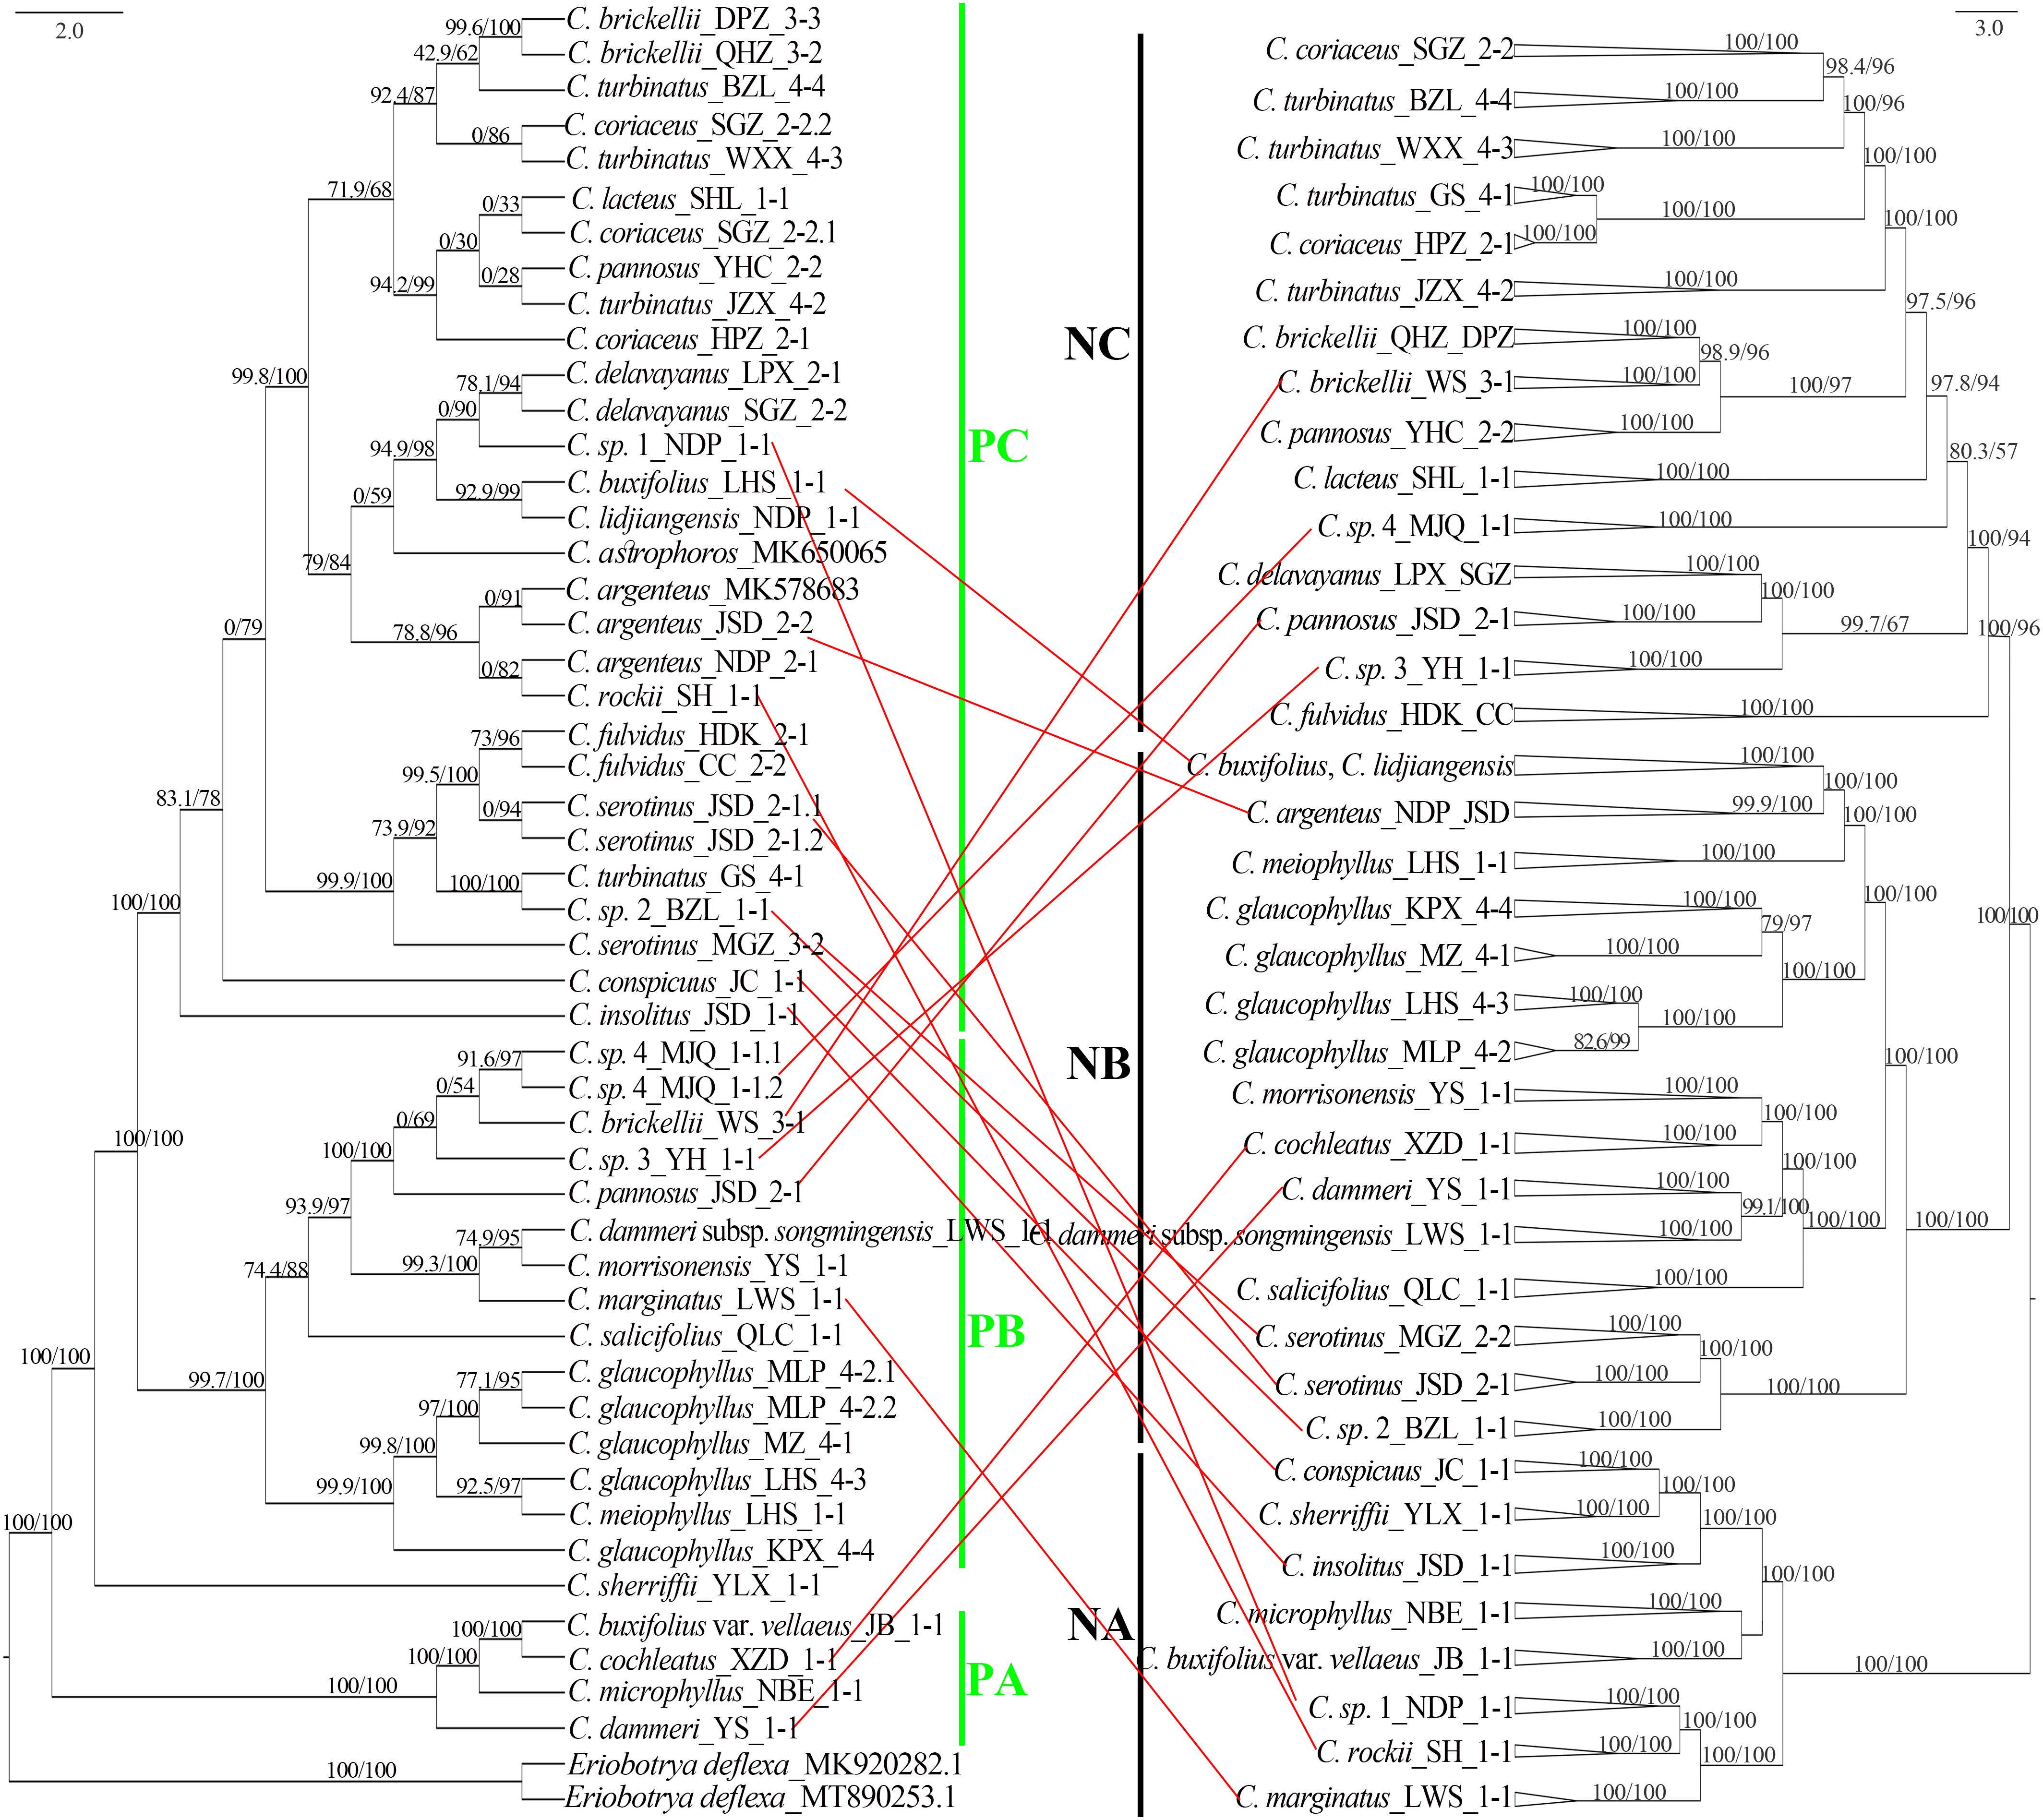
Figure 9. Chloroplast genome tree (left: plastid clades PA–PC) and 4D site-based phylogenetic tree (right: nuclear clades NA–NC), with SH-aLRT and UFboot values marked above the branches. Red lines highlight nuclear–plastid discordance (topological conflicts between plastid and nuclear trees). 4D, fourfold degenerate; SH-aLRT, Shimodaira–Hasegawa approximate likelihood ratio test; UFboot, ultrafast bootstrap.
3.6 Phylogenetic tree reconstruction after removing putative hybrids
Integrating admixture results (K = 9) with nuclear phylogenetic relationships, we reconstructed a maximum likelihood phylogeny for 20 genetically non-admixed populations representing nine gene pools (Figure 10). In this tree, clade NA encompassed three species representing gene pool G1: C. conspicuus and C. sherriffii (ser. C), and C. microphyllus (ser. M; Figure 10). Clade NB united C. salicifolius (ser. S; G3), C. glaucophyllus (ser. P; G4), C. dammeri, and C. dammeri subsp. songmingensis (ser. R; G4). Clade NC exhibited a complex hierarchical structure, incorporating five ser. P and three ser. B taxa. Gene pools G8 (C. brickellii) and G9 (C. turbinatus and C. coriaceus) formed a monophyletic group that subsequently diverged from the sister gene pools G2 (C. rockii and C. sp. 1) and G7 (C. delavayanus) and later clustered with the monophyletic group comprising G5 (C. serotinus) and G6 (C. fulvidus). All terminal clades corresponding to single taxonomic units received strong nodal support (SH-aLRT ≥ 80% and UFboot ≥ 95%).
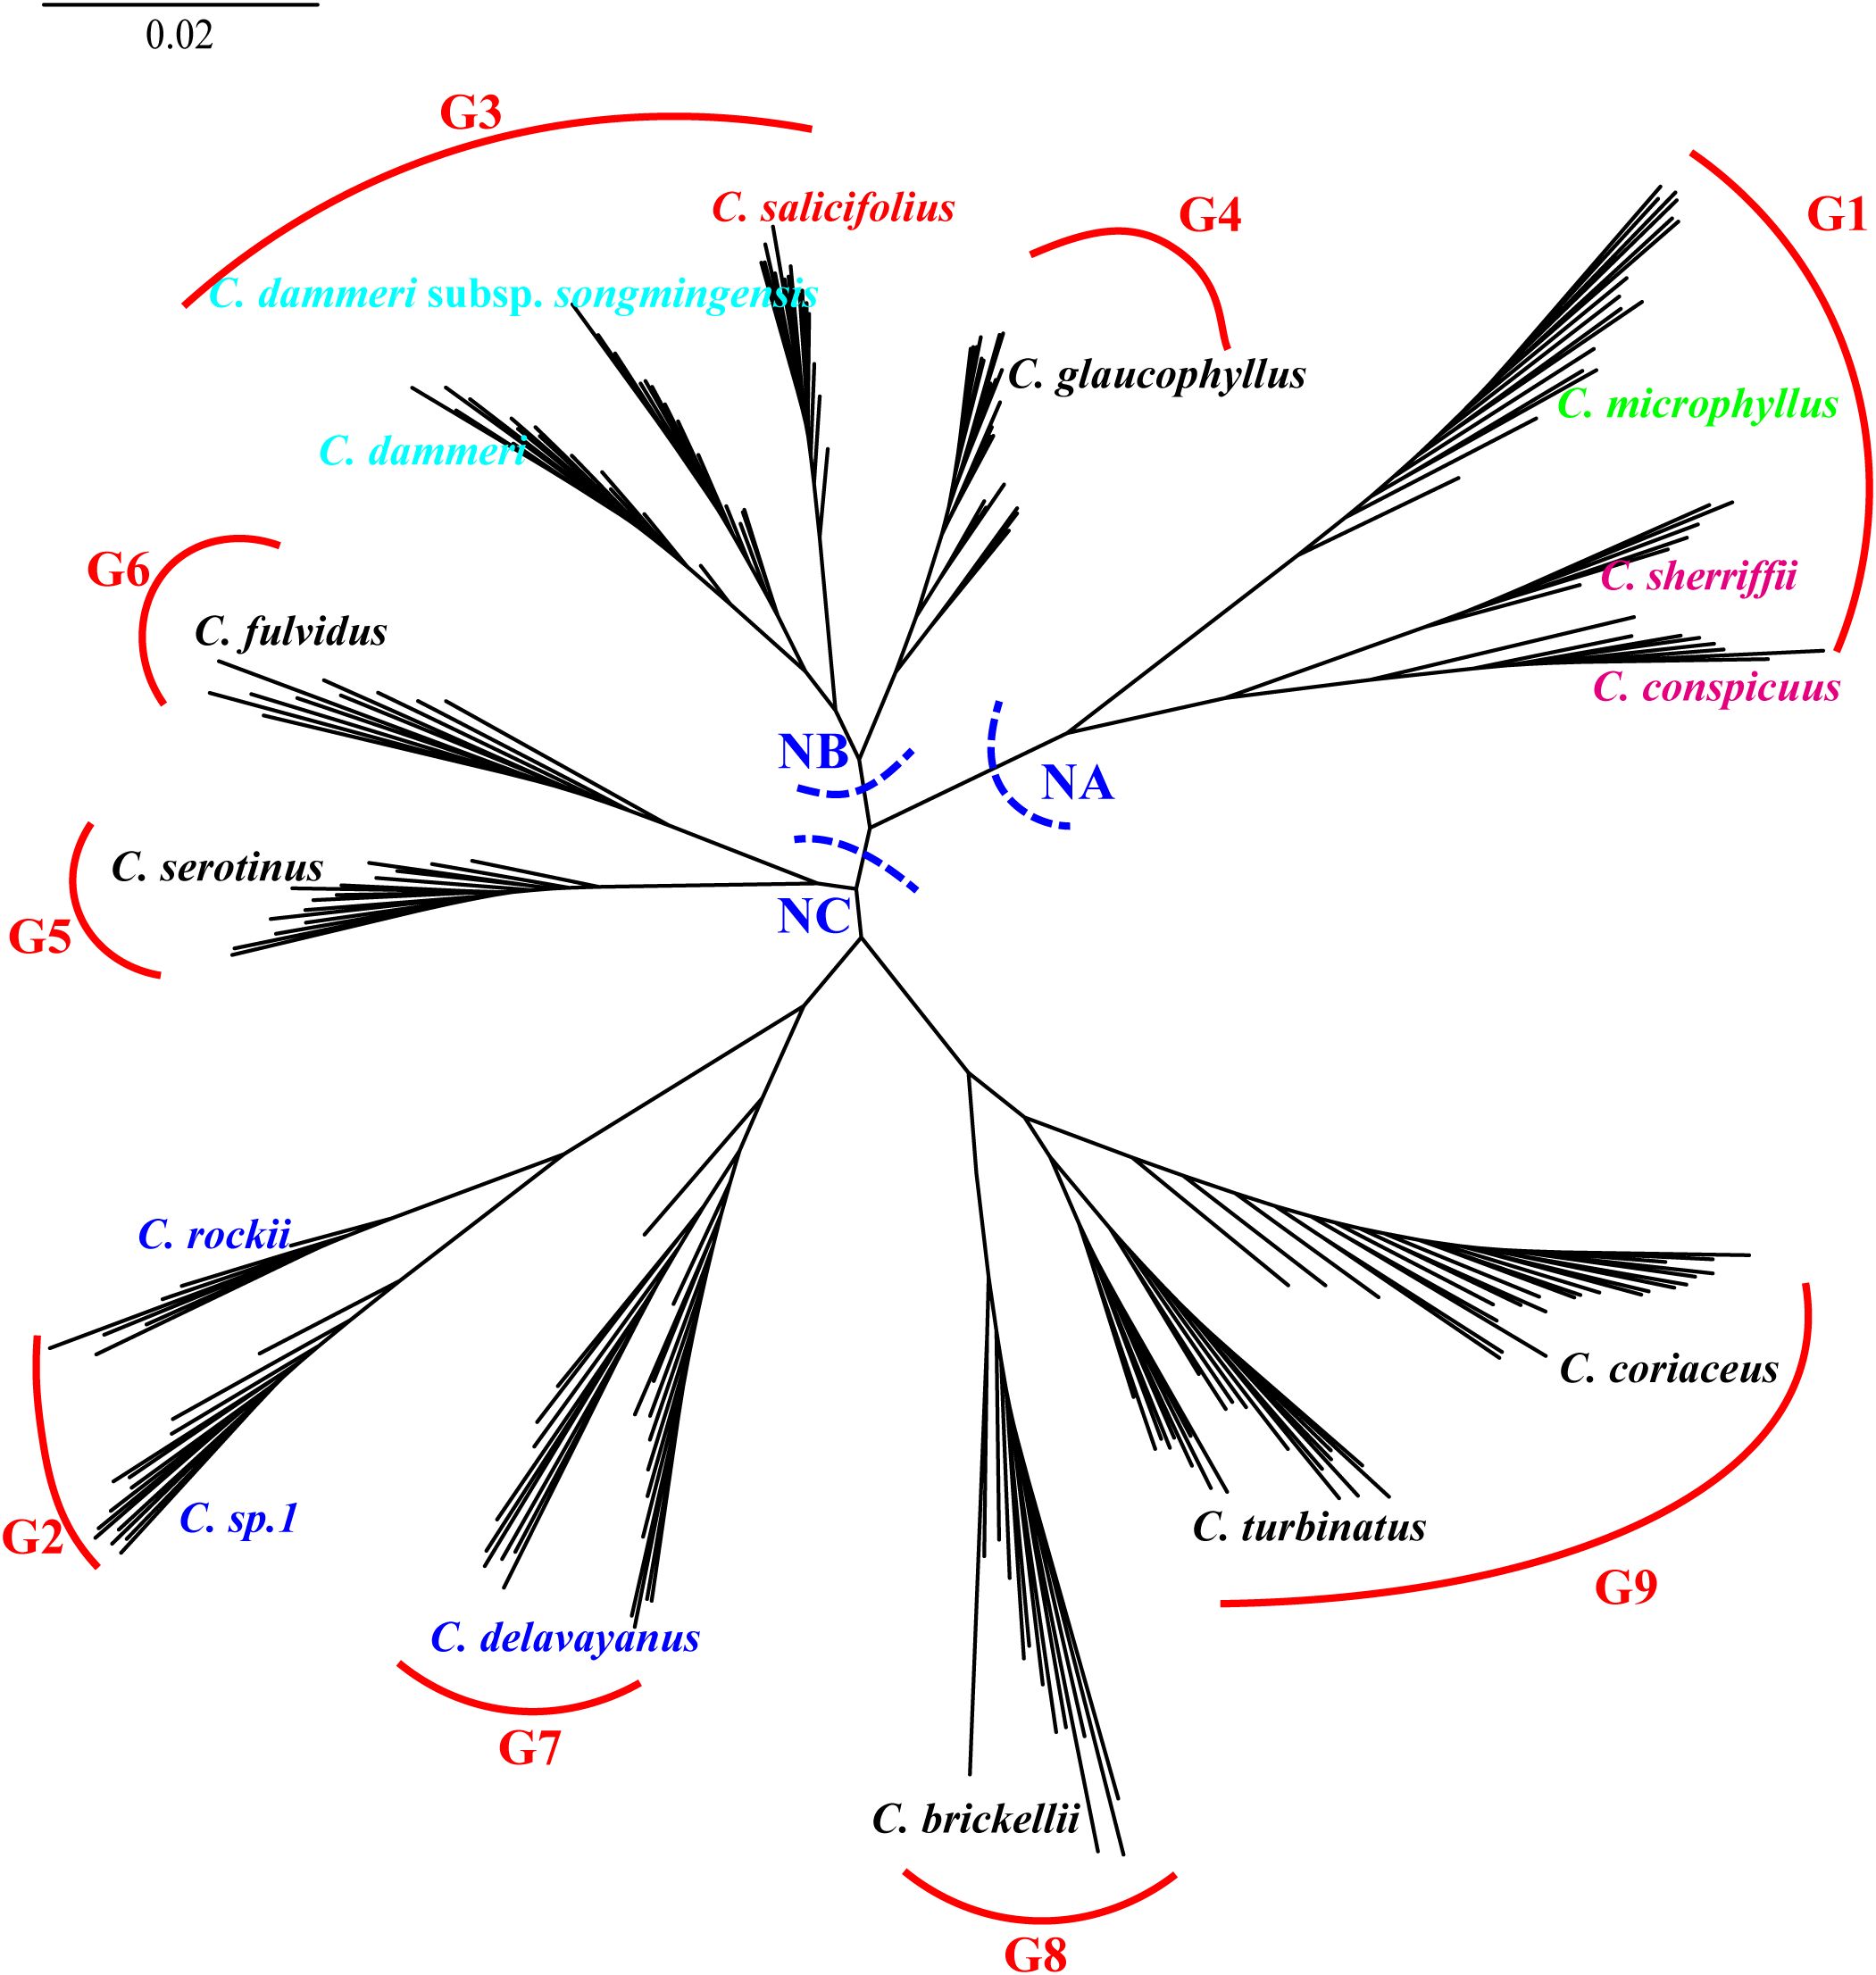
Figure 10. 4D site-based phylogenetic tree after removing putative hybrids, with major clades labeled NA (nuclear clade A), NB (nuclear clade B), and NC (nuclear clade C). Main branches are supported by SH-aLRT ≥ 80% and UFboot ≥ 95% unless otherwise indicated. G1 to G9 represent species with independent gene pools at admixture analysis K = 9. 4D, fourfold degenerate; SH-aLRT, Shimodaira–Hasegawa approximate likelihood ratio test; UFboot, ultrafast bootstrap.
4 Discussion
The resolution of interspecific relationships within Cotoneaster is confounded by intersecting evolutionary mechanisms including hybridization, incomplete lineage sorting, and polyploidization. Current multi-dataset analyses revealed persistent topological conflicts among phylogenies reconstructed from morphological traits, chloroplast genomes, and nuclear RAD-seq data. Notably, conspecific populations frequently failed to form monophyletic clusters across these reconstructions, a pattern compounded by admixture analyses demonstrating pervasive gene pool mixing among nominal species. These observations collectively underscore the prevalence of reticulate evolutionary processes and gene flow-mediated phylogenetic discordance in the genus. The recurrent cytonuclear discordances, non-monophyly of morphologically defined taxa, and extensive interspecific admixture necessitate a framework integrating phylogenomic networks and demographic modeling to disentangle historical hybridization signals from incomplete lineage sorting dynamics.
4.1 Conflicts between morphological and genetic data: implications for integrative taxonomy
The genus Cotoneaster presents formidable challenges in species delimitation due to extensive morphological plasticity arising from polyploidy, recurrent hybridization, and adaptive divergence, compounded by apomixis that generates morphologically intermediate forms (Rothleutner et al., 2016; Fryer and Hylmö, 2009). Sympatric populations exhibit heightened hybridization frequencies, amplifying morphological ambiguity and taxonomic complexity (Li et al., 2014; Li et al., 2017).
PCA based on 22 morphological traits revealed that species in ser. M, S, R, and C could be effectively distinguished, whereas most species in ser. B aggregated into two groups, apart from C. buxifolius var. vellaeus (Figure 3). In contrast, ser. P species showed pronounced morphological overlap (Figure 3), likely reflecting subtle morphological divergence within the C. buxifolius complex where leaf dimensions and lateral vein depression gradients create phenotypic continuity. Transitional forms bridging C. buxifolius, C. pannosus, and C. brickellii exemplify this continuum. Although branchlet arrangement differentiates ser. B (predominantly spiral) from ser. P (spiral/distichous), partial trait overlap persists, underscoring the insufficiency of morphology alone for resolving species boundaries and necessitating genomic validation.
Hierarchical clustering trees based on 22 morphological traits showed that ser. P clustered with C. salicifolius, consistent with the taxonomy system of Fryer and Hylmö (2009), where ser. P and ser. S together form sect. Densiflori T. T. Yu. Ser. P bifurcated into two subgroups: one containing C. serotinus, C. glaucophyllus, and C. meiophyllus, and the other encompassing remaining ser. P members (Figure 4). Ser. B clustered with C. sp. 3 and C. marginatus, and ser. C grouped with C. microphyllus (Figure 4). This topology underscores the polyphyletic nature of morphological series P, B, and M, revealing extensive phylogenetic discordance with traditional taxonomic groupings. Molecular phylogenies further complicated this picture: nuclear and cytoplasmic trees showed non-monophyly of ser. P but united C. glaucophyllus and C. meiophyllus (Figures 5, 6), while chloroplast data failed to recover monophyletic series except for ser. B (excluding C. insolitus and C. buxifolius var. vellaeus). The 4D-site phylogeny dispersed ser. B taxa across three clades (Figure 6), highlighting profound discordance between morphological and molecular groupings.
These incongruences between morphological clustering and molecular phylogenies in the C. buxifolius complex and its closely related species likely stem from several evolutionary processes: hybridization, incomplete lineage sorting (ILS), and plastid capture. Hybridization erodes genetic boundaries, repositioning taxa phylogenetically toward parental lineages—a pattern observed in C. cochleatus, which clustered with putative parents in nuclear/cytoplasmic trees but aligned morphologically with 4D-site phylogeny (Liu et al., 2022). Such hybridization and subsequent gene flow promote morphological convergence, as observed in numerous plant species where introgression leads to overlapping morphological traits (Zheng et al., 2021; Wang et al., 2024). ILS allows ancestral genetic polymorphisms to persist during rapid speciation events, leading to discordance between gene and species trees (Feng et al., 2022). Plastid capture events, evidenced by the incongruence of mitochondrial and plastid phylogenies with nuclear phylogenies, further obscure evolutionary reconstruction (Liu et al., 2020; Yang et al., 2021). Environmental adaptation and phenotypic plasticity additionally modulate morphological expression (Zhang et al., 2024; Rosner and Morris, 2022; Karabourniotis et al., 2020), complicating the disentanglement of phylogenetic signals from ecological influences.
4.2 Species delimitation using an integrative approach
Interspecific hybridization serves as a pivotal mechanism in redefining species boundaries and restructuring systematic relationships across plant lineages (Harrison and Larson, 2014; Wang, 2017). Through reciprocal gene flow between phylogenetically distinct taxa, this process facilitates both the emergence of novel evolutionary lineages and the genomic remodeling of established species (Hörandl, 2022), progressively eroding conventional species demarcations and complicating our understanding of evolutionary history (Wang et al., 2021). Admixture analysis, a Bayesian clustering approach optimized for detecting contemporary hybridization signatures (Mattucci et al., 2019; Wang et al., 2019; Mao et al., 2017), was implemented to dissect the genetic architecture of the focal taxa. Cross-validation metrics identified K = 9 as the optimal genetic cluster configuration, resolving 14 species as a single gene pool indicative of evolutionary stability. These genomically cohesive clusters (ADMIXTURE ancestry ≥ 95%) formed the primary taxonomic hypotheses, which were subsequently subjected to a validation cascade requiring nuclear monophyly (SH-aLRT ≥ 80% and UFboot ≥ 95%), chloroplast lineage congruence, and morphological diagnosability (≥ 2 non-overlapping traits). These species are likely to represent recently established and stable taxa, with little evidence of recent hybridization events affecting their genetic composition. Conversely, admixed species exhibiting contributions from two or more gene pools revealed ongoing or historical hybridization processes, corroborating hybrid origins for these taxa. For such admixed lineages, taxonomic decisions relied on reconciling cytonuclear discordance (e.g., nuclear G2 dominance with chloroplast G3 affiliation in C. marginatus) and intermediate morphology, ultimately designating them as hybrids when all three lines of evidence concurred. This finding supported the hypothesis that hybridization has played a significant role in shaping the genetic diversity of these species.
The presence of admixed species complicates efforts to construct accurate phylogenetic trees, as hybridization can introduce conflicting signals into the data (Rieseberg and Soltis, 1991; Steenwyk et al., 2023). To mitigate these confounding effects, phylogenetic analyses frequently exclude recently hybridized taxa, prioritizing pure lineages to recover ancestral divergence patterns (McDade, 1992; Morales-Briones et al., 2018; Van Poucke et al., 2021; Yi et al., 2023). Our approach adopts this conservative philosophy but extends it to taxonomic practice: genomically admixed taxa (ADMIXTURE < 95%) were excluded from primary phylogenetic reconstruction but retained for hybrid designation if their cytonuclear–morphological profiles indicated stable reticulate origins. By focusing on non-recent hybrid species, it is possible to obtain a clearer picture of the evolutionary history and relationships among these taxa (McDade, 1992; Mallet, 2007). This conservative approach enhances phylogenetic accuracy by minimizing reticulate noise, thereby clarifying deep evolutionary relationships (Harrison and Larson, 2014; Mallet, 2007).
For taxonomic delineation within ser. P, ser. B, and related taxa, a hierarchical framework integrating multilocus evidence is proposed following Hong (2016) operational protocol for species delimitation. Nuclear monophyly (node support thresholds: SH-aLRT ≥ 80% and UFboot ≥ 95%) and stable genetic structure (ADMIXTURE cluster assignment probability ≥ 95%) constitute the primary criterion, as genome-wide SNPs provide a robust phylogenetic signal in resolving recent radiations (Joly et al., 2014). Morphological diagnosability (≥ 2 discontinuous traits) and chloroplast lineage congruence are required as secondary criteria to ensure taxonomic practicality and identify cytonuclear discordances from hybridization. The K = 9 admixture configuration provides the genomic baseline for initial species hypotheses, requiring subsequent validation through nuclear phylogenetic coherence and character-state divergence. This multilayered approach reconciles cytonuclear discordances while addressing the limitations of single-evidence taxonomic systems in hybrid-rich lineages, thereby circumventing the circularity risks inherent in criteria that rely on singular data types (Sukumaran and Knowles, 2017).
4.2.1 Species representing the nine gene pools and their genetic relationship
In the nuclear phylogenetic tree constructed from 14 species representing nine gene pools, these species can be categorized into three distinct clades: NA, NB, and NC. In this study, we systematically investigate species delimitation and genetic relationships based on their respective positions within these three clades.
Clade NA serves as a paradigmatic example of species validation through integrated evidence derived from nuclear phylogeny and morphological differentiation. C. conspicuus and C. sherriffii (ser. C, G1) exhibit monophyly separately within clade NA (Figure 10). At K = 19, both C. conspicuus and C. sherriffii were found to share the same gene pool and cluster together in the PCA (Figures 7, 8). Despite their genetic similarity, these two species display distinct ploidy levels: C. conspicuus is diploid, while C. sherriffii is triploid (Fryer and Hylmö, 2009). Although there exists cytonuclear discordance in C. conspicuus (Figure 9), both species demonstrate two or more discontinuous morphological traits that further support their distinction. C. conspicuus is characterized by its lack of lenticels on branches and has sparsely pilose adaxial leaf surfaces with elliptic to oblong-elliptic or oblong-ovate leaves featuring a callous-mucronate apex. In contrast, C. sherriffii displays prominent lenticels along with glabrous to subglabrous adaxial leaf surfaces; its leaves are elliptic to obovate with an obtuse or rotund apex. The monophyly observed in the nuclear phylogeny combined with significant morphological differentiation substantiates the recognition of C. conspicuus and C. sherriffii as distinct species.
While all four taxa within Clade NB are individually monophyletic, both C. dammeri and its subspecies C. dammeri subsp. songmingensis exhibit insufficient independent morphological characteristics to substantiate their taxonomic distinction. Morphologically, these two taxa display notable similarities, with the primary differences observed in the petiole length of sterile branches. Furthermore, they share an identical genetic structure (Figures 7, 8) and present conflicting positions in nuclear versus plastid phylogenetic trees (C. dammeri is illustrated in Figure 9). However, given that only a single population was sampled for each taxon in this study, it remains inconclusive whether C. dammeri and C. dammeri subsp. songmingensis represent one or two distinct species. In contrast, C. salicifolius and C. glaucophyllus demonstrate clear divergence through independent gene pools (Figure 7), consistent positions in cytonuclear phylogenies (Figure 9), and complete morphological separation. C. glaucophyllus (ser. P) is characterized by nearly glabrous leaf abaxial surfaces, occasionally sparsely strigose hypanthium, and glabrous sepals, whereas C. salicifolius forms discrete clusters in morphological PCA (Figure 3).
Clade NC exhibits genomic–morphological congruence. The sister taxa, C. fulvidus (G5) and C. serotinus (G6), maintain nuclear monophyly while surpassing interspecific morphological thresholds through divergence in leaf texture (coriaceous vs. subcoriaceous), abaxial surface indumentum density (yellowish tomentose vs. subglabrous), and inflorescence architecture (compact vs. lax). Although C. fulvidus exhibits approximately 70% G5 ancestry in ADMIXTURE analysis, falling below the 95% genomic cohesion threshold, its recognition as a distinct species is unequivocally supported by two concordant lines of evidence. First, C. fulvidus (classified as Cotoneaster hebephyllus var. fulvidus W.W. Smith in the Catalogue of Life China, 2024 and the WFO Plant List: World Flora Online, 2024) is morphologically diagnosable from C. hebephyllus Diels by its evergreen habit (versus deciduous), coriaceous leaves (versus chartaceous), and initially indumented fruits (versus glabrous). Second, nuclear monophyly with maximal support (SH-aLRT = 100% and UFboot = 100%) and the phylogeny reconstructed by Meng et al. (2021) robustly separate C. fulvidus from C. hebephyllus. Importantly, these morphological and genetic boundaries align with the species delimitation criteria of Fryer and Hylmö (2009), demonstrating that the framework successfully validates taxonomic hypotheses even in cases of genomic ambiguity. This case exemplifies the framework’s capacity to reconcile genomic ambiguity through multilocus validation, where strong phylogenetic support and non-overlapping traits override subthreshold clustering signals. Similarly, C. serotinus has been treated as a variety of C. glaucophyllus in both the Catalogue of Life China (2024) and the WFO Plant List: World Flora Online (2024). Notably, C. serotinus can be distinguished from C. glaucophyllus by its dull adaxial leaves, elliptical or obovate leaf shapes, and short-acuminate apices. Together with genetic differentiation, these distinctions reinforce the classification of C. serotinus as a separate species (Fryer and Hylmö, 2009).
Hybrid interference in ser. B underscores the robustness of the framework. This grouping diverged from the original phylogenetic tree constructed using all 27 Cotoneaster species, indicating that the inclusion of hybrids may influence both the construction of the phylogenetic tree and the monophyly of ser. B (Figure 9). At K = 19, C. sp. 1 and C. rockii each exhibited distinct gene pools and were clearly distinguishable from one another in PCA, forming separate monophyletic clades within the phylogenetic trees (Figures 7, 8, 10). Morphologically, these species differ in traits such as adaxial lateral vein prominence (not obvious vs. more prominent), surface rugosity (absent vs. slightly present), and fruit indumentum (persistent vs. non-persistent), further reinforcing their classification as separate species. In this study, C. buxifolius was identified as a mixture of gene pools G6 and G7 (K = 9; Figure 7); therefore, classifying C. rockii as C. buxifolius var. rockii (G. Klotz) L.T. Lu and Brach based on Catalogue of Life China (2024) is not supported by our findings.
At last, three species of ser. P—C. brickellii, C. turbinatus, and C. coriaceus—each formed monophyletic groups with distinct gene pools (Figures 7, 10). Morphologically, C. brickellii is distinguished from both C. turbinatus and C. coriaceus by its five to seven– lateral leaf veins (compared to 7–10) and shorter growth habit (1.5–2– versus 3–6 m). Additionally, C. turbinatus exhibits subtle divergence from C. coriaceus, characterized by subcoriaceous leaves as opposed to coriaceous ones and obovoid fruits. Based on congruent molecular monophyly, independent gene pools, and the presence of two or more diagnostic morphological characteristics, it is warranted that C. brickellii, C. turbinatus, and C. coriaceus be recognized as distinct species.
4.2.2 Taxa with admixed genetic background and their phylogenetic relationship
4.2.2.1 Taxa with complex genetic background in clade NA
C. marginatus exhibited a mosaic genomic architecture dominated by G2 (associated with C. rockii/C. sp. 1), with supplementary contributions from G1, G3, and G6 at K = 9, retaining residual admixture even at higher resolution (K = 19, Figure 7). Chloroplast phylogeny positioned this taxon within a clade containing C. morrisonensis and C. dammeri subsp. songmingensis (G3, Figure 5), contrasting with its morphological affinity to ser. B (G2, Figure 4). This cytonuclear discordance strongly suggests recent hybrid origins involving multiple parental lineages. A parallel pattern emerged in C. buxifolius var. vellaeus, which displayed genomic admixture from G1, G2, and G7. Admixture analysis implicated C. rockii (G2) as a likely progenitor, corroborated by morphological alignment with ser. B. However, plastid phylogeny revealed potential plastid capture from C. microphyllus (G1, Figure 5), while PCA positioned this variety intermediately between G1 and G2 clusters (Figure 8). Collectively, these findings indicate that both C. marginatus and C. buxifolius var. vellaeus arose through hybridization events involving C. rockii (G2) and additional unresolved parental taxa. Resolution of their evolutionary histories necessitates expanded population-level sampling to disentangle ancestral gene flow dynamics and identify cryptic contributors to their hybrid genomes.
C. insolitus primarily exhibited a G2 gene pool, with minor contributions from G1 and G6 at K = 9, indicating genetic admixture between C. sp. 1 (G2) and G1 at K = 19 (Figure 7). Phylogenetic analysis based on 4D sites revealed that it formed a monophyletic group alongside C. conspicuus and C. sherriffii (G1), while the chloroplast tree positioned it closest to C. conspicuus (Figures 5, 6). Therefore, our data support the hypothesis that C. insolitus is a product of hybridization between C. conspicuus (G1) and C. sp. 1 (G2), although it may have also undergone introgression from other species. Its distinct morphological characteristics—such as the dark green adaxial leaf surface devoid of rugosity, persistent indumentum, and slightly depressed lateral veins—contradict its varietal designation as C. buxifolius var. rockii in the Catalogue of Life China (2024).
4.2.2.2 Taxa with complex genetic background in clade NB
C. sp. 2 exemplifies the challenges of reconciling conflicting evolutionary signals: nuclear data affiliate it with C. serotinus (G5), plastid phylogeny links it to C. turbinatus (GS population), and morphological clustering aligns it with C. salicifolius (G3; Figures 4–6). This tripartite discordance underscores the limitations of single-evidence approaches in resolving complex hybrid taxa and highlights the challenges in precisely determining their taxonomic status.
C. morrisonensis and C. cochleatus likely originated from hybridization between C. microphyllus and C. dammeri lineages. Chloroplast phylogeny resolved C. morrisonensis (G3-dominated), forming a monophyletic group with C. dammeri subsp. songmingensis (G3), whereas C. cochleatus (G1-dominated) clustered with C. microphyllus (G1) (Figure 5). Morphologically, C. cochleatus exhibits close affinity to C. microphyllus in leaf architecture while sharing the rooting habit of C. dammeri. The combined evidence of genomic admixture, cytonuclear discordance, and morphological intermediacy collectively demonstrates the hybrid origin hypothesis for these taxa.
C. meiophyllus (with G4 and G6 genetic admixture) clustered morphologically and in chloroplast phylogeny with C. glaucophyllus (G4), supporting its taxonomic recognition as C. glaucophyllus var. meiophyllus W. W. Smith, which is consistent with the taxonomic treatments in both the Catalogue of Life China (2024) and the WFO Plant List: World Flora Online (2024). Conversely, C. buxifolius and C. lidjiangensis (G6 and G7 admixture) showed identical gene pools and failed to form distinct phylogenetic branches (Figure 7), with no diagnostic morphological differences observed. Minor variations in stamen number and inflorescence size fell within the normal range of C. buxifolius, supporting the taxonomic treatment that C. lidjiangensis was synonymized with C. buxifolius (Catalogue of Life China, 2024).
C. argenteus, exhibiting a nuclear genomic admixture of G4 (C. glaucophyllus) and G7 (C. delavayanus), meets the primary species delimitation criterion that it constituted a monophyletic taxon in nuclear phylogeny analyses (Figure 6). While chloroplast data place it within the C. rockii clade (Figure 5), this discordance is secondary to the nuclear evidence under the proposed framework. Morphologically clustering, C. argenteus is close to C. rockii and C. delavayanus, differing slightly in the adaxial leaf surface, which is dull or slightly shiny, and in the lightly impressed lateral veins, which lack prominent characteristics. Further investigation is needed. However, its consistent differentiation from C. buxifolius via elliptic or obovate leaves (cuneate base), <10-mm fertile shoots, and 1–3-flowered inflorescences—coupled with sufficient genetic and phylogenetic distinction—warrants species-level recognition, rejecting its proposed synonymy of C. buxifolius (Catalogue of Life China, 2024; WFO Plant List: World Flora Online, 2024).
4.2.2.3 Taxa with complex genetic background in clade NC
The taxonomic status of C. sp. 3 and C. sp. 4 remained unresolved under the hierarchical framework. Both taxa exhibited nuclear monophyly in the 4D-sites phylogeny (Figure 6), fulfilling the primary criterion, but their admixed genomic compositions (C. sp. 4 G8-dominated with G4 and G3 contributions; C. sp. 3: G8–G3–G7 admixture; Figure 7) and conflicting morphological clustering (C. sp. 4 with C. coriaceus and C. lacteus; C. sp. 3 with ser. B taxa; Figure 4) precluded definitive delimitation. Notably, their chloroplast genomes formed a strongly supported clade with C. brickellii and C. pannosus (Figure 5), suggesting ancestral hybridization or incomplete lineage sorting as potential drivers of discordance.
C. pannosus exemplified multilayered taxonomic ambiguity. The admixed nuclear genomes (G7–G8 ancestry; YHC population with additional introgression) aligned with its dual phylogenetic placements: the JSD population clustered with C. delavayanus (4D-site tree), while the YHC population grouped with C. brickellii (Figure 6). Chloroplast data further complicated this pattern, with one population aligning with C. brickellii (WS population) and another with C. turbinatus, C. coriaceus, and C. brickellii (Figure 5). Although population-level nuclear monophyly and cytonuclear discordance supported hybrid origins between C. delavayanus and C. brickellii, lineage-wide polyphyly precluded formal species validation under the framework’s criteria.
C. lacteus displays conflicting evolutionary signals across datasets. Genomic admixture analysis at multiple resolutions (K = 9–19) identified ancestral contributions from four gene pools: G9 (C. coriaceus), G7, G3, and G4 (Figure 7). Nuclear phylogeny confirms its distinct evolutionary lineage through monophyly in 4D-site analysis (Figure 6), meeting the primary criterion for species recognition. However, chloroplast phylogeny groups it with C. coriaceus (Figure 5), and similarity to this species has led to its current synonymy under this species (Catalogue of Life China, 2024; WFO Plant List: World Flora Online, 2024). This conflict between nuclear independence and plastid/morphological alignment may stem from multiple evolutionary mechanisms. Hybridization scenarios could explain the pattern if C. coriaceus served as the maternal progenitor, contributing both chloroplast DNA and key morphological traits, while nuclear genomes diverged through subsequent backcrossing (Liu et al., 2022). Alternatively, recent divergence from C. coriaceus may account for shared plastid haplotypes and morphology if insufficient time has elapsed for complete lineage sorting (Pillon et al., 2007). A third possibility involves ILS of ancestral polymorphisms, where stochastic retention of plastid haplotypes persists despite nuclear differentiation (Feng et al., 2022). Distinguishing these scenarios will require population-level genomic investigations to quantify introgression patterns and assess lineage sorting dynamics across its distribution range.
5 Conclusion
In this paper, we delineate complex species groups comprising up to 27 species through population genomics analysis. Our findings reveal that 14 of these species represent nine distinct gene pools, while the remaining 13 species have arisen from hybridization events involving these primary taxa. This study provides robust support for future revisions of the taxonomic classification of these species. However, our work is not yet exhaustive. Limited sampling may result in the omission of parental species, thereby affecting the accuracy of hybrid origin determination. This research offers a reliable framework for subsequent studies, underscoring the importance of expanding both species and population sampling to more accurately elucidate the hybrid origins of Cotoneaster species and specific taxa.
Data availability statement
The raw ddRAD-seq data for all Cotoneaster taxa generated for this study was uploaded to GenBank under the BioProject PRJNA1196588.
Author contributions
JH: Formal analysis, Investigation, Methodology, Software, Visualization, Writing – original draft, Writing – review & editing, Conceptualization. SC: Supervision, Validation, Visualization, Writing – review & editing, Conceptualization. KM: Writing – review & editing, Resources. ML: Resources, Writing – review & editing. WZ: Resources, Writing – review & editing. NW: Investigation, Visualization, Writing – review & editing. QF: Project administration, Resources, Supervision, Writing – review & editing, Conceptualization. WL: Project administration, Supervision, Writing – review & editing, Conceptualization.
Funding
The author(s) declare that financial support was received for the research and/or publication of this article. This work was supported by the National Natural Science Foundation of China (33000-41030310, 32370225).
Acknowledgments
We appreciate the help of Jiehao Jin and Cuiying Huang in the sample collection.
Conflict of interest
The authors declare that the research was conducted in the absence of any commercial or financial relationships that could be construed as a potential conflict of interest.
Generative AI statement
The author(s) declare that no Generative AI was used in the creation of this manuscript.
Publisher’s note
All claims expressed in this article are solely those of the authors and do not necessarily represent those of their affiliated organizations, or those of the publisher, the editors and the reviewers. Any product that may be evaluated in this article, or claim that may be made by its manufacturer, is not guaranteed or endorsed by the publisher.
Supplementary material
The Supplementary Material for this article can be found online at: https://www.frontiersin.org/articles/10.3389/fpls.2025.1575925/full#supplementary-material
Supplementary Figure 1 | Cyto-nuclear conflicts among two clades in Cotoneaster by comparison of chloroplast genome tree (left) and species tree (right) (Meng et al., 2021). Bayesian posterior probabilities (BIPP) are 1.00 and Ultrafast bootstrap support values (UFBS) are ≥95, unless otherwise indicated (left). Local posterior probabilities (Astral-PP) are ≥0.7 and multilocus bootstrap values (Astral-BS) are ≥70%, unless otherwise indicated (right). The red boxes highlight C. ser. Pannosi, C. ser. Buxifolii and related taxa.
Supplementary Figure 2 | Contribution of variables to dim 1 and dim 2 in PCA based on 22 traits.
Supplementary Figure 3 | Variation of Cross-Validation error with number of ancestral populations (K) in admixture analysis based on unlinked 4D sites.
References
Alexander, D. H., Novembre, J., and Lange, K. (2009). Fast model-based estimation of ancestry in unrelated individuals. Genome Res. 19, 1655–1664. doi: 10.1101/gr.094052.109
Andrews, S. (2010). FastQC: a quality control tool for high throughput sequence data. Anal. Biochem. 548, 38–43. doi: 10.1016/j.ab.2018.01.028
Anjos, M. S., Bitencourt, J. A., Nunes, L. A., Sarmento-Soares, L. M., Carvalho, D. C., Armbruster, J. W., et al. (2020). Species delimitation based on integrative approach suggests reallocation of genus in Hypostomini catfish (Siluriformes, Loricariidae). Hydrobiologia 847, 563–578. doi: 10.1007/s10750-019-04121-z
Burgess, M. B., Cushman, K. R., Doucette, E. T., Talent, N., Frye, C. T., and Campbell, C. S. (2014). Effects of apomixis and polyploidy on diversification and geographic distribution in Amelanchier (Rosaceae). Am. J. Bot. 101, 1375–1387. doi: 10.3732/ajb.1400113
Campbell, C. S. and Dickinson, T. A. (1990). Apomixis, patterns of morphological variation, and species concepts in subfam. Maloideae (Rosaceae). Syst. Bot. 15, 124–135. doi: 10.2307/2419022
Campbell, C. S., Evans, R. C., Morgan, D. R., Dickinson, T. A., and Arsenault, M. P. (2007). Phylogeny of subtribe Pyrinae (formerly the Maloideae, Rosaceae): Limited resolution of a complex evolutionary history. Plant Syst. Evol. 266, 119–145. doi: 10.1007/s00606-007-0545-y
Campbell, C. S., Greene, C. W., and Dickinson, T. A. (1991). Reproductive biology in subfam. Maloideae (Rosaceae). Syst. Bot. 16, 333–349. doi: 10.2307/2419284
Castresana, J. (2000). Selection of conserved blocks from multiple alignments for their use in phylogenetic analysis. Mol. Biol. Evol. 17, 540–552. doi: 10.1093/oxfordjournals.molbev.a026334
Catalogue of Life China (2024). CoLChina. Available online at: http://www.sp2000.org.cn/CoLChina (Accessed January 25, 2025).
Chen, S., Zhou, Y., Chen, Y., and Gu, J. (2018). fastp: an ultra-fast all-in-one FASTQ preprocessor. Bioinformatics 34, i884–i890. doi: 10.1093/bioinformatics/bty560
Cushman, K. R., Burgess, M. B., Doucette, E. T., Nelson, G. A., and Campbell, C. S. (2017). Species delimitation in tetraploid, apomictic Amelanchier (Rosaceae). Syst. Bot. 42, 234–256. doi: 10.1600/036364417X695529
Danecek, P., Bonfield, J. K., Liddle, J., Marshall, J., Ohan, V., Pollard, M. O., et al. (2021). Twelve years of SAMtools and BCFtools. Gigascience 10, giab008. doi: 10.1093/gigascience/giab008
Dickinson, T., Lo, E., and Talent, N. (2007). Polyploidy, reproductive biology, and Rosaceae: understanding evolution and making classifications. Plant Syst. Evol. 266, 59–78. doi: 10.1007/s00606-007-0541-2
Doyle, J. J. and Doyle, J. L. (1987). A rapid DNA isolation procedure for small quantities of fresh leaf tissue. Phytochemical Bull. 19, 11–15.
Ely, C. V., Andrade, B. O., Iganci, J. R. V., and Boldrini, I. I. (2018). Integrative taxonomy improves delimitation in Hypericum subspecies. Perspect. Plant Ecol. Evol. Syst. 34, 68–76. doi: 10.1016/j.ppees.2018.08.005
Ewels, P., Magnusson, M., Lundin, S., and Käller, M. (2016). MultiQC: summarize analysis results for multiple tools and samples in a single report. Bioinformatics 32, 3047–3048. doi: 10.1093/bioinformatics/btw354
Feng, S., Bai, M., Rivas-González, I., Li, C., Liu, S., Tong, Y., et al. (2022). Incomplete lineage sorting and phenotypic evolution in marsupials. Cell 185, 1646–1660.e18. doi: 10.1016/j.cell.2022.03.034
Flinck, K. E. and Hylmö, B. (1966). A list of series and species in genus cotoneaster. Botaniska Notiser 119, 445–462.
Francis, R. (2017). pophelper: an R package and web app to analyse and visualize population structure. Mol. Ecol. Resour. 17, 27–32. doi: 10.1111/1755-0998.12509
Fryer, J. and Hylmö, B. (2009). Cotoneasters: A Comprehensive Guide to Shrubs for Flowers, Fruit, and Foliage (Portland and London: Timber Press).
Gower, J. C. (1971). A general coefficient of similarity and some of its properties. Biometrics 27, 857–871. doi: 10.2307/2528823
Harrison, R. G. and Larson, E. L. (2014). Hybridization, introgression, and the nature of species boundaries. J. Heredity 105, 795–809. doi: 10.1093/jhered/esu033
Hodel, R. G., Zimmer, E. A., Liu, B. B., and Wen, J. (2022). Synthesis of nuclear and chloroplast data combined with network analyses supports the polyploid origin of the apple tribe and the hybrid origin of the Maleae—Gillenieae clade. Front. Plant Sci. 12. doi: 10.3389/fpls.2021.820997
Hong, D.-Y. (2016). Biodiversity pursuits need a scientific and operative species concept. Biodiversity Sci. 24, 979. doi: 10.17520/biods.2016203
Hörandl, E. (2022). Novel approaches for species concepts and delimitation in polyploids and hybrids. Plants 11, 204. doi: 10.3390/plants11020204
Hunter, J. (2007). Matplotlib: A 2D graphics environment. Comput. Sci. Eng. 9, 90–95. doi: 10.1109/mcse.2007.55
Jin, J. J., Yu, W. B., Yang, J. B., Song, Y., DePamphilis, C. W., Yi, T. S., et al. (2020). GetOrganelle: a fast and versatile toolkit for accurate de novo assembly of organelle genomes. Genome Biol. 21, 1–31. doi: 10.1186/s13059-020-02154-5
Joly, S., Hipp, A. L., Eaton, D. A. R., Cavender-Bares, J., Fitzek, E., Nipper, R., et al. (2014). A framework phylogeny of the american oak clade based on sequenced RAD data. PloS One 9, e93975. doi: 10.1371/journal.pone.0093975
Kalyaanamoorthy, S., Minh, B. Q., Wong, T. K., Von Haeseler, A., and Jermiin, L. S. (2017). ModelFinder: fast model selection for accurate phylogenetic estimates. Nat. Methods 14, 587–589. doi: 10.1038/nmeth.4285
Karabourniotis, G., Liakopoulos, G., Nikolopoulos, D., and Bresta, P. (2020). Protective and defensive roles of non-glandular trichomes against multiple stresses: structure–function coordination. J. For. Res. 31, 1–12. doi: 10.1007/s11676-019-01034-4
Katoh, K. and Standley, D. M. (2013). MAFFT multiple sequence alignment software version 7: improvements in performance and usability. Mol. Biol. Evol. 30, 772–780. doi: 10.1093/molbev/mst010
Lê, S., Josse, J., and Husson, F. (2008). FactoMineR: an R package for multivariate analysis. J. Stat. Software 25, 1–18. doi: 10.18637/jss.v025.i01
Li, H. (2013). Aligning sequence reads, clone sequences and assembly contigs with BWA-MEM. arXiv preprint arXiv:1303.3997. doi: 10.48550/arXiv.1303.3997
Li, F., Fan, Q., Li, Q., Chen, S., Guo, W., Cui, D., et al. (2014). Molecular phylogeny of Cotoneaster (Rosaceae). inferred from nuclear ITS and multiple chloroplast sequences. Plant Syst. Evol. 300, 1533–1546. doi: 10.1007/s00606-014-0980-5
Li, M., Chen, S., Zhou, R., Fan, Q., Li, F., and Liao, W. (2017). Molecular evidence for natural hybridization between Cotoneaster dielsianus and C. glaucophyllus. Front. Plant Sci. 8, 704. doi: 10.3389/fpls.2017.00704
Li, Y. C., Wen, J., Ren, Y., and Zhang, J. Q. (2019). From seven to three: Integrative species delimitation supports major reduction in species number in Rhodiola section Trifida (Crassulaceae) on the Qinghai-Tibetan Plateau. Taxon 68, 268–279. doi: 10.1002/tax.12052
Linan, A. G., Lowry, P. P., Miller, A. J., Schatz, G. E., Sevathian, J. C., and Edwards, C. E. (2021). RAD-sequencing reveals patterns of diversification and hybridization, and the accumulation of reproductive isolation in a clade of partially sympatric, tropical island trees. Mol. Ecol. 30, 4520–4537. doi: 10.1111/mec.15736
Liston, A., Weitemier, K. A., Letelier, L., Podani, J., Zong, Y., Liu, L., et al. (2021). Phylogeny of Crataegus (Rosaceae) based on 257 nuclear loci and chloroplast genomes: evaluating the impact of hybridization. PeerJ 9, e12418. doi: 10.7717/peerj.12418
Liu, J. Q. (2016). The integrative species concept” and “species on the speciation way. Biodivers. Sci. 24, 1004–1008. doi: 10.17520/biods.2016222
Liu, L. X., Du, Y. X., Folk, R. A., Wang, S. Y., Soltis, D. E., Shang, F. D., et al. (2020). Plastome evolution in Saxifragaceae and multiple plastid capture events involving Heuchera and Tiarella. Front. Plant Sci. 11. doi: 10.3389/fpls.2020.00361
Liu, B. B., Ren, C., Kwak, M., Hodel, R. G., Xu, C., He, J., et al. (2022). Phylogenomic conflict analyses in the apple genus Malus sl reveal widespread hybridization and allopolyploidy driving diversification, with insights into the complex biogeographic history in the Northern Hemisphere. J. Integr. Plant Biol. 64, 1020–1043. doi: 10.1111/jipb.13246
Liu, S., Zhang, L., Sang, Y., Lai, Q., Zhang, X., Jia, C., et al. (2022). Demographic history and natural selection shape patterns of deleterious mutation load and barriers to introgression across Populus genome. Mol. Biol. Evol. 39, msac008. doi: 10.1093/molbev/msac008
Lu, L. D. and Brach, A. R. (2003). “Cotoneaster,” in Flora of China, vol. 9. (Beijing: Science Press; St. Louis: Missouri Botanical Garden Press), 85–108.
Macková, L. (2020). Microevolutionary processes in selected genera of the Rosaceae family. Charles University, Faculty of Science, Department of Botany, Prague (CZ).
Maharachchikumbura, S. S., Chen, Y., Ariyawansa, H. A., Hyde, K. D., Haelewaters, D., Perera, R. H., et al. (2021). Integrative approaches for species delimitation in Ascomycota. Fungal Divers. 109, 155–179. doi: 10.1007/s13225-021-00486-6
Mao, J.-F., Ma, Y., and Zhou, R. (2017). Approaches used to detect and test hybridization: combining phylogenetic and population genetic analyses. Biodivers. Sci. 25, 577–599. doi: 10.17520/biods.2017097
Marçais, G., Delcher, A. L., Phillippy, A. M., Coston, R., Salzberg, S. L., and Zimin, A. (2018). MUMmer4: A fast and versatile genome alignment system. PloS Comput. Biol. 14, e1005944. doi: 10.1371/journal.pcbi.1005944
Martin, M. (2011). Cutadapt removes adapter sequences from high-throughput sequencing reads. EMBnet J. 17, 10–12. doi: 10.14806/ej.17.1.200
Mattucci, F., Galaverni, M., Lyons, L. A., Alves, P. C., Randi, E., Velli, E., et al. (2019). Genomic approaches to identify hybrids and estimate admixture times in European wildcat populations. Sci. Rep. 9, 11612. doi: 10.1038/s41598-019-48002-w
McDade, L. A. (1992). Hybrids and phylogenetic systematics II. The impact of hybrids on cladistic analysis. Evolution 46, 1329–1346. doi: 10.1111/j.1558-5646.1992.tb01127.x
McKenna, A., Hanna, M., Banks, E., Sivachenko, A., Cibulskis, K., Kernytsky, A., et al. (2010). The Genome Analysis Toolkit: a MapReduce framework for analyzing next-generation DNA sequencing data. Genome Res. 20, 1297–1303. doi: 10.1101/gr.107524.110
Meng, K. K., Chen, S. F., Xu, K. W., Zhou, R. C., Li, M. W., Dhamala, M. K., et al. (2021). Phylogenomic analyses based on genome-skimming data reveal cyto-nuclear discordance in the evolutionary history of Cotoneaster (Rosaceae). Mol. Phylogenet. Evol. 158, 107083. doi: 10.1016/j.ympev.2021.107083
Meng, K. K., Liao, W. B., Wei, S., Chen, S., Li, M., Ma, Y., et al. (2024). Chromosome-scale genome assembly and annotation of Cotoneaster glaucophyllus. Sci. Data 11, 406. doi: 10.1038/s41597-024-03246-8
Morales-Briones, D. F., Liston, A., and Tank, D. C. (2018). Phylogenomic analyses reveal a deep history of hybridization and polyploidy in the Neotropical genus Lachemilla (Rosaceae). New Phytol. 218, 1668–1684. doi: 10.1111/nph.15099
Nguyen, L. T., Schmidt, H. A., Von Haeseler, A., and Minh, B. Q. (2015). IQ-TREE: a fast and effective stochastic algorithm for estimating maximum-likelihood phylogenies. Mol. Biol. Evol. 32, 268–274. doi: 10.1093/molbev/msu300
Pillon, Y., Fay, M. F., Hedrén, M., Bateman, R. M., Devey, D. S., Shipunov, A. B., et al. (2007). Evolution and temporal diversification of western European polyploid species complexes in Dactylorhiza (Orchidaceae). Taxon 56, 1185–1208. doi: 10.2307/25065911
Potter, D., Eriksson, T., Evans, R. C., Oh, S., Smedmark, J. E. E., Morgan, D. R., et al. (2007). Phylogeny and classification of rosaceae. Plant Syst. Evol. 266, 5–43. doi: 10.1007/s00606-007-0539-9
Prebus, M. M. (2021). Phylogenomic species delimitation in the ants of the Temnothorax salvini group (Hymenoptera: Formicidae): an integrative approach. Syst. Entomol. 46, 307–326. doi: 10.1111/syen.12463
Purcell, S., Neale, B., Todd-Brown, K., Thomas, L., Ferreira, M. A., Bender, D., et al. (2007). PLINK: a tool set for whole-genome association and population-based linkage analyses. Am. J. Hum. Genet. 81, 559–575. doi: 10.1086/519795
Renaut, S., Rowe, H. C., Ungerer, M. C., and Rieseberg, L. H. (2014). Genomics of homoploid hybrid speciation: diversity and transcriptional activity of long terminal repeat retrotransposons in hybrid sunflowers. Philos. Trans. R. Soc. B: Biol. Sci. 369, 20130345. doi: 10.1098/rstb.2013.0345
Rieseberg, L. H. and Soltis, D. (1991). Phylogenetic consequences of cytoplasmic gene flow in plants. Evolutionary Trends Plants 5, 65–84.
Rosner, S. and Morris, H. (2022). Breathing life into trees: the physiological and biomechanical functions of lenticels. IAWA J. 43, 234–262. doi: 10.1163/22941932-bja10090
Rothleutner, J. J., Friddle, M. W., and Contreras, R. N. (2016). Ploidy levels, relative genome sizes, and base pair composition in Cotoneaster. J. Am. Soc. Hortic. Sci. 141, 457–466. doi: 10.21273/JASHS03776-16
Steenwyk, J. L., Li, Y., Zhou, X., Shen, X.-X., and Rokas, A. (2023). Incongruence in the phylogenomics era. Nat. Rev. Genet. 24, 834–850. doi: 10.1038/s41576-023-00620-x
Sukumaran, J. and Knowles, L. L. (2017). Multispecies coalescent delimits structure, not species. Proc. Natl. Acad. Sci. U S A 114, 1607–1612. doi: 10.1073/pnas.1607921114
Sun, J., Zhao, D., Qiao, P., Wang, Y., Wu, P., Wang, K., et al. (2024). Phylogeny of genera in Maleae (Rosaceae) based on chloroplast genome analysis. Front. Plant Sci. 15. doi: 10.3389/fpls.2024.1367645
Van Poucke, K., Haegeman, A., Goedefroit, T., Focquet, F., Leus, L., Jung, M. H., et al. (2021). Unravelling hybridization in Phytophthora using phylogenomics and genome size estimation. IMA fungus 12, 1–24. doi: 10.1186/s43008-021-00068-w
Virtanen, P., Gommers, R., Oliphant, T. E., Haberland, M., Reddy, T., Cournapeau, D., et al. (2020). SciPy 1.0: fundamental algorithms for scientific computing in Python. Nat. Methods 17, 261–272. doi: 10.1038/s41592-019-0686-2
Volk, G. M., Henk, A. D., Richards, C. M., Bassil, N., and Postman, J. (2019). Chloroplast sequence data differentiate Maleae, and specifically Pyrus, species in the USDA-ARS National Plant Germplasm System. Genet. Resour. Crop Evol. 66, 5–15. doi: 10.1007/s10722-018-0691-9
Wagner, N. D., He, L., and Hörandl, E. (2020). Phylogenomic relationships and evolution of polyploid Salix species revealed by RAD sequencing data. Front. Plant Sci. 11. doi: 10.3389/fpls.2020.01077
Walker, B. J., Abeel, T., Shea, T., Priest, M., Abouelliel, A., Sakthikumar, S., et al. (2014). Pilon: an integrated tool for comprehensive microbial variant detection and genome assembly improvement. PloS One 9, e112963. doi: 10.1371/journal.pone.0112963
Wang, Y. (2017). Natural hybridization and speciation. Biodivers. Sci. 25, 565–576. doi: 10.17520/biods.2017041
Wang, Z., Jiang, Y., Bi, H., Lu, Z., Ma, Y., Yang, X., et al. (2021). Hybrid speciation via inheritance of alternate alleles of parental isolating genes. Mol. Plant 14, 208–222. doi: 10.1016/j.molp.2020.11.008
Wang, H., Li, X. Y., Jiang, Y., Jin, Z. T., Ma, D. K., Liu, B., et al. (2024). Refining the phylogeny and taxonomy of the apple tribe Maleae (Rosaceae): insights from phylogenomic analyses of 563 plastomes and a taxonomic synopsis of Photinia and its allies in the Old World. Phytokeys 242, 161–227. doi: 10.3897/phytokeys.242.117481
Wang, X., Liao, S., Zhang, Z., Zhang, J., Mei, L., and Li, H. (2024). Hybridization, polyploidization, and morphological convergence make dozens of taxa into one chaotic genetic pool: a phylogenomic case of the Ficus erecta species complex (Moraceae). Front. Plant Sci. 15. doi: 10.3389/fpls.2024.1354812
Wang, D., Wang, Z., Kang, X., and Zhang, J. (2019). Genetic analysis of admixture and hybrid patterns of Populus hopeiensis and P. tomentosa. Sci. Rep. 9, 4821. doi: 10.1038/s41598-019-41320-z
WFO Plant List: World Flora Online (2024). Available online at: http://www.worldfloraonline.org (Accessed January 25, 2025).
Yang, Q., Fu, Y., Deng, Q., Wang, Y., Tao, L., Liu, L., et al. (2010). A method for excellent quality DNA extraction of loquat. North. Hort 20, 134–137.
Yang, Y. Y., Qu, X. J., Zhang, R., Stull, G. W., and Yi, T. S. (2021). Plastid phylogenomic analyses of Fagales reveal signatures of conflict and ancient chloroplast capture. Mol. Phylogenet. Evol. 163, 107232. doi: 10.1016/j.ympev.2021.107232
Yi, H., Dong, S., Yang, L., Wang, J., Kidner, C., and Kang, M. (2023). Genome-wide data reveal cryptic diversity and hybridization in a group of tree ferns. Mol. Phylogenet. Evol. 184, 107801. doi: 10.1016/j.ympev.2023.107801
Yu, D. J., Lu, L. D., and Gu, C. Z. (1974). “Cotoneaster,” in Flora of China, vol. 36. (Science Press, Beijing), 107–178.
Zhang, K. L., Leng, Y. N., Hao, R. R., Zhang, W. Y., Li, H. F., Chen, M. X., et al. (2024). Adaptation of high-altitude plants to harsh environments: application of phenotypic-variation-related methods and multi-omics techniques. Int. J. Mol. Sci. 25, 12666. doi: 10.3390/ijms252312666
Zheng, W., Yan, L. J., Burgess, K. S., Luo, Y. H., Zou, J. Y., Qin, H. T., et al. (2021). Natural hybridization among three Rhododendron species (Ericaceae) revealed by morphological and genomic evidence. BMC Plant Biol. 21, 1–12. doi: 10.1186/s12870-021-03312-y
Keywords: Cotoneaster, phylogeny, ddRAD-seq, species delimitation, integrative taxonomy
Citation: Huang J, Chen S, Meng K, Li M, Zhao W, Wang N, Fan Q and Liao W (2025) Phylogenomic relationships and species delimitation of Cotoneaster ser. Pannosi, ser. Buxifolii, and related taxa. Front. Plant Sci. 16:1575925. doi: 10.3389/fpls.2025.1575925
Received: 13 February 2025; Accepted: 07 April 2025;
Published: 20 May 2025.
Edited by:
Gang Yao, South China Agricultural University, ChinaReviewed by:
Chun-Lei Xiang, Chinese Academy of Sciences (CAS), ChinaBo Li, Chinese Academy of Sciences (CAS), China
Copyright © 2025 Huang, Chen, Meng, Li, Zhao, Wang, Fan and Liao. This is an open-access article distributed under the terms of the Creative Commons Attribution License (CC BY). The use, distribution or reproduction in other forums is permitted, provided the original author(s) and the copyright owner(s) are credited and that the original publication in this journal is cited, in accordance with accepted academic practice. No use, distribution or reproduction is permitted which does not comply with these terms.
*Correspondence: Wenbo Liao, bHNzbHdiQG1haWwuc3lzdS5lZHUuY24=; Qiang Fan, ZmFucWlhbmdAbWFpbC5zeXN1LmVkdS5jbg==