 Yanjun Zhang1,2†
 Yongjun Wang
- 1College of Forestry and Biotechnology, Zhejiang A&F University, Hangzhou, China
- 2China National Bamboo Research Center, Hangzhou, China
- 3Zhejiang Provincial Forest Disease and Pest Control Station, Hangzhou, China
Pine wilt disease (PWD), caused by the nematode Bursaphelenchus xylophilus, has led to significant ecological and economic losses in pine forests worldwide. Historically, several metrics, including the number of PWD-infected trees, the proportion of PWD-infected pine sub-compartments, and the occurrence area, have been employed to evaluate the prevalence of PWD. However, these metrics are individual and limited in comprehensively representing the prevalence of PWD in extensive regions. This study introduces a new algorithm for evaluating PWD prevalence in Hangzhou, China, where the disease has been established for over two decades. The algorithm utilizes data on the information of PWD-infected trees and sub-compartments to develop a diagrammatic scale (DS) and diagrammatic prevalence index (DPI). The DS categorizes the natural logarithm of the number of PWD-infected trees per hectare into 12 levels, providing a scale for semi-quantifying prevalence status within a sub-compartment. The DPI summarizes the occurrence and status of PWD-infected sub-compartments PWD in the geographic regions. The application of DPI in analysis of PWD prevalence in Hangzhou from 2021 to 2023 revealed consistent dynamic patterns of and accuracy, compared to other metrics. The DS and DPI might contribute to the improvement of accuracy, precision, reproducibility and repeatability of PWD prevalence assessment.
1 Introduction
Pine wilt disease (PWD) is a devastating forest disease caused by the nematode Bursaphelenchus xylophilus, which is primarily transmitted by the pine sawyer beetle, Monochamus spp (Mamiya, 1983; Futai, 2013). The disease, which originated in North America, has caused significant ecological and economic losses worldwide, particularly in East Asia, where it has led to the rapid decline and death of pine forests (Zhao et al., 2014; Back et al., 2024). This exotic pathogen has also recently spread to European countries, such as Portugal and Spain (Vicente et al., 2011). The etiology of PWD involves a complex interplay between the nematode, pine sawyer beetle, and the host pine tree (Zhao et al., 2014; Xu et al., 2023). The pine sawyer beetle serves as a vector for the nematode, facilitating its spread from infected to healthy trees (Jones et al., 2008; Akbulut and Stamps, 2012). The transportation of infected wood-containing pine sawyer beetles by humans can exacerbate the spread of the disease and lead to long-distance transmission (Rands et al., 2009). The rapid spread and high mortality rate of PWD pose serious challenges for forest management and ecological conservation efforts worldwide (Rodrigues, 2008; EPPO, 2012; Ye, 2019). China has the highest incidence of pine wilt disease worldwide. Since its introduction in 1982, PWD has spread rapidly in China and has led to the outbreaks in 19 provinces. Approximately 60,000,000 ha of pine forests in China are threatened by PWD (Xu et al., 2023). Therefore, accurate monitoring and effective management of PWD prevalence are urgently required.
Prevalence evaluation of PWD is essential for the development of effective management strategies (Rodrigues, 2008; Ye, 2019; Back et al., 2024). Historically, research has predominantly focused on evaluating the risk of PWD invasion into new ecological niches and predicting the pioneer areas for the spread of PWD on large geographic scales, such as climate conditions (Wong et al., 2017; Gruffudd et al., 2019; Tang et al., 2021) and stand structure (De La Fuente and Saura, 2021; Liu et al., 2023b; Schafstall et al., 2024). However, less attention has been directed toward the epidemiological patterns of PWD in areas where the disease has been established for extended periods.
For accurate prevalence evaluation of a plant disease, data collection at a fine geographic scale are required (Barzman et al., 2015; Firmino et al., 2017). Previous studies on PWD epidemiology have often relied on data at the county or municipal level (Lv et al., 2024; Schafstall et al., 2024). By contrast, data collection at finer geographic scales, such as townships and villages, would provide more detailed information for developing precise management strategies (Liu et al., 2023a). In Zhejiang Province, China, the prevalence data of PWD using unmanned aerial vehicles (UAVs) had been collected from 2021 to 2023, and all infected pine trees were precisely located by coordinates, making it feasible to conduct epidemiological analysis at a finer scale, such as at the sub-compartment scale (Zhang et al., 2024).
Quantification is essential for disease prevalence assessment and the efficient implementation of disease management programs (Nutter et al., 1991; Kwon et al., 2011; Bock et al., 2022). In the case of PWD, several metrics such as the number of PWD-infected trees, the proportion of PWD-infected pine sub-compartments, and the occurrence area, have been commonly employed in prevalence quantification (Hao et al., 2022). However, these metrics has limitations in comprehensively representing the prevalence of PWD, especially in in regions where PWD has been established for an extended period of time. Nevertheless, no studies on a finer geographic scale have been conducted to date. In this study, we introduced a new quantitative algorithm to develop new metric for PWD prevalence evaluation. This new metric integrated the information, such as the number of PWD-infected trees, the proportion of PWD-infected pine sub-compartments, and the occurrence area, which might contribute to the improvement of accuracy, precision, reproducibility and repeatability of PWD prevalence evaluation.
2 Materials and methods
2.1 The study area
The study area, Hangzhou, is a significant central city in the Yangtze River Delta in southeastern China (Figure 1). It is situated between 29°11’ and 30°34’ north latitude and 118°20’ and 120°37’ east longitude, encompassing a total area of 503,826 ha of pine forest. Masson pine (Pinus massoniana) is the dominant species. Hangzhou administers 7 pine-dominated county-level regions, including Xiaoshan distinct (XSQ), Yuhang distinct (XSQ), Fuyang distinct (XSQ), and Lin’an (XSQ), as well as two counties, Tonglu (TLX) and Chun’an (CAX), and one county-level city, Jiande (JDS). Topologically, the pine forest area in Hangzhou constitutes 24.3% of the total forest area, and the pine timber volume accounts for 37.5% of the total timber volume. PWD in Hangzhou was initially detected in Fuyang district in 1995, and has resulted in the mortality of numerous pine trees (Liu et al., 2001).
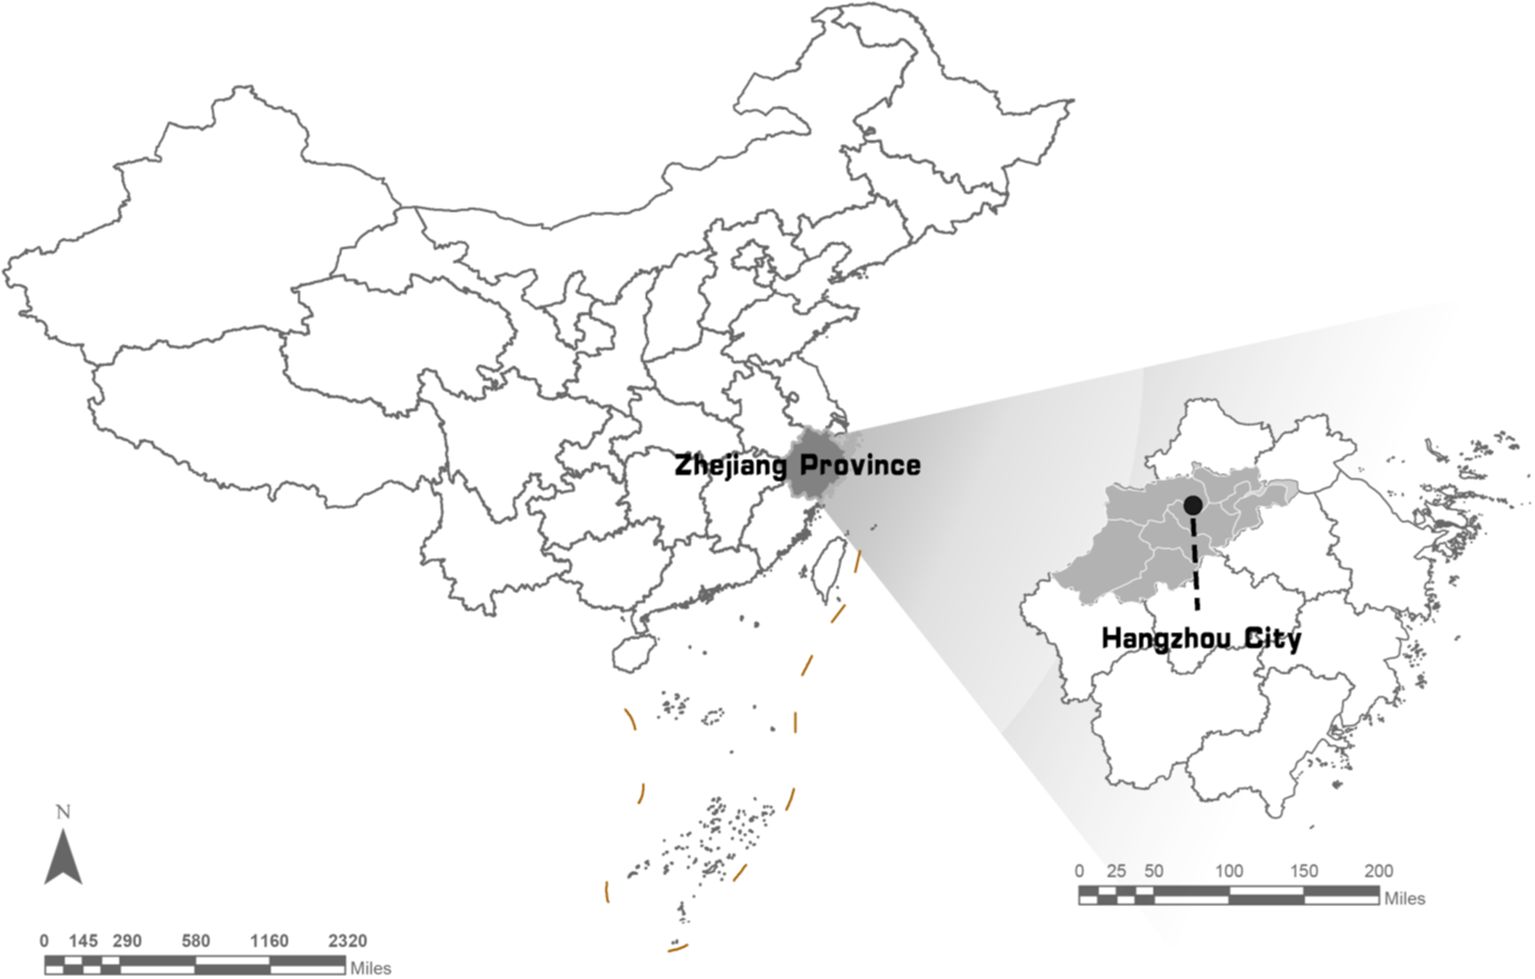
Figure 1. Study area for PWD surveillance at sub-compartment scale. All PWD-infected tree were located coordinately in the sub-compartments in the Digital Forest Protection system (https//szsf.lyj.zj.gov.cn).
2.2 The sub-compartment design
A sub-compartment constitutes the smallest unit for forest management and organization of timber production, denoting a section with substantially uniform internal characteristics and distinct differences from adjacent areas (Figure 1) (Xie et al., 2011). It is also serves as a fundamental unit for forest resource investigation and management (Liu et al., 2023a). Within the work area, sub-compartments with identical site conditions, stand factors, cutting methods, management measures, and logging systems are aggregated. The delineation of the sub-compartment is primarily determined by the natural zoning of the logging system (Zhang et al., 2014). Typically, the area of a sub-compartment should be approximately 5 ha, with a maximum of 20 ha.
2.3 Data collection
This study utilized PWD occurrence data obtained in Hangzhou city, Zhejiang Province, China from 2021 to 2023. The sub-compartmental-level occurrence data of PWD were provided by the Zhejiang Provincial Forest Disease and Pest Control Station of China (ZJSF) and deposited in the Digital Forest Protection system (szsf.lyj.zj.gov.cn, accessed on 6 July 2024) (Zhang et al., 2024). Statistical data on the occurrence of PWD areas were collected by the forestry bureaus of various districts and counties in Zhejiang Province, based on ground and UAV investigation. The data were subsequently reported to the ZJSF and National Forestry and Grass Administration Forest and Grassland Pest Control Station of China (NFGA) through the autumn census each year. The data fields encompass the numbers of diseased and dead trees in every sub-compartment and the area of sub-compartment. Data were verified by the Quarantine Office of the Forest and Grassland Pest Control Station of the State Forestry and Grassland Administration.
2.4 Epidemiological parameters definition
Disease prevalence (DP) was calculated as the percentage of fields where the disease was detected (Nutter et al., 1991). To provide a more precise characterization of the PWD prevalence, epidemiological parameters based on the sub-compartmental scale were defined as follows:
1. N, Number of PWD-infected trees within each sub-compartment.
2. NC, The average number of PWD-infected trees per ha within one sub-compartment.
3. Ln (N), the natural logarithm value of N.
4. Ln (NC), the natural logarithm value of NC.
5. DS, Diagrammatic scale for PWD evaluation.
6. DPI, Diagrammatic prevalence index.
DPI was calculated based on DS scores in a certain geographic/administrative scale (Equation 1) (Chiang et al., 2017).
2.5 Diagrammatic scale for evaluation of PWD prevalence at the sub-compartment scale
Based on the histogram distribution of the calculated PWD Ln (NC) values, intervals with higher Ln (NC) value were selected to establish the levels of the diagram. The diagrammatic scale (DS) was developed by utilizing the higher frequency class intervals of Ln (NC) values, and in the adapted Weber-Fechner law (Nutter and Schultz, 1995; Belan et al., 2014; Perina et al., 2019). Following the determination of the prevalence intervals to be represented and considered the shape and distribution of Ln (NC) values, a 12-intervals were employed to generate the DS.
2.6 Data analysis
The obtained data were analyzed using the IBM SPSS Statistics (version 20.0; SPSS Inc.), GraphPad Prism 9.5, and Microsoft Excel 2007. Histograms were used for investigating the distribution of PWD occurrence from the sub-compartment and to identify the shape of the distribution. The component statistics were compared among different epidemiological parameters methods, including mean (ma), median (md), standard deviation (σ), variance (σ2), skewness (Sk), and Kurtosis (bk).
3 Results
3.1 Baseline accuracy for PWD prevalence at the sub-compartment scale
Utilizing PWD prevalence data from 7,818 pine forest sub-compartments in Hangzhou, China, collected in 2021, we mapped the distributions of four key indexes, including N, NC, Ln (N), and Ln (NC), at the sub-compartment level (Figure 2). Our analysis revealed substantial variations in these distributions across the different prevalence index parameters (Table 1). Notably, the distribution of N exhibited a pronounced leftward skew, with a mean of 14.73 and a median of 7. The variance (σ2) was high at 449.98, accompanied by a skewness (Sk) of 3.49 and kurtosis (bk) of 16.93. In contrast, the R value displayed an even more pronounced leftward skew and kurtosis, with a variance (σ2) of 96.87, skewness (Sk) of 10.74, and kurtosis (bk) of 199.76. When comparing Ln (N) and Ln (NC) to N and R, we observed a significant normalization of skewness. Specifically, the variance (σ2), skewness (Sk), and kurtosis (bk) of Ln (N) decreased to 1.50, 0.15, and -0.77, respectively. However, Ln (NC) demonstrated the most optimal normal distribution, with an average of 0.96, a median of 1.04, a variance (σ2) of 1.53, a skewness (Sk) of -0.18, and a kurtosis (bk) of -0.05. Consequently, Ln (NC) was chosen as the baseline accuracy metric for further research into PWD prevalence dynamics at the sub-compartment scale.
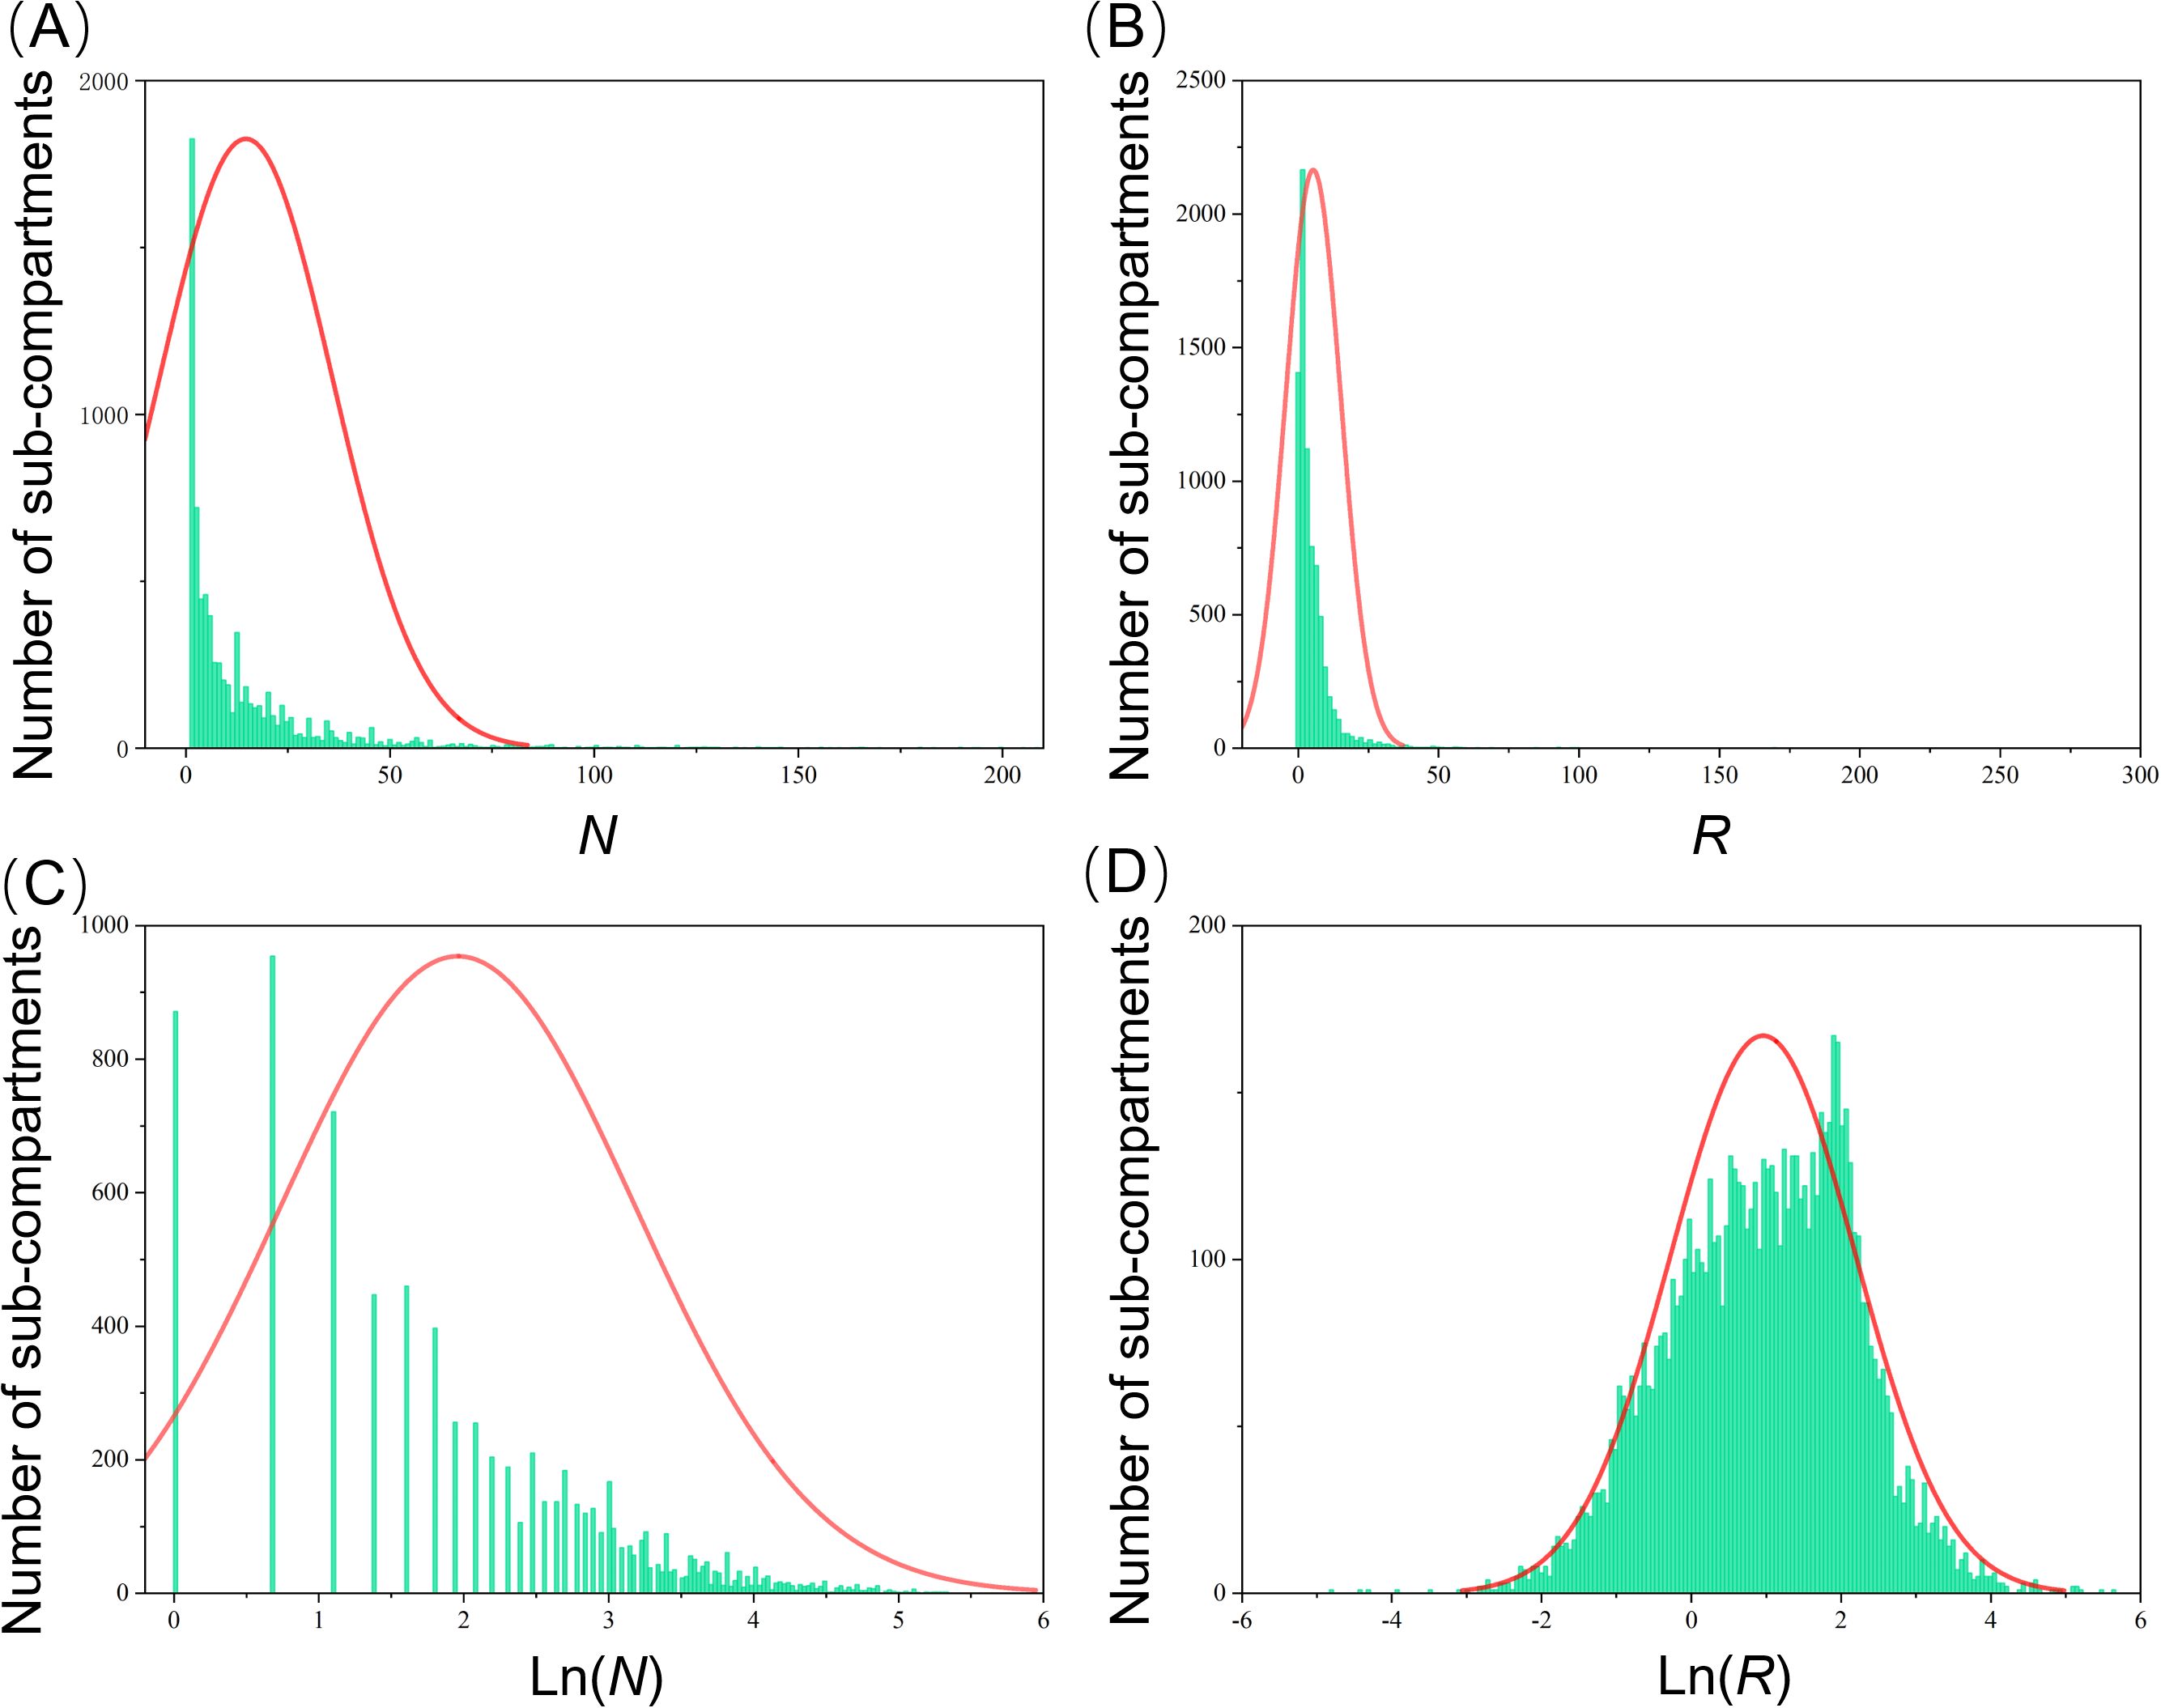
Figure 2. Histogram of occurrence of PWD based on N (A), NC (B), Ln (N) (C), and Ln (NC) (D) in the sub-compartment level in Hangzhou in 2021.
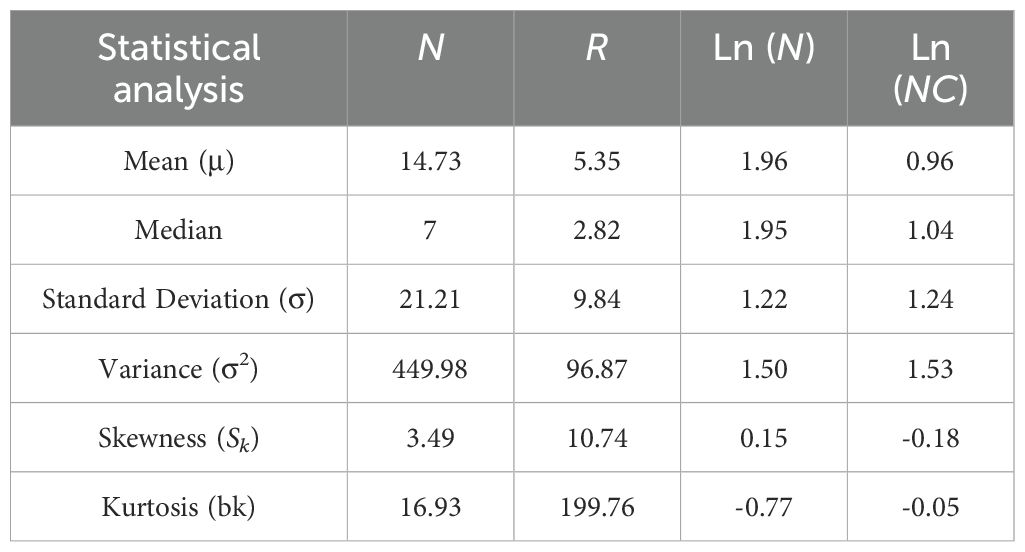
Table 1. The statistical analysis of different epidemiological parameters.
3.2 Development of a diagrammatic scale to semi-quantifying PWD prevalence at the sub-compartment scale
Utilizing the normal distribution of Ln (NC) values from PWD prevalence parameters at the sub-compartment scale in Hangzhou for 2021, we categorized these values into 12 levels (Table 2). For each Ln (NC) level, we established a corresponding diagrammatic scale (DS), with DS values ranging from 0 to 12 and linearly correlated with Ln (NC). A DS value of 0 indicates the absence of PWD-infected pine trees within the sub-compartments. Furthermore, we conducted a parallel aggregation analysis on the prevalence indices N, R, Ln(N), Ln (NC), and DS across all PWD-infected sub-compartments (Figure 3). The analysis revealed a normal distribution along the DS value axis, with concentrations predominantly at levels 5, 6, 7, and 8, comprising 90.32% of the total. This distribution pattern was also consistent in the Ln (NC) axis. Notably, significant crossover phenomena were observed along the Ln (N) axis, where lower E values appeared at higher positions on the Ln (N) axis. Similar crossover effects were observed for the NC and N- value axes.
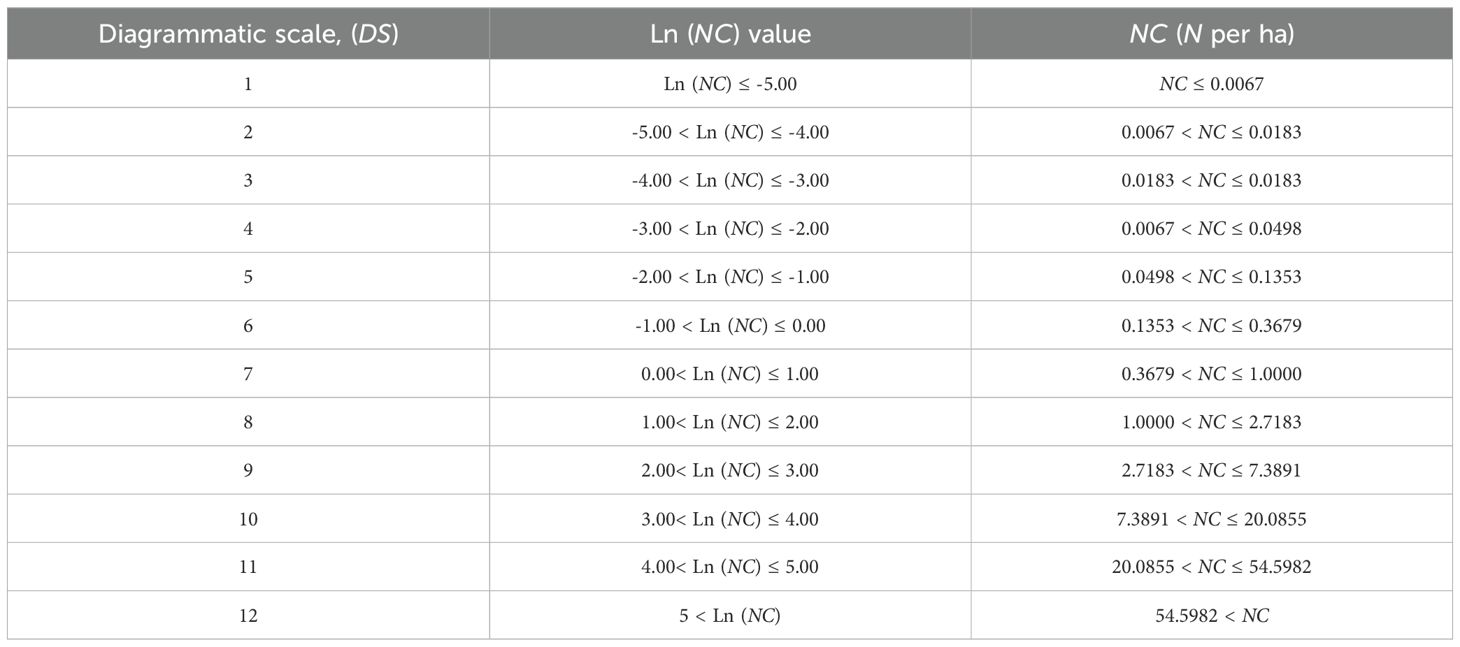
Table 2. Diagrammatic scale (DS) set for pine wilt disease prevalence at the sub-compartment scale.
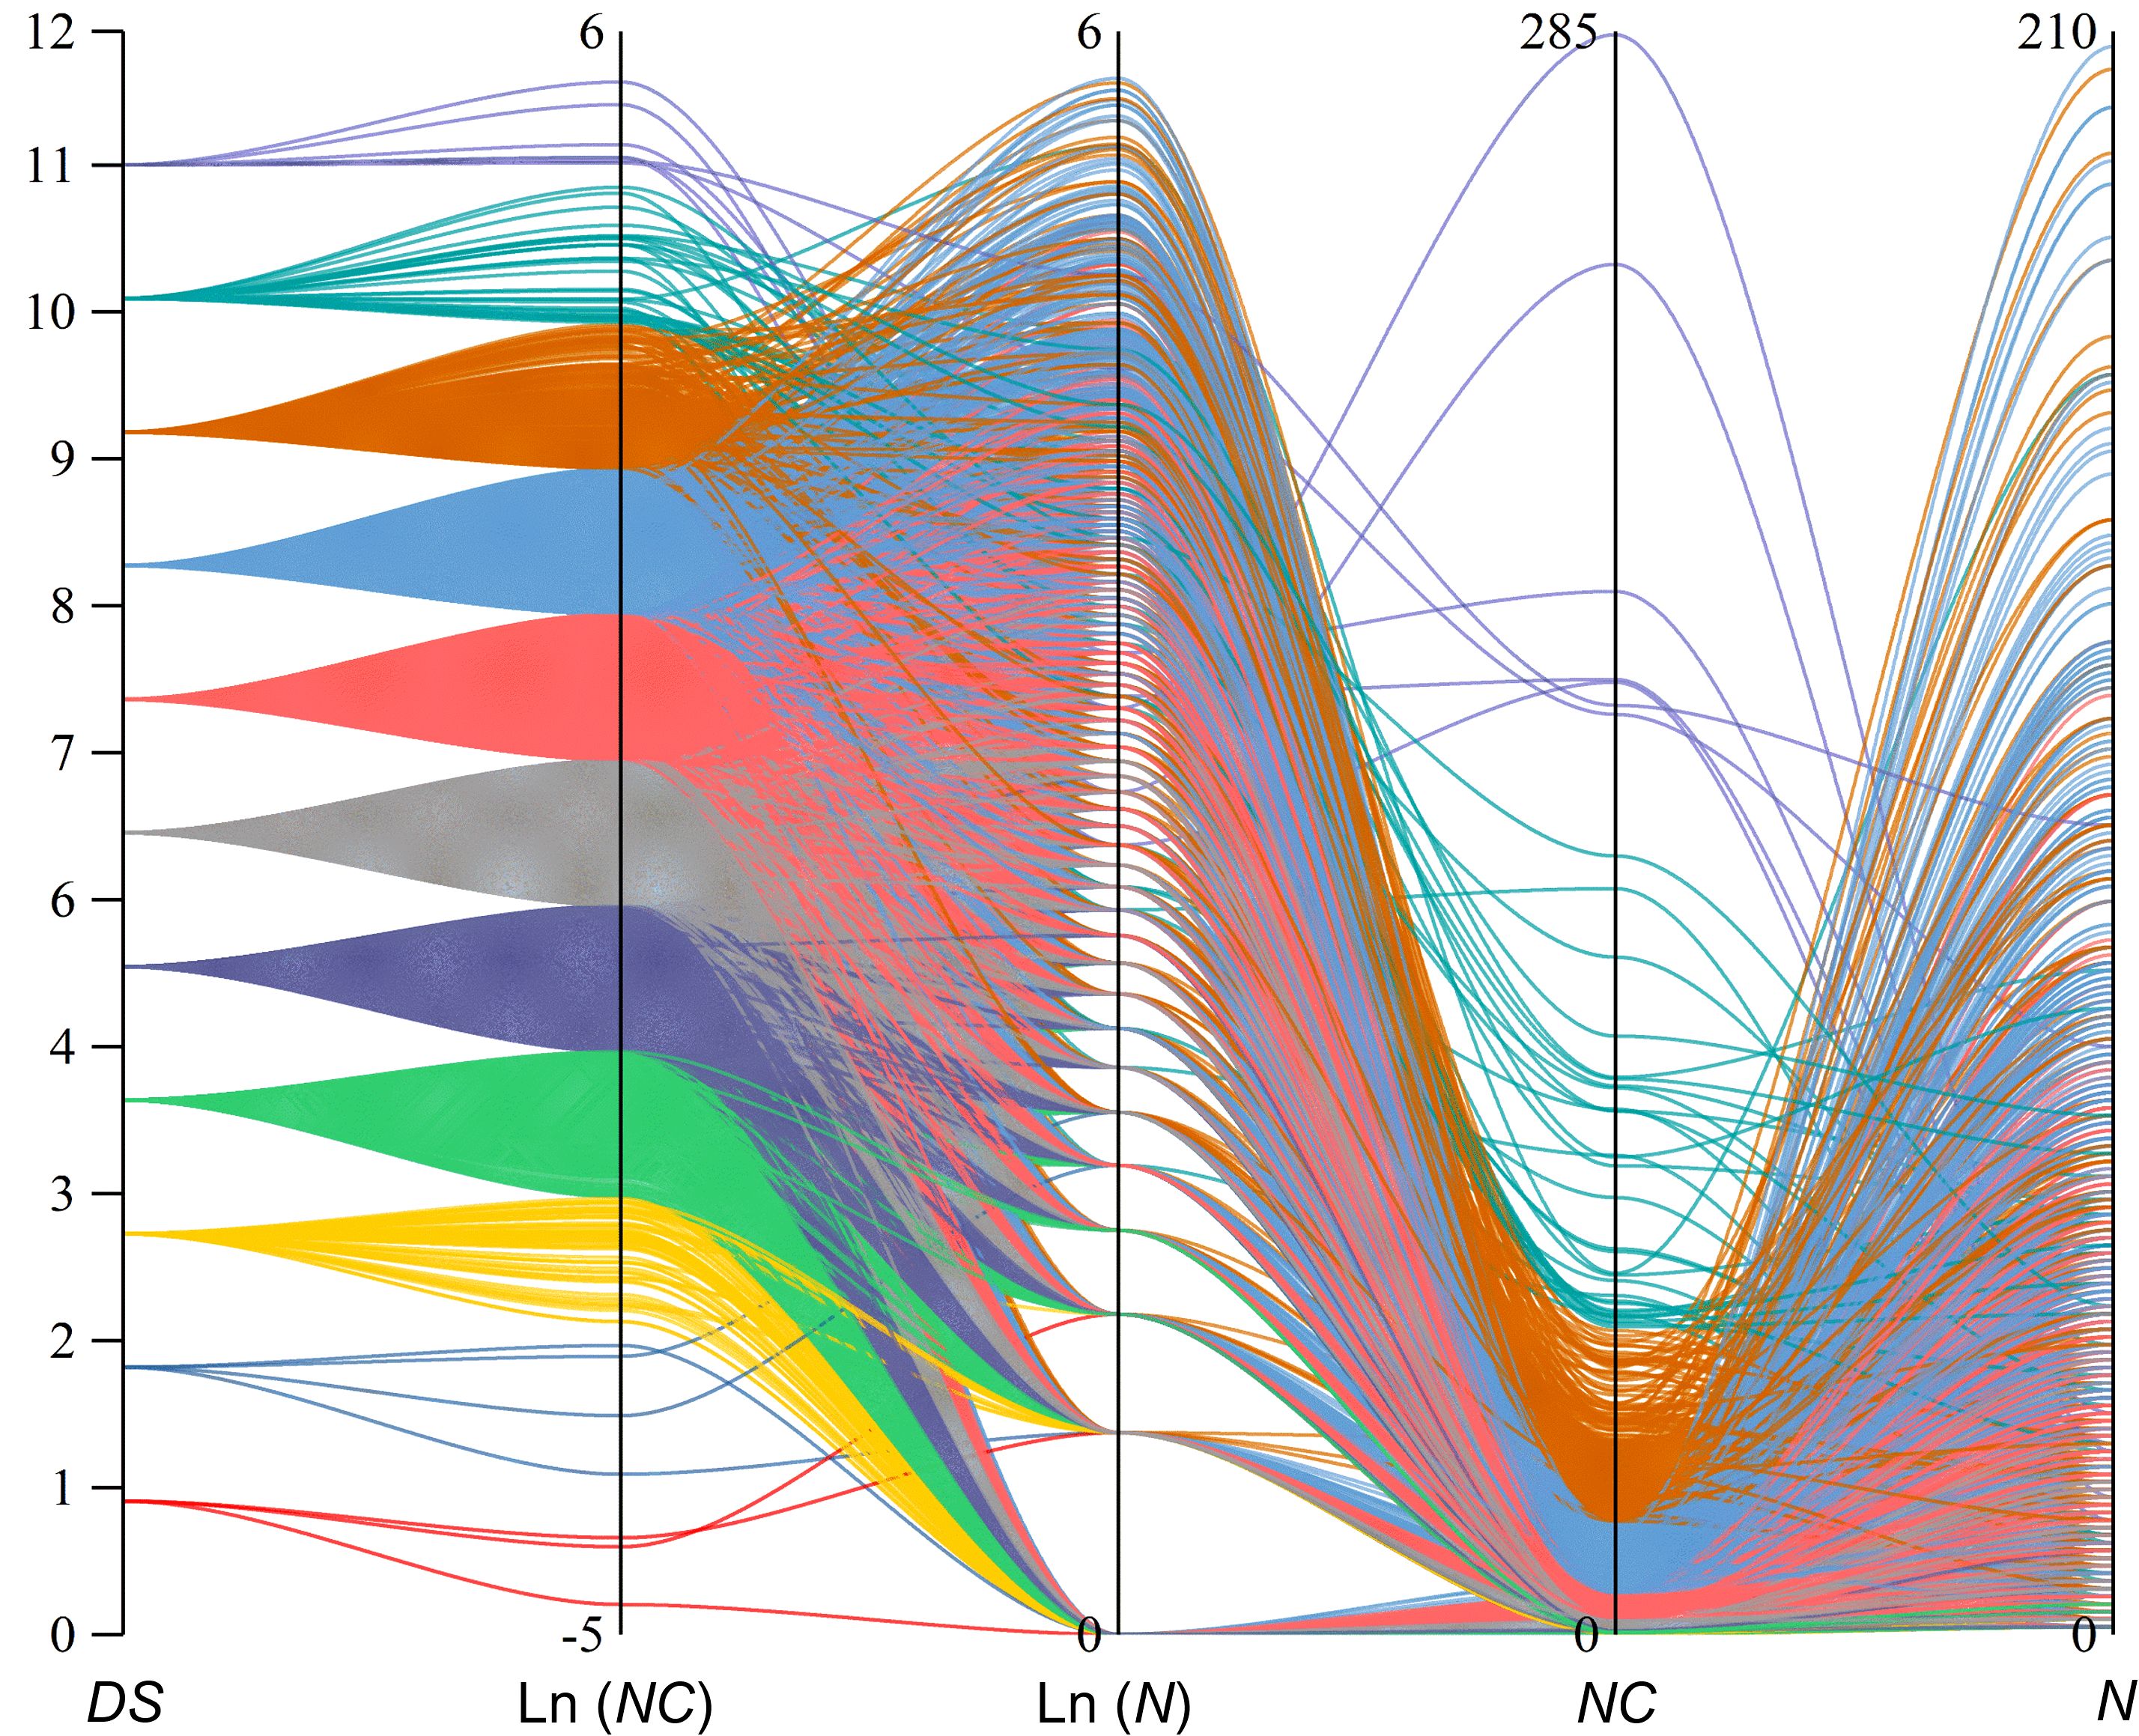
Figure 3. Parallel set plot for different prevalence indexes of 7,818 forest sub-compartments in 2021 Hangzhou, colours to differentiate diagrammatic scale (DS).
3.3 Validation of the diagrammatic scale
The diagrammatic scales were validated using the PWD prevalence data from 16 randomly selected villages. Linear regression analysis of these 16 randomly selected datasets revealed a positive linear relationship between various parameters, employing N, NC, or Ln (NC) and the DS value (Figure 4). However, the coefficient of determination (CoD. R2) exhibited a substantial variation. The regression R2 value for the relationship between N value and DS value was the lowest at 0.39. The R2 value for NC and DS was 0.52, whereas that for Ln (NC) and DS was the highest at 0.92.
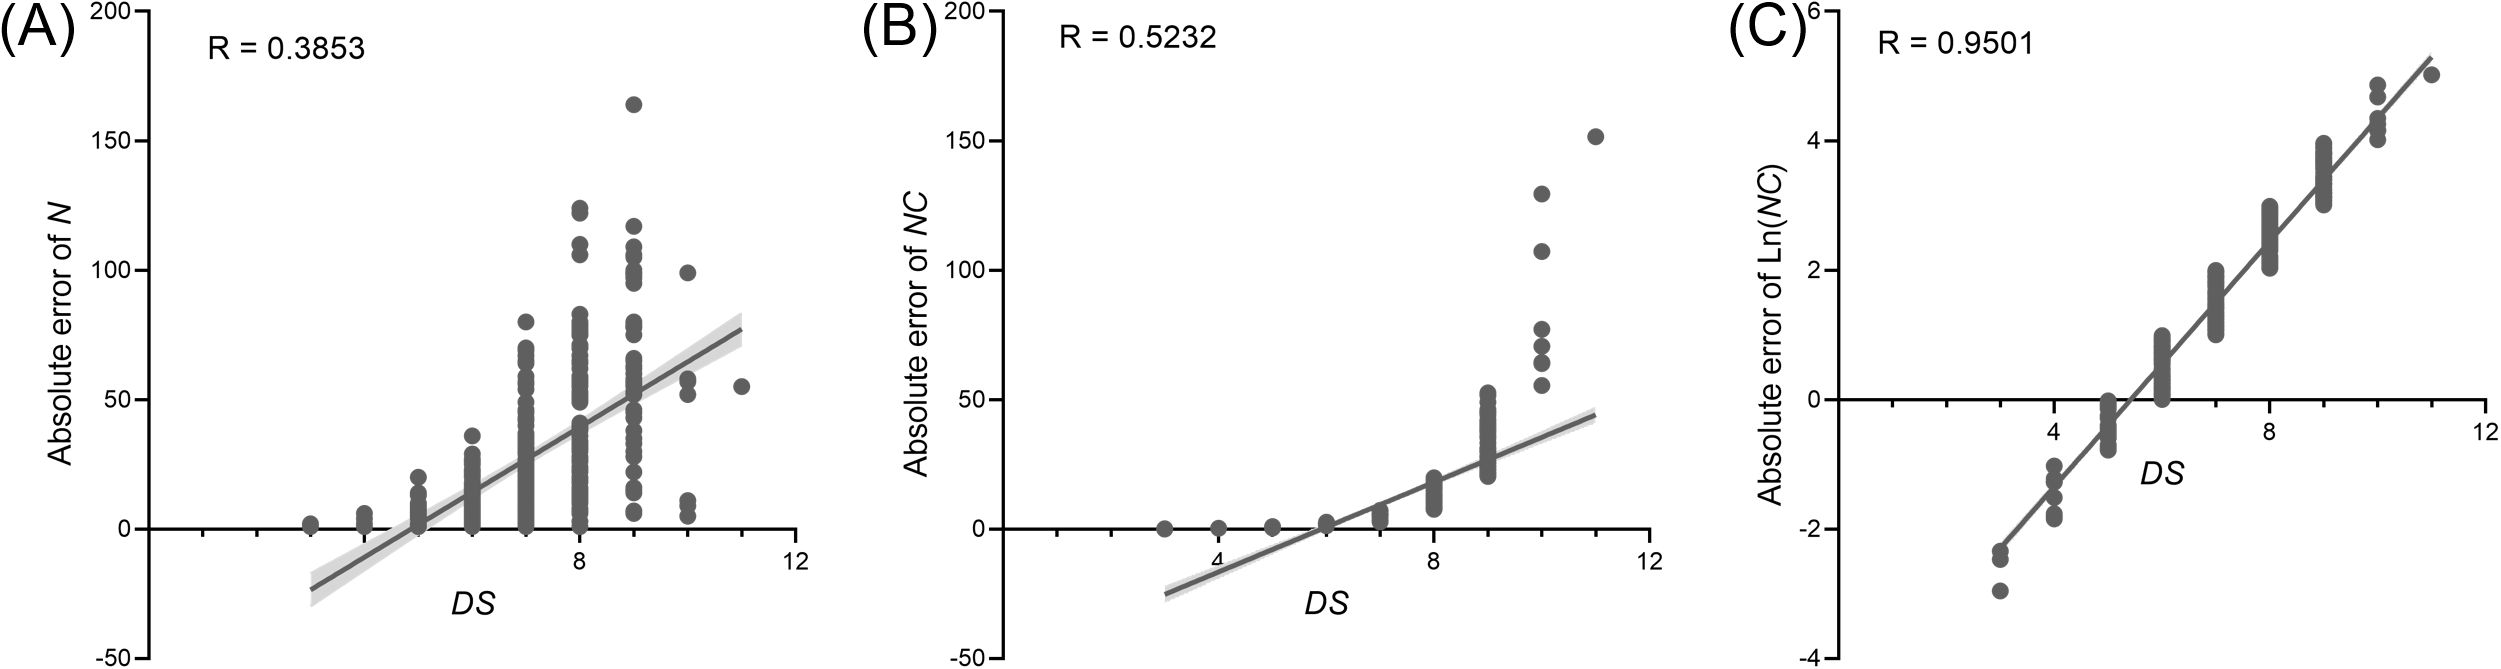
Figure 4. Relationship of N value (A), R value (B), and Ln (NC) value (C) to DS value based on 16 randomly selected pine wilt disease (PWD) prevalence at the village-level. The solid line represents the best fitting line. Box plot of coefficient of determination (R2) statistics for severity estimations by raters based on the linear regression relationship between different parameters and DS.
3.4 Application of diagrammatic prevalence index for PWD prevalence in Hangzhou
In conjunction with sub-compartment data from unaffected pine forests, we introduced the diagrammatic prevalence index DPI to summarize the PWD prevalence of PWD across the region. In 2021, Hangzhou had a total of 118,546 infected pine trees with P value of 13.32%, calculated with an E value of 7.18 (Table 3). In 2022, the total number of infected pine trees was 68,293 with P value of 11.17% and a DPI value of 5.67, representing decreases of 42.39%, 16.16%, and 20.94% compared to 2021, respectively. In 2023, the total number of infected pine trees was 39,061 with P value of 7.23%, and DPI value of 3.60, demonstrating decreases of 42.80%, 35.32%, and 36.55% respectively, compared to 2022. DPI index provides a novel metric for evaluating the prevalence in Hangzhou. Combined with DS value for each sub-compartment and the occurrence and status of PWD-infected sub-compartments, we calculated the diagrammatic prevalence indexes (DPI) of each town in Hangzhou from 2021 to 2023 (Figure 5). The analysis of DPI values from a total of towns revealed consistent dynamic patterns in PWD decline, aligning closely with the outcomes derived from other metrics. The near-identical annual reduction rates (~42%) suggest consistent efficacy of PWD-infected tree removal and sanitation. However, the sharper decline in DPI highlights its sensitivity to spatial clustering. As management prioritized high-DS sub-compartments (mainly levels 5–8), localized hotspots were neutralized, reducing regional aggregation.
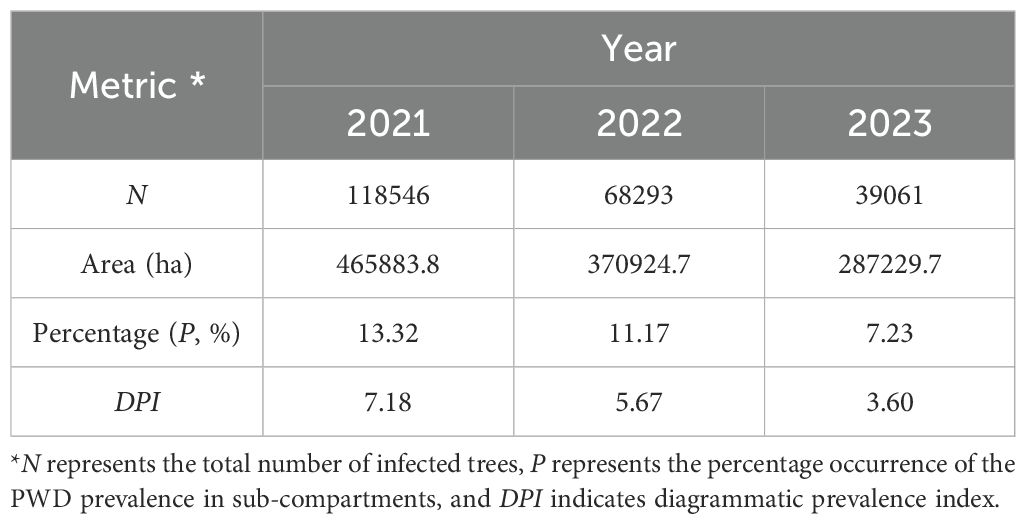
Table 3. Different prevalence indexes of pine wilt disease in Hangzhou City based on N, P, Area, and DPI values.
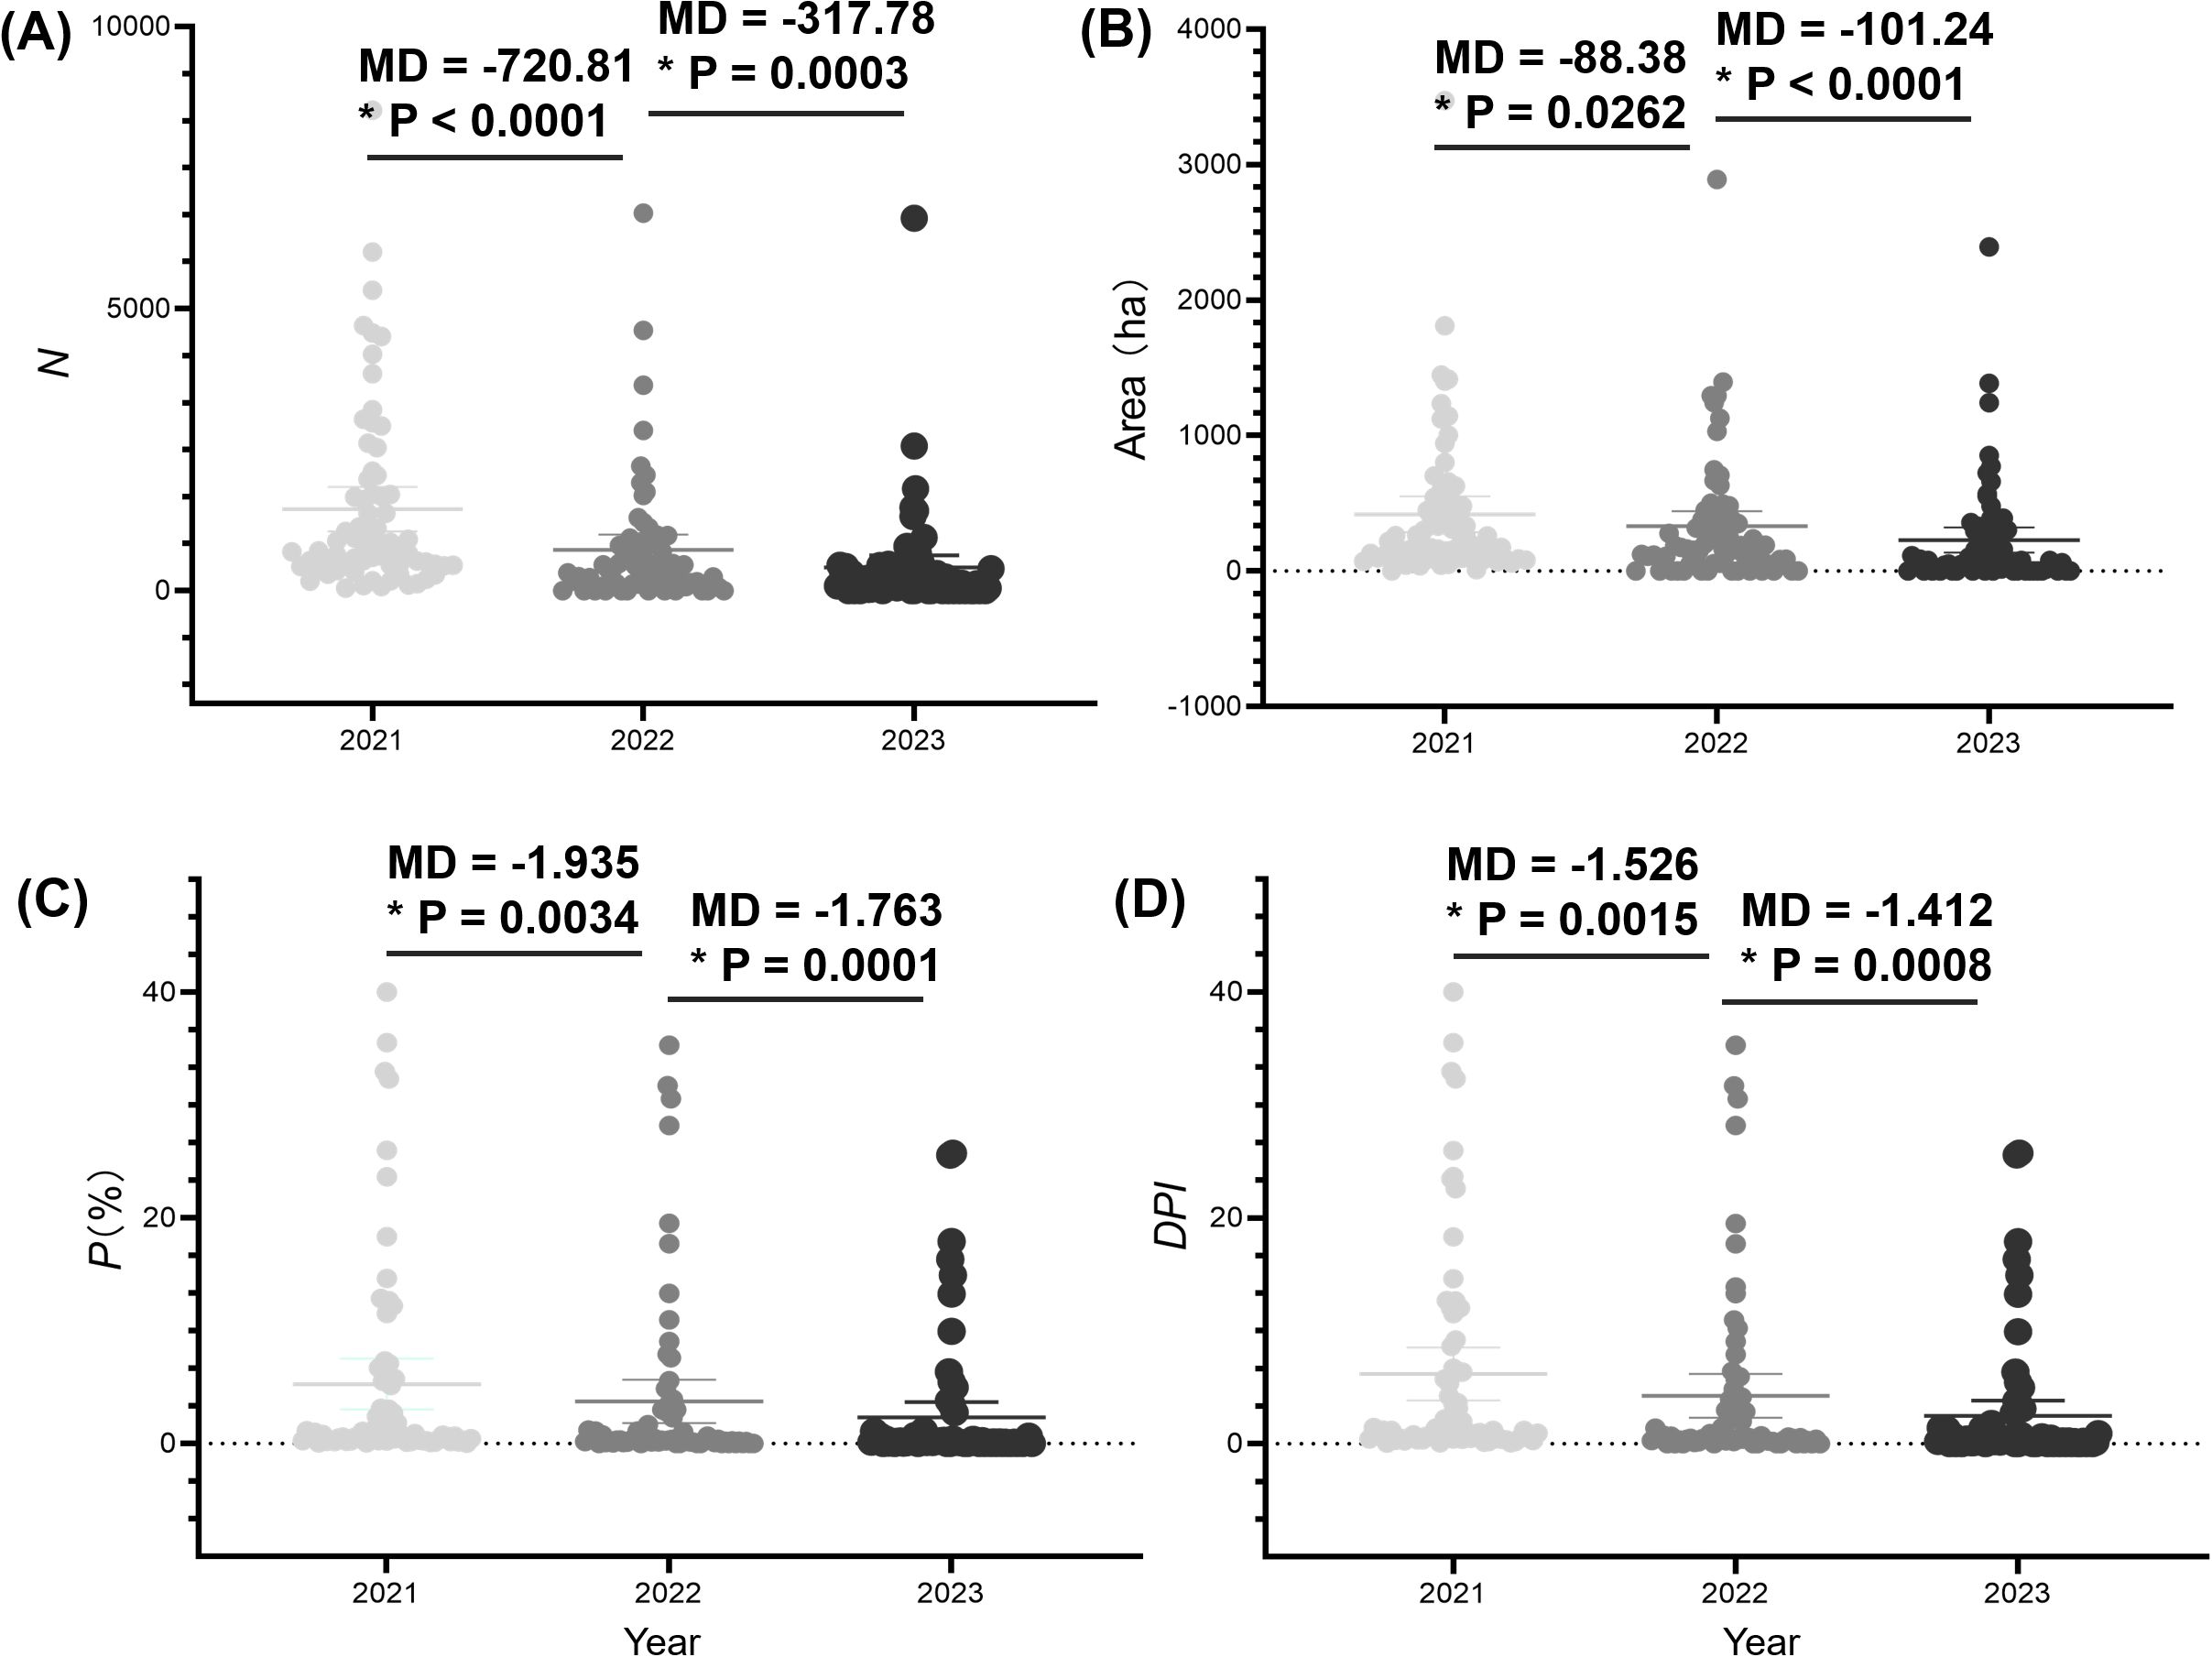
Figure 5. Analysis of the prevalence of pine wilt disease (PWD) in Hangzhou city from 2021 to 2023 based on the numbers of PWD-infected trees (N) (A), PWD-infected sub-compartment area (B), percentage of PWD-infected sub-compartment (P) (C), and diagrammatic prevalence index (DPI) (D). The solid circles represent individual metric values for each town. The central lines mark the mean value. The error bars across the boxes indicates the standard errors. MD indicates the difference of mean. Asterisks (*) in the figure indicate significant differences derived from two-sample comparisons (P = 0.05).
3.5 County-level variability of diagrammatic prevalence index
The study analyzed the prevalence of PWD at the county level from 2021 to 2023 using various metrics, including DPI (Figure 6). This variability was consistent with patterns observed using other metrics such as N, Area, and P. The results revealed significant variability in DPI across different counties. For example, faster declines of DPI in CAX correlate with the application of precise PWN management in 2023, while slower progress in FYQ reflects challenges in managing historically dense infestations.
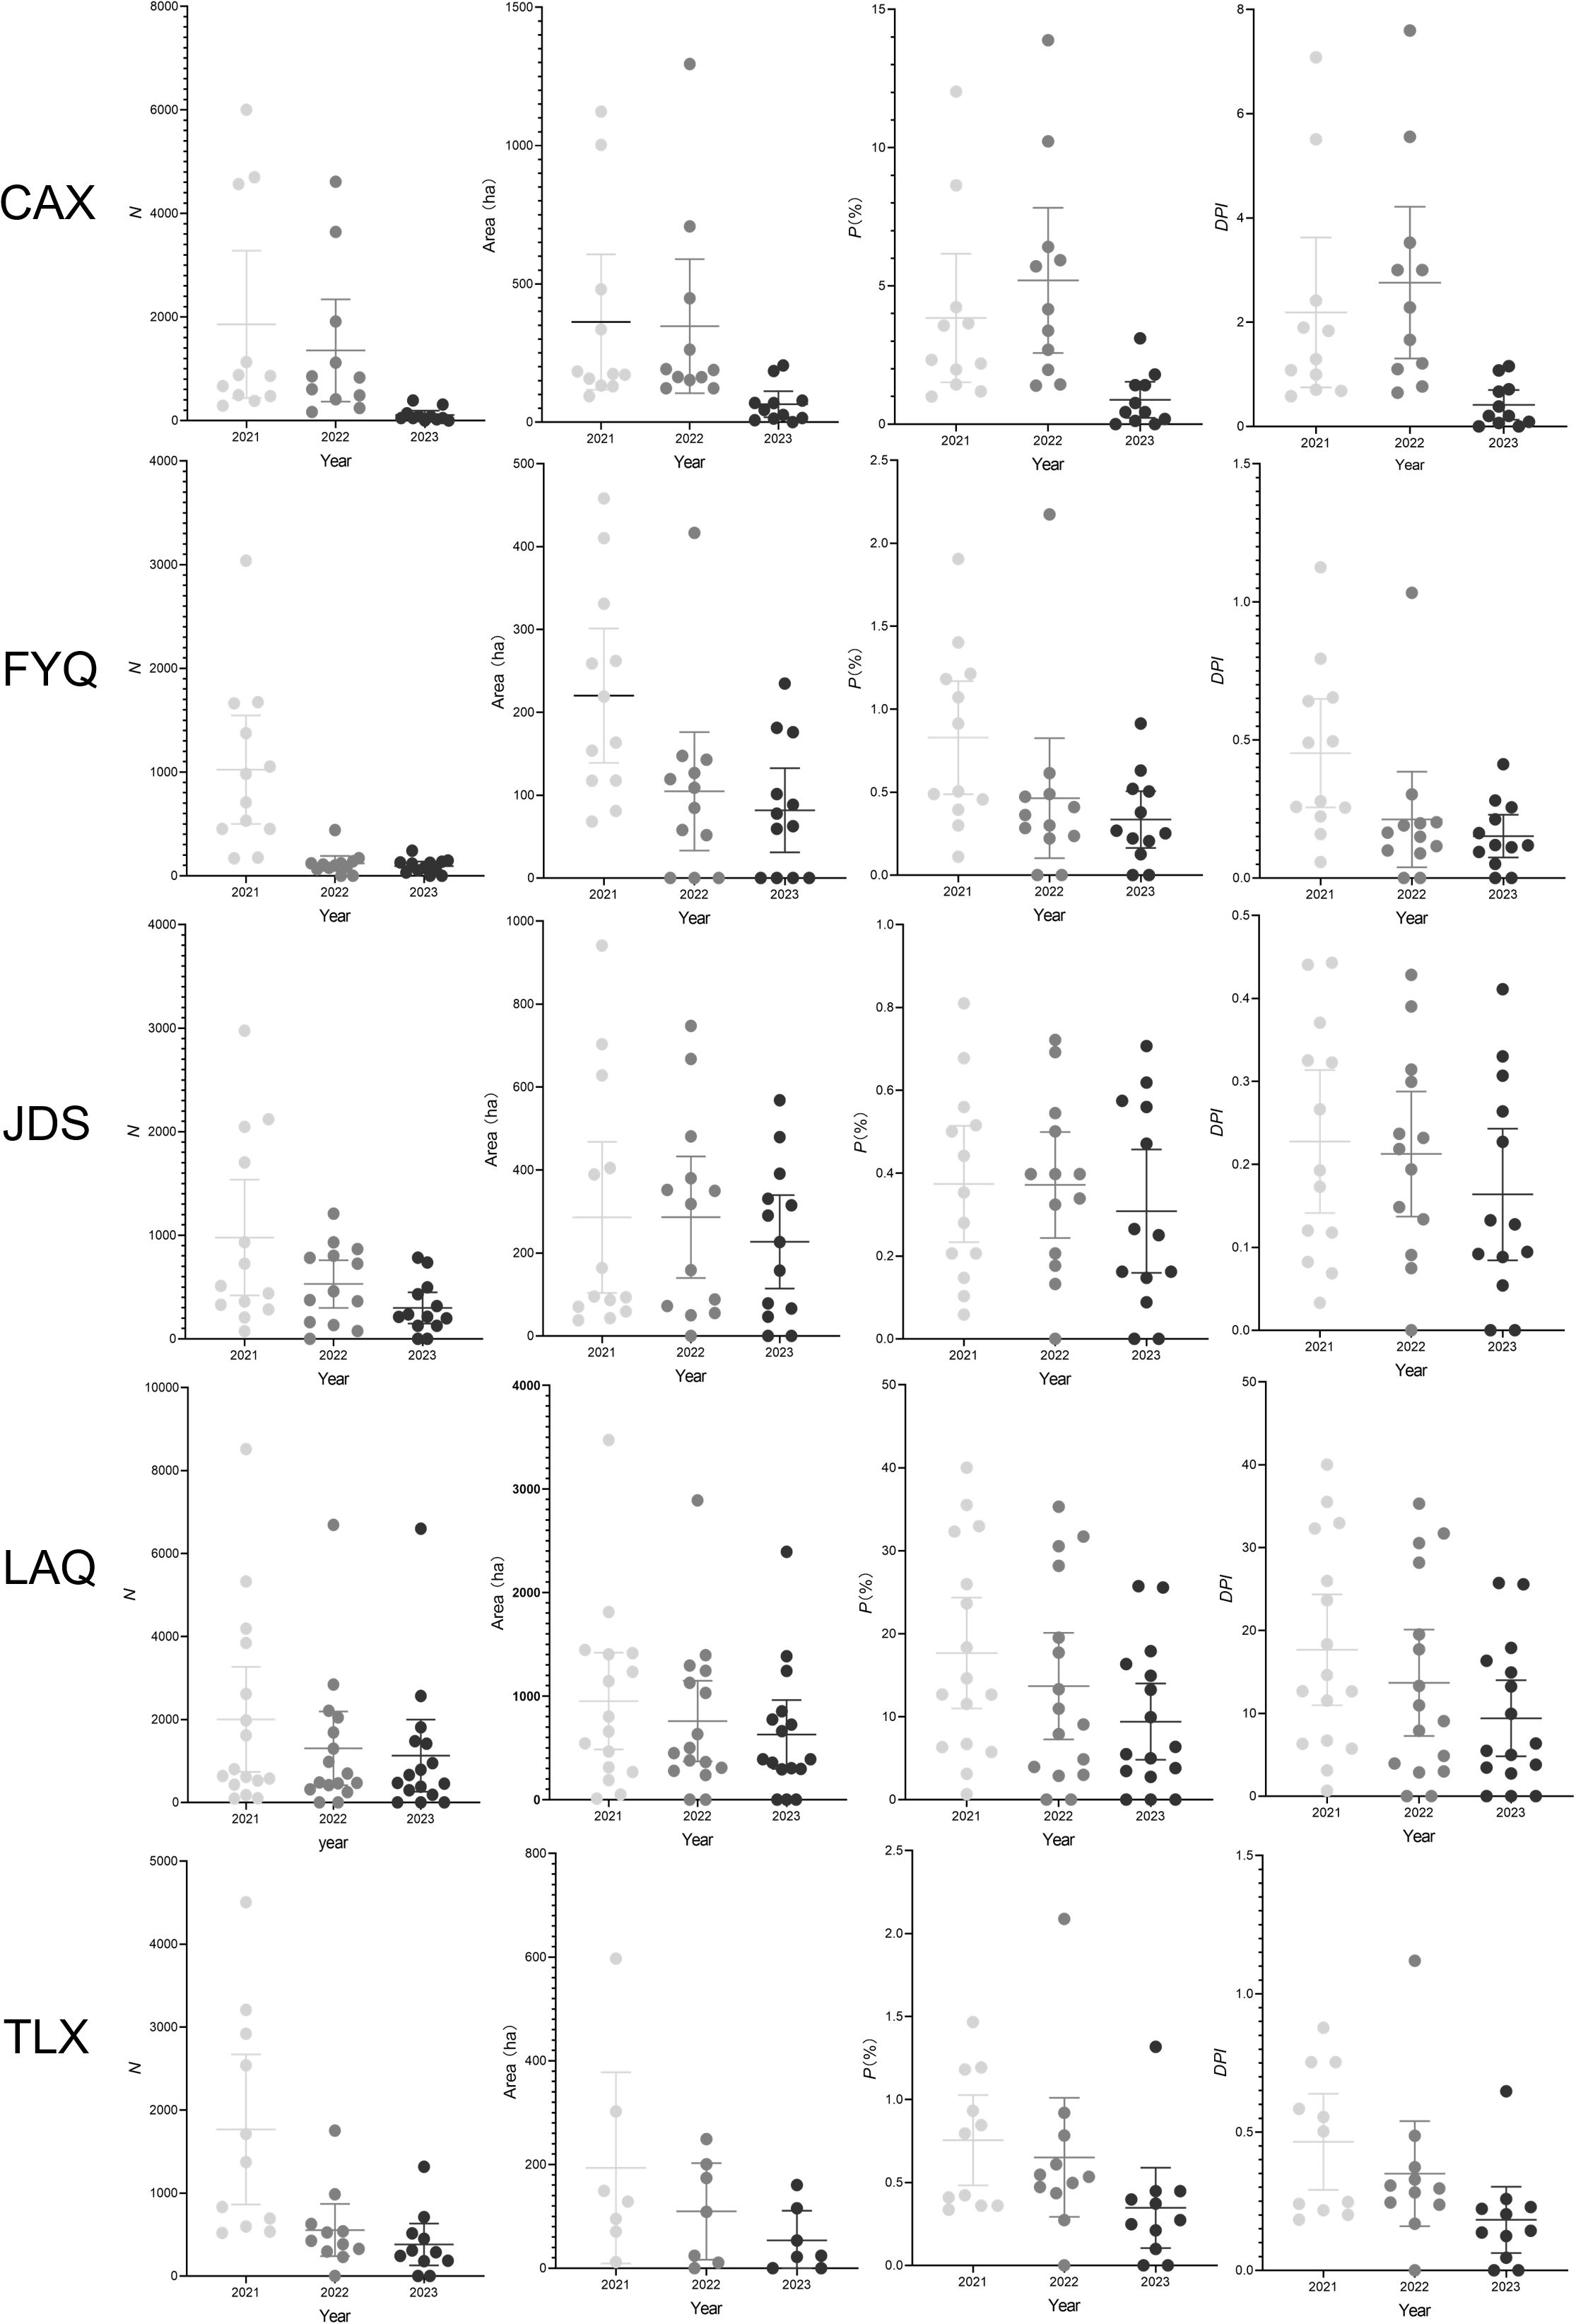
Figure 6. Analysis of the prevalence of pine wilt disease (PWD) in Chunan County (CAX), Fuyang County (FYQ), Jiande County (JDS), Linan County (LAQ), and Tonglu County (TLX) of Hangzhou city from 2021 to 2023 based on the numbers of PWD-infected trees (N), PWD-infected sub-compartment area, percentage of PWD-infected sub-compartment (P), and diagrammatic prevalence index (DPI). The solid circles represent individual metric values for each town. The central lines mark the mean value. The error bars across the boxes indicates the standard errors.
4 Discussion
This study conducted a comprehensive analysis of the PWD prevalence in Hangzhou, China, in 2021, encompassing seven prevalence areas and 7,818 pine forest sub-compartments. A novel algorithm for semi-quantifying the PWD prevalence at the forest sub-compartment level was developed based on the number of infected pine trees and sub-compartment area. This innovative algorithm enables the quantitative evaluation of PWD prevalence across various geographic or administrative levels. In contrast to previous methods that relied on non-epidemic area risk models, this study’s algorithm is grounded in actual dataset from a PWD epidemic area with over 20 years of historical records (De La Fuente and Beck, 2018). The outcomes of this study provide multiple insights into the epidemiological patterns of PWD (Ikeda, 2007).
In recent decades, limitations in data acquisition and quantification have severely impeded the progress of PWD epidemiological studies in a fine geographic scale (Ecke et al., 2022). Since 2021, forestry authorities have determined the PWD prevalence data at the forest sub-compartment level to obtain a more precise understanding of PWD outbreaks in China. Forest sub-compartments are fundamental units for resource surveys and monitoring, and are essential for formulating forest management strategies, as well as for evaluation (Wu et al., 2012). Beginning in 2021, a digital forest protection platform was implemented in in Zhejiang Province, China. UAVs were used to conduct the PWD survey at the individual tree level, and the data within each forest sub-compartment were aggregated. This study represents the initial quantification of PWD incidence on a fine geographic scale, specifically in a sub-compartment scale. This approach offers the advantage of providing more accurate PWD occurrence data, thereby enabling forestry administrations to develop precise preventive and control plans.
Typically, quantification of plant disease severity relies on estimation methods based on visual assessments or image analysis of infected plant parts (Nutter and Schultz, 1995; Bock et al., 2020, 2022). However, in our study, we quantified PWD based on the determined data at the sub-compartment scale. Notably, different diseases may have distinct indices or assessment methods, and specific details can be found in relevant research papers or agricultural guidelines (Chiang et al., 2017; Madden et al., 2017). Furthermore, the accuracy and reliability of the plant disease index depend on the quality and consistency of data collection and analysis (Bock et al., 2010; Huang et al., 2024). The plant disease index is a crucial indicator used to evaluate the severity of plant diseases, usually calculated based on the degree of damage or infection observed in plants (Chiang et al., 2017). However, in PWD, infected pine trees invariably succumb to the disease. Therefore, when analyzing disease severity, we generally do not utilize the degree of damage to individual pine trees as the standard for disease severity; instead, we employ metrics such as the affected area and number of infected trees as indicators of disease severity or PWD spread. This suggests that relying solely on the number of infected pine trees to evaluate prevalence severity within a sub-compartment is insufficient and does not fully capture the complexity of the PWD prevalence status. Consequently, a standard diagrammatic scale based on the E value has been employed to evaluate the PWD prevalence at the sub-compartment scale.
This study, of the first time, combined the number of infected trees and the area of forest sub-compartments to compare baseline accuracy for pine wilt disease (PWD) prevalence. The analysis revealed significant variations in the distributions of data across different prevalence parameters: N, NC, Ln (N), and Ln (NC). The pronounced leftward skew and high kurtosis observed in the distributions of N and NC highlight the complexity and variability of PWD prevalence at the sub-compartment scale (Belan et al., 2014; Perina et al., 2019). The logarithmic transformations Ln (N) and Ln (NC) normalized the skewness, suggesting these transformations can mitigate the impact of extreme values and provide a more balanced representation of the prevalence data. Among these, Ln (NC) was selected as the baseline accuracy metric due to its optimal normal distribution characteristics, which are crucial for reliable statistical analysis and modeling of PWD prevalence. This approach offers a more nuanced understanding of PWD distribution, potentially leading to more effective management strategies (Chiang et al., 2017).
Semi-quantifying incomprehensible or intuitive data on an ordinal scale can provide a more accurate representation of the disease occurrence (Barbedo, 2016; Chiang and Bock, 2022). The results of Chiang et al. (2014) indicated that an amended 10% category scale with additional grades at low severity (also known as ‘Nearest percent estimates’) can be considered a superior choice for evaluating disease severity when the use of a scale is preferred over the Horsfall–Barratt scale (Bock et al., 2010). Our findings demonstrate that by categorizing Ln (NC) values into 12 levels and establishing DS scales, the DS provides a standardized framework for evaluating the severity of PWD prevalences within sub-compartments. Moreover, the 12-level scale was chosen to strike a balance between providing sufficient detail and maintaining practical usability for forest managers. It offers more granularity than many existing scales while remaining manageable for field application.
Different regions may experience variations in pine sawyer beetle population density, life cycle timing, dispersal patterns, and host preferences (Zhou et al., 2024; Futai and Ishiguro, 2025). These factors could significantly influence the spatial and temporal patterns of PWD spread, potentially impacting the accuracy and interpretation of the DPI method. For instance, areas with higher beetle populations or more favorable conditions for beetle activity might experience more rapid or extensive PWD spread, which could be reflected in higher DPI values or more rapid changes in DPI over time. Moreover, the application of DPI at different geographic scales, including town and county levels, demonstrates the versatility and applicability of the assessment framework. The dynamic prevalence of PWD at the county level and changes in DPI across different years highlight the spatial and temporal variability of the prevalence. The case studies of Lin’an District and THY Town illustrated the effectiveness of DPI in capturing the complexity of the PWD prevalence at various geographic scales. The observed decreases in DPI values over time suggest a potential trend of epidemic mitigation, which warrants further investigation.
Furthermore, the DPI index was developed to evaluate PWD prevalence in this study, analogous to the plant disease index (Barbedo, 2016). Analysis of the PWD prevalence from 2021 to 2023 utilizing the novel index DPI revealed a consistent pattern of normal distribution characteristics in the DS values across different years. The introduction of DPI enhances the comprehensiveness of the assessment framework by summarizing the occurrence of PWD across the region. The observed changes in DPI over the three-year period indicate a potential trend of epidemic mitigation. These observed changes suggest a potential trend of epidemic mitigation, indicating that the current control measures may be having a positive impact on PWD prevalence in the region. Our analysis demonstrated the effectiveness of DPI in capturing the complexity of PWD prevalence at various geographic scales, including the county level. This county-level variability in DPI values over time suggests spatial and temporal differences in PWD prevalence, which could be influenced by factors such as local environmental conditions and management practices. The dynamic trends in N, P, and DPI are not merely statistical artifacts but evidence of a functioning PWD integrated management framework (Chen and Li, 2024).
5 Conclusion
In conclusion, this study introduced a novel algorithm that provides a standardized framework for evaluating PWD prevalence at the sub-compartment scale and across various geographic levels. The development of DS and DPI underscores the temporal and spatial heterogeneity of PWD prevalence patterns across sub-compartments. Future work will focus on enhancing the application of DPI to improve PWD prevalence monitoring and management.
Data availability statement
The original contributions presented in the study are included in the article/Supplementary Material. Further inquiries can be directed to the corresponding author.
Author contributions
YZ: Investigation, Methodology, Software, Writing – original draft. SZ: Data curation, Formal Analysis, Investigation, Methodology, Writing – original draft. JB: Investigation, Software, Writing – original draft. JH: Resources, Software, Writing – original draft. YW: Conceptualization, Funding acquisition, Resources, Supervision, Visualization, Writing – original draft, Writing – review & editing.
Funding
The author(s) declare that financial support was received for the research and/or publication of this article. The research described here was supported by a grant from Zhejiang Provincial Forestry Bureau Key Technologies R & D Program (2024LYYJ01) and a grant from Central Financial Forestry Science and Technology Promotion Demonstration Fund Project of China (2023TS02).
Acknowledgments
The authors give very special thanks to Mrs. Weishi Chen and Mr. Li Xie (Zhejiang Provincial Forest Disease and Pest Control Station, Hangzhou, 310019, China) for their assistance in the data collection.
Conflict of interest
The authors declare that the research was conducted in the absence of any commercial or financial relationships that could be construed as a potential conflict of interest.
Generative AI statement
The author(s) declare that no Generative AI was used in the creation of this manuscript.
Publisher’s note
All claims expressed in this article are solely those of the authors and do not necessarily represent those of their affiliated organizations, or those of the publisher, the editors and the reviewers. Any product that may be evaluated in this article, or claim that may be made by its manufacturer, is not guaranteed or endorsed by the publisher.
References
Akbulut, S. and Stamps, W. T. (2012). Insect vectors of the pinewood nematode: A review of the biology and ecology of Monochamus species. For. Pathol. 42, 89–99. doi: 10.1111/j.1439-0329.2011.00733.x
Back, M. A., Bonifácio, L., Inacio, M. L., Mota, M., and Boa, E. (2024). Pine wilt disease: A global threat to forestry. Plant Pathol. 73, 1026–1041. doi: 10.1111/ppa.13875
Barbedo, J. G. A. (2016). A novel algorithm for semi-automatic segmentation of plant leaf disease symptoms using digital image processing. Trop. Plant Pathol. 41, 210–224. doi: 10.1007/s40858-016-0090-8
Barzman, M., Bàrberi, P., Birch, A. N. E., Boonekamp, P., Dachbrodt-Saaydeh, S., Graf, B., et al. (2015). Eight principles of integrated pest management. Agron. Sustain. Dev. 35, 1199–1215. doi: 10.1007/s13593-015-0327-9
Belan, L. L., Pozza, E. A., Freitas, M. L. D., De Souza, R. M., De Jesus, W. C., and Oliveira, U. M. (2014). Diagrammatic scale for assessment of bacterial blight in coffee leaves. J. Phytopathol. 162, 801–810. doi: 10.1111/jph.12272
Bock, C. H., Barbedo, J. G. A., Del Ponte, E. M., Bohnenkamp, D., and Mahlein, A. K. (2020). From visual estimates to fully automated sensor-based measurements of plant disease severity: status and challenges for improving accuracy. Phytopathol. Res. 2, 9. doi: 10.1186/s42483-020-00049-8
Bock, C. H., Chiang, K. S., and Del Ponte, E. M. (2022). Plant disease severity estimated visually: a century of research, best practices, and opportunities for improving methods and practices to maximize accuracy. Trop. Plant Pathol. 47, 25–42. doi: 10.1007/s40858-021-00439-z
Bock, C. H., Poole, G. H., Parker, P. E., and Gottwald, T. R. (2010). Plant disease severity estimated visually, by digital photography and image analysis, and by hyperspectral imaging. Crit. Rev. Plant Sci. 29, 59–107. doi: 10.1080/07352681003617285
Chen, F. M. and Li, M. (2024). Comprehensive strategies for the prevention and control of pine wilt disease in China: a review and future directions. J. For. Res. 36, 9. doi: 10.1007/s11676-024-01803-w
Chiang, K. S. and Bock, C. H. (2022). Understanding the ramifications of quantitative ordinal scales on accuracy of estimates of disease severity and data analysis in plant pathology. Trop. Plant Pathol. 47, 58–73. doi: 10.1007/s40858-021-00446-0
Chiang, K. S., Liu, H. I., and Bock, C. H. (2017). A discussion on disease severity index values. Part I: warning on inherent errors and suggestions to maximise accuracy. Ann. Appl. Biol. 171, 139–154. doi: 10.1111/aab.12362
Chiang, K.-S., Liu, S.-C., Bock, C. H., and Gottwald, T. R. (2014). What interval characteristics make a good categorical disease assessment scale? Phytopathology 104, 575–585. doi: 10.1094/PHYTO-10-13-0279-R
De La Fuente, B. and Beck, P. S. A. (2018). Invasive species may disrupt protected area networks: Insights from the pine wood nematode spread in Portugal. Forests 9, 282.
De La Fuente, B. and Saura, S. (2021). Long-term projections of the natural expansion of the pine wood nematode in the Iberian Peninsula. Forests 12, 849. doi: 10.3390/f9050282
Ecke, S., Dempewolf, J., Frey, J., Schwaller, A., Endres, E., Klemmt, H. J., et al. (2022). UAV-based forest health monitoring: A systematic review. Remote Sens. 14, 3205. doi: 10.3390/rs14133205
EPPO (2012). Bursaphelenchus xylophilus and its vectors: procedures for official control. EPPO Bull. 42, 477–485. doi: 10.1111/epp.2621
Firmino, P. N., Calvao, T., Ayres, M. P., and Pimentel, C. S. (2017). Monochamus galloprovincialis and Bursaphelenchus xylophilus life history in an area severely affected by pine wilt disease: Implications for forest management. For. Ecol. Manage. 389, 105–115. doi: 10.1016/j.foreco.2016.12.027
Futai, K. (2013). Pine wood nematode, Bursaphelenchus xylophilus. Annu. Rev. Phytopathol. 51, 61–83. doi: 10.1146/annurev-phyto-081211-172910
Futai, K. and Ishiguro, H. (2025). Hidden threats: the unnoticed epidemic system of pine wilt disease driven by sexually mature monochamus beetles and asymptomatic trees. Biology 14, 485. doi: 10.3390/biology14050485
Gruffudd, H. R., Schröder, T., Jenkins, T., and Evans, H. F. (2019). Modelling pine wilt disease (PWD) for current and future climate scenarios as part of a pest risk analysis for pine wood nematode Bursaphelenchus xylophilus (Steiner and Buhrer) Nickle in Germany. J. Plant Dis. Prot. 126, 129–144. doi: 10.1007/s41348-018-0197-x
Hao, Z. Q., Huang, J. X., Li, X. D., Sun, H., and Fang, G. F. (2022). A multi-point aggregation trend of the outbreak of pine wilt disease in China over the past 20 years. For. Ecol. Manage. 505, 119890. doi: 10.1016/j.foreco.2021.119890
Huang, J. X., Zhao, X. T., Mo, X. M., Wu, J., Zhou, Y. T., and Fang, G. F. (2024). Host vegetation connectivity is decisive for the natural spread of pine wilt disease. Pest Manage. Sci. 80, 5141–5156. doi: 10.1002/ps.8240
Ikeda, T. (2007). Integrated pest management of Japanese pine wilt disease. Eur. J. For. Pathol. 14, 398–414. doi: 10.1111/j.1439-0329.1984.tb01253.x
Jones, J. T., Moens, M., Mota, M., Li, H., and Kikuchi, T. (2008). Bursaphelenchus xylophilus: Opportunities in comparative genomics and molecular host–parasite interactions. Mol. Plant Pathol. 9, 357–368. doi: 10.1111/j.1364-3703.2007.00461.x
Kwon, T. S., Shin, J. H., Lim, J. H., Kim, Y. K., and Lee, E. J. (2011). Management of pine wilt disease in Korea through preventative silvicultural control. For. Ecol. Manage. 261, 562–569. doi: 10.1016/j.foreco.2010.11.008
Liu, Y. Q., Huang, J. X., and Yang, T. (2023b). Natural factors play a dominant role in the short-distance transmission of pine wilt disease. Forests 14, 1059. doi: 10.3390/f14051059
Liu, F., Su, H. J., Ding, T. T., Huang, J. X., Liu, T., Ding, N., et al. (2023a). Refined assessment of economic loss from pine wilt disease at the subcompartment scale. Forests 14, 139. doi: 10.3390/f14010139
Liu, J., Xu, Y., Sun, P., Li, R., and Huang, H. (2001). Occurrence of pine wilt disease in Hangzhou city and its management strategy. For. Pest Dis. 3, 26–30.
Lv, Y. M., Huang, J. X., Fang, G. F., Wu, J., Yin, Y. Y., Zhou, Y. T., et al. (2024). Study on the influence of landscape pattern on the spread of pine wilt disease from a multi-scale perspective. For. Ecol. Manage. 568, 122128. doi: 10.1016/j.foreco.2024.122128
Madden, L. V., Hughes, G., and Van Den Bosch, F. (2017). The Study of Plant Disease Epidemics (St. Paul, MN: APS).
Mamiya, Y. (1983). Pathology of the pine wilt disease caused by Bursaphelenchus xylophilus. Annu. Rev. Phytopathol. 21, 201–220. doi: 10.1146/annurev.py.21.090183.001221
Nutter, F. W. and Schultz, P. M. (1995). Improving the accuracy and precision of disease assessments: Selection of methods and use of computer-aided training-programs. Can. J. Plant Pathol. 17, 174–184. doi: 10.1080/07060669509500709
Nutter, F. W., Teng, P. S., Philippines, M., and Shokes, F. M. (1991). Disease assessment terms and concepts. Plant Dis. 75, 1187–1188. doi: 10.1094/PD-75-1187
Perina, F. J., Belan, L. L., Moreira, S. I., Nery, E. M., Alves, E., and Pozza, E. A. (2019). Diagrammatic scale for assessment of alternaria brown spot severity on tangerine leaves. J. Plant Pathol. 101, 981–990. doi: 10.1007/s42161-019-00306-6
Rands, S., Robinet, C., Roques, A., Pan, H., Fang, G., Ye, J., et al. (2009). Role of human-mediated dispersal in the spread of the pinewood nematode in China. PloS One 4, e4646. doi: 10.1371/journal.pone.0004646
Rodrigues, J. M. (2008). “National eradication programme for the pinewood nematode,” in Pine Wilt Disease: A Worldwide Threat to Forest Ecosystems. Eds. Mota, M. M. and Vieira, P. (Dordrecht, Netherlands: Springer), 5–14.
Schafstall, N., Dobor, L., Baldo, M., Liebhold, A. M., Rammer, W., Honkaniemi, J., et al. (2024). Assessing the effect of invasive organisms on forests under information uncertainty: The case of pine wood nematode in continental Europe. For. Ecosyst. 11, 100226. doi: 10.1016/j.fecs.2024.100226
Tang, X. G., Yuan, Y. D., Li, X. M., and Zhang, J. C. (2021). Maximum entropy modeling to predict the impact of climate change on pine wilt disease in China. Front. Plant Sci. 12, 652500. doi: 10.3389/fpls.2021.652500
Vicente, C., Espada, M., Vieira, P., and Mota, M. (2011). Pine wilt disease: A threat to European forestry. Eur. J. Plant Pathol. 133, 89–99. doi: 10.1007/s10658-011-9924-x
Wong, W. O., Hirata, A., Nakamura, K., Nakao, K., Kominami, Y., Tanaka, N., et al. (2017). Potential distribution of pine wilt disease under future climate change scenarios. PloS One 12, e0182837. doi: 10.1371/journal.pone.0182837
Wu, B. G., Qi, Y., Zhu, S., Gao, F., and Guo, E. Y. (2012). The updating system of sub-compartment data for effective forest resource management. Intell. Autom. Soft Comput. 18, 477–489. doi: 10.1080/10798587.2012.10643258
Xie, X., Wang, Q., Dai, L., Su, D., Wang, X., Qi, G., et al. (2011). Application of China’s national forest continuous inventory database. Environ. Manage. 48, 1095–1106. doi: 10.1007/s00267-011-9716-2
Xu, Q. W., Zhang, X. J., Li, J. X., Ren, J. R., Ren, L. L., and Luo, Y. Q. (2023). Pine wilt disease in Northeast and Northwest China: A comprehensive risk review. Forests 14, 174. doi: 10.3390/f14020174
Ye, J. R. (2019). Epidemic status of pine wilt disease in China and its prevention and control techniques and counter measures. Scientia Silvae Sinicae 55, 1. doi: 10.11707/j.1001-7488.20190901
Zhang, Y. J., Chen, W. S., Hu, J. F., and Wang, Y. J. (2024). A digital management system for monitoring epidemics and the management of pine wilt disease in East China. Forests 15, 2174. doi: 10.3390/f15122174
Zhang, C. H., Ju, W. M., Chen, J. M., Li, D. Q., Wang, X. Q., Fan, W. Y., et al. (2014). Mapping forest stand age in China using remotely sensed forest height and observation data. J. Geophys. Res. Biogeosci. 119, 1163–1179. doi: 10.1002/2013JG002515
Zhao, L. L., Mota, M., Vieira, P., Butcher, R. A., and Sun, J. H. (2014). Interspecific communication between pinewood nematode, its insect vector, and associated microbes. Trends Parasitol. 30, 299–308. doi: 10.1016/j.pt.2014.04.007
Keywords: Bursaphelenchus xylophilus, epidemiology, diagrammatic scale, diagrammatic prevalence index, algorithm
Citation: Zhang Y, Zheng S, Bai J, Hu J and Wang Y (2025) Diagrammatic prevalence index: a new algorithm to evaluate pine wilt disease prevalence at the sub-compartment scale. Front. Plant Sci. 16:1578700. doi: 10.3389/fpls.2025.1578700
Received: 18 February 2025; Accepted: 23 June 2025;
Published: 09 July 2025.
Edited by:
Marie Francine Perrine-Walker, University of New South Wales, AustraliaReviewed by:
Valeria Scala, Centro di Ricerca Difesa e Sperimentazione (CREA-DC), ItalyLuís Filipe Bonifácio, National Institute for Agricultural and Veterinary Research (INIAV), Portugal
Copyright © 2025 Zhang, Zheng, Bai, Hu and Wang. This is an open-access article distributed under the terms of the Creative Commons Attribution License (CC BY). The use, distribution or reproduction in other forums is permitted, provided the original author(s) and the copyright owner(s) are credited and that the original publication in this journal is cited, in accordance with accepted academic practice. No use, distribution or reproduction is permitted which does not comply with these terms.
*Correspondence: Yongjun Wang, d2FuZ3lqQHphZnUuZWR1LmNu
†These authors have contributed equally to this work and share first authorship