 Jiashuai Zhu
 Khageswor Giri2
 Zibei Lin
 Noel O. Cogan
 Kevin F. Smith
- 1Faculty of Science, The University of Melbourne, Parkville, VIC, Australia
- 2Agriculture Victoria, AgriBio Centre, Bundoora, VIC, Australia
- 3School of Applied Systems Biology, La Trobe University, Bundoora, VIC, Australia
- 4Agriculture Victoria, Ellinbank, VIC, Australia
- 5Agriculture Victoria, Hamilton, Ellinbank, VIC, Australia
Genomic Prediction (GP) considering Genotype by Environment (G×E) interactions was, for the first time, used to assess the environment-specific seasonal performance and genetic potential of perennial ryegrass (Lolium perenne L.) in a regional evaluation system across southeastern Australia. The study analysed the Dry Matter Yield (DMY) of 72 base cultivars and endophyte symbiotic effects using multi-harvest, multi-site trial data, and genomic data in a best linear unbiased prediction framework. Spatial analysis corrected for field heterogeneities, while Leave-One-Out Cross Validation assessed predictive ability. Results identified two distinct mega-environments: mainland Australia (AUM) and Tasmania (TAS), with cultivars showing environment-specific adaptation (Base and Bealey in AUM; Platinum and Avalon in TAS) or broad adaptability (Shogun). The G×E-enhanced GP model demonstrated an overall 24.9% improved predictive accuracy (Lin’s Concordance Correlation Coefficient, CCC: 0.542) over the Australian industry-standard best linear unbiased estimation model (CCC: 0.434), with genomic information contributing a 12.7% improvement (CCC: from 0.434 to 0.489) and G×E modelling providing an additional 10.8% increase (CCC: from 0.489 to 0.542). Narrow-sense heritability increased from 0.31 to 0.39 with G×E inclusion, while broad-sense heritability remained high in both mega-environments (AUM: 0.73, TAS: 0.74). These findings support informed cultivar selection for the Australian dairy industry and enable genomics-based parental selection in future breeding programs.
Introduction
Perennial ryegrass (Lolium perenne L.) is a mainstay forage species in temperate agriculture, underpinning the global dairy and livestock sectors. Its widespread adoption stems from desirable characteristics including high digestibility, good grazing tolerance, and adaptability to diverse climatic conditions (Gilliland and Hennessy, 2021; Hannaway et al., 1999; Leddin et al., 2020).
Regional evaluation systems have evolved to assess perennial ryegrass performance within specific agricultural contexts. The Australian Forage Value Index (AU-FVI) was developed to assist farmers in selecting economically suitable cultivars by evaluating their performance across five seasonal periods (Summer, Autumn, Winter, Early Spring and Late Spring) (Leddin et al., 2018). Similar systems have also been developed in New Zealand (NZ-FVI) (Chapman et al., 2017) and Ireland (PPI) (McEvoy et al., 2011). They all underscore the necessity of accurately evaluating relative differences in Dry Matter Yield (DMY) among cultivars.
However, perennial ryegrass DMY exhibits complex temporal and spatial variation patterns, challenging its evaluation. Measurements showed substantial seasonal fluctuations from 1396 DM kg/ha/season during Winter periods to 2183 DM kg/ha/season in Late Spring (Giri et al., 2019) and by both management practices and environmental conditions (Colas et al., 2022). Unlike other dairy systems (Chapman et al., 2017; McEvoy et al., 2011), Australia has experienced an extended period without centralized pasture cultivar evaluations, creating unique challenges when selecting suitable cultivars for a given locality (Leddin et al., 2018). These challenges have prompted the exploration of Genomic Prediction (GP) as a promising solution.
Originally developed for animal breeding by Meuwissen et al. (2001), GP has since found successful applications in plant evaluation, by leveraging genome-wide markers to capture the overall additive genetic variance of traits. Various GP methodologies have been studied, primarily Best Linear Unbiased Prediction (BLUP) and Bayesian frameworks (Arojju et al., 2020a, 2018; Byrne et al., 2017; Cericola et al., 2018; Endelman, 2011; Esfandyari et al., 2020; Faville et al., 2021, 2018, 2016; Fè et al., 2016, 2015; Grinberg et al., 2016; Jahufer et al., 2021; Keep et al., 2020; Konkolewska et al., 2023; Malmberg et al., 2023; Meuwissen et al., 2016). The use of BLUP models that integrate genomic information (GBLUP) has been studied as one of the most promising methodologies for quantitative trait evaluation (Arojju et al., 2018; Cericola et al., 2018; Esfandyari et al., 2020; Faville et al., 2018; Konkolewska et al., 2023).
The potential of GP has been demonstrated in perennial ryegrass. For instance, predictive accuracies for traits with high heritability and low genetic complexity, such as heading date range from 0.75 to 0.90 (Fè et al., 2015; Malmberg et al., 2023). Simulation studies further suggest that GP could accelerate genetic gain by two to three times compared to conventional phenotype-only approaches. This is achieved by reducing breeding cycle time while maintaining accuracy with sufficient marker densities (Arojju et al., 2020b; Barre et al., 2022; Guo et al., 2018; Lin et al., 2016). These findings comprehendingly underscore the potential of GP to enhance evaluation efficiency for perennial ryegrass DMY.
However, genomic relationships and GP have not been fully utilised to better estimate DMY in perennial ryegrass regional evaluation systems, particularly using Multi-Harvest, Multi-Site (MHMS) field trials. This is mainly due to a highly complex genetic nature and limited predictive ability further confounded with Genotype by Environment (G×E) interactions (Arojju et al., 2020b; Bornhofen et al., 2022; Faville et al., 2016; Jahufer et al., 2021; Pembleton et al., 2018). Notably, most phenotypic data relates to the contemporary evaluation of populations in one environment, and even when a historical performance database is used, this phenotypic data typically comes from limited environments (Arojju et al., 2020b; Bornhofen et al., 2022; Faville et al., 2016; Grinberg et al., 2016; Jahufer et al., 2021; Pembleton et al., 2018). This narrow focus restricts the ability to accurately evaluate DMY performance across diverse environmental conditions and compromises the prediction of future progeny performance under novel environments. Moreover, environmental variability often dominates phenotypic responses, as evidenced by shifts in cultivar rankings of DMY performance across environments in Ireland (Conaghan et al., 2008), New Zealand (Chapman et al., 2017), and Australia (Zhu et al., 2023).
Given these complexities, extensive MHMS trial data combined with sophisticated statistical methods that can account for G×E interactions have become essential for accurately assessing DMY performance and predicting cultivar adaptation to specific environments (Chapman et al., 2017; Giri et al., 2019; Kemp, 2011; Leddin et al., 2022, 2018; Zhu et al., 2023). Multiple statistical approaches, such as additive main effects and multiplicative interaction models (Annicchiarico, 1997; Li et al., 2023; Sa’diyah and Hadi, 2016; Smith et al., 2001; Yue et al., 2022) and reaction norm models (Bornhofen et al., 2022), have been developed. Additionally, linear mixed models combined with a Factor Analytic (FA) strategy have emerged as a powerful approach for analysing large-scale MHMS trials and accounting for heterogeneous genetic variances across environments (Burgueño et al., 2008; Piepho, 1998; Smith et al., 2015; Zhu et al., 2023).
Furthermore, unclear breeding histories of commercial cultivars have hampered the usage of pedigree relationships and genomic information in DMY prediction in regional evaluation systems. Perennial ryegrass is a self-incompatible species and breeding practices involving multiple cycles of synthetic population breeding (Pembleton et al., 2016; Wang et al., 2014), creating high heterozygosity and intricate genetic structures. This complexity not only makes it difficult to account for genetic relationships among populations but also leads to predictive performances varying in different breeding programs (Alemu et al., 2024; Arojju et al., 2018; Daetwyler et al., 2012).
To address these challenges, this study presents a comprehensive evaluation of multiple base cultivars across diverse breeding programs and assesses their DMY performance across multiple Australian pasture environments. Each base cultivar, genetically distinct from the others, represents a unique genotype. The efforts collectively deliver reliable performance evaluations that account for G×E interactions, while demonstrating the potential of GP to infer breeding values (as genomic estimated breeding values, GEBVs) and genetic adaptability (as environment-driven genetic responses).
Materials and methods
Field trial data
The experimental dataset encompassed 23 MHMS pasture trials conducted between 2008 and 2023 (Table 1), managed by the Pasture Trial Network and Australian seed companies, comprising 2,260 plots for 143 cultivars, yielding 47,325 observations across 485 harvest events. Each cultivar is a unique combination of one of 118 genetically distinct base cultivars and one of 13 endophytes. The trials employed row-column designs with block replication, where each cultivar was replicated at least four times, with the Victorian WT (control cultivar) replicated up to eight times in certain trials, following established protocols (Leddin et al., 2018). The harvests spanned five forage seasons: Winter (June and July), Early Spring (August and September), Late Spring (October and November), Summer (December, January, and February), and Autumn (March, April, and May); sites spanned five major Australian dairy economic regions: South West Victoria, Gippsland, Tasmania, Northern Victoria and Southern Riverina, and South Australia.
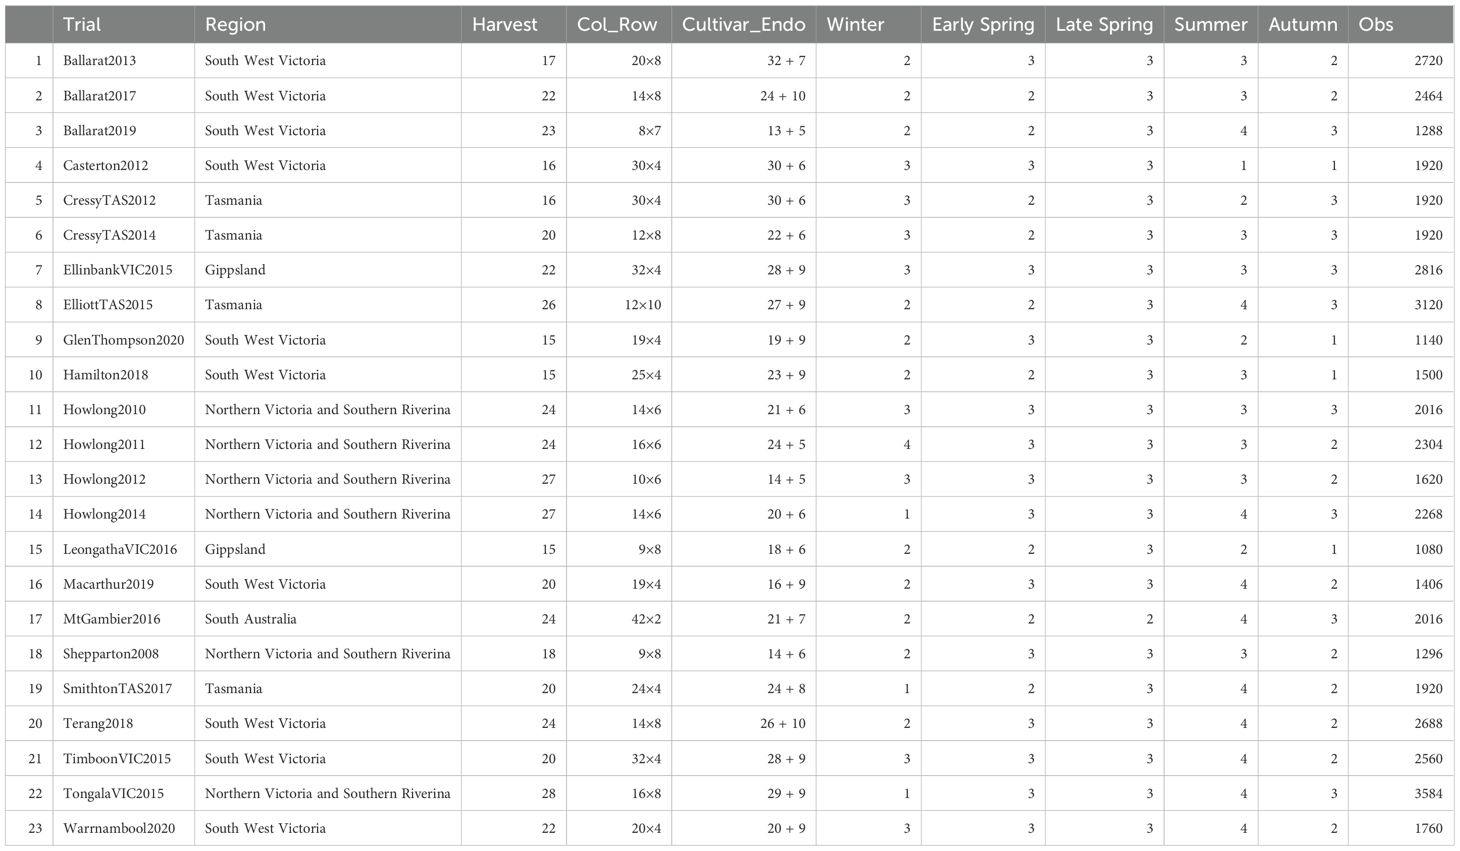
Table 1. The 23 multi-harvest, multi-site trials (perennial ryegrass) from 2008 to 2023, including the economic region of the trial, number of harvests, number of columns and rows (Col_Row), number of base cultivars (Cultivar), number of endophytes (Endo), number of observed seasons (i.e., Winter, Early Spring, Late Spring, Summer, and Autumn), and number of observations (Obs) of each trial.
Spatial analysis and phenotyping
Six frameworks of spatial models: Base, Spatial Fixed, Spatial Fixed Linear, Spatial Random, Spatial Mixed, and Spatial Mixed Linear were tested for their effectiveness in accounting for the spatial variation per trial, considering their successful applications in previous spatial analyses of agricultural field trials (Federer et al., 1997; Gilmour et al., 1997; Hawinkel et al., 2022; Hoefler et al., 2020; Piepho et al., 2008; Smith et al., 2005). These models were fitted using ASReml-R (v3.00) (Butler, 2009; Butler et al., 2009) and assessed using log-likelihood (logLik), Akaike Information Criterion (AIC), Bayesian Information Criterion (BIC), and Mean Absolute Error (MAE). Phenotypes were corrected as response values (y) by subtracting the estimated spatial effects via the most optimised Spatial Mixed framework, where the spatial effects were fitted as both fixed and random effects. For further details about the spatial models and their performances, please refer to Supplementary Material S1 and Supplementary Table S2.
Pool sequencing and population genotyping
The study evaluated 72 ryegrass genotypes, sourced from Australian collections and commercial suppliers, with full germplasm details documented by Zhu et al. (2025). Each genotype represents a genetically distinct ryegrass population. Due to restrictions, the remaining 46 pre-commercial breeding lines at trial sites were not sequenced or genotyped.
Deoxyribonucleic acid (DNA) sequencing utilised a target capture approach with probes designed from SNPs (Single Nucleotide Polymorphisms) mapped to the Kyuss reference genome (Frei et al., 2021). All laboratory procedures and bioinformatics analyses followed previously validated protocols (Zhu et al., 2025), encompassing DNA extraction, library preparation, pool sequencing, and population genotyping derivation from allele frequencies. Key marker quality controls included filtering loci with minor allele frequency (MAF > 5%), ensuring sufficient read depth (RD > 5), limiting sample missing data for (< 20%), and excluding loci with low mapping quality (MQ < 50) or low calling quality (QUAL < 20), resulting 85,903 high-quality SNP markers for further analysis (Zhu et al., 2024).
Genomic relationships
A Genomic Relationship Matrix (GRM) was constructed following Yang et al. (2010) and adapted for allele frequency format. For a pair of genotypes j and k, their genomic relationship was calculated as:
where N is the number of SNPs, N is the number of genotypes, is the reference allele frequency for the i-th SNP of the j-th genotype, and is the average reference allele frequency at the i-th SNP.
The full rank of the initial GRM was verified via eigenvalue decomposition. The nearest positive definite matrix was obtained using the `nearPD` algorithm in Matrix (v1.7) (Bates et al., 2024) in R (R Core Team, 2025) and inverted for subsequent mixed model analyses. The inverse GRM was formatted as a sparse lower triangular matrix to optimize computational efficiency in ASReml-R (v3.00) (Butler, 2009; Butler et al., 2009).
Prediction and estimation modelling for dry matter yield
Sets of GP models were fitted using ASReml-R (v3.00) (Butler, 2009; Butler et al., 2009) as Equation 2 to predict the DMY of the 72 ryegrass genotypes. Endophytes (endo) were fitted as a fixed component to separate their symbiotic effects from DMY responses (Zhu et al., 2025).
Where, y is the vector of spatially corrected phenotypes; ϵ is the vector of residual errors, .
Where, is the Intercept; , , are design matrices for the fixed effects of Trial (), Harvest effects within Trial (), and endophyte effects (), respectively.
The additive genetic effects (a) across harvests and trials were assumed to follow a gaussian distribution of , where G is the GRM calculated as described above. The overall genetic effects (g) and its genetic variances across environments were assumed as g~N(0,K):
for models without considering G×E, for models considering G×E.
Wherein, denotes the diagonal matrix where all off-diagonal values are 0; is the unique variance for each Trial (Tri); is the order- autoregressive or ante-dependence variance-covariance matrices for Harvest (), ; denotes the independent and identical genotypic variances; denotes the FA loading matrices including order-one (FA1), order-two (FA2), and order-three (FA3) structures, denotes the transpose of , and denotes the unique variance matrix of Tri in the FA models; its covariance matrix ; denotes the Kronecker product.
A Best Linear Unbiased Estimation (BLUE) model, which is the current industry standard when evaluating DMY performance for Australian dairy regions (DairyAustralia, 2024), was given as
Where, y is the vector of spatially corrected phenotypes; ϵ is the vector of residual errors, ; and
Where, is the Intercept; , , are design matrices for the fixed effects of Trial (), genotype () effects within Trial (), Harvest effects within Trial (), and endophyte effects (), respectively.
All the models using Equations 2 and 3 were assessed based on logLik, AIC, BIC, and Mean Squared Error (MSE) to identify the most appropriate model to account for the genetic variance components.
The prediction was achieved by `predict()` in ASReml-R (v3.00) (Butler, 2009; Butler et al., 2009) and visualized in a biplot using an R package ggplot2 (v3.5.1) (Wickham, 2016). The predictions using (GBLUP) and (G×EBLUP) for the five ryegrass seasons: Winter, Early Spring, Late Spring, Summer, and Autumn, were obtained following a weighting system by Zhu et al. (2023). The mega-environments, AUM and TAS, were identified by the clustering patterns. Specifically, within each mega-environment, harvests were weighted such that their total weight within a given season summed to , ensuring equal seasonal contributions. In G×EBLUP, the mega-environment TAS was identified to include CressyTAS2012, CressyTAS2014, ElliottTAS2015, and SmithtonTAS2017, while the remaining trials were classified as AUM.
The Least Significant Difference (LSD) was calculated to evaluate performance variation within each mega-environment. Within-season LSDs were used to determine significant differences among the base cultivars per season and across-season LSDs were used to determine significant differences across seasons. All these LSDs are calculated at a 5% significance level.
The seasonal estimation was achieved by calculating the linear combination of corresponding to the design matrix and averaging over the harvests in the corresponding season.
The goodness-of-fit of the full prediction model (GBLUP and G×EBLUP) and estimation model (BLUE) were assessed by Coefficient of Determination (CoD) and root mean square error (RMSE).
Genomic estimated breeding values and heritability
Genomic Estimated Breeding Values (GEBVs) were predicted as through the genomic relationship matrix G for both GP models (Equation 2). For the model assuming independent genetic variance structures across environments (using ), the narrow-sense heritability () was calculated as: , where is the additive genetic variances captured by G, and is the residual variances. For the model considering G×E interaction (using ), the narrow-sense heritability was given as where is the non-additive G×E genetic variances captured by (in of Equation 2).
For models considering G×E interaction, the environment-driven genetic responses (EnvY) for each mega-environment was calculated as: , where represents the overall genetic effects and is the weighting vector for Trial×Harvest combinations in each mega-environment. The broad-sense heritability () incorporating the genetic variances of the environments was given as , where denotes the non-additive genetic variances for specific mega-environment, which is a subset of the total non-additive genetic variances .
Cross validation and model performance assessment
Leave-One-Out Cross Validation (LOOCV) was performed to assess prediction accuracy and precision for GEBV and environment-driven genetic responses for GP models (Eq. 2). In each validation round, one genotype was excluded from the training population, the EnvYs were predicted using the reduced dataset, and the prediction accuracy was assessed by comparing the EnvYs against the phenotypes corrected for spatial, endophyte and field effects in the five seasons. For BLUE models (Equation 3), which lack genomic relationships, the phenotypic estimates were compared directly with the spatially corrected phenotypes to assess estimation accuracy and precision. The prediction or estimation precision within each mega-environment or dairy region was assessed using Pearson’s Correlation Coefficient (PCC) and overall prediction accuracy and precision was assessed by Lin’s Concordance Correlation Coefficient (CCC).
Results
Genomic relationships
Genomic relationship analysis characterized the genomic composition of 72 ryegrass accessions (Figure 1). The diagonal elements of the GRM ranged from 0.112 (Halo) to 1.372 (Barberia), representing genetic variances for each germplasm. Among these, 71 accessions showed diagonal values less than 1, with only Barberia exceeding 1. The off-diagonal elements ranged from -0.284 to 0.981, representing genetic covariances between pairs of accessions. Hierarchical clustering identified three main clusters corresponding to Italian ryegrass (Barberia to BL017), Boucheanum ryegrass (Perun to Ohau), and perennial ryegrass (BL012 to Meridian), consistent with previous findings (Zhu et al., 2025).
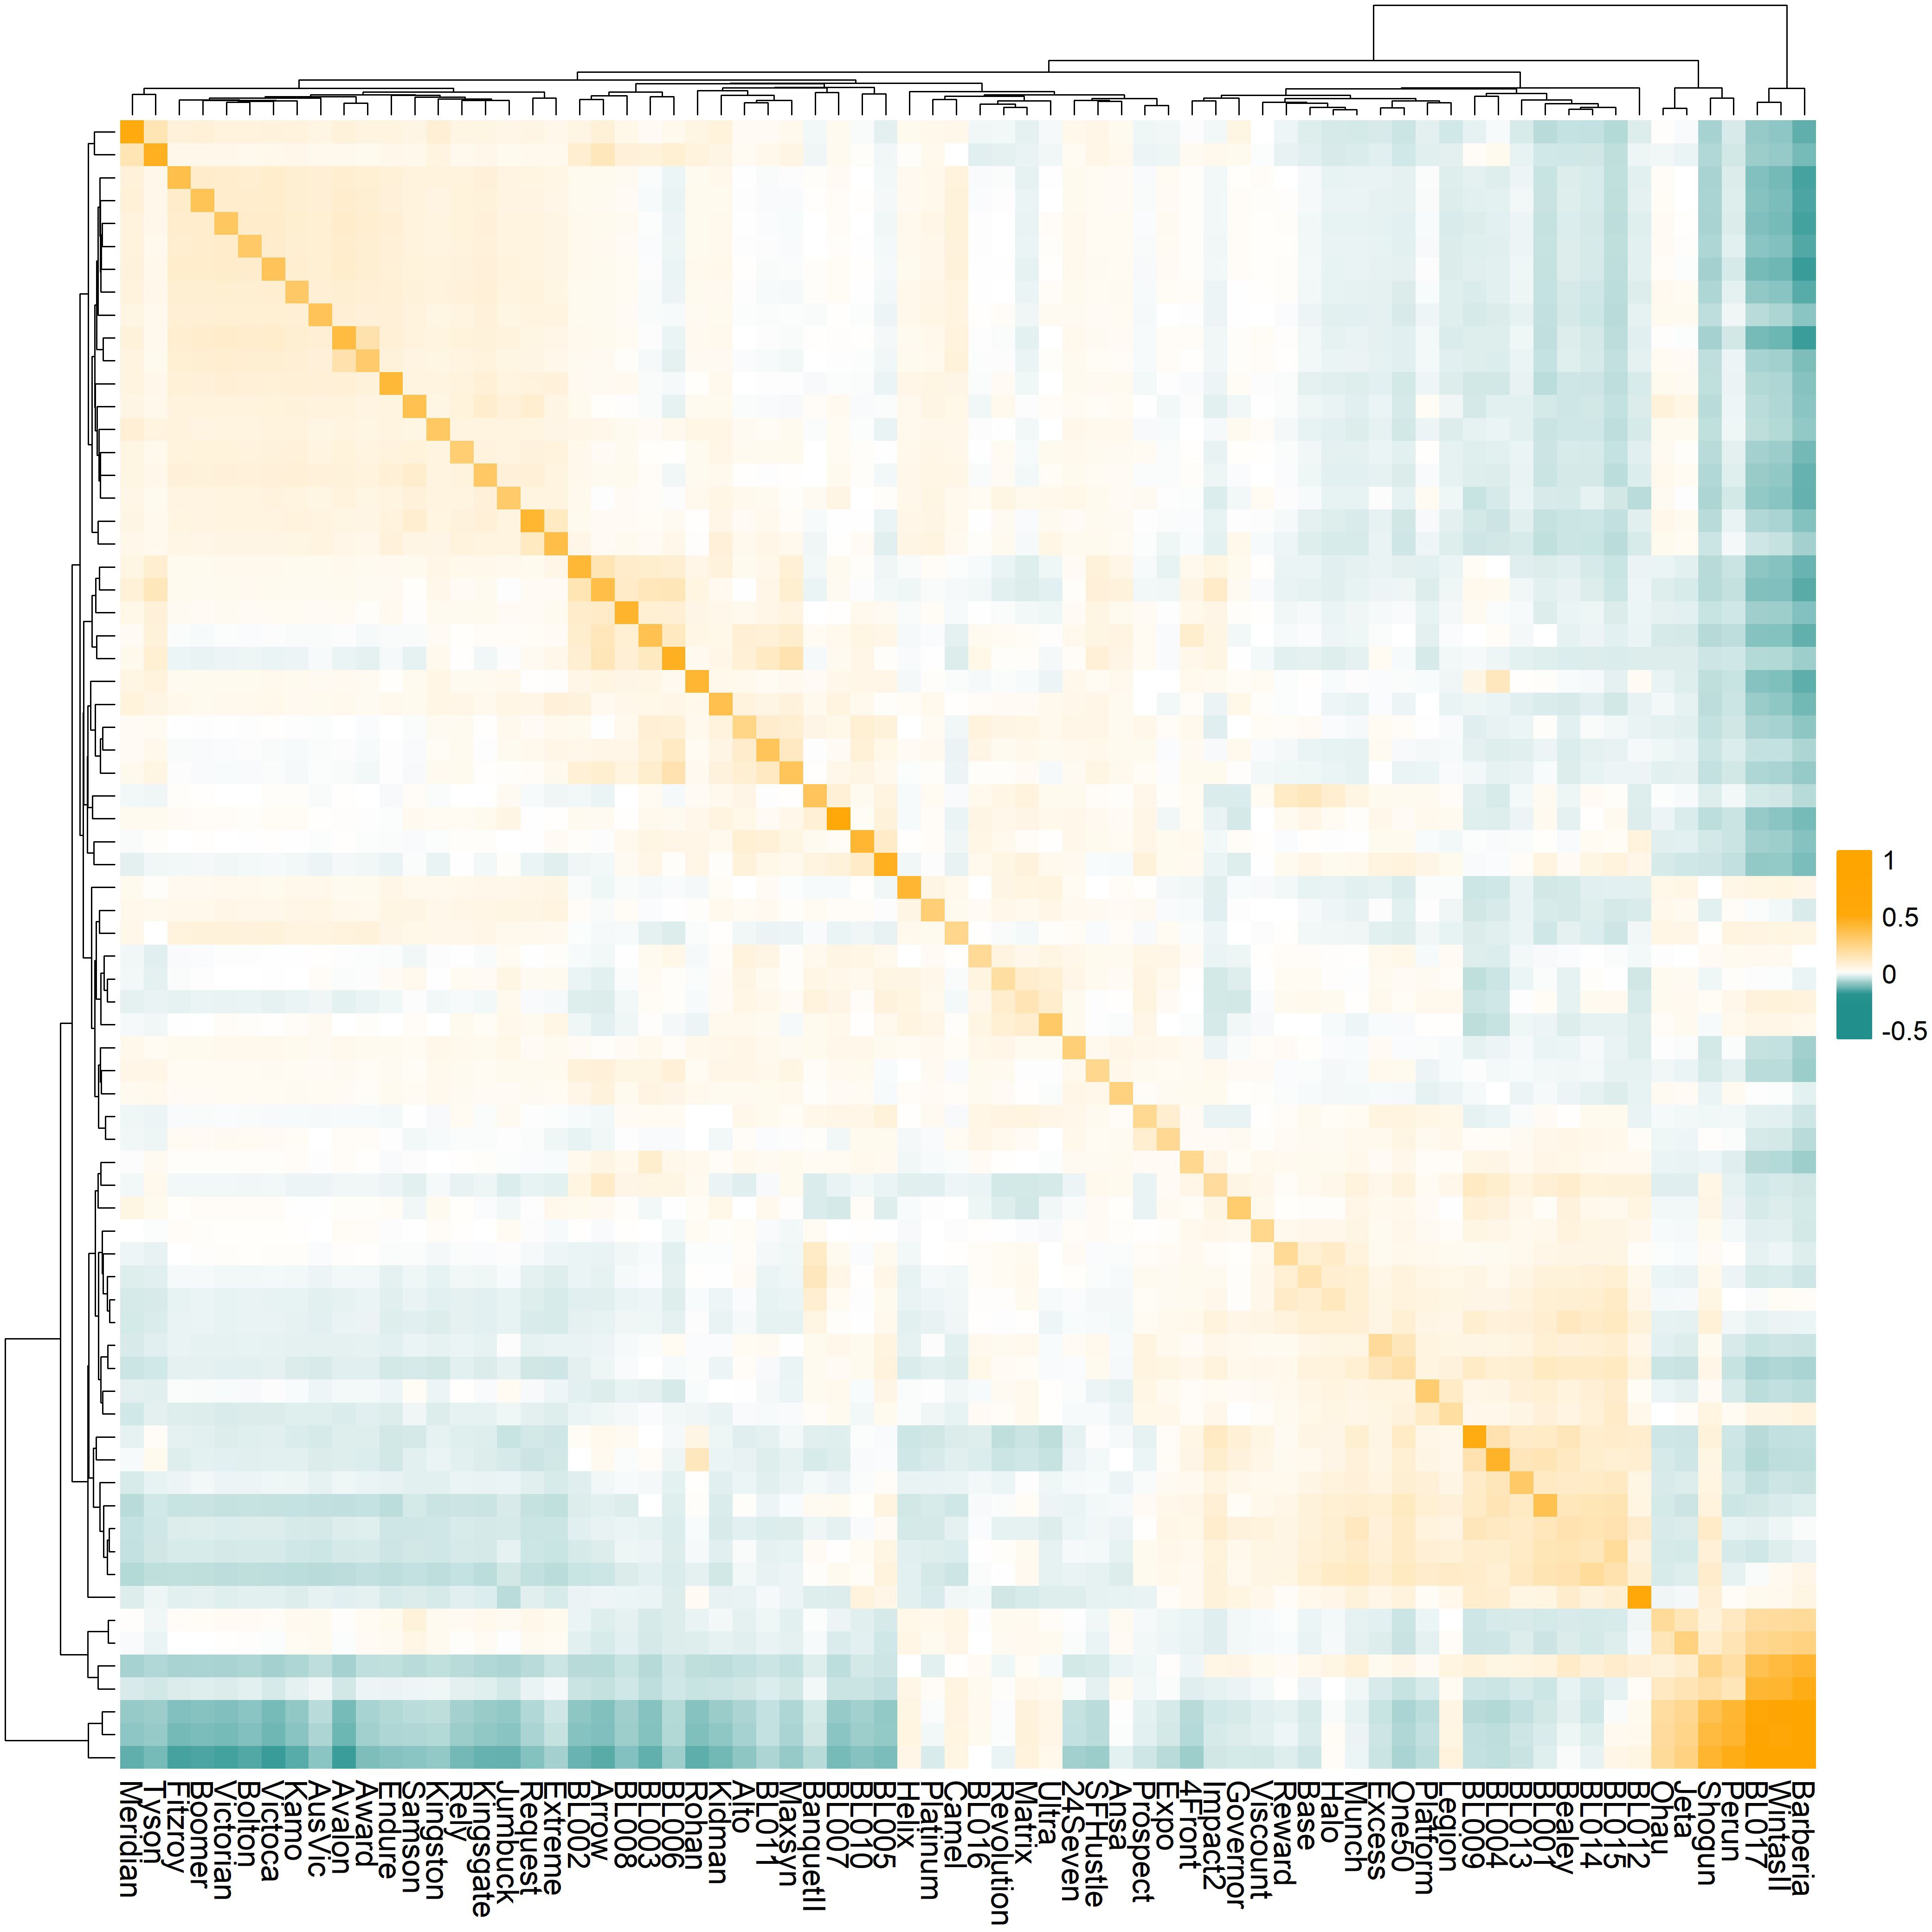
Figure 1. The genomic relationship matrix (GRM) of the 72 ryegrass germplasms with distinct genetic backgrounds. The diagonal values are genomic variances for each germplasm; off-diagonal elements are the genetic covariances between pairs of germplasms. Dendrograms show hierarchical clustering of germplasms based on their genetic relationships.
Model performance
Three sets of evaluation models were fitted and assessed, including G×EBLUP, GBLUP, and BLUE (Table 2). Comparing the best model identified in each set, the G×EBLUP framework achieved the highest CoD (0.925), marginally outperforming the GBLUP framework (CoD: 0.924) and BLUE framework (CoD: 0.888). The G×EBLUP model also had the lowest average RMSE of prediction (Figure 2), and its RMSEs were less variable across genotypes compared to the GBLUP model. Both the G×EBLUP and GBLUP models show lower mean and median RMSEs than the BLUE model.
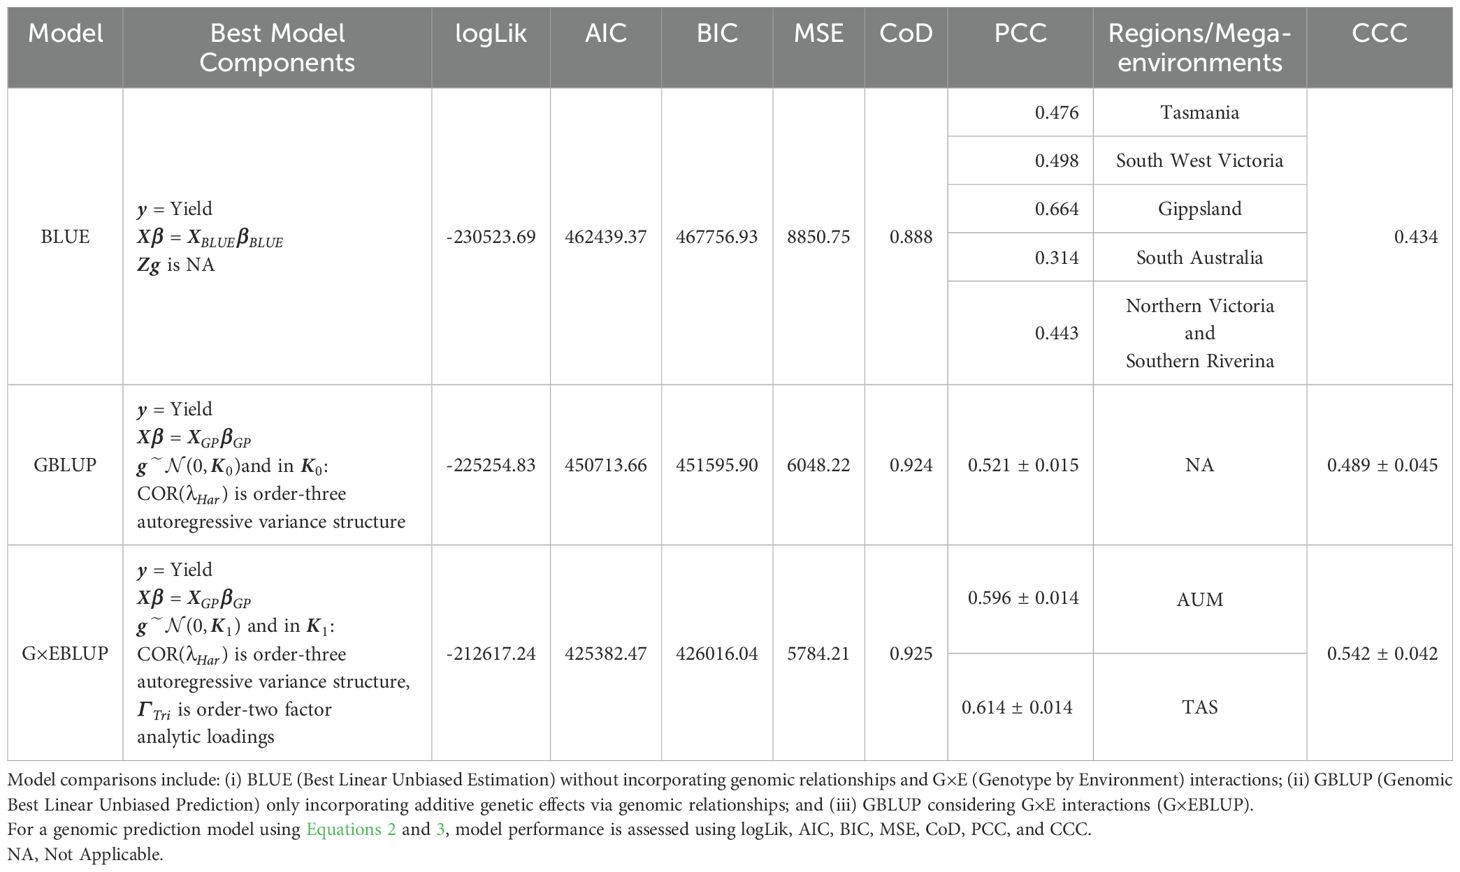
Table 2. Comparison of statistical models for ryegrass dry matter yield across south-eastern Australian pasture environments.
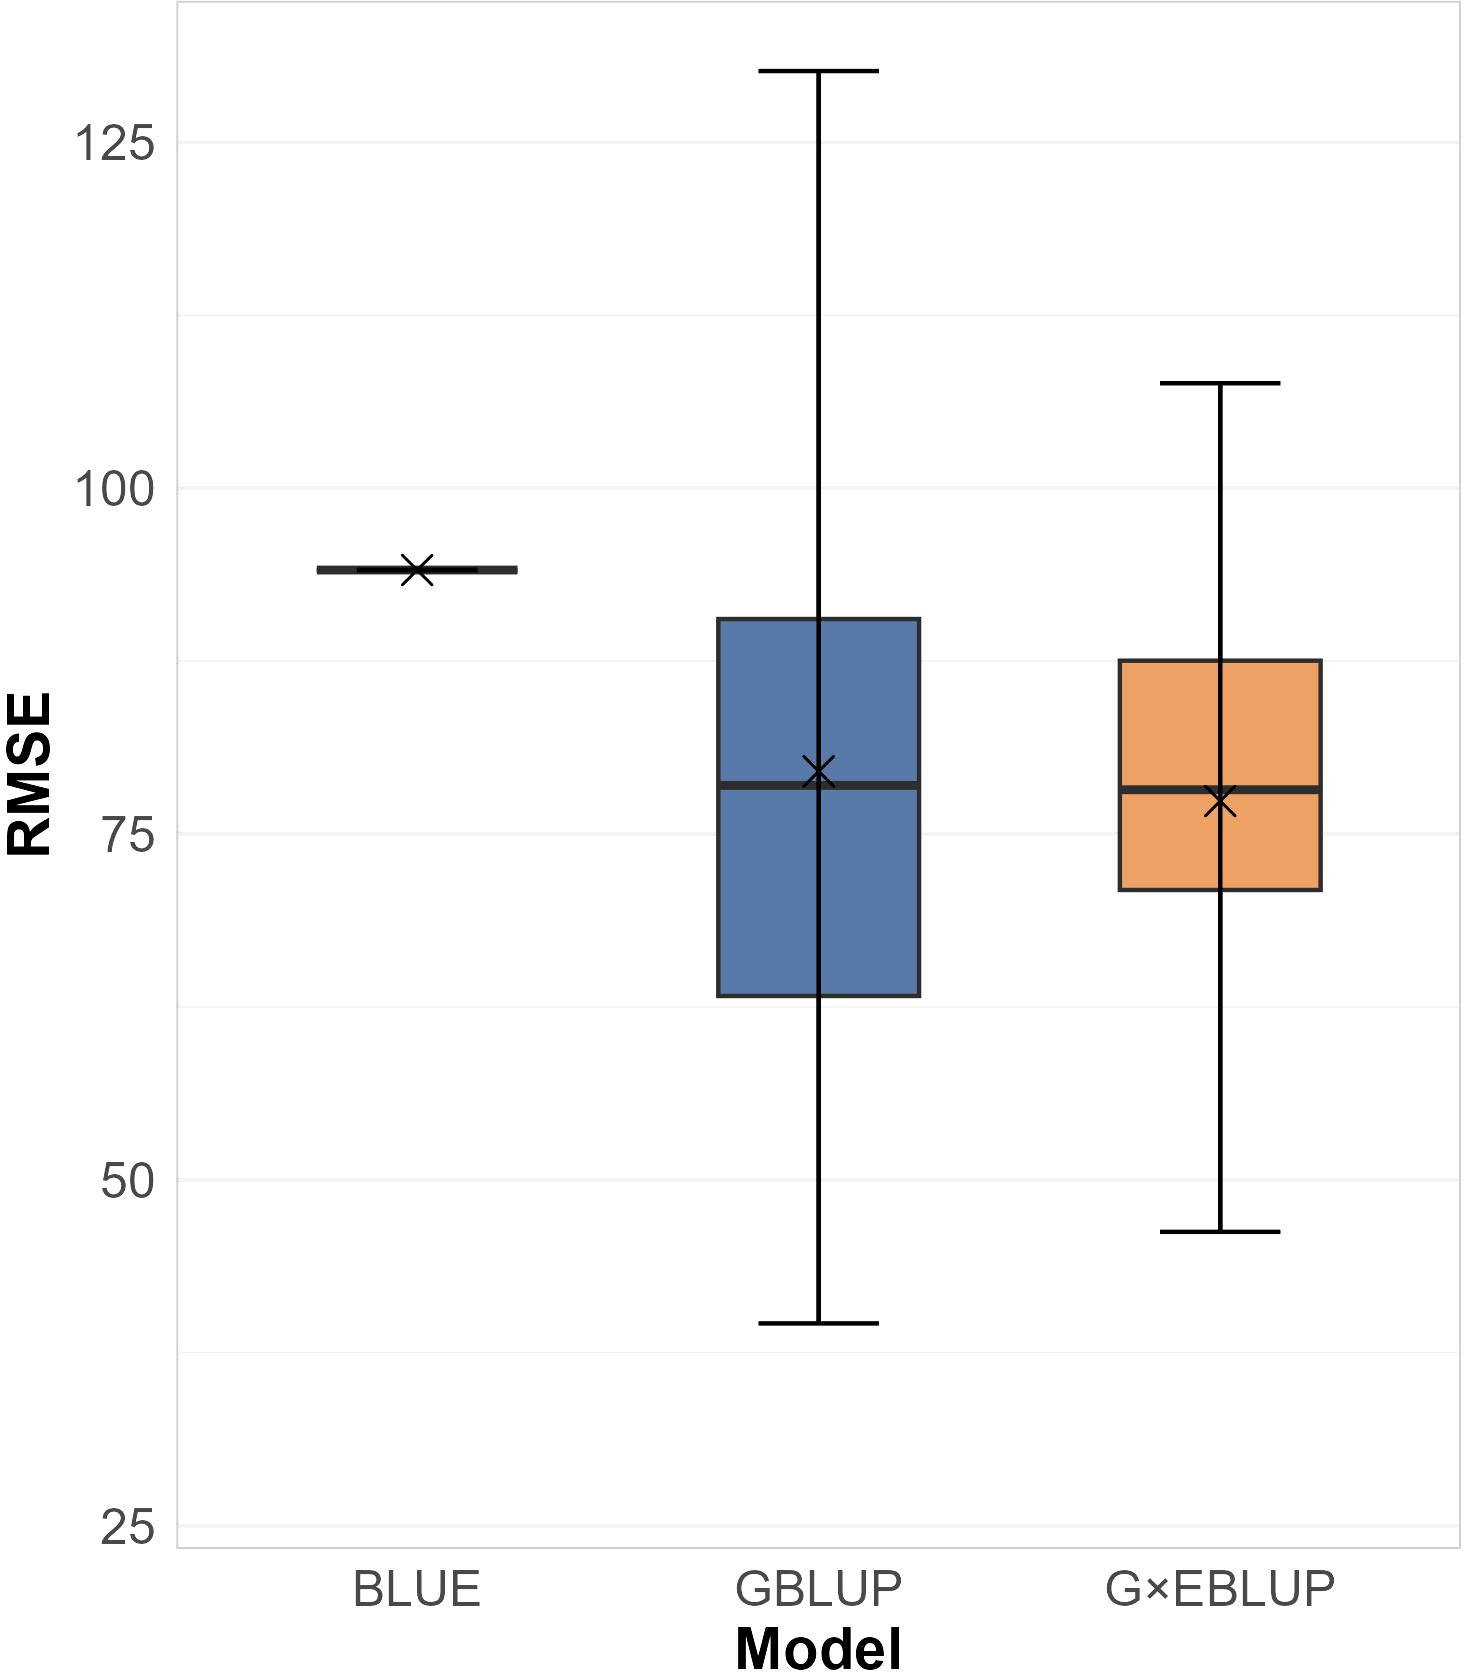
Figure 2. Box plots of Root Mean Square Error (RMSE) of the best identified BLUE, GBLUP, and G×EBLUP models by 72 leave-one-out cross-validation folds. Mean values are marked with ‘×’; median values are the middle lines.
The G×EBLUP framework presents the best-fitting model with the highest logLik (-212,617) and lowest AIC (425,382), BIC (426,016), and MSE (5784.21). Its optimal variance component combined an FA2 structure for G×E interactions and an order-three autoregressive structure for temporal correlations.
The best model identified in the GBLUP framework showed the second-best fit (logLik: -225,254, AIC: 450,713, BIC: 451,595, MSE: 6048.22), with order-three autoregressive structure as optimal temporal structure.
The best model from the BLUE framework showed the poorest fit (logLik: -230,523, AIC: 462,439, BIC: 467,756, MSE: 8850.75). The goodness-of-fit, as measured by CoD, was similar across frameworks.
The G×EBLUP framework showed superior prediction accuracy and precision with PCC ranging from 0.582-0.610 for AUM and 0.600-0.628 for TAS, and CCC ranging from 0.500-0.584. The GBLUP framework showed lower prediction accuracy and precision with PCC ranging from 0.506-0.536 and CCC from 0.444-0.534. The BLUE framework showed considerable precision variation across regions, with Gippsland achieving the highest precision (PCC: 0.664) and South Australia the lowest (PCC: 0.314).
Dry matter yield prediction and estimation
The G×EBLUP model with the variance structures defined by in Table 2 predicted seasonal DMY (DM kg/ha/season) for the 72 base ryegrass cultivars across 23 environments in Tasmania and the Australia mainland. The full prediction information is provided in Supplementary Table S3.
The biplot (Figure 3) visualized the prediction, where the first two principal components explained 77.46% of the total variation in genotype responses across environments. The environments (arrows) formed two distinct clusters in the biplot. One group located in the upper quadrant consisted of TAS mega-environment (CressyTAS2012, CressyTAS2014, ElliottTAS2015, and SmithtonTAS2017). The other group AUM positioned in the mid and lower quadrants including Howlong, Ballarat, and Shepparton across years 2008-2020, with Shepparton2008 showing the greatest deviation from other environments.
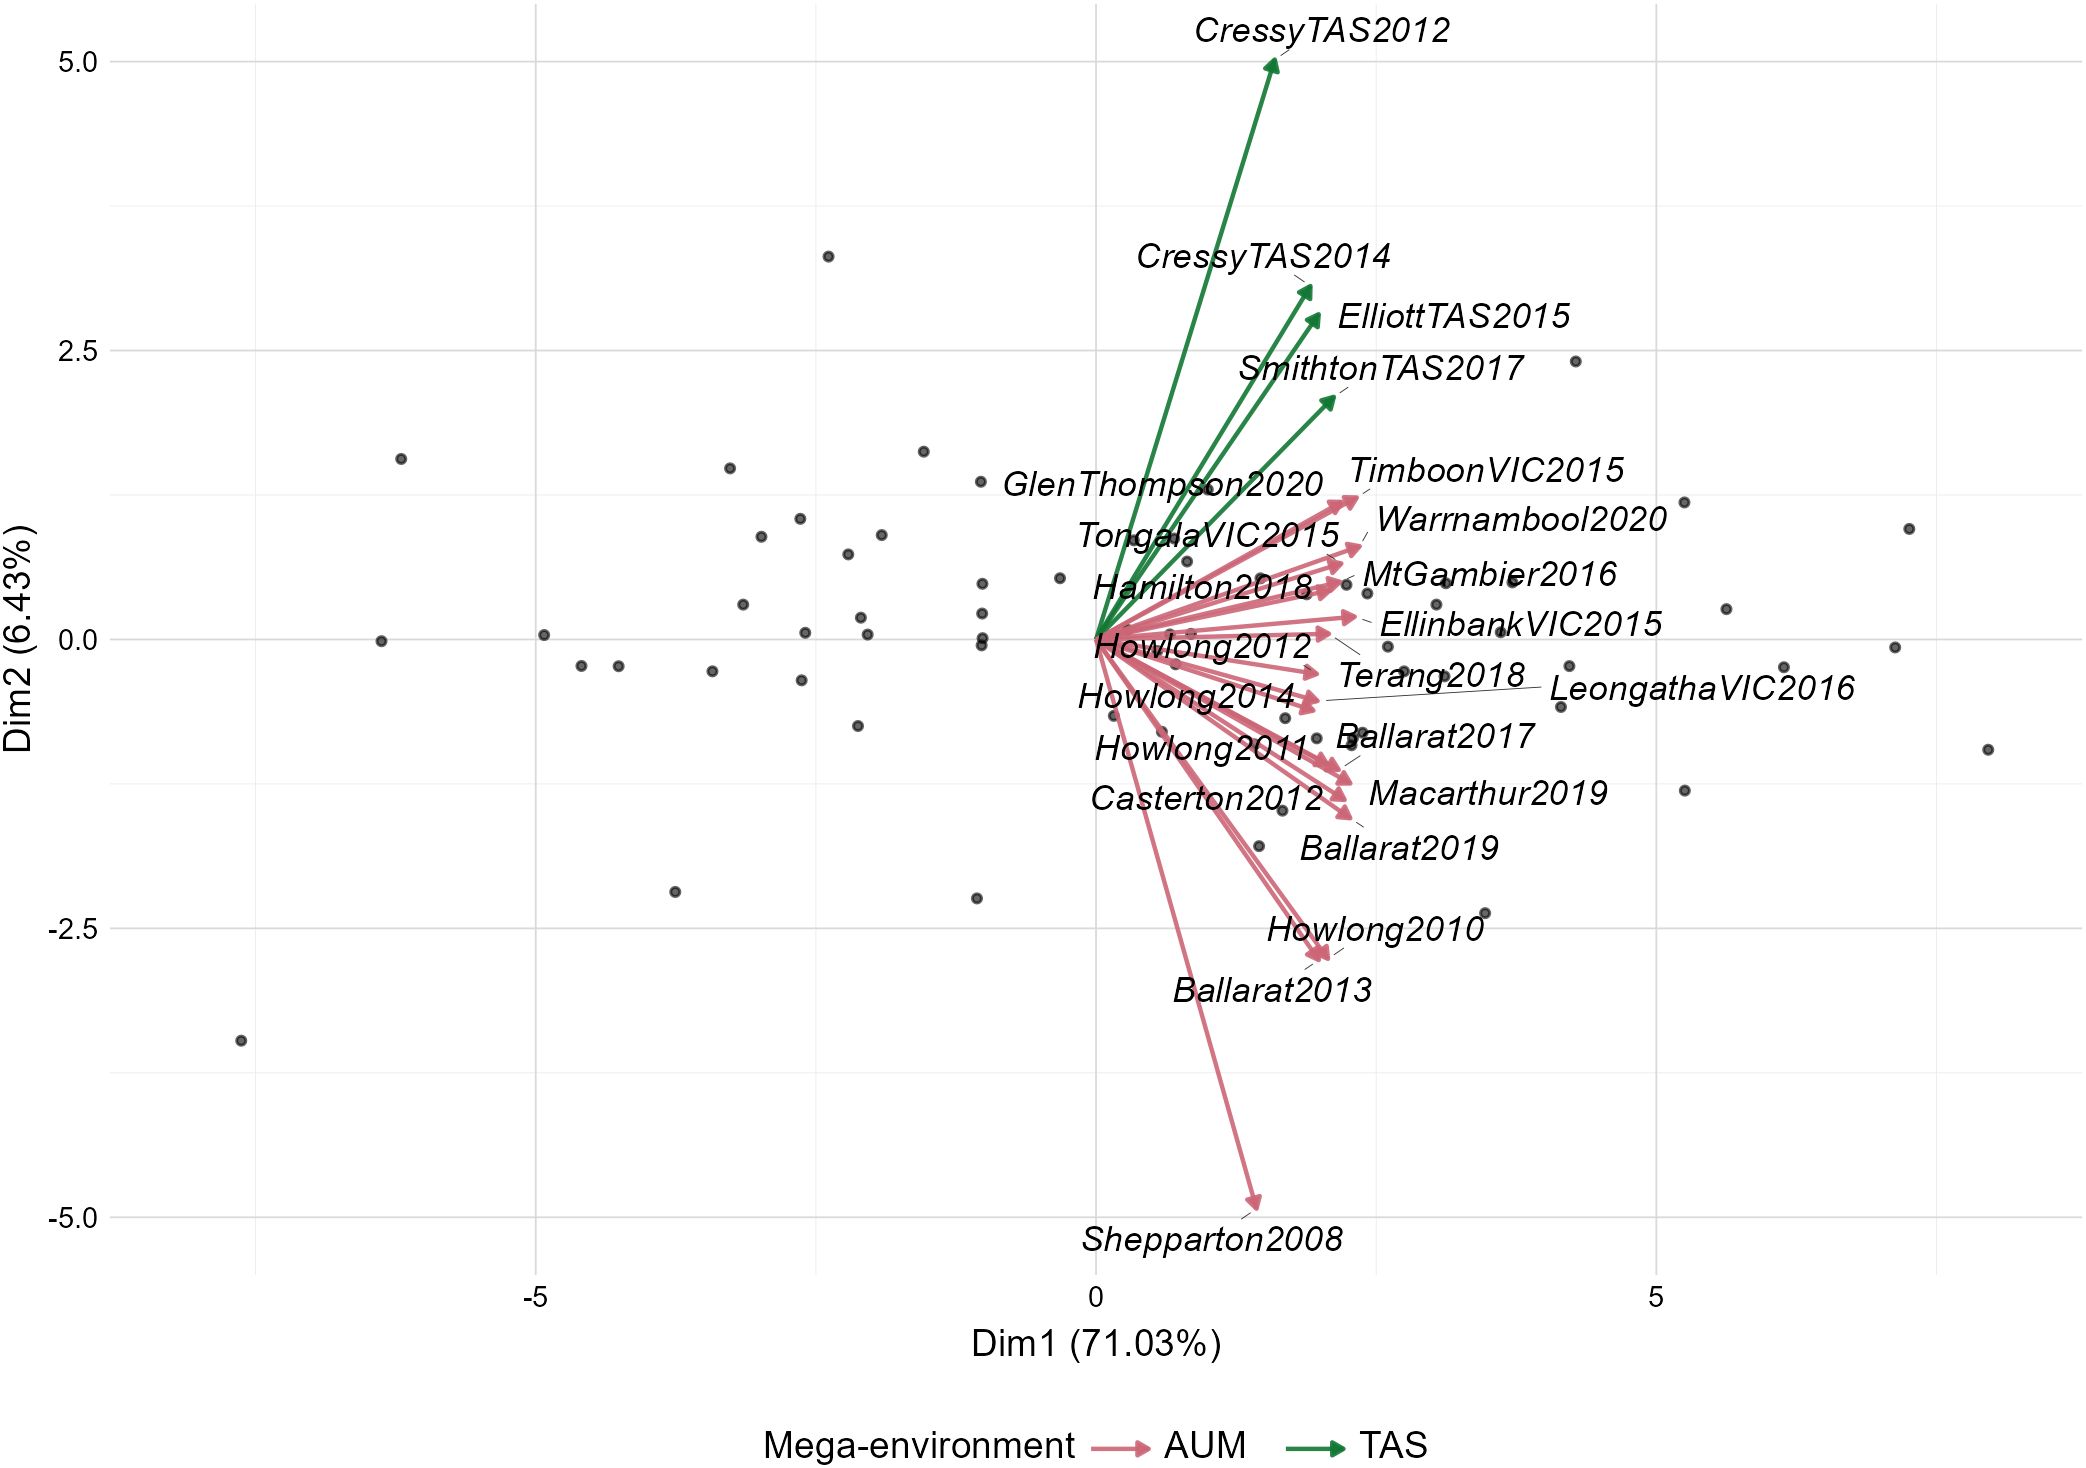
Figure 3. Biplot illustrating the Genotype × Environment interaction patterns across trial sites in Tasmania (TAS) and Australian mainland (AUM) mega-environments. Trials are represented as arrows, with green arrows indicating TAS environments and red arrows showing AUM environments. The relative angles between vectors indicate correlation strength between trials. Black dots represent individual genotype responses across environments.
The DMY performance differed across the two mega-environments (Table 3). In the AUM mega-environment, the highest annual DMY was achieved by BL011 (8263.5 ± 77.1 DM kg/ha/year), followed by Shogun (8226.6 ± 65.3) and Base (8187.2 ± 48.4). The lowest DMY were recorded for Victorian (6957.6 ± 47.8), Helix (6970.4 ± 73.6), and Endure (7072.3 ± 74.0). The range of annual DMY in AUM was 1305.9 DM kg/ha/year. In the TAS environment, Platinum achieved the highest annual DMY (7086.8 ± 138.7 DM kg/ha/year), followed by Shogun (7074.1 ± 139.1) and Avalon (7051.7 ± 91.3). The lowest performing cultivars were Endure (5330.5 ± 128.8), Meridian (5332.7 ± 144.0), and Helix (5623.1 ± 141.1). The TAS environment showed a larger range in annual DMY of 1756.3 DM kg/ha/year. Notably, Shogun maintained high performance in both mega-environments, while Helix and Endure consistently performed poorly.
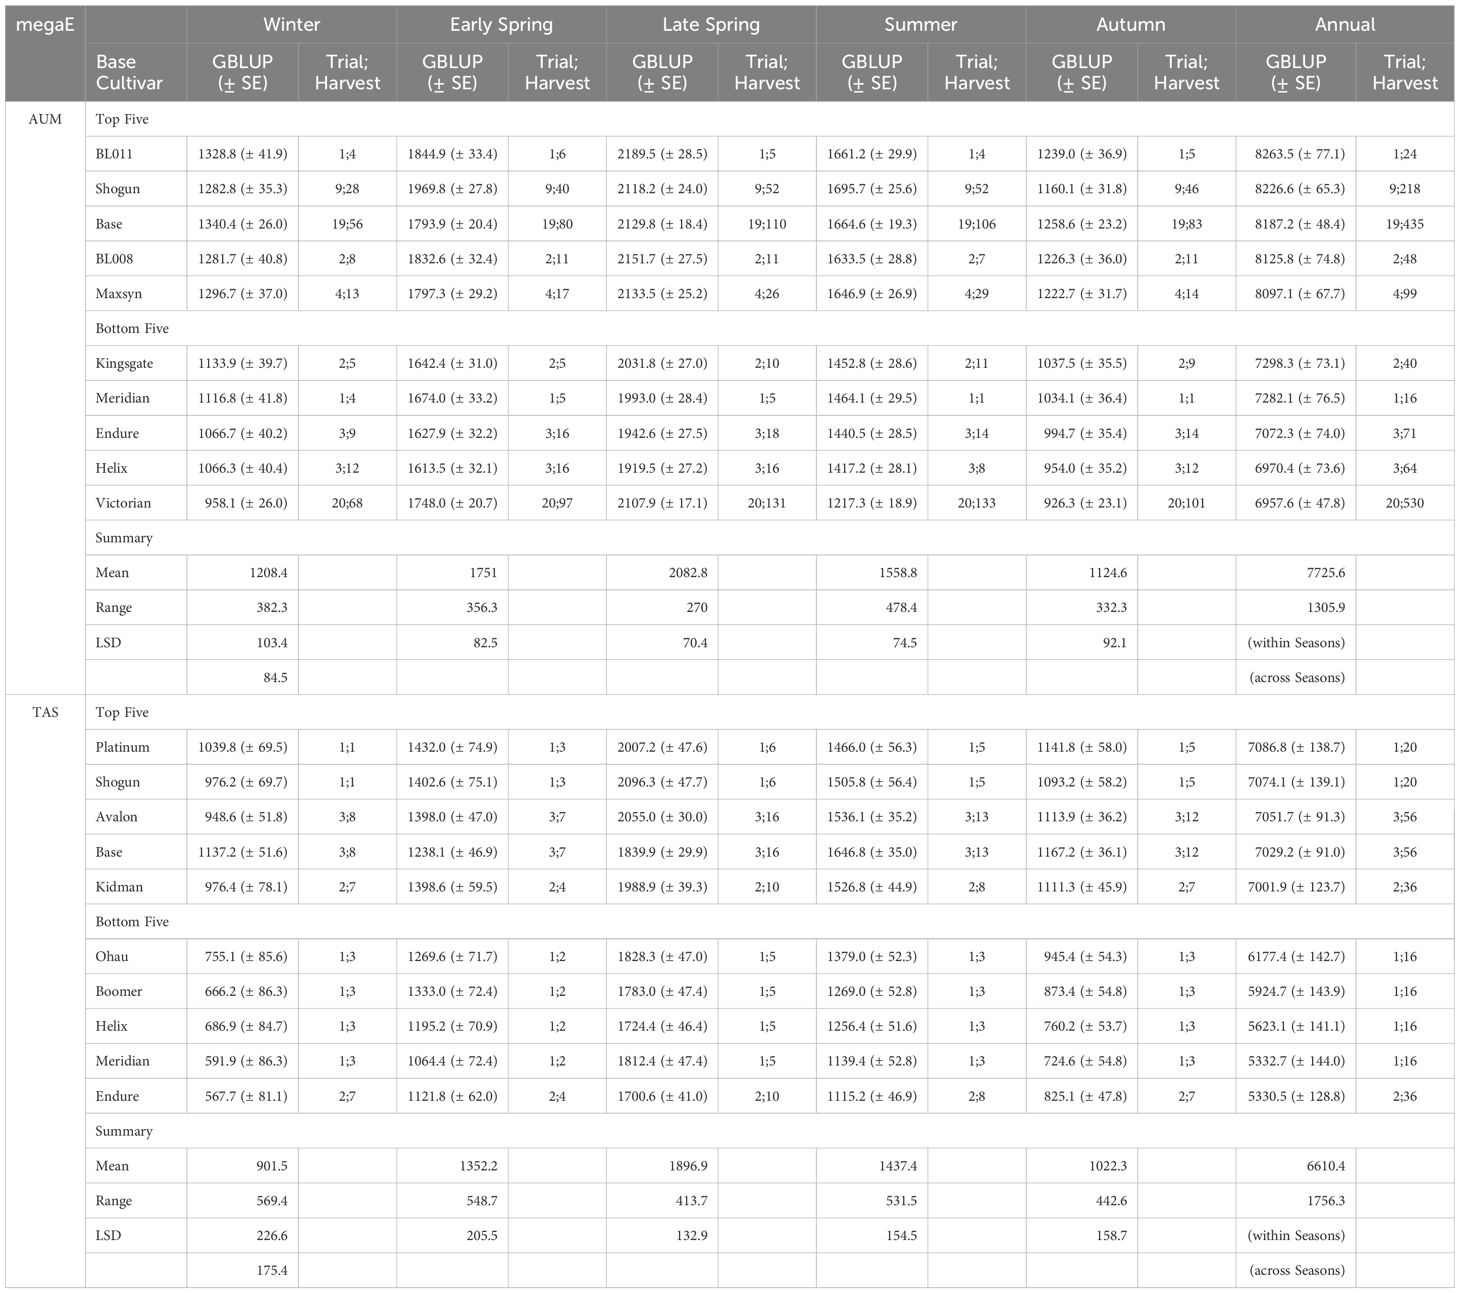
Table 3. The seasonal and annual GBLUP (Genomic Best Linear Unbiased Prediction in DM kg/ha) of the top and bottom five base cultivars (corrected for endophyte effects) in the mega-environments (megaE) of AUM and TAS, with standard errors (SE); the number of the trials and harvests (Trial;Harvest) for each base cultivar in the mega-environment; and the least significant differences (LSD) within and across seasons at a 5% significance level.
Seasonal variations were also observed in both mega-environments. In AUM, the seasonal means followed the order of Late Spring (2082.8 DM kg/ha/season) > Early Spring (1751.0) > Summer (1558.8) > Winter (1208.4) > Autumn (1124.6). The differences between all seasons were significant based on the LSD (84.5 DM kg/ha across seasons). In Late Spring, BL011 achieved the highest DMY (2189.5) while Helix had the lowest (1919.5). In the lowest-yielding season (Autumn), Base performed best (1258.6) while Victorian yielded lowest (926.3). In TAS, the seasonal means also showed significant differences (LSD = 175.4 DM kg/ha across seasons) with the order being Late Spring (1896.9) > Summer (1437.4) > Early Spring (1352.2) > Autumn (1022.3) > Winter (901.5). WintasII achieved the highest Late Spring DMY (2114.3) while Endure had the lowest (1700.6). In Winter, the lowest-yielding season in TAS, Base performed best (1137.2) while Endure again showed the lowest yield (567.7) (Supplementary Table S3).
Genomic estimated breeding values and heritability
Genomic prediction models revealed moderate narrow-sense heritability, with h² = 0.31 for the model without G×E and h² = 0.39 for the model including G×E interactions. Broad-sense heritability was high in both environments (H² = 0.73 in AUM and H² = 0.74 in TAS), with genetic variances of the environments accounting for 34% and 35% of total variance, respectively. The GEBVs of base cultivars ranged from -813.59 to 524.44 DM kg/ha/season (Supplementary Table S4). The top five cultivars based on GEBVs were BL011 (524.44), Shogun (506.07), Base (441.11), BL008 (406.99), and Maxsyn (359.69).
Environment-driven genetic responses varied between mega-environments. In AUM, DMY responses ranged from -1088.48 (Victorian) to 794.75 (BL011) DM kg/ha/season. In TAS, the range was from -711.66 (Meridian) to 281.70 (Shogun) DM kg/ha/season. Most base cultivars maintained stable responses across environments. However, several base cultivars showed substantial re-ranking between mega-environments (Figure 4 and Supplementary Table S4). For example, Avalon ranked 62nd for AUM response but 3rd for TAS response, while Bealey ranked 11th in AUM but 62nd in TAS.
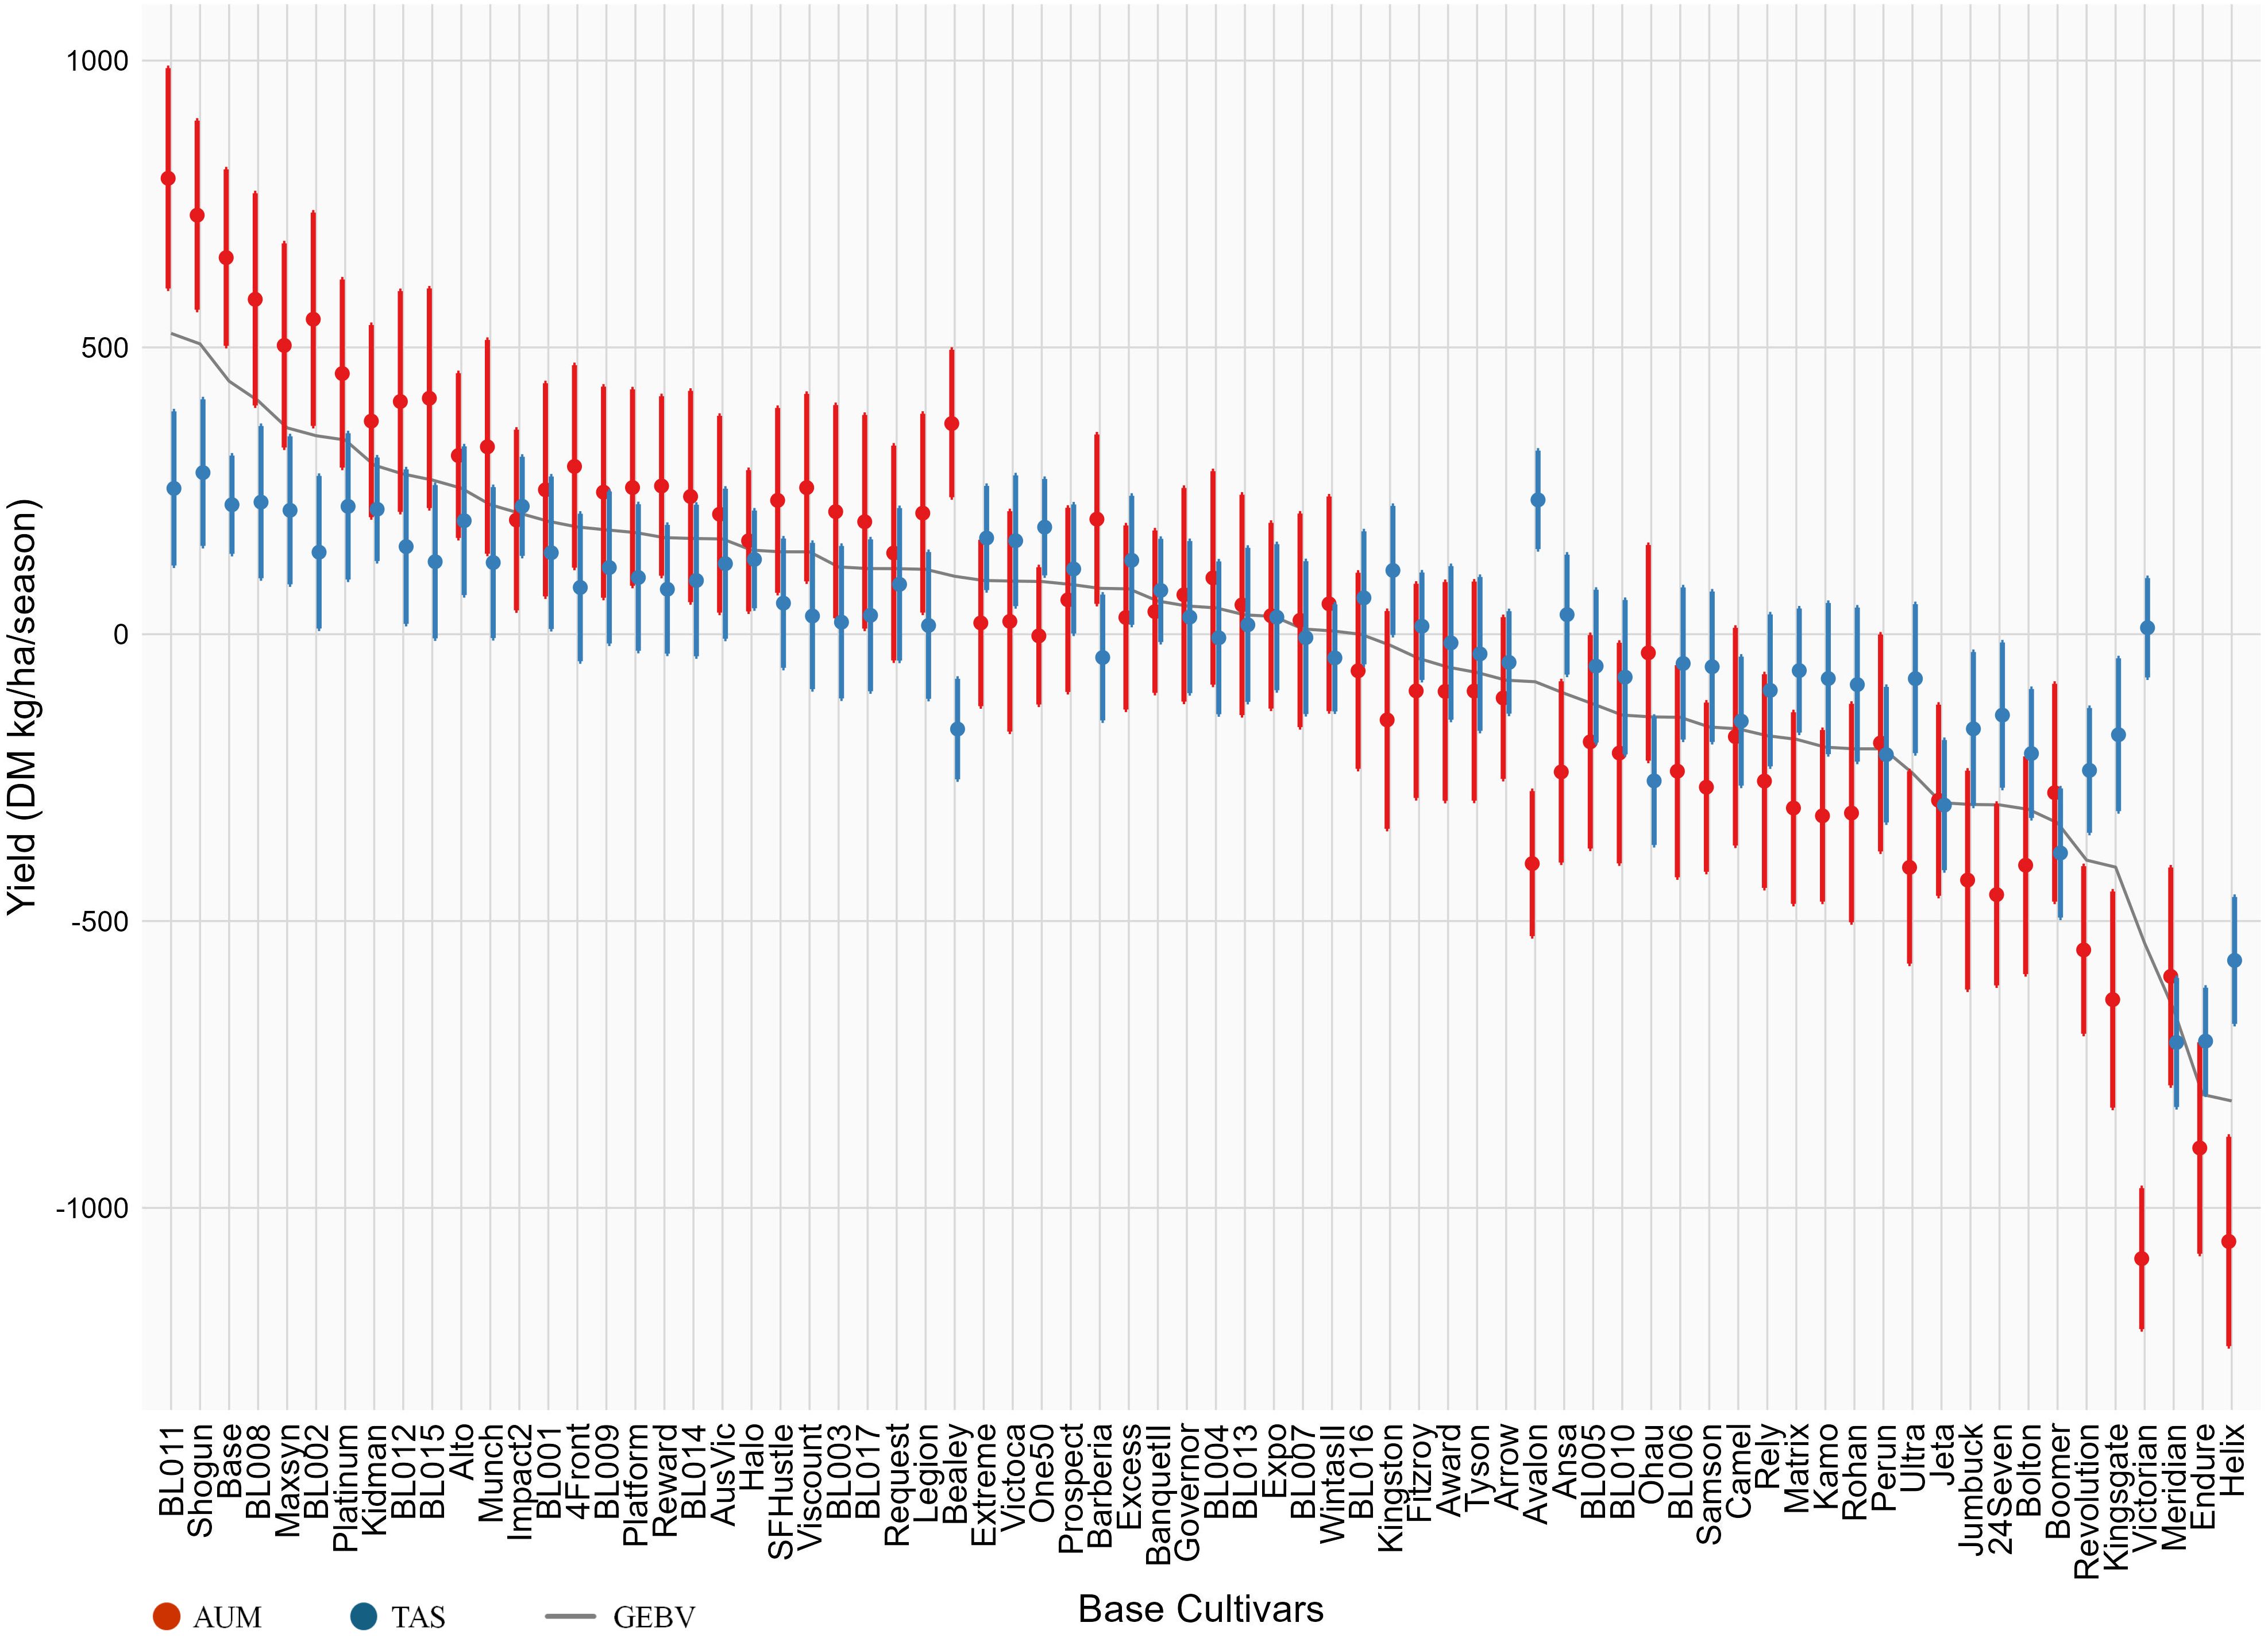
Figure 4. The Genomic Estimated Breeding Values (GEBV: grey curve) and environment-driven genetic responses of base cultivars in two mega-environments (AUM: red, TAS: blue). The Error bars represent standard errors. Base cultivars are ordered by their GEBVs in descending order.
Discussion
Spatial analysis and phenotyping
Accurate phenotyping is crucial for developing reliable GP models. This study utilized MHMS trials of perennial ryegrass across diverse environmental conditions to phenotype the DMY of the 72 ryegrass genotypes. However, within each trial, measuring DMY is challenging due to local spatial variation, highlighting the necessity of spatial analysis within trials in our study.
Local spatial variation within trials involves soil heterogeneity, local moisture gradients, fertility differences, or management practices (Gilmour et al., 1997; Piepho et al., 2008) and can introduce biases in genetic responses in GP models, reducing model precision. Traditional experimental designs, like randomized complete block designs, often fail to fully address the biases, especially in large-scale multiple trials (Gilmour et al., 1997; Hoefler et al., 2020; Piepho et al., 2008; Smith et al., 2005). Advanced spatial analysis methods using mixed two-dimensional covariance structures in this study mitigated these spatial confounding effects and improve GP precision.
The models, where the spatial effects were fitted as both fixed and random effects, were used to address field heterogeneities without assuming linear trends along rows and columns. Cultivar effects were treated as fixed to retain raw field responses at the individual data point level (e.g., each replicate per harvest). This approach ensures results comparable to single-stage analysis (Holland and Piepho, 2024) without misusing BLUP multiple times and corrects phenotypes for spatial biases, making them suitable for genomic modelling. Besides, comparisons of spatial modelling approaches indicated that autoregressive structures outperformed antedependence structures in computational efficiency.
To better account for field heterogeneities, the implementation of unmanned aerial vehicles with multispectral sensors presents an opportunity for the quantification of additional agronomical traits beyond DMY (Gebremedhin et al., 2020; Pranga et al., 2021; Tanaka et al., 2024; Wang et al., 2019). Plus, the development of non-destructive phenotyping methodologies would facilitate high-throughput data acquisition without impacting the integrity of the cultivars under evaluation (Ludovisi et al., 2017; Rahaman et al., 2015). Such technological advancements would be particularly effective for the temporal characterisation of DMY fluctuations throughout the growing season (Nguyen et al., 2022; Wang et al., 2019).
Genomic relationship analysis
Sufficient marker density of genotyping is often necessary to cover the short linkage disequilibrium (LD) present in ryegrass chromosomes and maintain high predictive abilities (Arojju et al., 2020b; Barre et al., 2022; Guo et al., 2018; Lin et al., 2016). This study utilised a dataset from a previous investigation (Zhu et al., 2025), which employed a target sequencing approach and identified ~86k high-density SNPs to explore the genomic relationships among the 72 ryegrass genotypes. Notably, pool sequencing methodology was employed (Zhu et al., 2025), wherein each cultivar was represented by at least 50 individual plants, with several genotypes comprising multiple cultivars (sharing genetic backgrounds but differing in endophyte combinations). This approach quantified genetic variance within each genotype using allele frequencies rather than discrete encoding (such as 0/1/2), thereby effectively representing population-level variation across more than 40k plants. This representation was particularly valuable for depicting heterozygosity within populations and the underlying genetic complexity of outcrossing, polyploid species like perennial ryegrass (Guo et al., 2018; Zhu et al., 2025).
The construction of the GRM followed the methods by Yang et al. (2010) and was adapted for allele frequency encoding (Equation 1). This method enables the modelling of additive genetic relationships from genome-wide SNP data without assuming Hardy-Weinberg equilibrium, making it well-suited to outbred species like perennial ryegrass, which exhibit high heterozygosity and complex breeding histories (Arojju et al., 2018; Barre et al., 2022; Fè et al., 2015; Hayes et al., 2013; Yang et al., 2010). The GRM captured both historical recombination and recent breeding divergence among cultivars, implicitly accounting for population structure without requiring explicit stratification correction. This is especially relevant given the genetic diversity of the ryegrass base cultivars in this study, which originated from different breeding programs. The suitability of the GRM was demonstrated by the negative inbreeding coefficients (F < 0) observed in the majority of germplasms, reflecting historical crosses between genetically distinct populations. In contrast, the cultivar Barberia showed a positive inbreeding coefficient (F > 0), indicating reduced genetic diversity likely due to strong selection. These patterns support the effective integration of genomic relationships into the DMY prediction framework implemented in this study.
However, it is important to recognize that high marker densities are not always a cost-effective option for perennial ryegrass evaluation and selection programs. Studies have demonstrated that prediction accuracies plateau through LD-pruning or targeted SNP selection (Arojju et al., 2020b; Song and Hu, 2022). Furthermore, optimized low-density SNP arrays coupled with well-designed imputation algorithms (e.g. Wu et al., 2016) could halve genotyping costs with minor losses in predictive ability. Therefore, a balanced approach of tailoring marker density to genetic architectures and genotyping cost could ensure efficient GP without unnecessary expenditure.
Integrating genomic relationships into DMY estimation
This study first explored and integrated genomic relationships along with large-scale MHMS field trials to improve the DMY estimation in a perennial ryegrass regional evaluation system. By leveraging genomic relationships, GP enabled estimations of additive genetic variances and the prediction of DMY for untested cultivars, even when they were not present in any trials or environments. Such feasibility was validated by LOOCV in independently simulating scenarios where DMY of a certain cultivar is predicted via a genomic relationship without actual measurements. This demonstrates the potential to predict DMY using genotyping data alone, potentially reducing the need for costly and time-consuming field trials.
The GBLUP model in this study incorporated genomic information through the GRM, which reveals pseudo-pedigree relationships among the genotypes. Usage of GRM kernel was also a consideration of both computational efficiency and proven predictive accuracies in the GP applications by other studies (Arojju et al., 2020b; Cericola et al., 2018; Faville et al., 2021, 2018; Fè et al., 2016, 2015; Jahufer et al., 2021; Konkolewska et al., 2023; Lin et al., 2016).
Incorporating genomic data improved predictive accuracy and precision, as demonstrated by increased CCCs from the baseline BLUE (0.434) to the GBLUP (0.489), resulting in a 12.7% improvement. This was further evidenced by a 56.9% reduction in the average standard error of 46.88 DM kg/ha/season in the current study from the average standard error of 108.75 DM kg/ha/season reported by Zhu et al. (2023), where BLUP modelled G×E interactions but did not incorporate genomic data.
This study also highlighted the need to separate endophyte symbiotic impacts on host plant genetic responses when evaluating perennial ryegrass performance. This separation is critical because endophytes significantly impact the genetic responses of the ryegrasses. Additionally, endophytes are typically confined to specific cultivars due to commercial agreements between endophyte owners and ryegrass breeding companies, creating an imbalanced dataset where not all endophyte-ryegrass combinations can be tested (Zhu et al., 2025).
Environmental enhanced ryegrass evaluation system for DMY performance
In Australia, farmers face significant challenges in selecting from over 60 commercially available perennial ryegrass cultivars (Leddin et al., 2018). Wherein, current industry standard, which presents an aggregate BLUE across trials, incorporates seasonal performance weighted by the relative economic value across regions. This approach assumes consistent genotype differences within and between regions. However, our analysis reveals substantial variation in estimation precision across regions (PCC ranging from 0.314 in South Australia to 0.664 in Gippsland) when using BLUE. This inconsistency in precision strongly indicates the presence of underlying biological G×E interactions that the current economic-based evaluation system inadequately captured.
By explicitly modelling biological G×E interactions through the G×EBLUP, we achieved more stable predictive ability across the identified mega-environments (PCC: 0.596 ± 0.014 for AUM and 0.614 ± 0.014 for TAS). Besides, predicting DMY based on specific mega-environments improved the evaluation reliability, as evidenced by an overall 24.9% increase in CCC from the BLUE (0.434) to the G×EBLUP (0.542), demonstrating marked improvement over current industry approaches. In addition, the BLUP framework maintains practical utility in effectively accounting for complex genetic variance components with unbalanced datasets (Robinson, 1991), also facilitating accurate predictions.
The shift from GBLUP to G×EBLUP resulted in an additional 10.8% increase in predictive abilities (CCC from 0.489 to 0.542) and an improved narrow-sense heritability from 0.31 to 0.39. This is because perennial ryegrass DMY is a complex quantitative trait influenced by multiple genetic and environmental factors; the G×EBLUP model, which extended GBLUP by modelling G×E interactions through the structure better modelled such complexity. The improvement was also comparable to other studies which reported low to moderate prediction accuracies (Bornhofen et al., 2022; Faville et al., 2018; Grinberg et al., 2016; Jahufer et al., 2021; Konkolewska et al., 2023; Pembleton et al., 2018), where even though G×E interactions were not fully explored due to their limited multi-environmental phenotyping datasets.
Furthermore, environmental evaluation revealed significant variations in DMY across the two identified mega-environments, AUM and TAS, which align geographically with mainland Australia and Tasmania, respectively. Seasonal fluctuations were evident, with Late Spring producing the highest DMY in both mega-environments, while Winter and Autumn displayed lowest DMY in both mega-environments. The mega-environment TAS exhibited greater uncertainty in DMY prediction, as indicated by larger LSDs, emphasizing the need for a larger dataset than the current compared to AUM. These findings highlight the necessity of representative field trials encompassing both geographical and temporal dimensions in improving the accuracy of perennial ryegrass DMY prediction.
Regional adaptation patterns of perennial ryegrass
Breeding value estimation, based on GEBVs, provides insights into the genetic potential that passes from breeding lines to their progeny. This approach offers great advantages over traditional breeding methods, which primarily rely on phenotypic recurrent selection, usually require more than a decade per cycle, and struggle to accurately evaluate potentials across diverse environments (Barre et al., 2022; Hayes et al., 2013; Lin et al., 2016).
Environment-driven genetic responses explored in this study revealed the variability in genetic potentials under different environmental conditions, largely attributed to non-additive genetic effects related to G×E interactions, such as dominance and epistasis effects (Duenk et al., 2020; Su et al., 2012; Varona et al., 2018). Our analysis identified distinct patterns across regions, with AUM showing wider variations in environmental responses while TAS displayed more stable genetic responses. These regional differences were further exemplified by genotype-specific adaptation patterns where Avalon demonstrated strong adaptation in TAS, Bealey excelled in AUM, and Shogun exhibited broad adaptability across both mega-environments.
The variability in the environment responses can stem from multiple sources of environmental variation, including differences in climate characteristics, soil physical and chemical properties, and root development patterns (Chapman et al., 2017; Faville et al., 2018; Konkolewska et al., 2023; Wedderburn et al., 2010; Zhu et al., 2023). Temporal variation, encompassing both seasonal and inter-annual fluctuations, further complicates predictions (Colas et al., 2022; Gilliland and Hennessy, 2021; Giri et al., 2019; Robins and Alan Lovatt, 2016). Recent environmental profiling analysis by Zhu et al. (2023) identified key environmental drivers of G×E interactions in perennial ryegrass, revealing that soil properties, temperature, and evaporation rate were primary factors differentiating environmental clusters. These analyses demonstrated that both soil-related characteristics and weather-related factors contributed to mega-environment differentiation that could be leveraged to enhance future modelling approaches and prediction accuracy.
These findings comprehensively demonstrated both the importance of integrating genomic relationships and accounting for G×E interactions when better estimating perennial ryegrass DMY in regional evaluation systems. They also emphasized the need for environment-specific implementation strategies that operate independently of economic interests to meet regional demands for reliable evaluation of ryegrass productivity and genetic gains.
Implementation strategies
The influence of G×E interactions necessitate environment-specific strategies. In Tasmania, water-responsive or cold-climate varieties such as Platinum, Shogun, and Avalon are recommended for their superior performance. On the mainland, stable high-yielding cultivars like Shogun and Base are prioritized to accommodate diverse environmental conditions. These targeted recommendations align cultivar traits with regional needs to maximize productivity.
Seasonal variation is another critical dimension to consider. Late Spring usually offers peak DMY, while Winter and Autumn conditions limit performance. Management strategies may include maximizing annual harvests and implementing adaptive practices for production systems, such as altering calving dates to better match pasture supply and animal demand. These tailored approaches could optimize sustained productivity year-round.
When breeding new elite cultivars, a dual strategy is suggested to balance genetic gain and diversity. Initial selection should leverage GEBVs to capitalise on those additive genetic potential with moderate heritability. Crossbreeding designs could then include close-family crosses to maximize genetic gain through hybrid vigour or far-family crosses to maintain genetic diversity, to ensure short-term performance improvements and long-term sustainability.
While GP offers a powerful approach to evaluate genetic gain, it should be viewed as an integrative component within established perennial ryegrass evaluation and breeding frameworks, including F2 Family (Bornhofen et al., 2022; Cericola et al., 2018; Fè et al., 2016, 2015), Half-Sib Family (Arojju et al., 2020a; Faville et al., 2018; Jahufer et al., 2021), and Synthetic Population approaches (Faville et al., 2016; Hayes et al., 2013; Malmberg et al., 2023; Pembleton et al., 2018). Effective implementation of GP relies on well-designed breeding programs with regionally representative trials, advanced phenotypic technologies, and strategic integration of genomic information across these frameworks. The absence of a centralized and coordinated pasture evaluation system in Australia presents structural challenges that GP alone cannot resolve. Therefore, realising the full potential of GP may require alignment with a more structured and collaborative evaluation framework that considers other agronomically important traits beyond DMY, such as nutritive traits (Leddin et al., 2022) and metabolizable energy (Lewis et al., 2024).
In future research, GP models could be further enhanced by incorporating additional data sources to address non-additive genetic variances or those unexplained variances stemming from environmental and management factors. These may include climate variables, soil-genotype interactions, and practices such as irrigation, fertilization, and grazing management (Fiorelli et al., 2001; Peters et al., 2022). By integrating these aspects, models may achieve greater accuracy to better reflect real-world complexities. For instance, incorporating plant growth models, such as APSIM (Agricultural Production Systems Simulator), could enhance predictions by simulating genotype responses to environmental factors dynamically (Hammer et al., 2023).
In conclusion, productivity estimation and genomic prediction require continuous refinement as new data becomes available, and their reliability must be validated through large-scale trials before implementation. This validation will not only assess predictive accuracy under real-world conditions but also evaluate the economic feasibility of future breeding. Through the systematic evaluation and validation process discussed in this study, breeding programs can adapt to changing agricultural conditions and effectively meet regional demands, ultimately supporting sustainable agricultural practices across diverse pasture environments.
Data availability statement
Publicly available datasets were analysed in this study. This data can be found here: Ryegrass_Genotype_Allele_Frequency_Dataset. The University of Melbourne research repository. https://doi.org/10.26188/26392210.v1.
Author contributions
JZ: Conceptualization, Data curation, Formal analysis, Investigation, Methodology, Validation, Visualization, Writing – original draft, Writing – review & editing. KG: Conceptualization, Methodology, Supervision, Validation, Writing – review & editing. ZL: Conceptualization, Validation, Writing – review & editing. NC: Conceptualization, Project administration, Supervision, Validation, Writing – review & editing. JJ: Conceptualization, Project administration, Supervision, Validation, Writing – review & editing. KS: Conceptualization, Project administration, Supervision, Validation, Writing – review & editing.
Funding
The author(s) declare that financial support was received for the research and/or publication of this article. This work was funded by Agriculture Victoria, Dairy Australia, and the Gardiner Dairy Foundation as part of the Victorian Dairy Innovation Agreement. Jiashuai Zhu was supported by a ‘Melbourne Research Scholarship’ through the University of Melbourne and a ‘Studentship (Stipend)’ from Agriculture Victoria Research through the Centre for Agricultural Innovation.
Acknowledgments
We acknowledge the advisory committee involved in the Forage Value Index (FVI) development, including members from the Australian Seed Federation and its member companies. We also acknowledge Meat and Livestock Australia for providing data from the Pasture Trial Network, and the seed companies for providing seed and data used in the FVI project.
Conflict of interest
The authors declare that the research was conducted in the absence of any commercial or financial relationships that could be construed as a potential conflict of interest.
Generative AI statement
The author(s) declare that no Generative AI was used in the creation of this manuscript.
Publisher’s note
All claims expressed in this article are solely those of the authors and do not necessarily represent those of their affiliated organizations, or those of the publisher, the editors and the reviewers. Any product that may be evaluated in this article, or claim that may be made by its manufacturer, is not guaranteed or endorsed by the publisher.
Supplementary material
The Supplementary Material for this article can be found online at: https://www.frontiersin.org/articles/10.3389/fpls.2025.1579376/full#supplementary-material
Supplementary Material 1 | The report of tested spatial models of the six spatial frameworks across the 23 trials.
Supplementary Table 2 | The details about all tested spatial models of the six spatial frameworks and their performances across the 23 trials.
Supplementary Table 3 | Seasonal and annual predictions for all base cultivars across the two identified mega-environments, AUM and TAS, based on the G×EBLUP model.
Supplementary Table 4 | The GEBVs and environment-driven genetic responses.
References
Alemu, A., Åstrand, J., Montesinos-López, O., Sánchez, J., Fernández-Gónzalez, J., Tadesse, W., et al. (2024). Genomic selection in plant breeding: Key factors shaping two decades of progress. Mol. Plant 17, 552–578. doi: 10.1016/j.molp.2024.03.007
Annicchiarico, P. (1997). Additive main effects and multiplicative interaction (AMMI) analysis of genotype-location interaction in variety trials repeated over years. Theor. Appl. Genet. 94, 1072–1077. doi: 10.1007/s001220050517
Arojju, S. K., Cao, M., Trolove, M., Barrett, B. A., Inch, C., Eady, C., et al. (2020a). Multi-trait genomic prediction improves predictive ability for dry matter yield and water-soluble carbohydrates in perennial ryegrass. Front. Plant Sci. 11. doi: 10.3389/fpls.2020.01197
Arojju, S. K., Cao, M., Zulfi Jahufer, M. Z., Barrett, B. A., and Faville, M. J. (2020b). Genomic predictive ability for foliar nutritive traits in perennial ryegrass. G3 Genes|Genomes|Genetics 10, 695–708. doi: 10.1534/g3.119.400880
Arojju, S. K., Conaghan, P., Barth, S., Milbourne, D., Casler, M. D., Hodkinson, T. R., et al. (2018). Genomic prediction of crown rust resistance in Lolium perenne. BMC Genet. 19, 35. doi: 10.1186/s12863-018-0613-z
Barre, P., Asp, T., Byrne, S., Casler, M., Faville, M., Rognli, O. A., et al. (2022). “Genomic prediction of complex traitsComplex traits in forage plants species: perennial grasses case,” in Genomic Prediction of Complex Traits: Methods and Protocols. Eds. Ahmadi, N. and Bartholomé, J. (New York, NY, US: Humana Press), 521–541. doi: 10.1007/978-1-0716-2205-6_19
Bornhofen, E., Fè, D., Lenk, I., Greve, M., Didion, T., Jensen, C. S., et al. (2022). Leveraging spatiotemporal genomic breeding value estimates of dry matter yield and herbage quality in ryegrass via random regression models. Plant Genome 15, e20255. doi: 10.1002/tpg2.20255
Burgueño, J., Crossa, J., Cornelius, P. L., and Yang, R.-C. (2008). Using factor analytic models for joining environments and genotypes without crossover genotype × Environment interaction. Crop Sci. 48, 1291–1305. doi: 10.2135/cropsci2007.11.0632
Butler, D. (2009). asreml: asreml() fits the linear mixed model. Hemel Hempstead, Hertfordshire, United Kingdom.
Butler, D., Cullis, B., Gilmour, A., Gogel, B., and Thompson, R. (2009). ASReml-R reference manual, release 3 (Hemel Hempstead, UK: VSN International Ltd).
Byrne, S. L., Conaghan, P., Barth, S., Arojju, S. K., Casler, M., Michel, T., et al. (2017). Using variable importance measures to identify a small set of SNPs to predict heading date in perennial ryegrass. Sci. Rep. 7, 3566. doi: 10.1038/s41598-017-03232-8
Cericola, F., Lenk, I., Fè, D., Byrne, S., Jensen, C. S., Pedersen, M. G., et al. (2018). Optimized use of low-depth genotyping-by-sequencing for genomic prediction among multi-parental family pools and single plants in perennial ryegrass (Lolium perenne L.). Front. Plant Sci. 9. doi: 10.3389/fpls.2018.00369
Chapman, D. F., Bryant, J. R., Olayemi, M. E., Edwards, G. R., Thorrold, B. S., McMillan, W. H., et al. (2017). An economically based evaluation index for perennial and short-term ryegrasses in New Zealand dairy farm systems. Grass Forage Sci. 72, 1–21. doi: 10.1111/gfs.12213
Colas, V., Barre, P., van Parijs, F., Wolters, L., Quitté, Y., Ruttink, T., et al. (2022). Seasonal differences in structural and genetic control of digestibility in perennial ryegrass. Front. Plant Sci. 12. doi: 10.3389/fpls.2021.801145
Conaghan, P., Casler, M. D., McGilloway, D. A., O’Kiely, P., and Dowley, L. J. (2008). Genotype × environment interactions for herbage yield of perennial ryegrass sward plots in Ireland. Grass Forage Sci. 63, 107–120. doi: 10.1111/j.1365-2494.2007.00618.x
Daetwyler, H. D., Kemper, K. E., van der Werf, J. H. J., and Hayes, B. J. (2012). Components of the accuracy of genomic prediction in a multi-breed sheep population. J. Anim. Sci. 90, 3375–3384. doi: 10.2527/jas.2011-4557
Duenk, P., Bijma, P., Calus, M. P. L., Wientjes, Y. C. J., and van der Werf, J. H. J. (2020). The impact of non-additive effects on the genetic correlation between populations. G3 Genes|Genomes|Genetics 10, 783–795. doi: 10.1534/g3.119.400663
Endelman, J. B. (2011). Ridge regression and other kernels for genomic selection with R package rrBLUP. Plant Genome 4, 250–255. doi: 10.3835/plantgenome2011.08.0024
Esfandyari, H., Fè, D., Tessema, B. B., Janss, L. L. G., and Jensen, J. (2020). Effects of different strategies for exploiting genomic selection in perennial ryegrass breeding programs. G3 Genes|genome|genetics 10, 3783–3795. doi: 10.1534/g3.120.401382
Faville, M. J., Ganesh, S., Cao, M., Jahufer, M. Z. Z., Bilton, T. P., Easton, H. S., et al. (2018). Predictive ability of genomic selection models in a multi-population perennial ryegrass training set using genotyping-by-sequencing. Theor. Appl. Genet. 131, 703–720. doi: 10.1007/s00122-017-3030-1
Faville, M. J., Ganesh, S., Moraga, R., Easton, H. S., Jahufer, M. Z. Z., Elshire, R. E., et al. (2016). “Development of genomic selection for perennial ryegrass,” in Breeding in a World of Scarcity. Eds. Roldán-Ruiz, I., Baert, J., and Reheul, D. (Springer International Publishing, Cham), 139–143. doi: 10.1007/978-3-319-28932-8_21
Faville, M., Schmidt, J., Trolove, M., Moran, P., Hong, W., Cao, M., et al. (2021). Empirical assessment of a genomic breeding strategy in perennial ryegrass. J. New Z. Grasslands, 115–122. doi: 10.33584/jnzg.2021.83.3490
Fè, D., Ashraf, B. H., Pedersen, M. G., Janss, L., Byrne, S., Roulund, N., et al. (2016). Accuracy of genomic prediction in a commercial perennial ryegrass breeding program. Plant Genome 9. doi: 10.3835/plantgenome2015.11.0110
Fè, D., Cericola, F., Byrne, S., Lenk, I., Ashraf, B., Pedersen, M. G., et al. (2015). Genomic dissection and prediction of heading date in perennial ryegrass. BMC Genomics 16. doi: 10.1186/s12864-015-2163-3
Federer, W. T., Newton, E. A., and Altman, N. S. (1997). “Combining standard block analyses with spatial analyses under a random effects model,” in Modelling Longitudinal and Spatially Correlated Data (New York, NY: Springer), 373–386. doi: 10.1007/978-1-4612-0699-6_33
Fiorelli, C., Woodward, S., Wastney, M., Thom, E., and Bahmani, I. (2001). “Modelling factors affecting reproductive development of perennial ryegrass in Waikato dairy pastures,” in Proceedings of the New Zealand Grassland Association (Hamilton, New Zealand: New Zealand Grassland Association (NZGA)), 165–170. doi: 10.33584/jnzg.2001.63.2442
Frei, D., Veekman, E., Grogg, D., Stoffel-Studer, I., Morishima, A., Shimizu-Inatsugi, R., et al. (2021). Ultralong oxford nanopore reads enable the development of a reference-grade perennial ryegrass genome assembly. Genome Biol. Evol. 13. doi: 10.1093/gbe/evab159
Gebremedhin, A., Badenhorst, P., Wang, J., Shi, F., Breen, E., Giri, K., et al. (2020). Development and validation of a phenotyping computational workflow to predict the biomass yield of a large perennial ryegrass breeding field trial. Front. Plant Sci. 11. doi: 10.3389/fpls.2020.00689
Gilliland, T. B. T. and Hennessy, D. (2021). Opportunities and challenges for breeding perennial ryegrass cultivars with improved livestock production potential. Irish J. Agric. Food Res. 59, 233–245. doi: 10.15212/ijafr-2020-0111
Gilmour, A. R., Cullis, B. R., and Verbyla, A. (1997). Accounting for natural and extraneous variation in the analysis of field experiments. J. Agricult. Biol. Environ. Stat 2, 269–293. doi: 10.2307/1400446
Giri, K., Chia, K., Chandra, S., Smith, K. F., Leddin, C. M., Ho, C. K. M., et al. (2019). Modelling and prediction of dry matter yield of perennial ryegrass cultivars sown in multi-environment multi-harvest trials in south-eastern Australia. Field Crops Res. 243, 107614. doi: 10.1016/j.fcr.2019.107614
Grinberg, N. F., Lovatt, A., Hegarty, M., Lovatt, A., Skøt, K. P., Kelly, R., et al. (2016). Implementation of genomic prediction in lolium perenne (L.) breeding populations. Front. Plant Sci. 7. doi: 10.3389/fpls.2016.00133
Guo, X., Cericola, F., Fè, D., Pedersen, M. G., Lenk, I., Jensen, C. S., et al. (2018). Genomic prediction in tetraploid ryegrass using allele frequencies based on genotyping by sequencing. Front. Plant Sci. 9. doi: 10.3389/fpls.2018.01165
Hammer, G. L., McLean, G., Kholová, J., and van Oosterom, E. (2023). Modelling the dynamics and phenotypic consequences of tiller outgrowth and cessation in sorghum in silico. Plants 5, 1–14. doi: 10.1093/insilicoplants/diad019
Hannaway, D., Fransen, S., Cropper, J., Teel, M., Chaney, M., Griggs, T., et al. (1999). Perennial ryegrass (Lolium perenne L.).
Hawinkel, S., De Meyer, S., and Maere, S. (2022). Spatial regression models for field trials: a comparative study and new ideas. Front. Plant Sci. 13. doi: 10.3389/fpls.2022.858711
Hayes, B. J., Cogan, N. O. I., Pembleton, L. W., Goddard, M. E., Wang, J., Spangenberg, G. C., et al. (2013). Prospects for genomic selection in forage plant species. Plant Breed. 132, 133–143. doi: 10.1111/pbr.12037
Hoefler, R., González-Barrios, P., Bhatta, M., Nunes, J. A. R., Berro, I., Nalin, R. S., et al. (2020). Do spatial designs outperform classic experimental designs? J. Agricult. Biol. Environ. Stat 25, 523–552. doi: 10.1007/s13253-020-00406-2
Holland, J. B. and Piepho, H.-P. (2024). Don’t BLUP twice. G3 Genes|Genomes|Genetics 14. doi: 10.1093/g3journal/jkae250
Jahufer, M. Z. Z., Arojju, S. K., Faville, M. J., Ghamkhar, K., Luo, D., Arief, V., et al. (2021). Deterministic and stochastic modelling of impacts from genomic selection and phenomics on genetic gain for perennial ryegrass dry matter yield. Sci. Rep. 11, 13265. doi: 10.1038/s41598-021-92537-w
Keep, T., Sampoux, J.-P., Blanco-Pastor, J. L., Dehmer, K. J., Hegarty, M. J., Ledauphin, T., et al. (2020). High-throughput genome-wide genotyping to optimize the use of natural genetic resources in the grassland species perennial ryegrass (Lolium perenne L.). G3 Genes|Genomes|Genetics 10, 3347–3364. doi: 10.1534/g3.120.401491
Konkolewska, A., Phang, S., Conaghan, P., Milbourne, D., Lawlor, A., and Byrne, S. (2023). Genomic prediction of seasonal forage yield in perennial ryegrass. Grassland Res. 2, 167–181. doi: 10.1002/glr2.12058
Leddin, C., Giri, K., and Smith, K. (2020). Application and analysis of a composite sampling strategy to cost-effectively compare nutritive characteristics of perennial ryegrass cultivars in field trials. Agronomy 10, 1152. doi: 10.3390/agronomy10081152
Leddin, C., Giri, K., and Smith, K. (2022). Variation in the nutritive characteristics of modern perennial ryegrass cultivars in South-Eastern Australian dairy environments and prospects for inclusion in the Australian forage value index (FVI). Agronomy 12, 136. doi: 10.3390/agronomy12010136
Leddin, C., Jacobs, J., Smith, K., Giri, K., Malcolm, B., and Ho, C. (2018). Development of a system to rank perennial ryegrass cultivars according to their economic value to dairy farm businesses in south-eastern Australia. Anim. Prod. Sci. 58, 1552–1558. doi: 10.1071/AN17815
Lewis, C. D., Smith, K. F., Jacobs, J. L., Ho, C. K. M., Leddin, C. M., Moate, P. J., et al. (2024). Using a two-price market value framework to value differences in metabolizable energy concentration of pasture across seasons. Agric. Syst. 217, 103939. doi: 10.1016/j.agsy.2024.103939
Li, Y., Bao, H., Xu, Z., Hu, S., Sun, J., Wang, Z., et al. (2023). AMMI an GGE biplot analysis of grain yield for drought-tolerant maize hybrid selection in Inner Mongolia. Sci. Rep. 13, 18800. doi: 10.1038/s41598-023-46167-z
Lin, Z., Cogan, N. O. I., Pembleton, L. W., Spangenberg, G. C., Forster, J. W., Hayes, B. J., et al. (2016). Genetic gain and inbreeding from genomic selection in a simulated commercial breeding program for perennial ryegrass. Plant Genome 9, 46. doi: 10.3835/plantgenome2015.06.0046
Ludovisi, R., Tauro, F., Salvati, R., Khoury, S., Mugnozza Scarascia, G., and Harfouche, A. (2017). UAV-based thermal imaging for high-throughput field phenotyping of black poplar response to drought. Front. Plant Sci. 8. doi: 10.3389/fpls.2017.01681
Malmberg, M., Smith, C., Thakur, P., Drayton, M., Wilson, J., Shinozuka, M., et al. (2023). Developing an integrated genomic selection approach beyond biomass for varietal protection and nutritive traits in perennial ryegrass (Lolium perenne L.). Theor. Appl. Genet. 136, 1–13. doi: 10.1007/s00122-023-04263-8
McEvoy, M., O’Donovan, M., and Shalloo, L. (2011). Development and application of an economic ranking index for perennial ryegrass cultivars. J. Dairy Sci. 94, 1627–1639. doi: 10.3168/jds.2010-3322
Meuwissen, T. H., Hayes, B. J., and Goddard, M. E. (2001). Prediction of total genetic value using genome-wide dense marker maps. Genetics 157, 1819–1829. doi: 10.1093/genetics/157.4.1819
Meuwissen, T., Hayes, B., and Goddard, M. (2016). Genomic selection: A paradigm shift in animal breeding. Anim. Front. 6, 6–14. doi: 10.2527/af.2016-0002
Nguyen, P. T., Shi, F., Wang, J., Badenhorst, P. E., Spangenberg, G. C., Smith, K. F., et al. (2022). Within and combined season prediction models for perennial ryegrass biomass yield using ground- and air-based sensor data. Front. Plant Sci. 13. doi: 10.3389/fpls.2022.950720
Pembleton, L. W., Drayton, M. C., Bain, M., Baillie, R. C., Inch, C., Spangenberg, G. C., et al. (2016). Targeted genotyping-by-sequencing permits cost-effective identification and discrimination of pasture grass species and cultivars. Theor. Appl. Genet. 129, 991–1005. doi: 10.1007/s00122-016-2678-2
Pembleton, L. W., Inch, C., Baillie, R. C., Drayton, M. C., Thakur, P., Ogaji, Y. O., et al. (2018). Exploitation of data from breeding programs supports rapid implementation of genomic selection for key agronomic traits in perennial ryegrass. Theor. Appl. Genet. 131, 1891–1902. doi: 10.1007/s00122-018-3121-7
Peters, T., Kluß, C., Vogeler, I., Loges, R., Fenger, F., and Taube, F. (2022). GrasProg: pasture model for predicting daily pasture growth in intensive grassland production systems in Northwest Europe. Agronomy 12, 1667. doi: 10.3390/agronomy12071667
Piepho, H.-P. (1998). Empirical best linear unbiased prediction in cultivar trials using factor-analytic variance-covariance structures. Theor. Appl. Genet. 97, 195–201. doi: 10.1007/s001220050885
Piepho, H. P., Möhring, J., Melchinger, A. E., and Büchse, A. (2008). BLUP for phenotypic selection in plant breeding and variety testing. Euphytica 161, 209–228. doi: 10.1007/s10681-007-9449-8
Pranga, J., Borra-Serrano, I., Aper, J., De Swaef, T., Ghesquiere, A., Quataert, P., et al. (2021). Improving accuracy of herbage yield predictions in perennial ryegrass with UAV-based structural and spectral data fusion and machine learning. Remote Sens. 13, 3459. doi: 10.3390/rs13173459
Rahaman, M. M., Chen, D., Gillani, Z., Klukas, C., and Chen, M. (2015). Advanced phenotyping and phenotype data analysis for the study of plant growth and development. Front. Plant Sci. 6. doi: 10.3389/fpls.2015.00619
R Core Team (2025). R: A Language and Environment for Statistical Computing (Vienna, Austria: R Foundation for Statistical Computing).
Robins, J. G. and Alan Lovatt, J. (2016). Cultivar by environment effects of perennial ryegrass cultivars selected for high water soluble carbohydrates managed under differing precipitation levels. Euphytica 208, 571–581. doi: 10.1007/s10681-015-1607-9
Robinson, G. K. (1991). That BLUP is a good thing: the estimation of random effects. Stat. Sci. 6, 15–32. doi: 10.1214/ss/1177011926
Sa’diyah, H. and Hadi, A. F. (2016). AMMI model for yield estimation in multi-environment trials: A comparison to BLUP. Agric. Agric. Sci. Proc. 9, 163–169. doi: 10.1016/j.aaspro.2016.02.113
Smith, A., Cullis, B., and Thompson, R. (2001). Analyzing variety by environment data using multiplicative mixed models and adjustments for spatial field trend. Biometrics 57, 1138–1147. doi: 10.1111/j.0006-341X.2001.01138.x
Smith, A. B., Cullis, B. R., and Thompson, R. (2005). The analysis of crop cultivar breeding and evaluation trials: an overview of current mixed model approaches. J. Agric. Sci. 143, 449–462. doi: 10.1017/S0021859605005587
Smith, A. B., Ganesalingam, A., Kuchel, H., and Cullis, B. R. (2015). Factor analytic mixed models for the provision of grower information from national crop variety testing programs. Theor. Appl. Genet. 128, 55–72. doi: 10.1007/s00122-014-2412-x
Song, H. and Hu, H. (2022). Strategies to improve the accuracy and reduce costs of genomic prediction in aquaculture species. Evolutionary Appl. 15, 578–590. doi: 10.1111/eva.13262
Su, G., Christensen, O. F., Ostersen, T., Henryon, M., and Lund, M. S. (2012). Estimating additive and non-additive genetic variances and predicting genetic merits using genome-wide dense single nucleotide polymorphism markers. PloS One 7, e45293. doi: 10.1371/journal.pone.0045293
Tanaka, T. S. T., Wang, S., Jørgensen, J. R., Gentili, M., Vidal, A. Z., Mortensen, A. K., et al. (2024). Review of crop phenotyping in field plot experiments using UAV-mounted sensors and algorithms. Drones 8, 212. doi: 10.3390/drones8060212
Varona, L., Legarra, A., Toro, M. A., and Vitezica, Z. G. (2018). Non-additive effects in genomic selection. Front. Genet. 9. doi: 10.3389/fgene.2018.00078
Wang, J., Badenhorst, P., Phelan, A., Pembleton, L., Shi, F., Cogan, N., et al. (2019). Using sensors and unmanned aircraft systems for high-throughput phenotyping of biomass in perennial ryegrass breeding trials. Front. Plant Sci. 10. doi: 10.3389/fpls.2019.01381
Wang, J., Pembleton, L. W., Baillie, R. C., Drayton, M. C., Hand, M. L., Bain, M., et al. (2014). Development and implementation of a multiplexed single nucleotide polymorphism genotyping tool for differentiation of ryegrass species and cultivars. Mol. Breed. 33, 435–451. doi: 10.1007/s11032-013-9961-6
Wedderburn, M. E., Crush, J. R., Pengelly, W. J., and Walcroft, J. L. (2010). Root growth patterns of perennial ryegrasses under well-watered and drought conditions. New Z. J. Agric. Res. 53, 377–388. doi: 10.1080/00288233.2010.514927
Wu, X., Xu, J., Feng, G., Wiggans, G. R., Taylor, J. F., Wiggans, J. F., et al. (2016). Optimal design of low-density SNP arrays for genomic prediction: algorithm and applications. PloS One 11, e0161719. doi: 10.1371/journal.pone.0161719
Yang, J., Benyamin, B., McEvoy, B. P., Gordon, S., Henders, A. K., Nyholt, D. R., et al. (2010). Common SNPs explain a large proportion of the heritability for human height. Nat. Genet. 42, 565–569. doi: 10.1038/ng.608
Yue, H., Gauch, H. G., Wei, J., Xie, J., Chen, S., Peng, H., et al. (2022). Genotype by environment interaction analysis for grain yield and yield components of summer maize hybrids across the Huanghuaihai region in China. Agriculture 12, 602. doi: 10.3390/agriculture12050602
Zhu, J., Giri, K., Cogan, N. O., Smith, K. F., and Jacobs, J. L. (2023). Genotype-by-environment interaction analysis of dry matter yield of perennial ryegrass cultivars across south-eastern Australia using factor analytic models. Field Crops Res. 303, 109143. doi: 10.1016/j.fcr.2023.109143
Zhu, J., Malmberg, M. M., Shinozuka, M., Retegan, R., Cogan, O. I., Giri, K., et al. (2024). Ryegrass Genotype Allele Frequency Dataset (Victoria, Australia: The University of Melbourne). doi: 10.26188/26392210
Zhu, J., Malmberg, M. M., Shinozuka, M., Retegan, R. M., Cogan, N. O., Jacobs, J. L., et al. (2025). Machine learning solutions for integrating partially overlapping genetic datasets and modelling host–endophyte effects in ryegrass (Lolium) dry matter yield estimation. Front. Plant Sci. 16. doi: 10.3389/fpls.2025.1543956
Keywords: regional evaluation system, environmental adaptability, sustainable forage production, multi-harvest multi-site trials, genomic selection
Citation: Zhu J, Giri K, Lin Z, Cogan NO, Jacobs JL and Smith KF (2025) Estimation of ryegrass (Lolium) dry matter yield using genomic prediction considering genotype by environment interaction across south-eastern Australia. Front. Plant Sci. 16:1579376. doi: 10.3389/fpls.2025.1579376
Received: 19 February 2025; Accepted: 19 May 2025;
Published: 09 June 2025.
Edited by:
Guijun Gary Yan, University of Western Australia, AustraliaReviewed by:
João Ricardo Bachega Feijó Rosa, RB Genetics & Statistics Consulting, BrazilHabtamu Ayalew, Inari Agriculture, United States
Copyright © 2025 Zhu, Giri, Lin, Cogan, Jacobs and Smith. This is an open-access article distributed under the terms of the Creative Commons Attribution License (CC BY). The use, distribution or reproduction in other forums is permitted, provided the original author(s) and the copyright owner(s) are credited and that the original publication in this journal is cited, in accordance with accepted academic practice. No use, distribution or reproduction is permitted which does not comply with these terms.
*Correspondence: Jiashuai Zhu, amlhc2h1YWl6QHN0dWRlbnQudW5pbWVsYi5lZHUuYXU=;, amlhc2h1YWkuemh1QGFncmljdWx0dXJlLnZpYy5nb3YuYXU=
†ORCID: Jiashuai Zhu, orcid.org/0000-0002-9916-9732