 Hongjuan Zhang
 Rui Zhang1*
- 1College of Water Conservancy and Hydropower Engineering, Gansu Agricultural University, Lanzhou, China
- 2Liangzhou District Agricultural Technology Extension Center, Wuwei, China
- 3College of Environmental and Energy Engineering, Beijing University of Technology, Beijing, China
- 4Zhangye City Water Saving Irrigation Experimental Research Center, Zhangye, China
Inefficient irrigation and fertilizer practices in spring maize production in a Chinese semi-arid region have led to suboptimal fertilizer utilization and yield limitations. Few studies in this region have adequately incorporated long-term meteorological data to optimize irrigation and fertilizer strategies. In this study, we employed the Root Zone Water Quality Model 2 (RZWQM2) to evaluate and optimize irrigation and fertilizer management practices. The model was calibrated and validated using field experimental data during 2022–2023, including two irrigation levels [75%–95% (I1) and 55%–75% field capacity (I2)] and three fertilizer treatments [234.27 (F1), 157.5 (F2), and 157.5 kg hm−2 nitrogen fertilizer (F3), and F3 plus 63 kg hm−2 organic fertilizer). The validated model demonstrated excellent performance in simulating key parameters, including soil water content (SWC) [mean relative error (MRE) and normalized root mean squared error (NRMSE) < 15%, consistency index (d) > 0.80], biomass (d > 0.85), grain yield (MRE < 15%), and NH4+-N and NO3−-N contents (RMSE < 10 mg kg−1, MRE and NRMSE < 15%, d > 0.60), of spring maize in 2022 and 2023. Under simulated climate scenarios, optimal yields of 21.54, 20.78, and 17.57 t hm−2 were achieved using a combined application of 60% nitrogen and 40% organic fertilizer across three irrigation quotas. The irrigation quota of 250 m3 hm−2 demonstrated superior water use efficiency (WUE), irrigation water use efficiency (IWUE), and partial factor productivity (PFP) compared to quotas of 300 and 200 m3 hm−2. These findings provide valuable insights for developing sustainable irrigation and fertilizer strategies for spring maize production in a semi-arid region of China.
1 Introduction
Maize is one of the most important grain crops in the world, accounting for 36.8% of China’s total grain crop planting area and ranking first in production volume (Li et al., 2017; Zhang et al., 2024). Adequate light and heat resources are important factors for spring maize growth in a semi-arid region of China (Kang et al., 2014). However, water resources are scarce in this region, accounting for only approximately 10% of the country’s total water resources, which severely constrains local maize production (Wang et al., 2018). Irrigation and fertilizer are crucial measures to ensure high maize yields in a semi-arid region (Qiang et al., 2019). In the widespread cultivation of maize in a semi-arid region, farmers often rely on over-irrigation and excessive fertilization to achieve high crop yields (Liu and Zhang, 2007), which significantly reduces irrigation and fertilizer use efficiency (Yang et al., 2022). Therefore, optimal irrigation and fertilizer management that achieves both high yields and resource use efficiency is critical to address these challenges and ensure sustainable spring maize production in a semi-arid region of China.
The integrated optimization of irrigation and fertilizer management strategies is considered an effective way to improve irrigation and fertilizer use efficiency and cope with water scarcity in agriculture (Yan et al., 2021). Recent years have witnessed growing scientific efforts to optimize integrated irrigation and fertilizer management protocols in maize cultivation systems, particularly focusing on precision irrigation scheduling and nutrient delivery mechanisms (Zhou et al., 2019), and the combined application of inorganic and organic fertilizers in irrigation and fertilizer research has been increasingly proposed (Baharuddin and Tejowulan, 2021; Ilahi et al., 2020). Meanwhile, soil water content control technology can effectively reduce deep soil water content leakage and nitrogen fertilizer leaching while achieving high yield and water use efficiency (Fang et al., 2008; Panda et al., 2004). Studies have shown that replacing some chemical fertilizers with organic fertilizers can significantly increase maize yield, water use efficiency, and economic benefits while reducing nitrogen fertilizer application (Zhai et al., 2022; Zhou et al., 2022; Wang et al., 2017). Wang et al. (2017) determined that organic fertilizer application improved water use in 50–150-cm soil depth and increased grain yield by 5%–10%. He et al. (2022) found that the application of organic fertilizers increased the yield of wheat and maize by 26.4%–44.6% and 12.5%–40.8%, respectively. However, these studies were conducted over only 2–3 years of field experiments and were unable to determine the optimal irrigation and fertilizer application rates under different climate scenarios.
In recent years, research on the effects of increased temperature and precipitation on crops under global warming scenarios has received increasing attention (Zhang et al., 2021; Ureta et al., 2020). Over the past few decades, climate change, primarily characterized by increases in temperature and precipitation, has severely impacted crop growth and water use in the Northwest (Chen et al., 2015). Liu et al. (2018) studied yield changes in spring wheat and summer maize by organic and inorganic fertilizers through long-term fertilization and climate change. Crop modeling systems have emerged as pivotal methodological frameworks for evaluating climate change effects on agricultural systems, particularly in analyzing yield formation dynamics, irrigation scheduling optimization, and precision nutrient management (Matthews et al., 2013; Bassu et al., 2014). The Root Zone Water Quality Model 2 (RZWQM2) model has been widely evaluated and applied in studying climate impacts on crops. Chen et al. (2019) used the RZWQM2 model to investigate the effects of climate change on cotton yield and crop water demand in extreme drought regions. Liu et al. (2019) qualitatively analyzed the response of grain yields to major climatic variables through the RZWQM2 model and predicted grain yields of maize in the Siping region, Jilin Province, Northeast China, during the period from 1951 to 2015. Ding et al. (2024) developed an optimized nitrogen fertilizer strategy for winter wheat based on precipitation changes using the RZWQM2 model in the Loess Plateau region. Meanwhile, the RZWQM2 model has been widely used by a large number of studies on crop growth, water and salt transport, optimal management of irrigation and fertilizer under climate change, and greenhouse gas emissions from farmland (Zhang et al., 2025; Singh et al., 2025). While substantial modeling efforts have elucidated irrigation–inorganic fertilizer interactions under climate change scenarios, research addressing model-specific irrigation systems coupled with integrated organic–inorganic fertilization remains critically underexplored.
However, most simulations have been conducted using either irrigation or nitrogen fertilizer alone, while studies on the combined effects of irrigation and coupled organic and inorganic fertilizers under climate change scenarios are limited. Consequently, further study is required to assess the performance of the RZWQM2 model and develop optimal management strategies for irrigation and fertilizer application rates for spring maize. The objectives of this study were 1) to evaluate the applicability of the RZWQM2 model for simulating soil water content, biomass, grain yield, and NH4+-N and NO3−-N contents of spring maize in a semi-arid region; and 2) to determine an optimal irrigation quota and fertilizer application rate for spring maize in the study area under climate change scenarios.
2 Materials and methods
2.1 Study site
The field experiment was conducted from 2022 to 2024 at the Minqin Experiment Station of the Gansu Research Institute of Water Conservancy (38°65′ N, 103°15′ E), China. The study site is located in the Hexi Corridor of Northeastern China (Figure 1), which has a temperate continental arid climate with an altitude of 1,580 m. The annual mean temperature, potential evaporation, and sunshine hours are approximately 7.8°C, 140 mm, 2,000 mm, and 3,000 h, respectively. In this study, the soil type was loamy, and the percentage of soil textures sandy, loamy, and clayey under the 0–60-cm soil layer was 38.1%, 41.3%, and 20.6%, respectively. Soil available phosphorus, potassium, potassium nitrate, ammonia nitrogen, and organic matter contents in the 0–20-cm soil layer were 29.56, 152.62, 40.23, 54.63, and 3.39 g kg−1, respectively. The precipitation during the spring maize growing seasons of 2022–2023 and 2023–2024 were 114.9 and 144.7 mm, respectively (Figure 2).
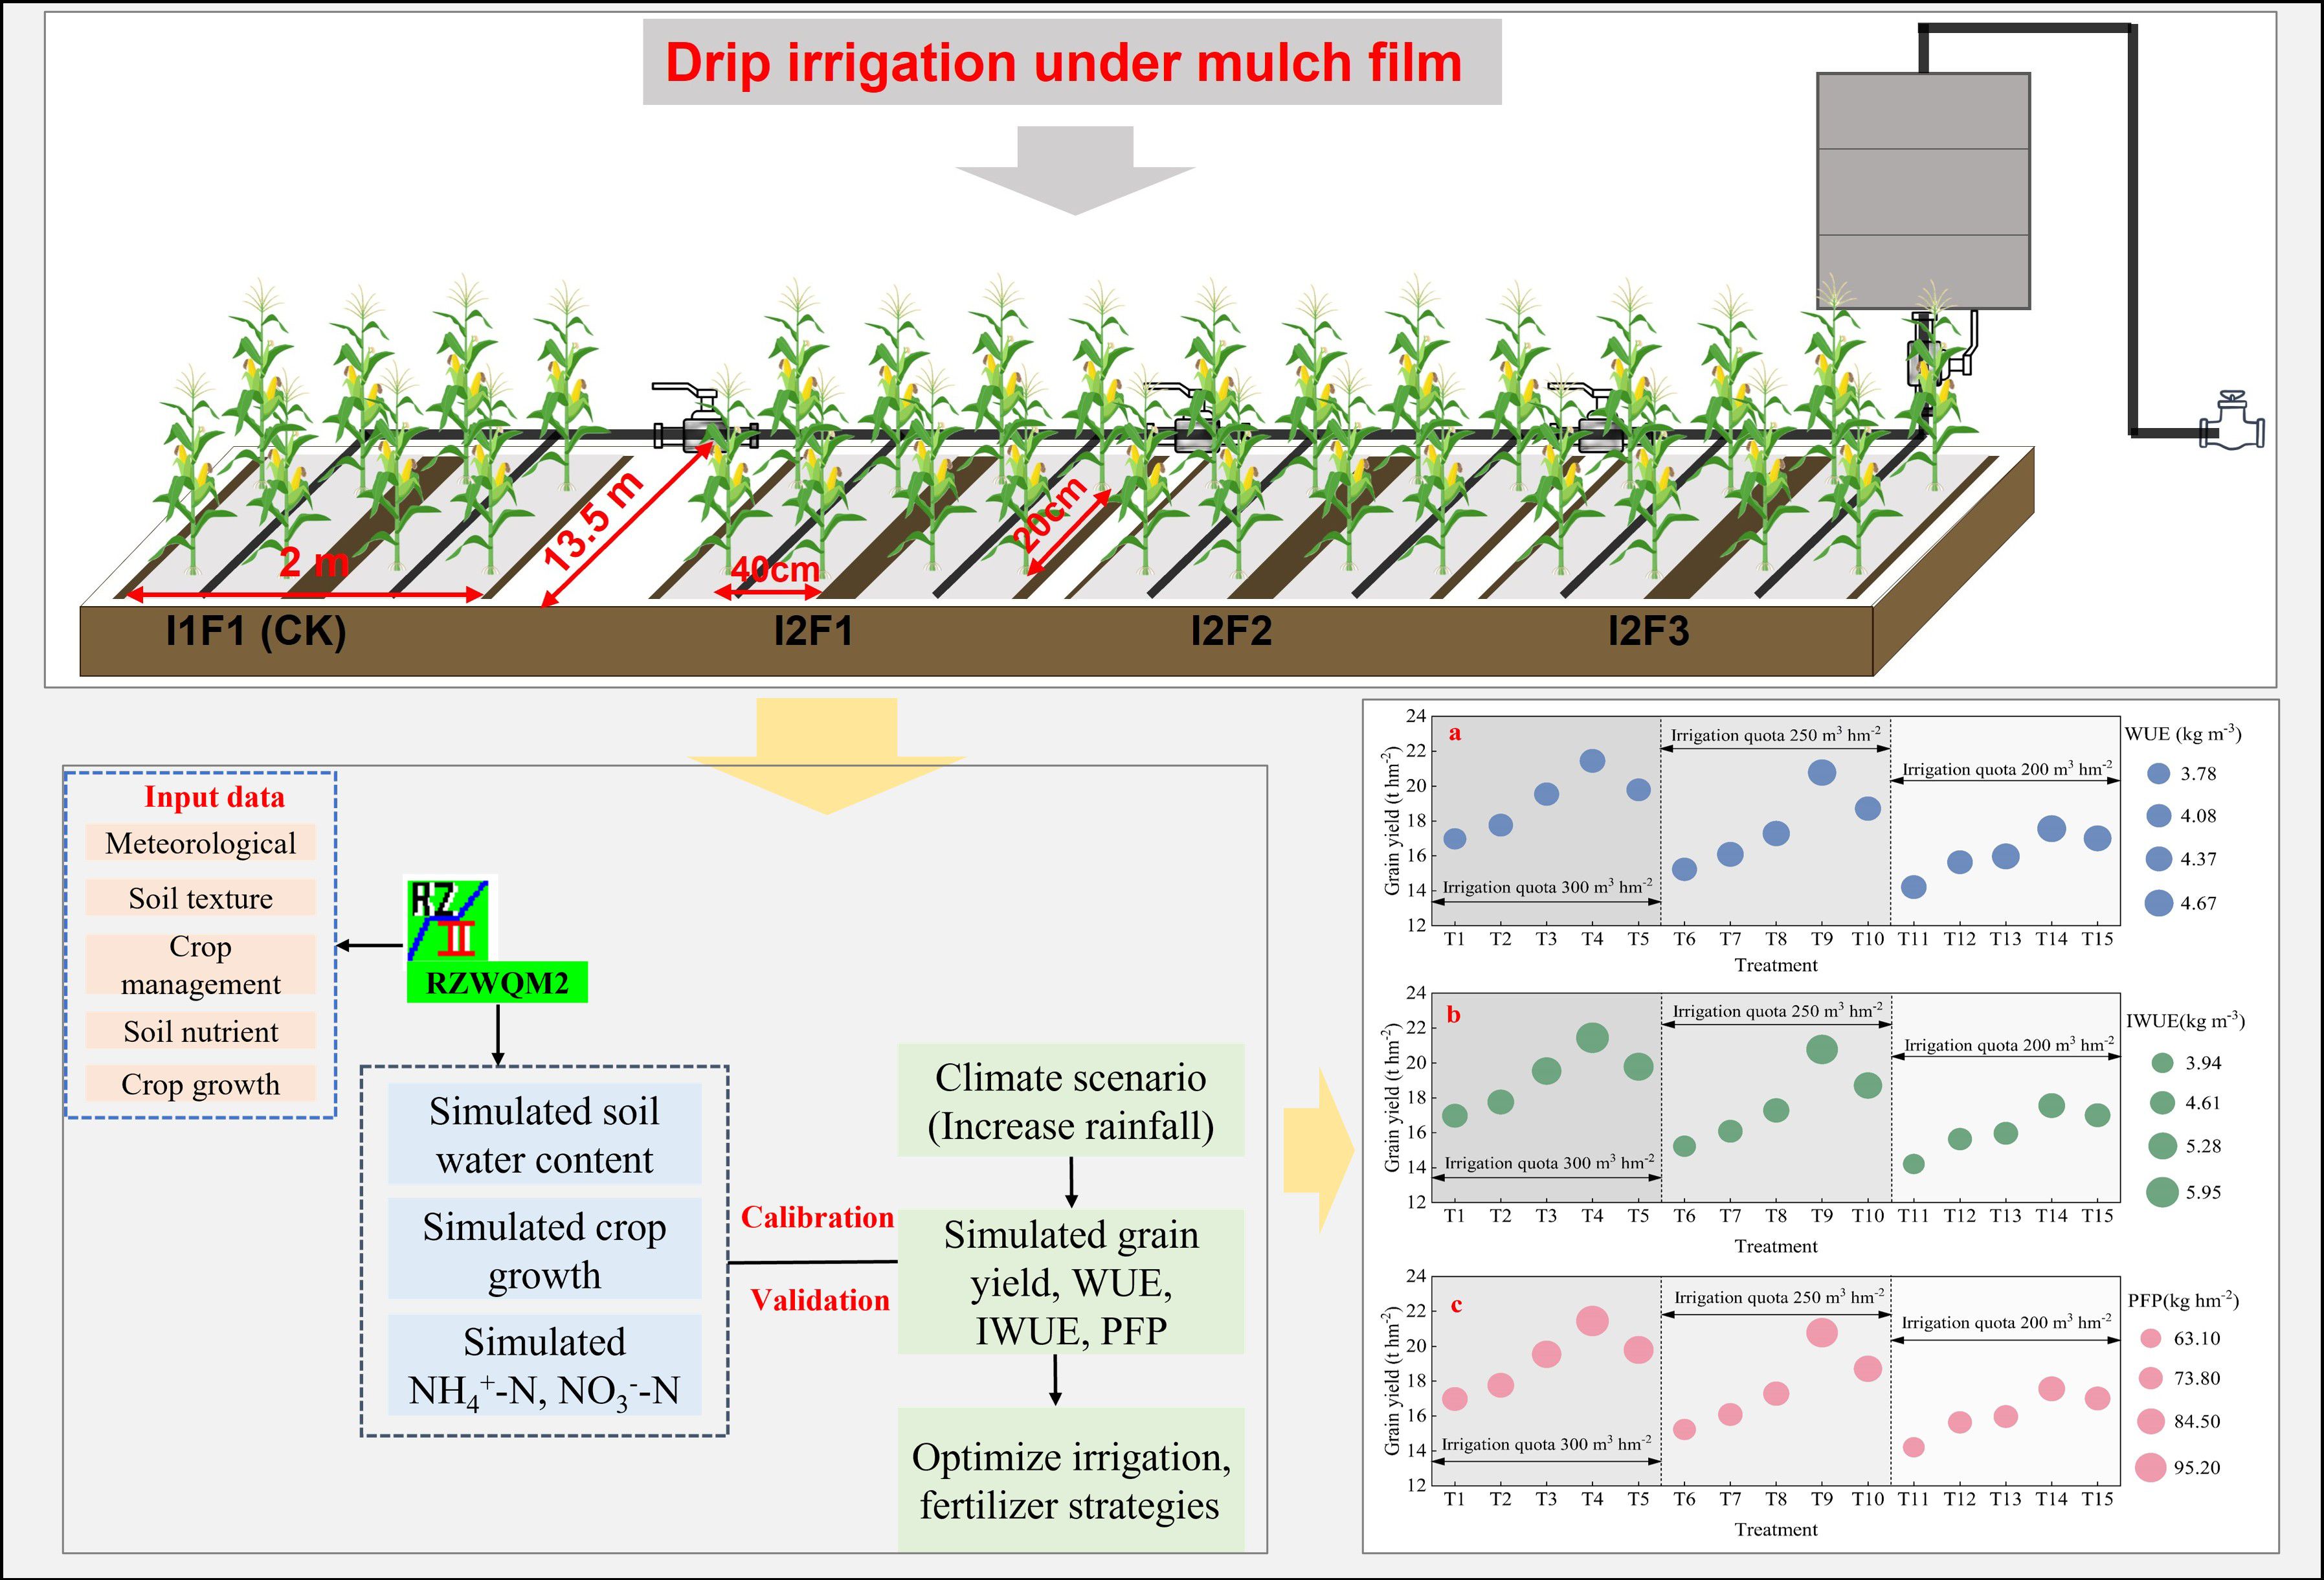
Figure 1. Schematic illustration of the study area.
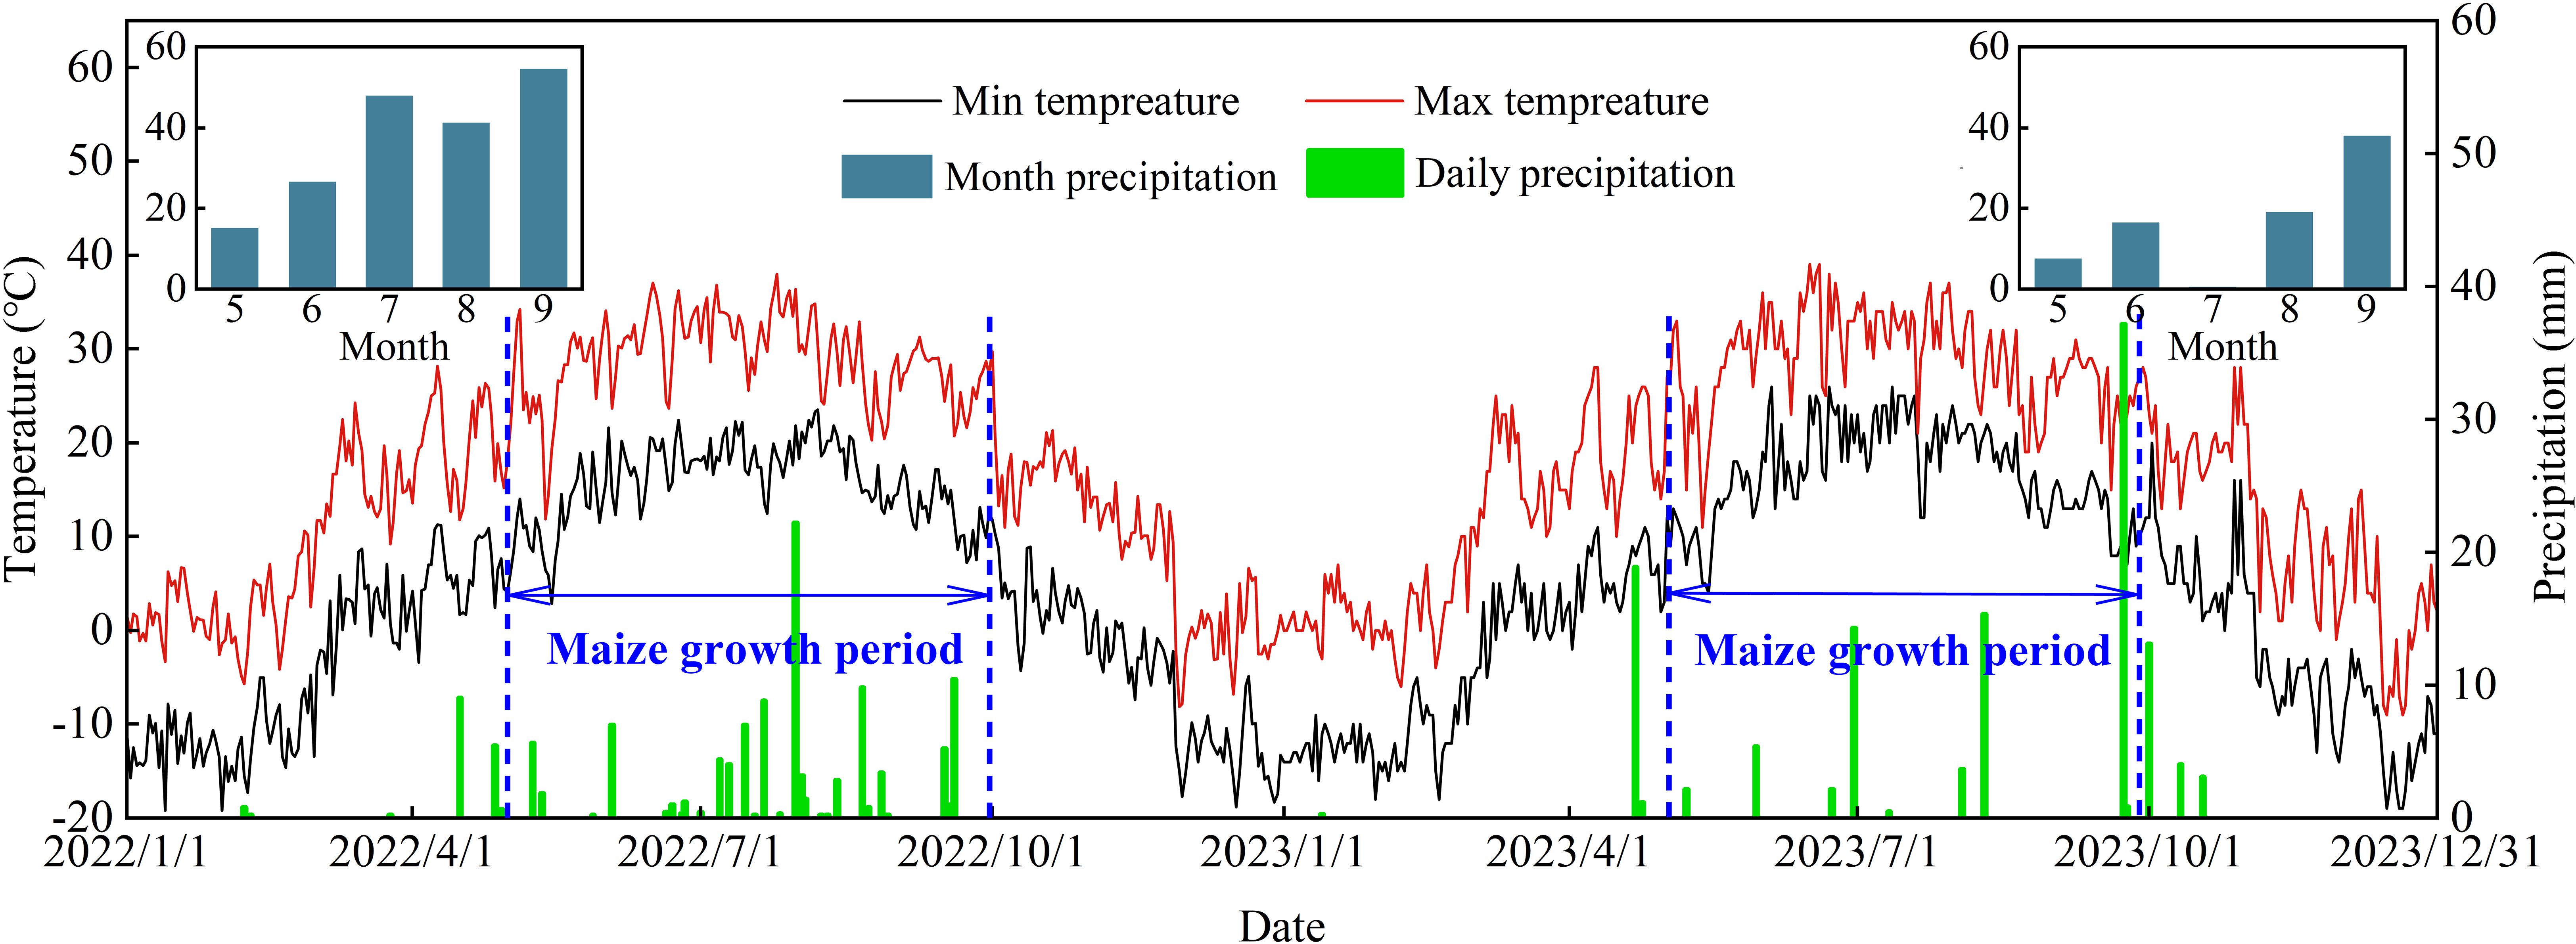
Figure 2. Precipitation, maximum temperature (Tmax), and minimum temperature (Tmin) during the spring maize growth season in 2022 and 2023.
2.2 Field experiments
Six irrigation and fertilizer treatments were considered during the 2022 and 2023 field experiment periods. Each treatment had three replications, the plot had a size of 13.5 m × 2.0 m, and a 0.008-mm-thick white film was laid in one film with a four-row pattern (Figure 1). The irrigation fertilizer treatments included two different irrigation volumes (in this study, irrigation was performed when soil moisture values decreased to the lower limit of field capacity) [i.e., 75%–95% field capacity (I1) and 55%–75% field capacity (I2)] and three different fertilizer application rates [i.e., (N+P2O5 ≥ 64.0%) 234.37 kg hm−2 nitrogen fertilizer (F1), (N+P2O5 ≥ 64.0%) 157.50 kg hm−2 nitrogen fertilizer (F2), and (N+P2O5 ≥ 64.0%) 157.50 kg hm−2 nitrogen fertilizer plus 63.00 kg hm−2 organic fertilizer (F3)]. In this study, the organic fertilizer dosage was maintained at 63 kg hm−2, with conventional nitrogen fertilization remaining the predominant nutrient supply strategy according to standard agricultural protocols. The main reason for choosing three different types of fertilizers in this experiment was to investigate the changes in the growth of crops based on our normal application of nitrogen fertilizers and the addition of organic fertilizers to nitrogen reduction. Therefore, the four different water fertilizer treatments were I1F1, I2F1, I2F2, and I2F3 (Table 1). Drip irrigation was used during the spring maize growing seasons, and the irrigation amount was controlled using water metering devices. “Tong Kang DK818”, a local spring maize cultivar grown in the Northwest Arid Regions, was the spring maize variety used in this experiment. Seeds were over-sown manually with 40-cm row spacing on 1 May and 25 April in 2022 and 2023, respectively. At the seedling period, the planting density was approximately 80,000 plants ha−1. The spring maize was harvested on 30 September 2022 and 28 September 2023. Other field management practices were consistent with local management practices.
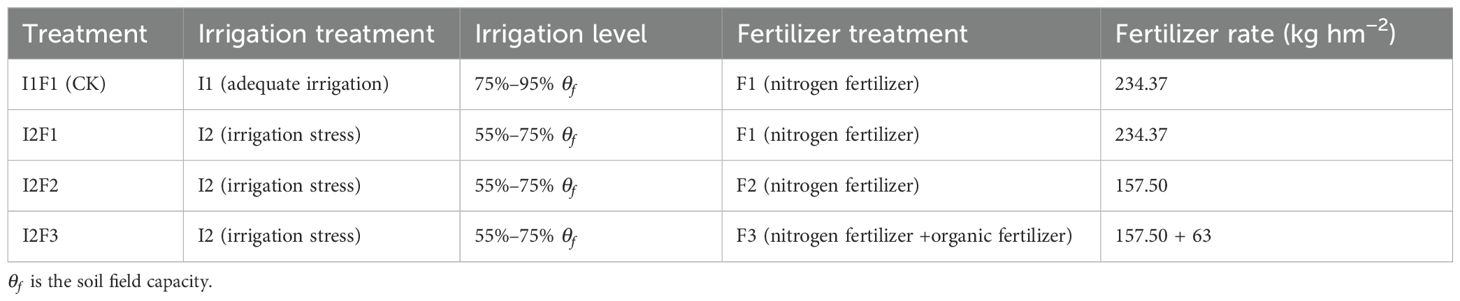
Table 1. Irrigation levels (I) and fertilizer rates (F) for spring maize during the growing season in 2022 and 2023.
After spring maize was planted, each treatment by a (N+P2O5 ≥ 64.0%) 234.37 kg hm−2 fertilizer was applied at the ratio of 3:4:3 at the late seedling, nodulation, and filling stages, respectively. Before spring maize was planted, drip irrigation mains and branches were installed, with individual meters and valves for each treatment to control the amount of irrigation applied. The field capacity (θf) of the experimental site was determined to be 20.75% by using the “frame flooding irrigation method” and volumetric water content determination method, with the upper limit of full irrigation at 95% θf and the lower limit at 75% θf, and the upper limit of partially flooded water at 75% θf and the lower limit at 55% θf. The irrigation was carried out when the relative water content of the soil decreased to the lower limit of water control. When the relative water content of the soil dropped to the lower limit of water control, irrigation was carried out. The cumulative amounts of adequate and stress irrigation were 330.0, 277.5, 330.0, and 217.5 mm during the complete growth period of spring maize in 2022 and 2023 (Figure 3). In this study, soil depth for irrigation management was 40 mm at the seedling stage and 60 mm at the nodulation to maturity stage in 2022 and 2023.
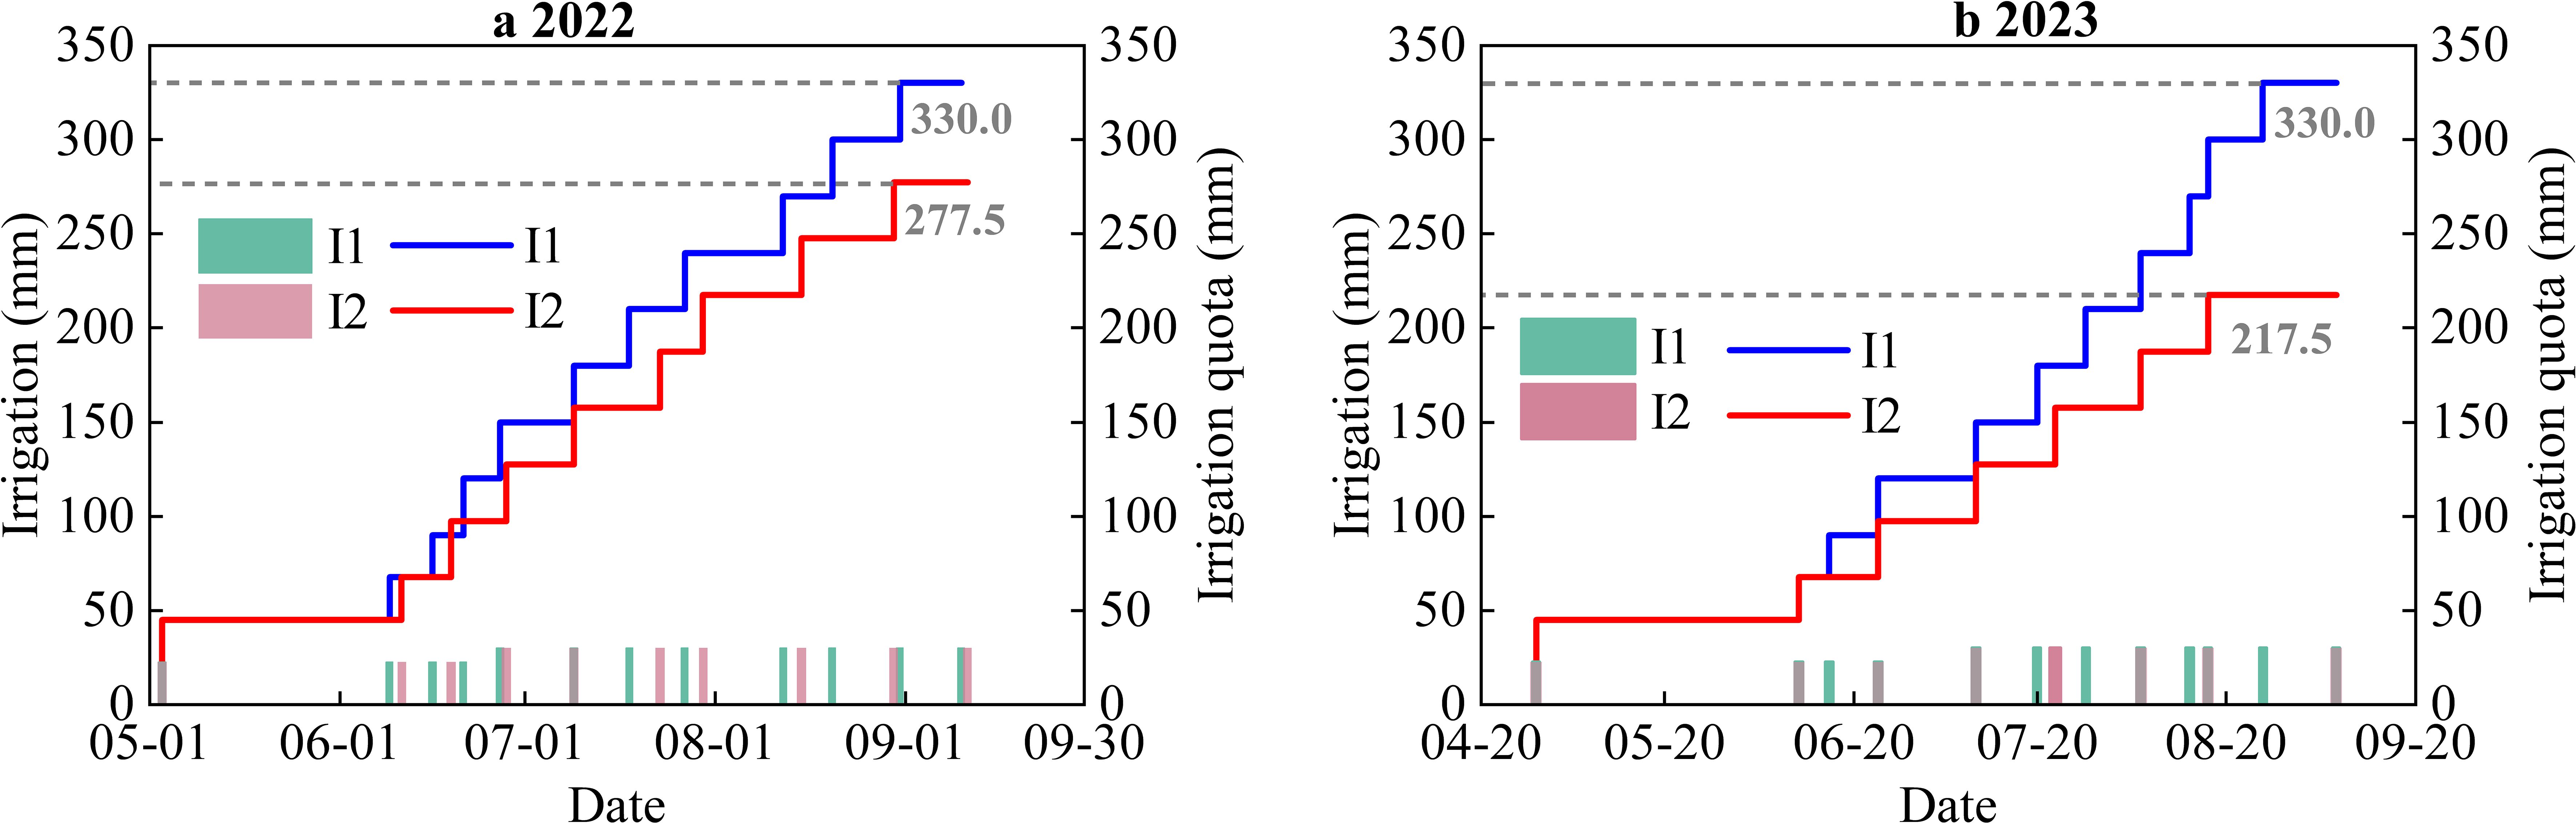
Figure 3. Cumulative irrigation and irrigation quota during the complete growth period of spring maize in 2022 (a) and 2023 (b).
2.3 Data collection
2.3.1 Meteorological data
The meteorological data during the spring maize growth period were measured from the China Meteorological Data Service Center (http://data.cma.cn, accessed on 29 January 2024) in this experiment site and included daily maximum and minimum temperature (°C), daily average temperature (°C), precipitation (mm), relative humidity (%), wind speed (km day−1), and sunshine hours (h). The daily radiation was determined by an integrated module based on the Penman–Monteith formula (Harmsen and Justiniano, 2016).
2.3.2 Soil water content
Soil water content (SWC) was determined at a depth of 60 cm below the surface by the soil drying method. Soil samples were taken near the center of each plot every 5–7 days (after precipitation or irrigation) using a 3.5-cm-diameter soil auger, and samples were taken at 20-cm intervals below the surface. Wet soil samples were weighed and placed in an oven at 105°C for 8 h before being weighed.
2.3.3 Yield
In each plot, the ears of spring maize were threshed after harvest, air-dried, and weighed, and the actual yield was determined by repeating the process three times. Five representative ears were randomly selected and brought back to the laboratory for seed testing to examine the number of rows, the number of grains, and the quality of 100 grains in each ear.
2.3.4 Soil profile nitrate-N and ammonium-N contents
Soil nitrate nitrogen and ammonium nitrogen contents in the 0–20-cm, 20–40-, and 40–60-cm soil layers were determined at the seedling stage, elongation stage, silking stage, grain filling stage, and maturity stage of spring maize in 2022 and 2023. The nitrate-N (NO3−-N) and ammonium-N (NH4+-N) contents were determined by leaching with KCl solution (2 mol L−1 KCl solution, 5 g of dry soil, soil to solution ratio = 1:10) and using a UV-Vis spectrophotometer (Pulsar T6 New Century).
2.4 RZWQM2 description
The RZWQM2 is a one-dimensional model of agricultural systems and resource management introduced by the American Research Institute of Agricultural Systems (ARS) in 1992 (Ma et al., 2012a, b). The model consists of six sub-modules, including the nutrient cycling module, physical transport module, chemical reaction module, pesticide module, crop growth module, and management module, and each module interacts with each other (Ahuja et al., 2000).
The latest version of the RZWQM2 has evolved steadily since its debut in 1992 (Ahuja et al., 2000; Ma et al., 2007; Qi et al., 2012). The infiltration process of soil water was described in the model by the Green–Ampt infiltration equation, while Poiseuille’s and Richard’s equations were used to simulate macroporous flow and the redistribution of soil water, respectively (Ma et al., 2006; Jiang et al., 2020). The RZWQM2 offers a wide range of options for simulating crop growth, including the universal crop growth model, the CROPGRO model, the CERES model, the rapid planting crop model, the quick turf model, and the rapid tree model (Sadhukhan et al., 2019b, 2019a). In this study, the CERES-maize model in the crop module was selected to simulate maize growth and development, and the model crop parameters are shown in Table 2. Meanwhile, the data to be input into the model include meteorological data, initial soil conditions, soil characterization parameters, and field management data; the required soil physicochemical parameters are shown in Table 3. The nutrient process submodel (OMNI) was used to simulate changes in the nitrate (NO3−-N) and ammonium (NH4+-N) nitrogen contents of the soil profile using the carbon-to-nitrogen ratio (Shaffer et al., 1992). The initial values of different C/N pools and the C/N conversion factor were determined to improve the accuracy of the model in simulating soil NO3−-N and NH4+-N contents (Fang et al., 2008).
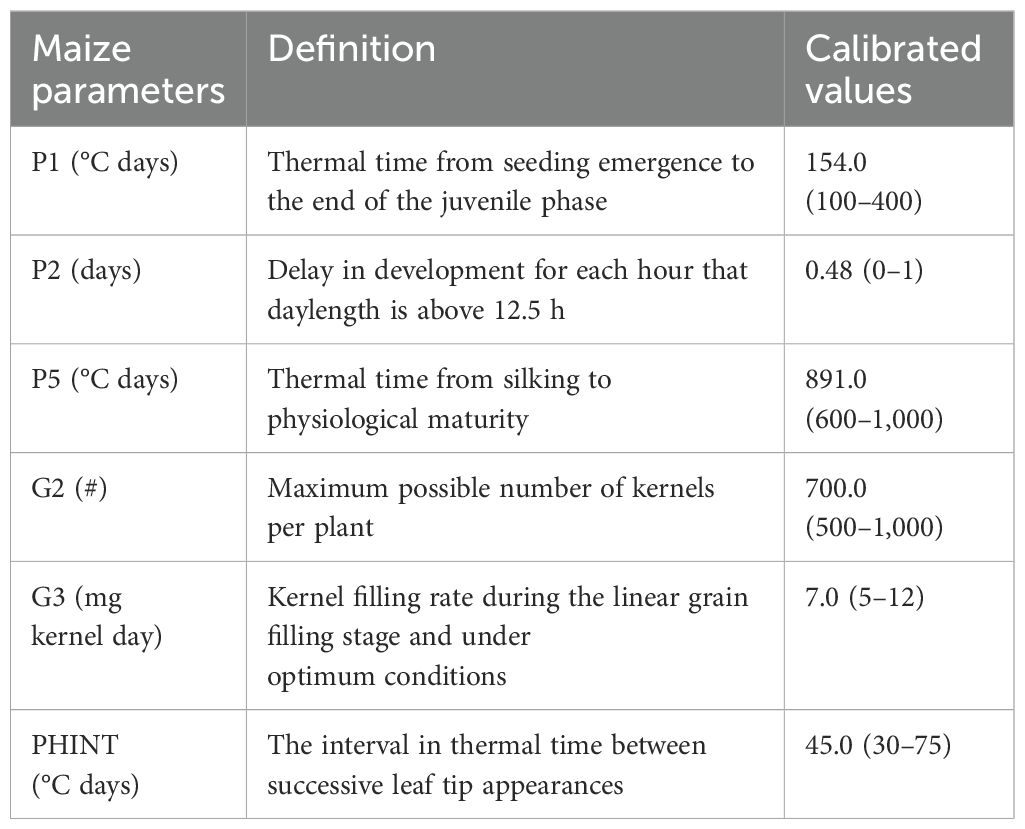
Table 2. Initial and calibrated values of crop genetic coefficients used for spring maize by RZWQM2.
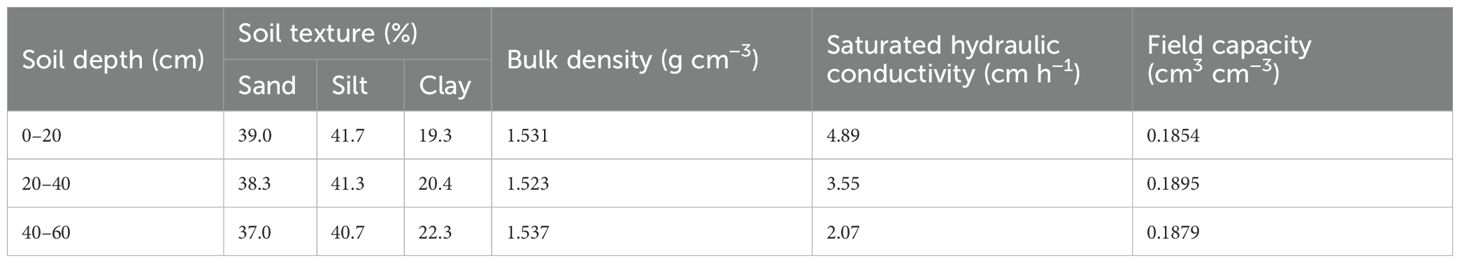
Table 3. Main physical parameters of different soil depths in the experimental site.
2.5 Model performance criteria and calculations
The evaluation indicators of the model simulation were utilized in the study region (Nash and Sutcliffe, 1970), including root mean squared error (RMSE) (Equation 1), normalized root mean squared error (NRMSE) (Equation 2), mean relative error (MRE) (Equation 3), and consistency index (d) (Equation 4):
where S is the simulated value, O is the observed value, N is the number of data points, Savg is the average of the simulated value, Oavg is the average of the observed value, and i is the specific number of simulated and measured values.
RMSE reflects the magnitude of the average difference between the measured and simulated results (Gupta Hoshin et al., 1999), and MRE reflects the average value of the relative error. The closer the values of the RMSE and MRE are to 0, the more accurate is the model (Hong et al., 2021). NRMSE reflects the performance of the model (excellent is NRMSE ≤ 10%, good is 10% < NRMSE ≤ 20%, fair is 20% < NRMSE ≤ 30%, and poor is NRMSE > 30%) (Jamieson et al., 1991). A perfect match between the measurement results and simulation results would yield an NRMSE of 0 (Zhang et al., 2023). d determines the degree of correlation between the measured and simulated results. The closer the value of d is to 1, the more accurate is the model (Moriasi et al., 2015).
2.6 Irrigation quota and fertilizer scenario design
In this study, to determine the appropriate irrigation and fertilizer scheduling for spring maize, three irrigation quotas (300, 250, and 200 m3 hm−2) and five fertilizer applications (225 kg hm−2 organic fertilizer, 45 kg hm−2 nitrogen fertilizer and 180 kg hm−2 organic fertilizer, 90 kg hm−2 nitrogen fertilizer and 135 kg hm−2 organic fertilizer, 135 kg hm−2 nitrogen fertilizer and 90 kg hm−2 organic fertilizer, and 180 kg hm−2 nitrogen fertilizer and 45 kg hm−2 organic fertilizer) with 15 years (2009–2023) of 15-mm increase in rainfall, changes in water use efficiency (WUE) (Equation 5), irrigation water use efficiency (IWUE) (Equation 6), and partial factor productivity (PFP) (Equation 7) were investigated (Table 4). Meanwhile, the number of irrigations was set to 12, and the irrigation dates were set based on local precipitation variations. The calibrated and validated RZWQM2 model was used to simulate and calculate the yield, WUE, IWUE, and PFP for each scenario. Then, the appropriate irrigation quota and fertilizer amount were determined as those with a high yield, WUE, IWUE, and PFP by analyzing these indicators.
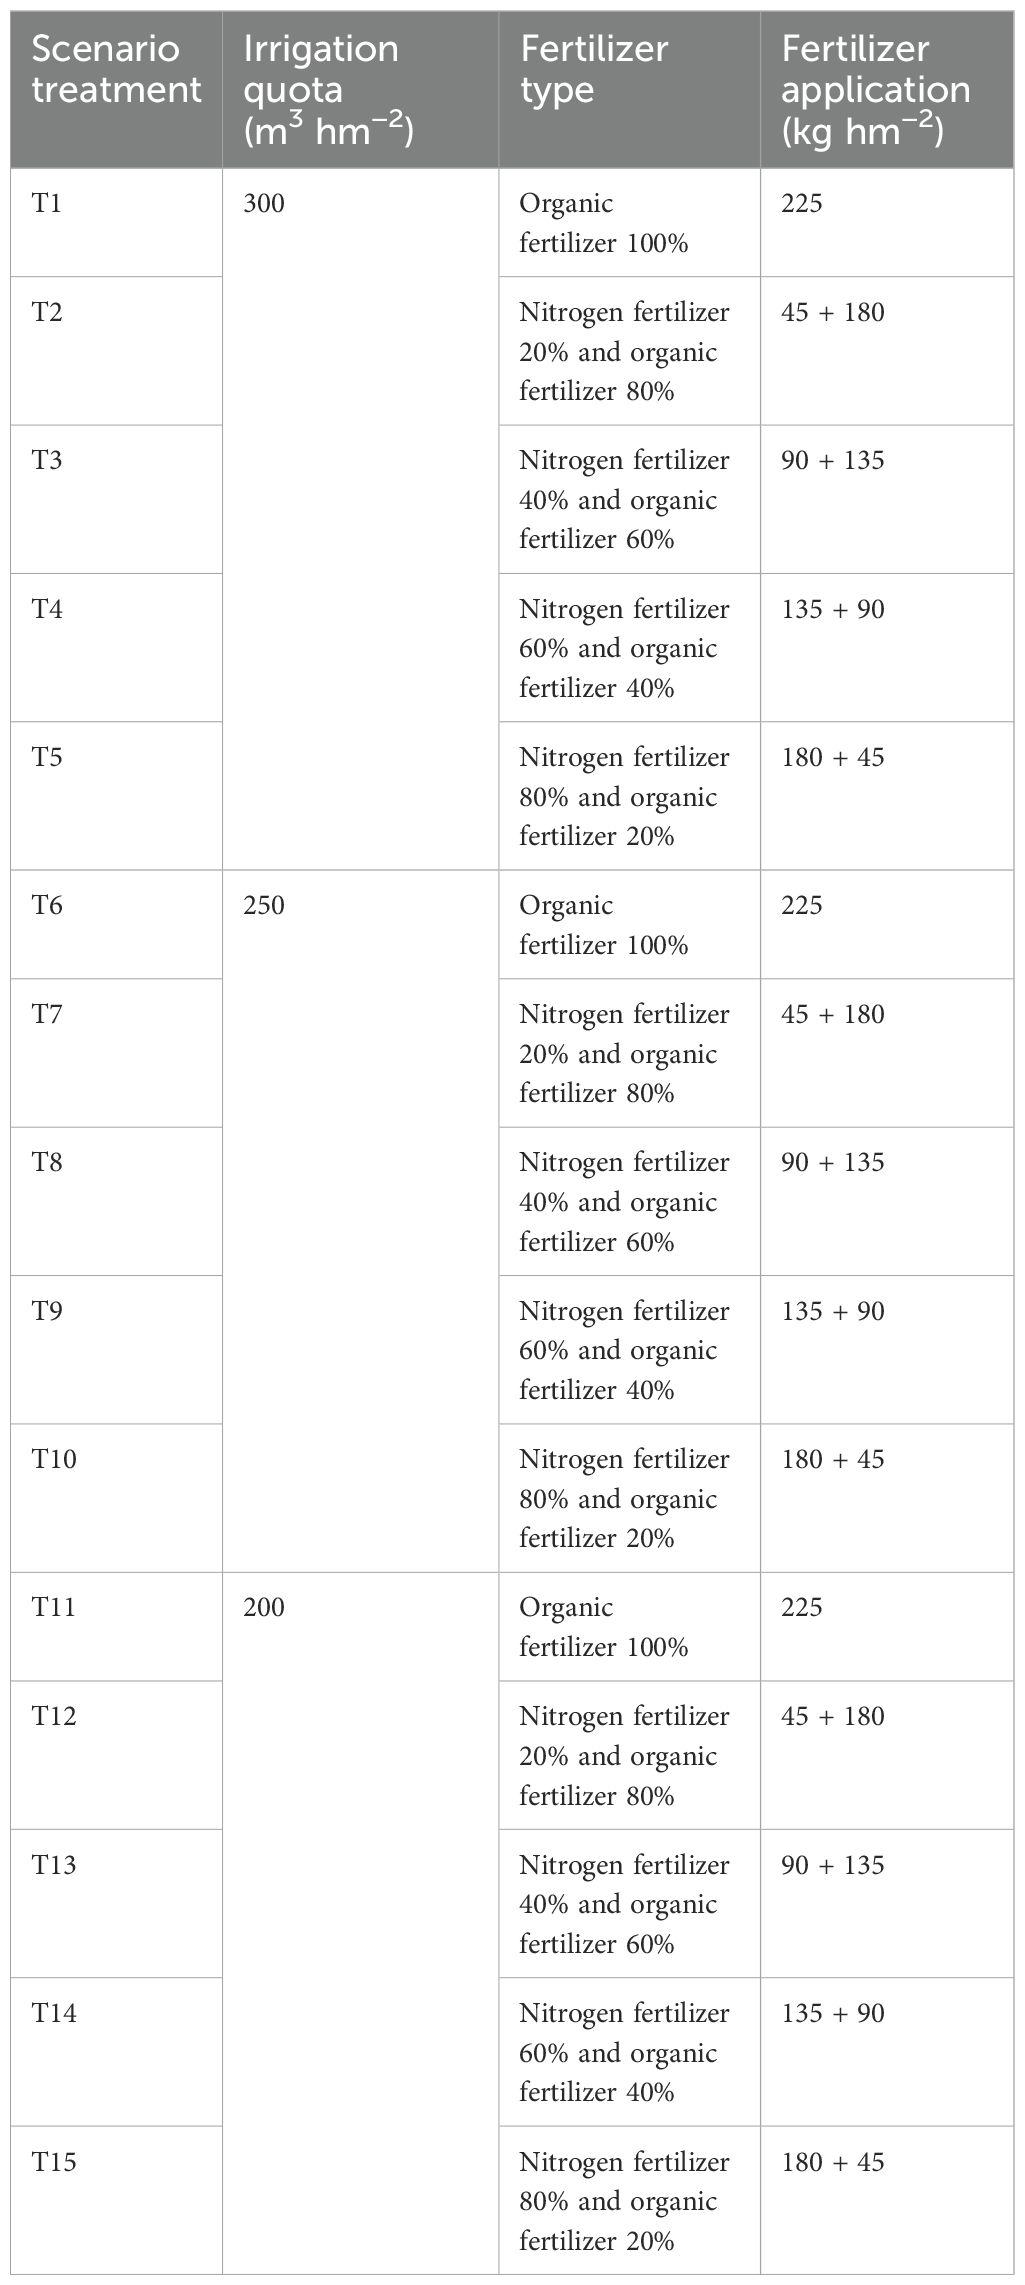
Table 4. Design of simulated scenarios with different irrigation quotas and fertilizer applications by spring maize.
where Ymaize is the simulated spring maize grain yield (t hm−2), ET is the simulated evapotranspiration in spring maize growth period (mm), Iirrigation is the irrigation quota (m3 hm−2), and Ffertilizer is the fertilizer application (kg hm−2).
2.7 Statistical analysis
Excel 2016 and Minitab 15 were used for data processing, and Origin 2024 was utilized to create figures in this study. Soil water content and crop biomass data are expressed as means of three replications. Data were analyzed for significant differences using the IBM SPSS Statistics 27 statistical software. Multiple comparisons were performed using the least significant difference (LSD) test at p < 0.05.
3 Results
3.1 Model calibration and validation of soil water content and crop growth
Figure 4 shows the variation in the observed and simulated SWC values in the 0–60-cm soil layer for different treatments during 2022 and 2023. In this study, measured SWC data from 2022 were used to calibrate the model parameters, and the model from 2023 was validated. In the whole growth seasons, the observed and simulated values of SWC under the four treatments were relatively similar and corresponded to the trend of the SWC dynamics of spring maize in 2022 and 2023.
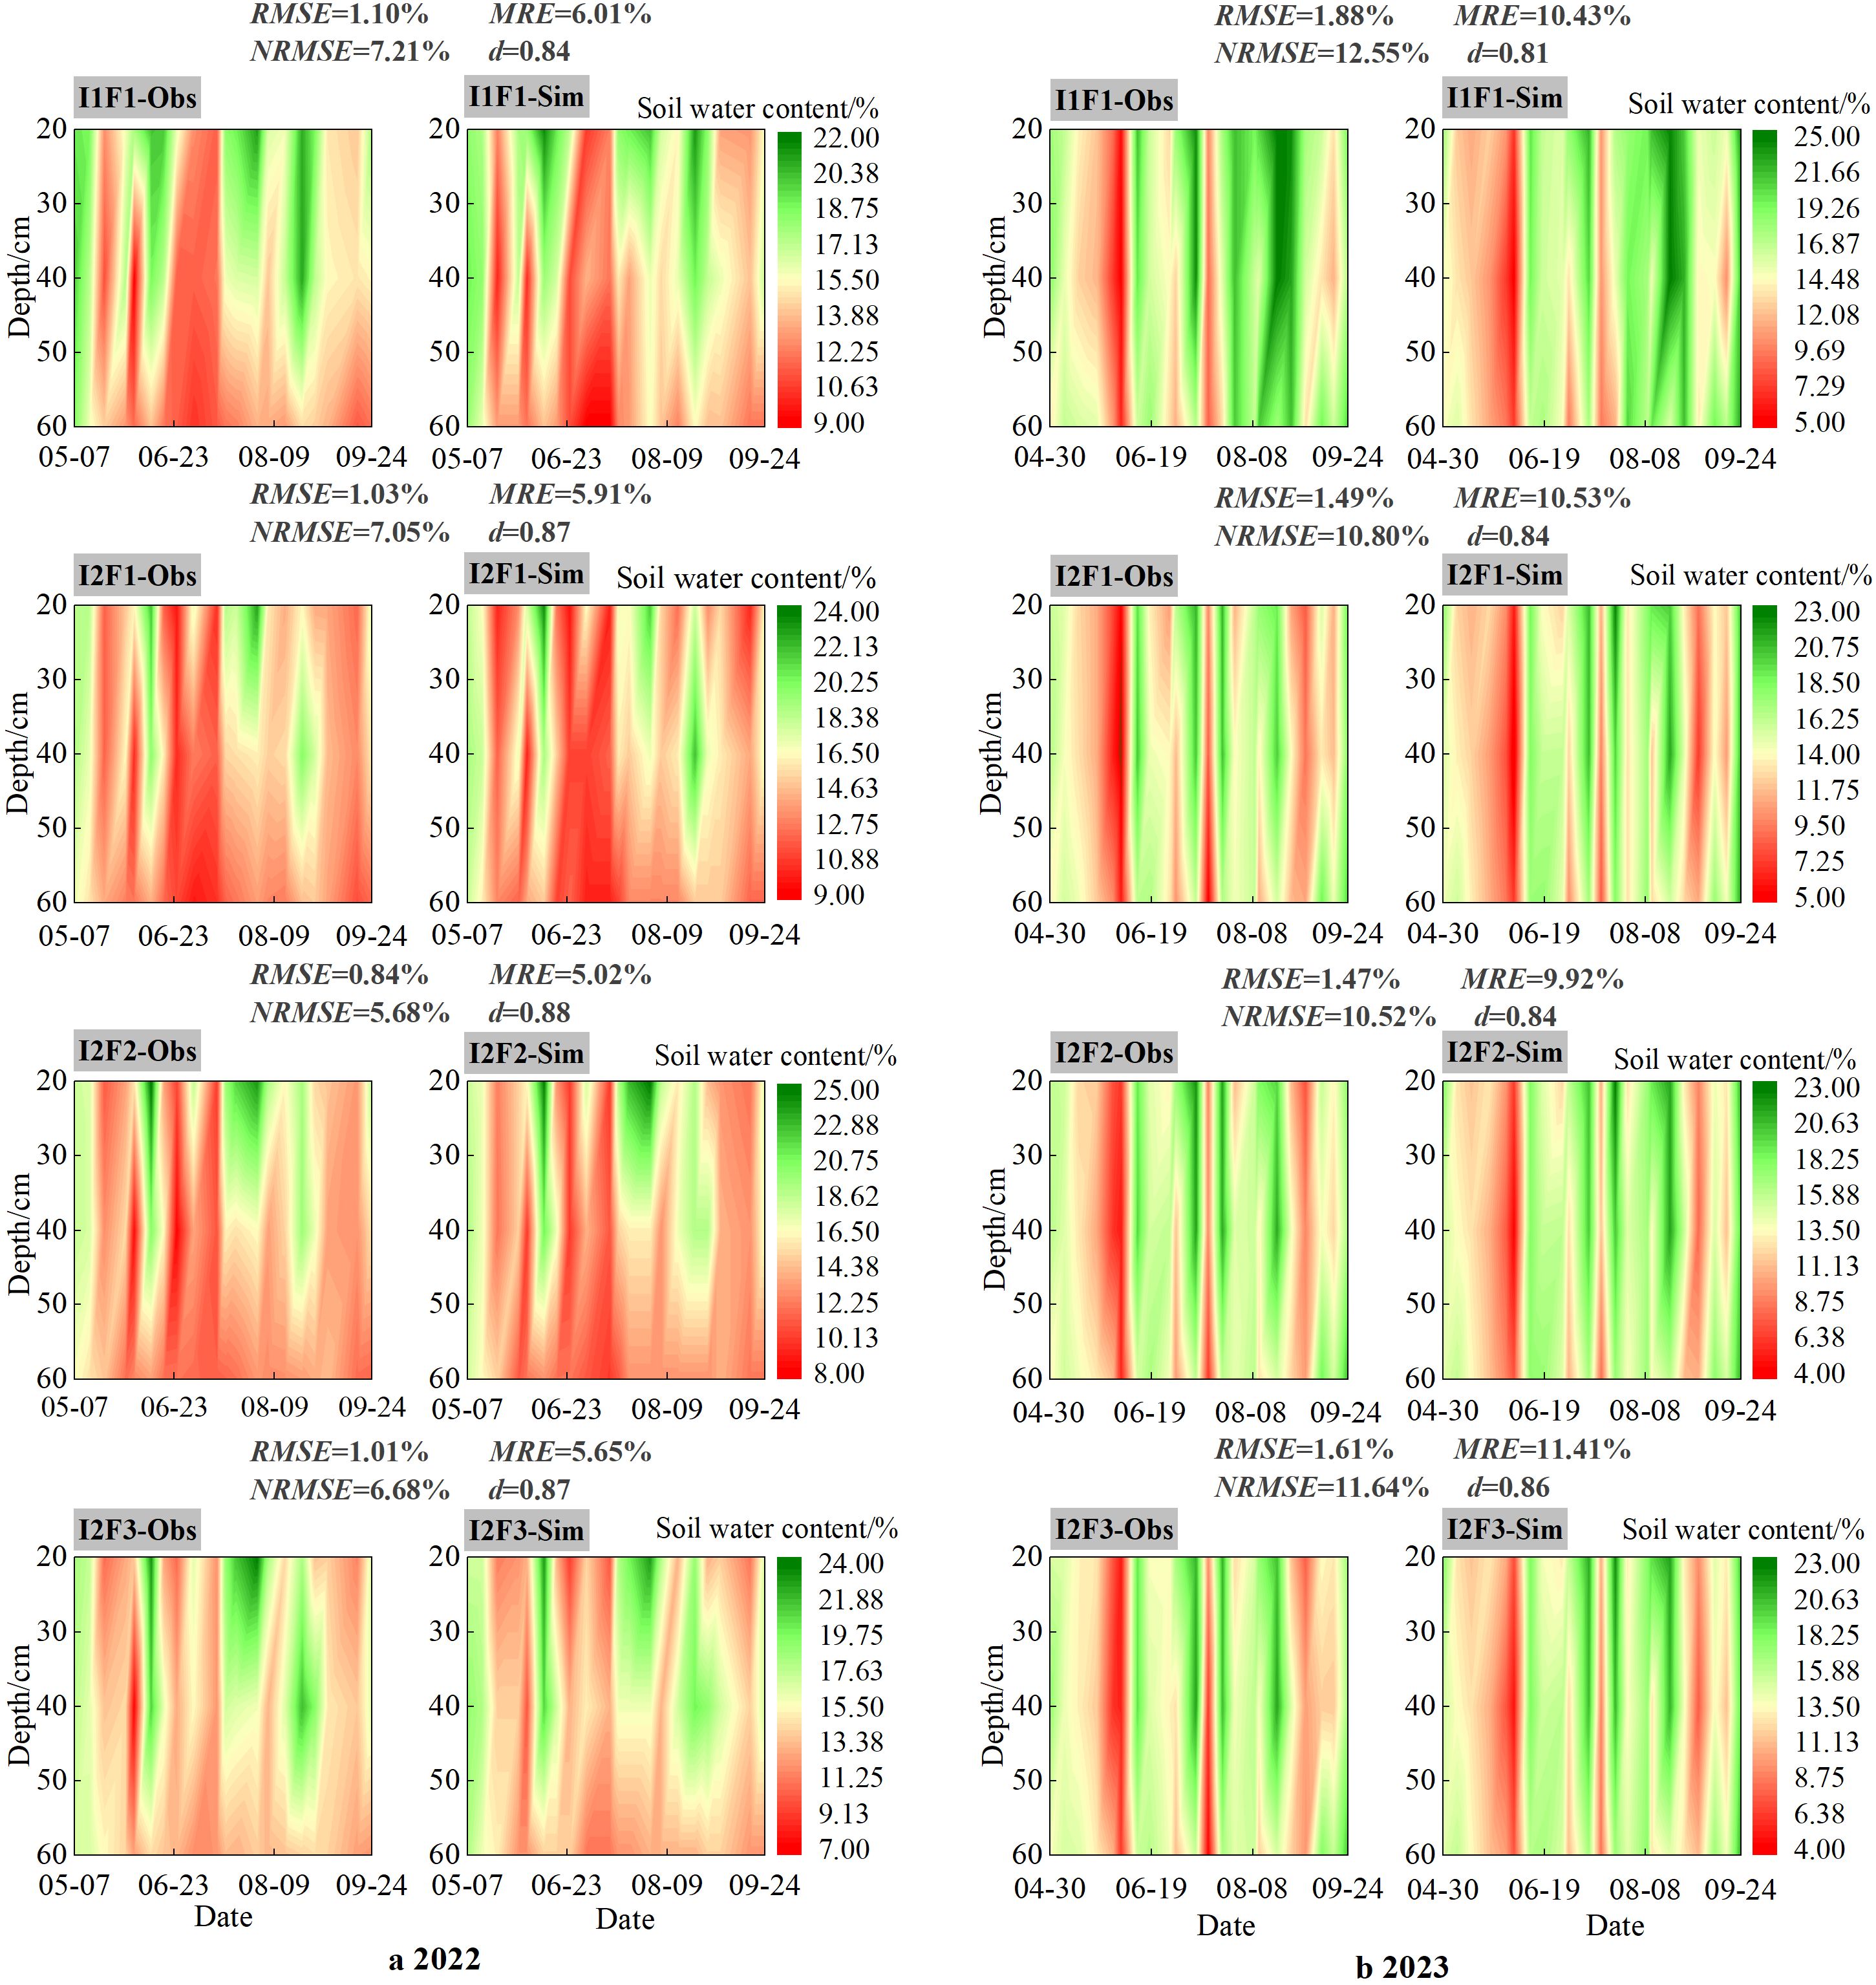
Figure 4. Contour maps of observed and simulated soil water content (SWC) at 0–60-cm depth under four treatments during the growth period of spring maize in 2022 (a) and 2023 (b). Note: I1F1, I2F1, I2F2, and I2F3 stand for adequate irrigation and traditional fertilizer, irrigation stress and traditional fertilizer, irrigation stress and traditional fertilizer reduction, and irrigation stress and traditional fertilizer reduction plus organic fertilizer, respectively. RMSE is root mean squared error, NRMSE is normalized root mean squared error, MRE is mean relative error, and d is consistency index.
The RMSE values of SWC in the 0–60-cm soil layer under the four treatments were in the range of 0.84%–1.10% and 1.47%–1.88% in 2022 and 2023, respectively. The NRMSE and MRE values for the 0–60-cm layer were below 15.00% in 2022 and 2023. The calibrated d values of the simulated SWC were 0.84, 0.87, 0.88, and 0.87 under the four treatments for the 0–60-cm layers in 2022. Meanwhile, the validated d values of simulated SWC were greater than 0.80 under the four treatments in 2023 of the spring maize growth period. Overall, the RZWQM2 showed good applicability in simulating spring maize SWC in this region.
3.2 Model calibration and validation of soil water content and crop growth of biomass
Across both calibration (2022) and validation (2023) phases, spring maize biomass values obtained through field measurements and model simulations exhibited congruent incremental patterns during the entire growth cycle under four experimental treatments, demonstrating strong consistency between simulated and observed crop parameters (Figure 5). Maize biomass showed a trend of cumulative increase as fertility advances, with biomass values peaking at the end of the growth period.
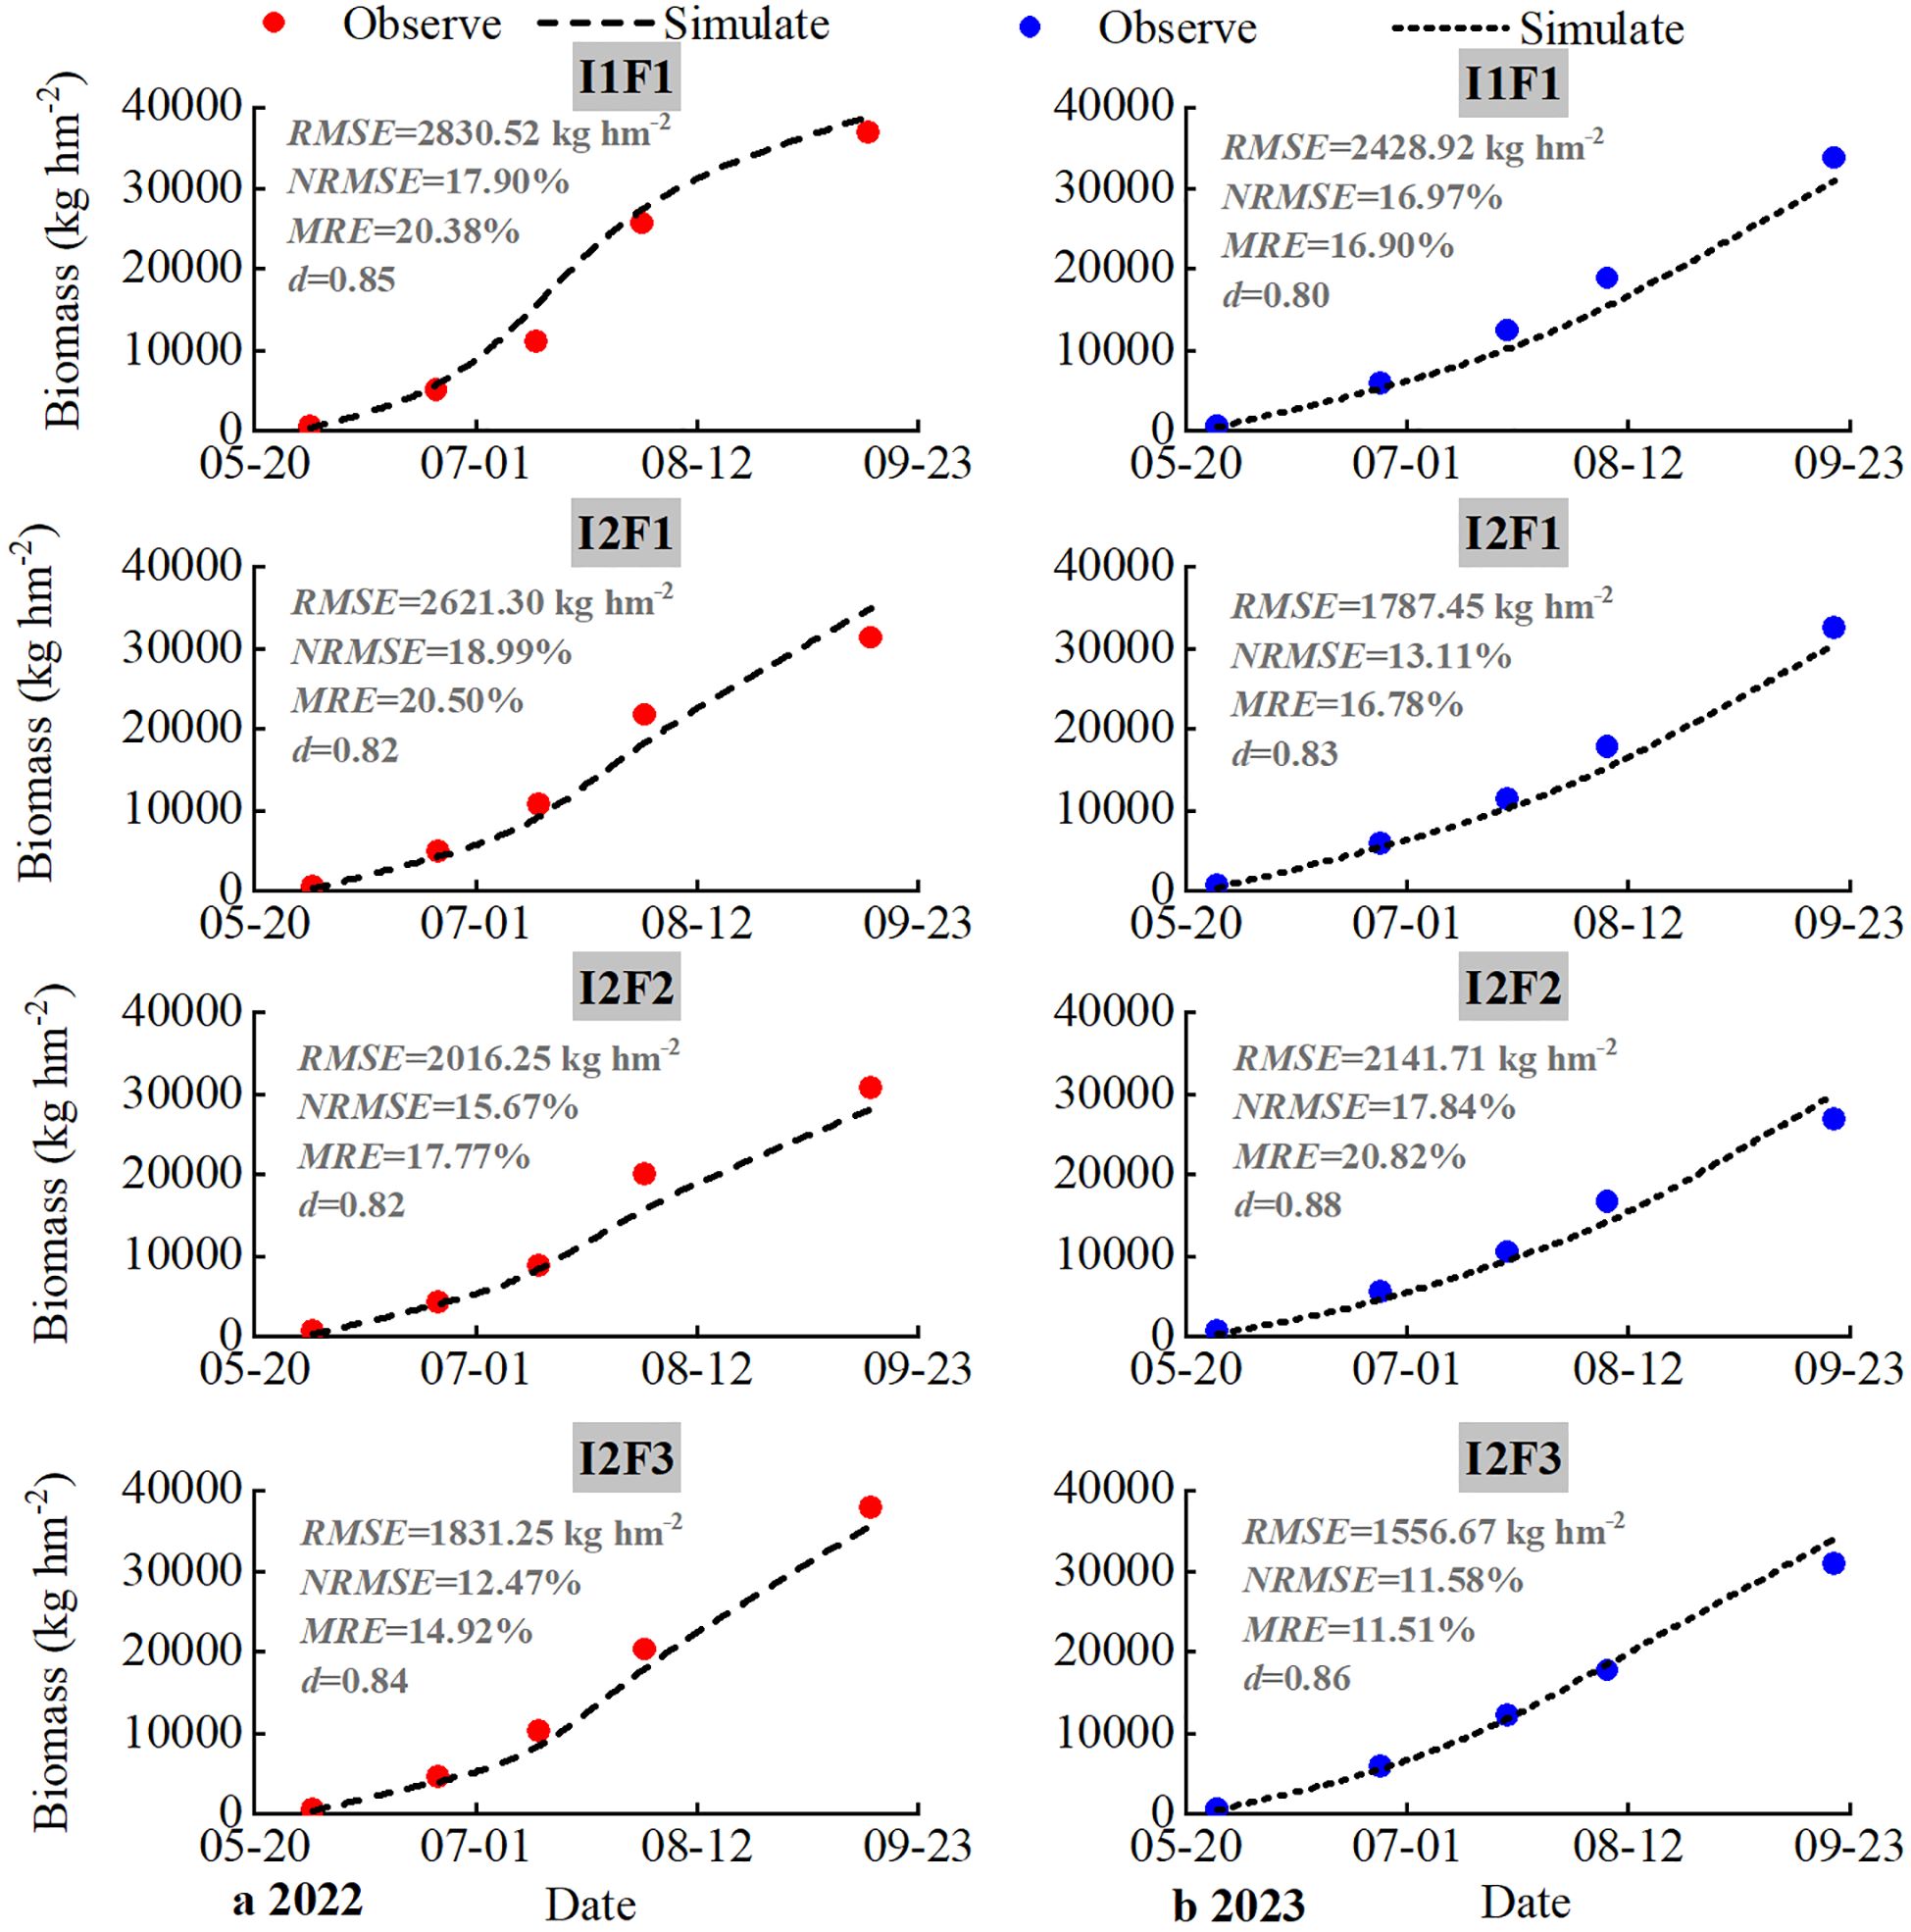
Figure 5. Comparison between observed and simulated biomass under different treatments during the growth period of spring maize in 2022 (a) and 2023 (b). I1F1, I2F1, I2F2, and I2F3 stand for adequate irrigation and nitrogen fertilizer, irrigation stress and nitrogen fertilizer, irrigation stress and nitrogen fertilizer reduction, and irrigation stress and nitrogen fertilizer reduction plus organic fertilizer, respectively. RMSE is root mean squared error, NRMSE is normalized root mean squared error, MRE is mean relative error, and d is consistency index.
The simulated results of spring maize biomass under the four treatments’ RMSE, NRMSE, MRE, and d values were in the range of 1,831.25–2,830.52 kg hm−2, 12.47%–18.99%, 14.92%–20.50%, and 0.82–0.85, respectively, in the calibration period (2022). The simulated results of spring maize biomass under the four treatments’ NRMSE and MRE values were maize biomass simulations that resulted in NRMSE and MRE values less than 20% and d values greater than 0.80 in the validation period (2022). For spring maize biomass, the simulated biomass dynamics for four treatments by the RZWQM2 were consistent with their observed values during the whole growth seasons. Overall, for the spring maize biomass data, the simulated results acceptably matched the observed values, suggesting that the RZWQM2 could be used to accurately describe the crop growth processes under the irrigation and fertilizer conditions.
3.3 Model calibration and validation of spring maize grain yield
Figure 6 illustrates the spring maize grain yield trends and the results of observed and simulated values under the four treatments in 2022 and 2023. Under the I2F3 treatment, observed spring maize grain yields were higher than those under the I1F1 treatment, and the simulated values showed consistent results in both 2022 and 2023. However, there was no significant difference in yield between the I1F1 and I2F3 treatments (p > 0.05). Both observed and simulated spring maize drain yield values under the I2F1, I2F2, and I2F3 treatments generally showed an upward trend in both 2022 and 2023. Compared with the I1F1 treatment, observed spring maize grain yield under the I2F3 treatment significantly increased by 16.25% and 16.05% in 2022 and 2023 (p < 0.05), respectively. The RMSE and MRE values for four treatments of spring maize grain yield simulated were better in the RZWQM2 in 2022 and 2023 (Figure 6). In 2022 and 2023, the simulated results of spring maize grain yield under the four treatments’ RMSE and MRE values were in the range of 1.12–2.47 t hm−2 and 6.27%–12.31%, and 1.05–1.42 t hm−2 and 5.28%–6.98%, respectively. These results indicate that the RZWQM2 could better simulate the variation in spring maize grain yield.
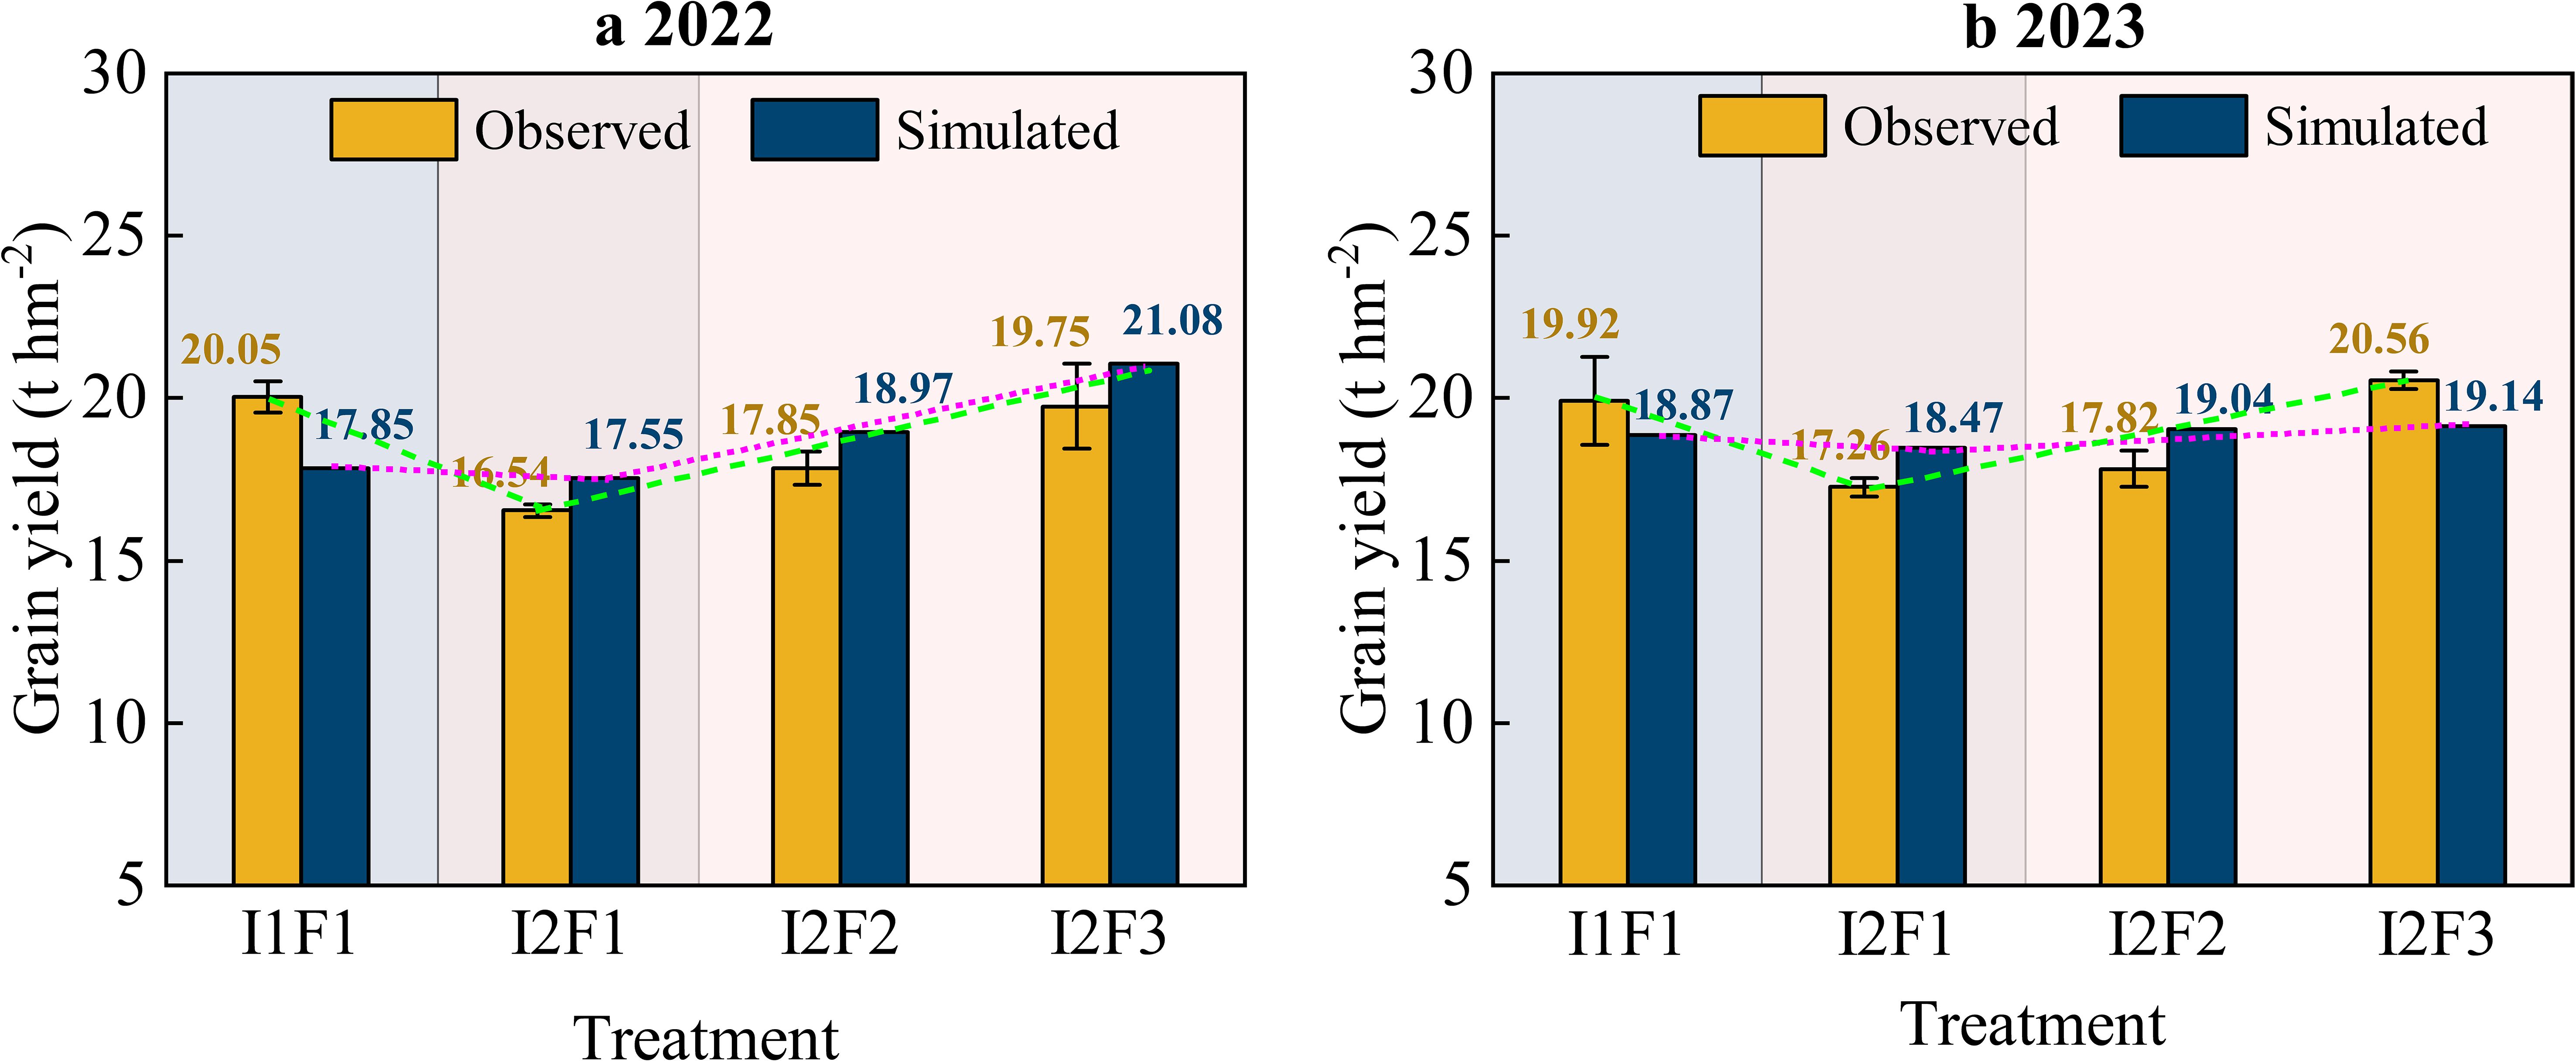
Figure 6. Comparison between observed and simulated grain yield under different treatments of spring maize in 2022 (a) and 2023 (b). Error bars indicate standard deviation (p < 0.05). Note: I1F1, I2F1, I2F2, and I2F3 stand for adequate irrigation and nitrogen fertilizer, irrigation stress and nitrogen fertilizer, irrigation stress and nitrogen fertilizer reduction, and irrigation stress and nitrogen fertilizer reduction plus organic fertilizer, respectively.
3.4 Model calibration and validation of soil NH4+-N and NO3−-N dynamics
Simulated soil NH4+-N and NO3−-N contents over time generally followed the observed values at the four treatments’ soil depths (0–20, 20–40, and 40–60 cm) for the calibration (2022) and validation data (2023) (Figure 7). Dynamics in simulated soil NH4+-N and NO3−-N contents in different soil depths during the growth period of spring maize under the four treatments were consistent with the simulated trend in 2022 and 2023. The soil NH4+-N and NO3−-N contents at different soil depths under all four treatments were 0–20 cm > 20–40 cm > 40–60 cm of spring maize growth period in 2022 and 2023. The observed values of soil NH4+-N and NO3−-N contents of I1F1, I2F1, I2F2, and I2F3 were not significantly different between treatments (p > 0.05) in 2023. Compared with the I2F2 treatment, the I1F1, I2F1, and I2F3 treatments significantly increased average soil NH4+-N content (0–20, 20–40, and 40–60 cm) by 21.59%, 20.51%, and 24.23% in 2022 (p < 0.05), respectively. Compared with the I2F2 treatment, the I1F1, I2F1, and I2F3 treatments significantly increased average soil NO3−-N content (0–20, 20–40, and 40–60 cm) by 29.61%, 23.53%, and 27.26% in 2022 (p < 0.05), respectively.
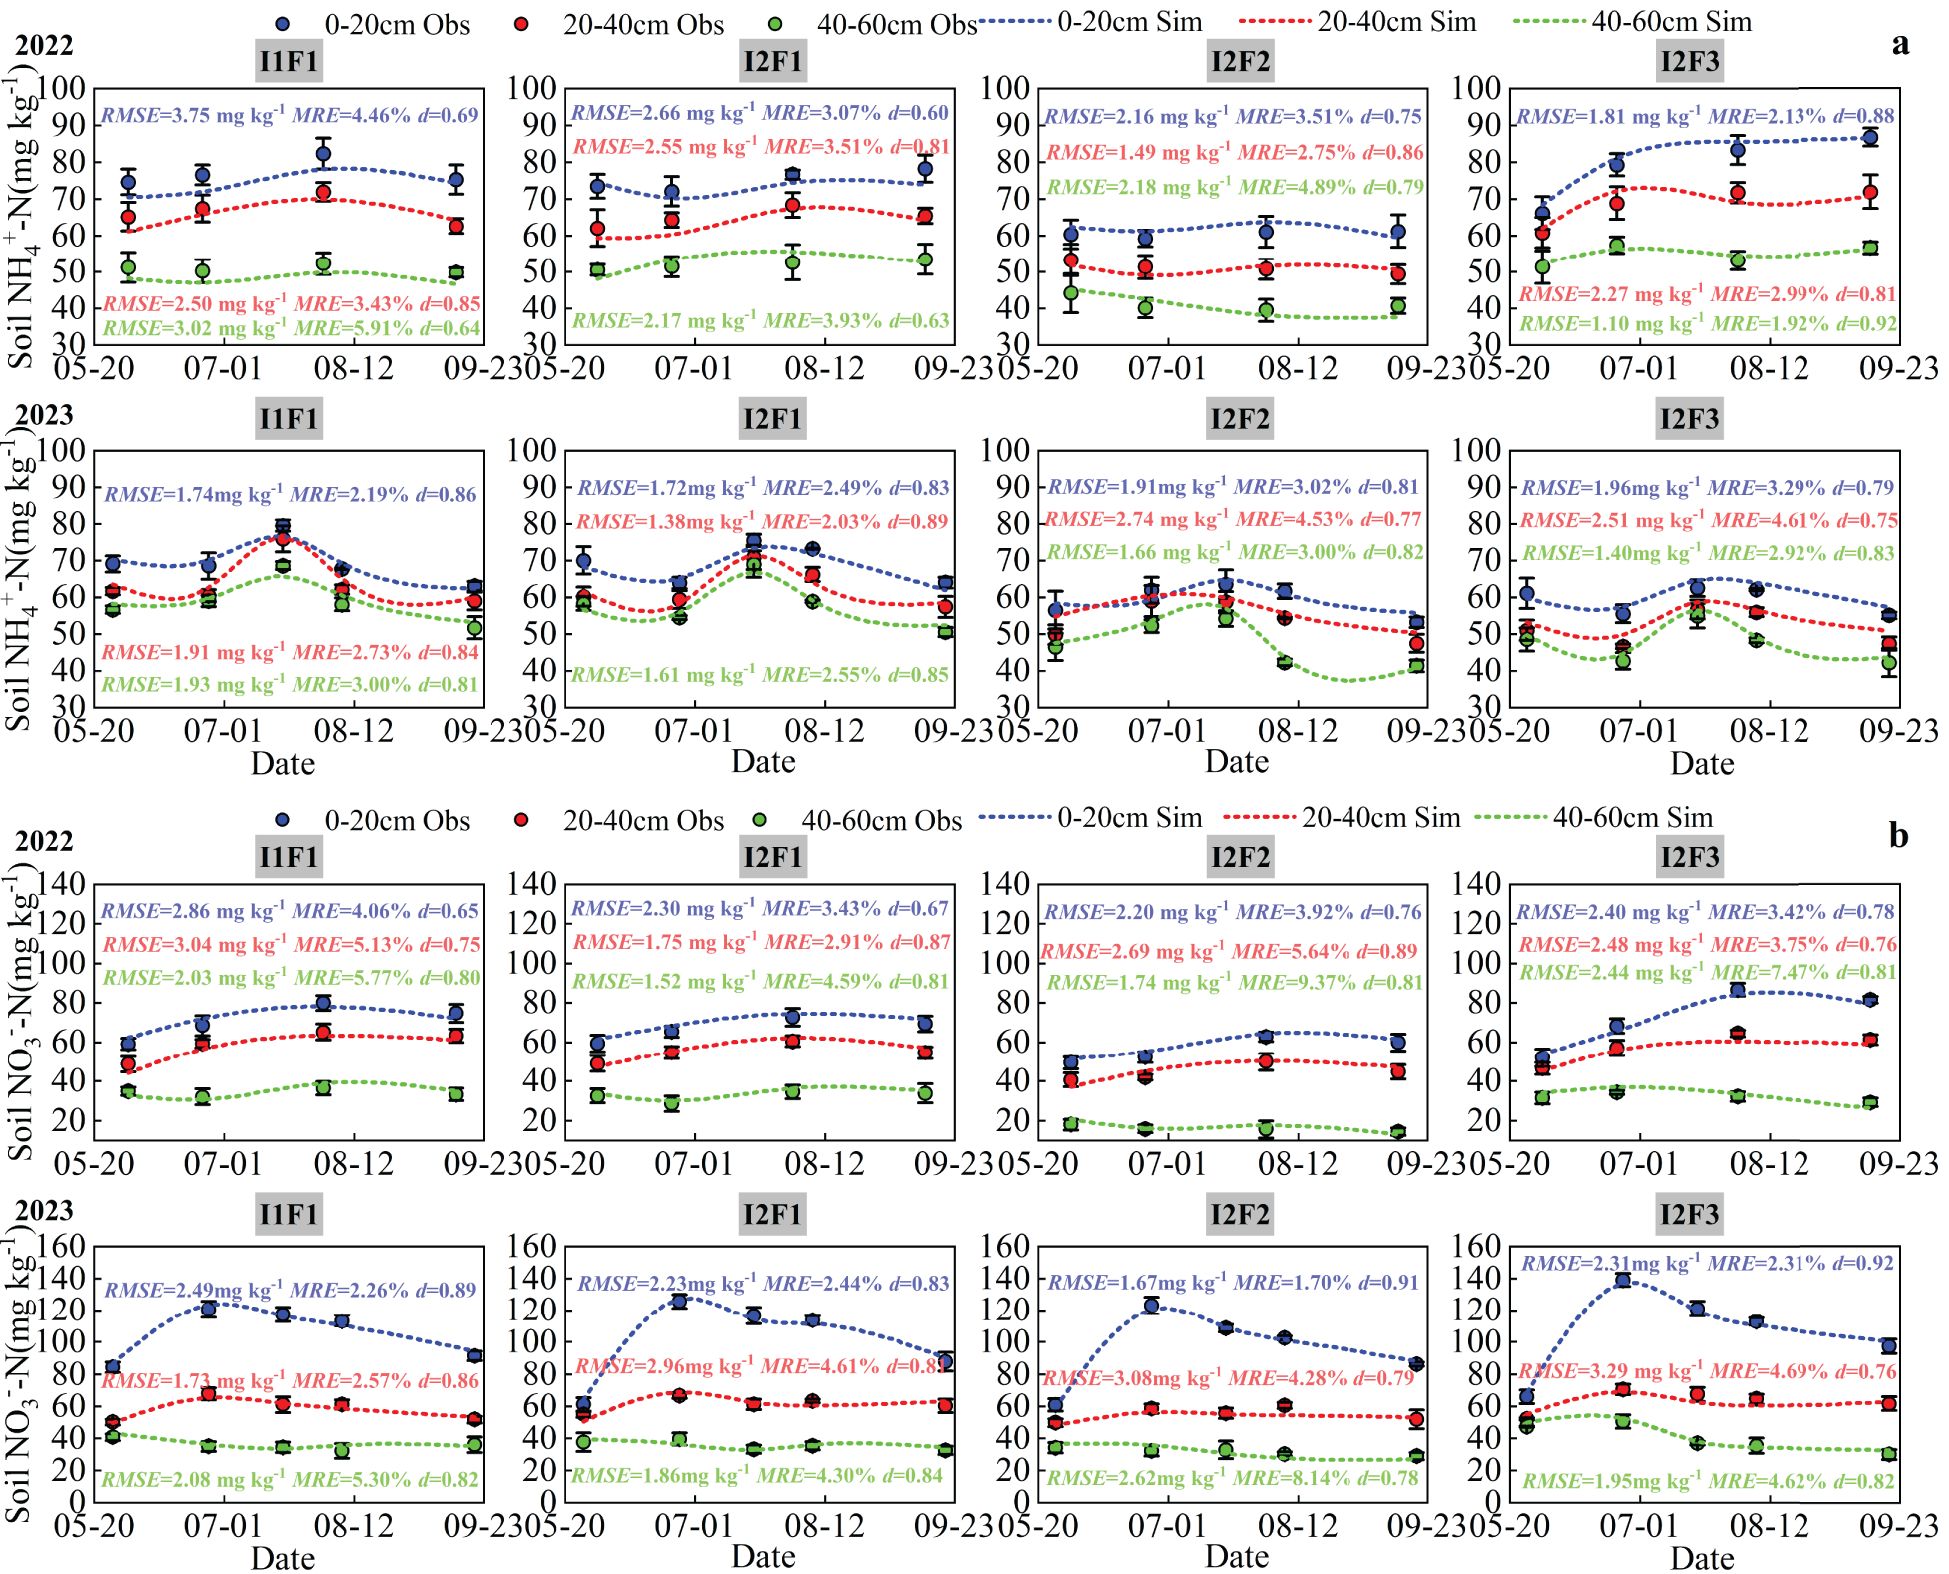
Figure 7. Comparison between observed and simulated soil NH4+-N(a) and NO3−-N(b) contents under different treatments of spring maize in 2022 and 2023. Error bars indicate standard deviation (p < 0.05). I1F1, I2F1, I2F2, and I2F3 stand for adequate irrigation and nitrogen fertilizer, irrigation stress and nitrogen fertilizer, irrigation stress and nitrogen fertilizer reduction, and irrigation stress and nitrogen fertilizer reduction plus organic fertilizer, respectively. RMSE is root mean squared error, MRE is mean relative error, and d is consistency index.
For simulated soil NH4+-N and NO3−-N contents in each soil layer, the RMSE values were between 1.10 and 3.75 mg kg−1, the MRE values were between 1.92% and 4.89%, the NRMSE values were between 2.01% and 5.93%, and the d values were between 0.60 and 0.92 under the four treatments in 2022. The mean RMSE, MRE, NRMSE, and d values of the NH4+-N and NO3−-N content simulations across the four treatments were 2.00 mg kg−1, 2.46%, 2.50%, and 0.86 in the 0–20-cm soil layer, respectively, in spring maize growth period. The values in the 0–20-cm soil layer were 2.45 mg kg−1, 3.76%, 4.21%, and 0.83, respectively. The values in the 20–40-cm soil layer were 1.89 mg kg−1, 4.23%, 4.59%, and 0.82, respectively. Overall, these results indicate that the simulation of NH4+-N and NO3−-N contents by the RZWQM2 model has better applicability during the growth period of spring maize in this study region.
3.5 Crop yield, water use efficiency, irrigation water use efficiency, and partial factor productivity under climate change scenarios (2009–2023)
Spring maize yield, WUE, IWUE, and PFP for different irrigation and fertilizer scenarios are shown in Figure 8. The yield, WUE, IWUE, and PFP showed an increasing trend and then a decreasing trend at the three different irrigation quotas. Spring maize yields showed maximum performance under the 60% nitrogen fertilizer and 40% organic fertilizer scenarios in three irrigation quotas (300, 250, and 200 m3 hm−2) of 21.45, 20.78, and 17.57 t hm−2, respectively. WUE values were greater under the T9 and T14 treatments at 4.56 and 4.67 kg m−3, respectively. The different irrigation and fertilizer treatments with simulated larger values of IWUE were T9, T14, and T15 with 5.96, 5.77, and 4.88 kg m−3, respectively. The PFP value was greater under the T4 and T9 treatments with 95.33 and 92.36 kg kg−1, respectively. In summary, the optimal irrigation and fertilizer coupling strategy for spring maize under climate change scenarios was an irrigation quota of 300 m3 hm−2 and 60% nitrogen fertilizer and 40% organic fertilizer (T9).
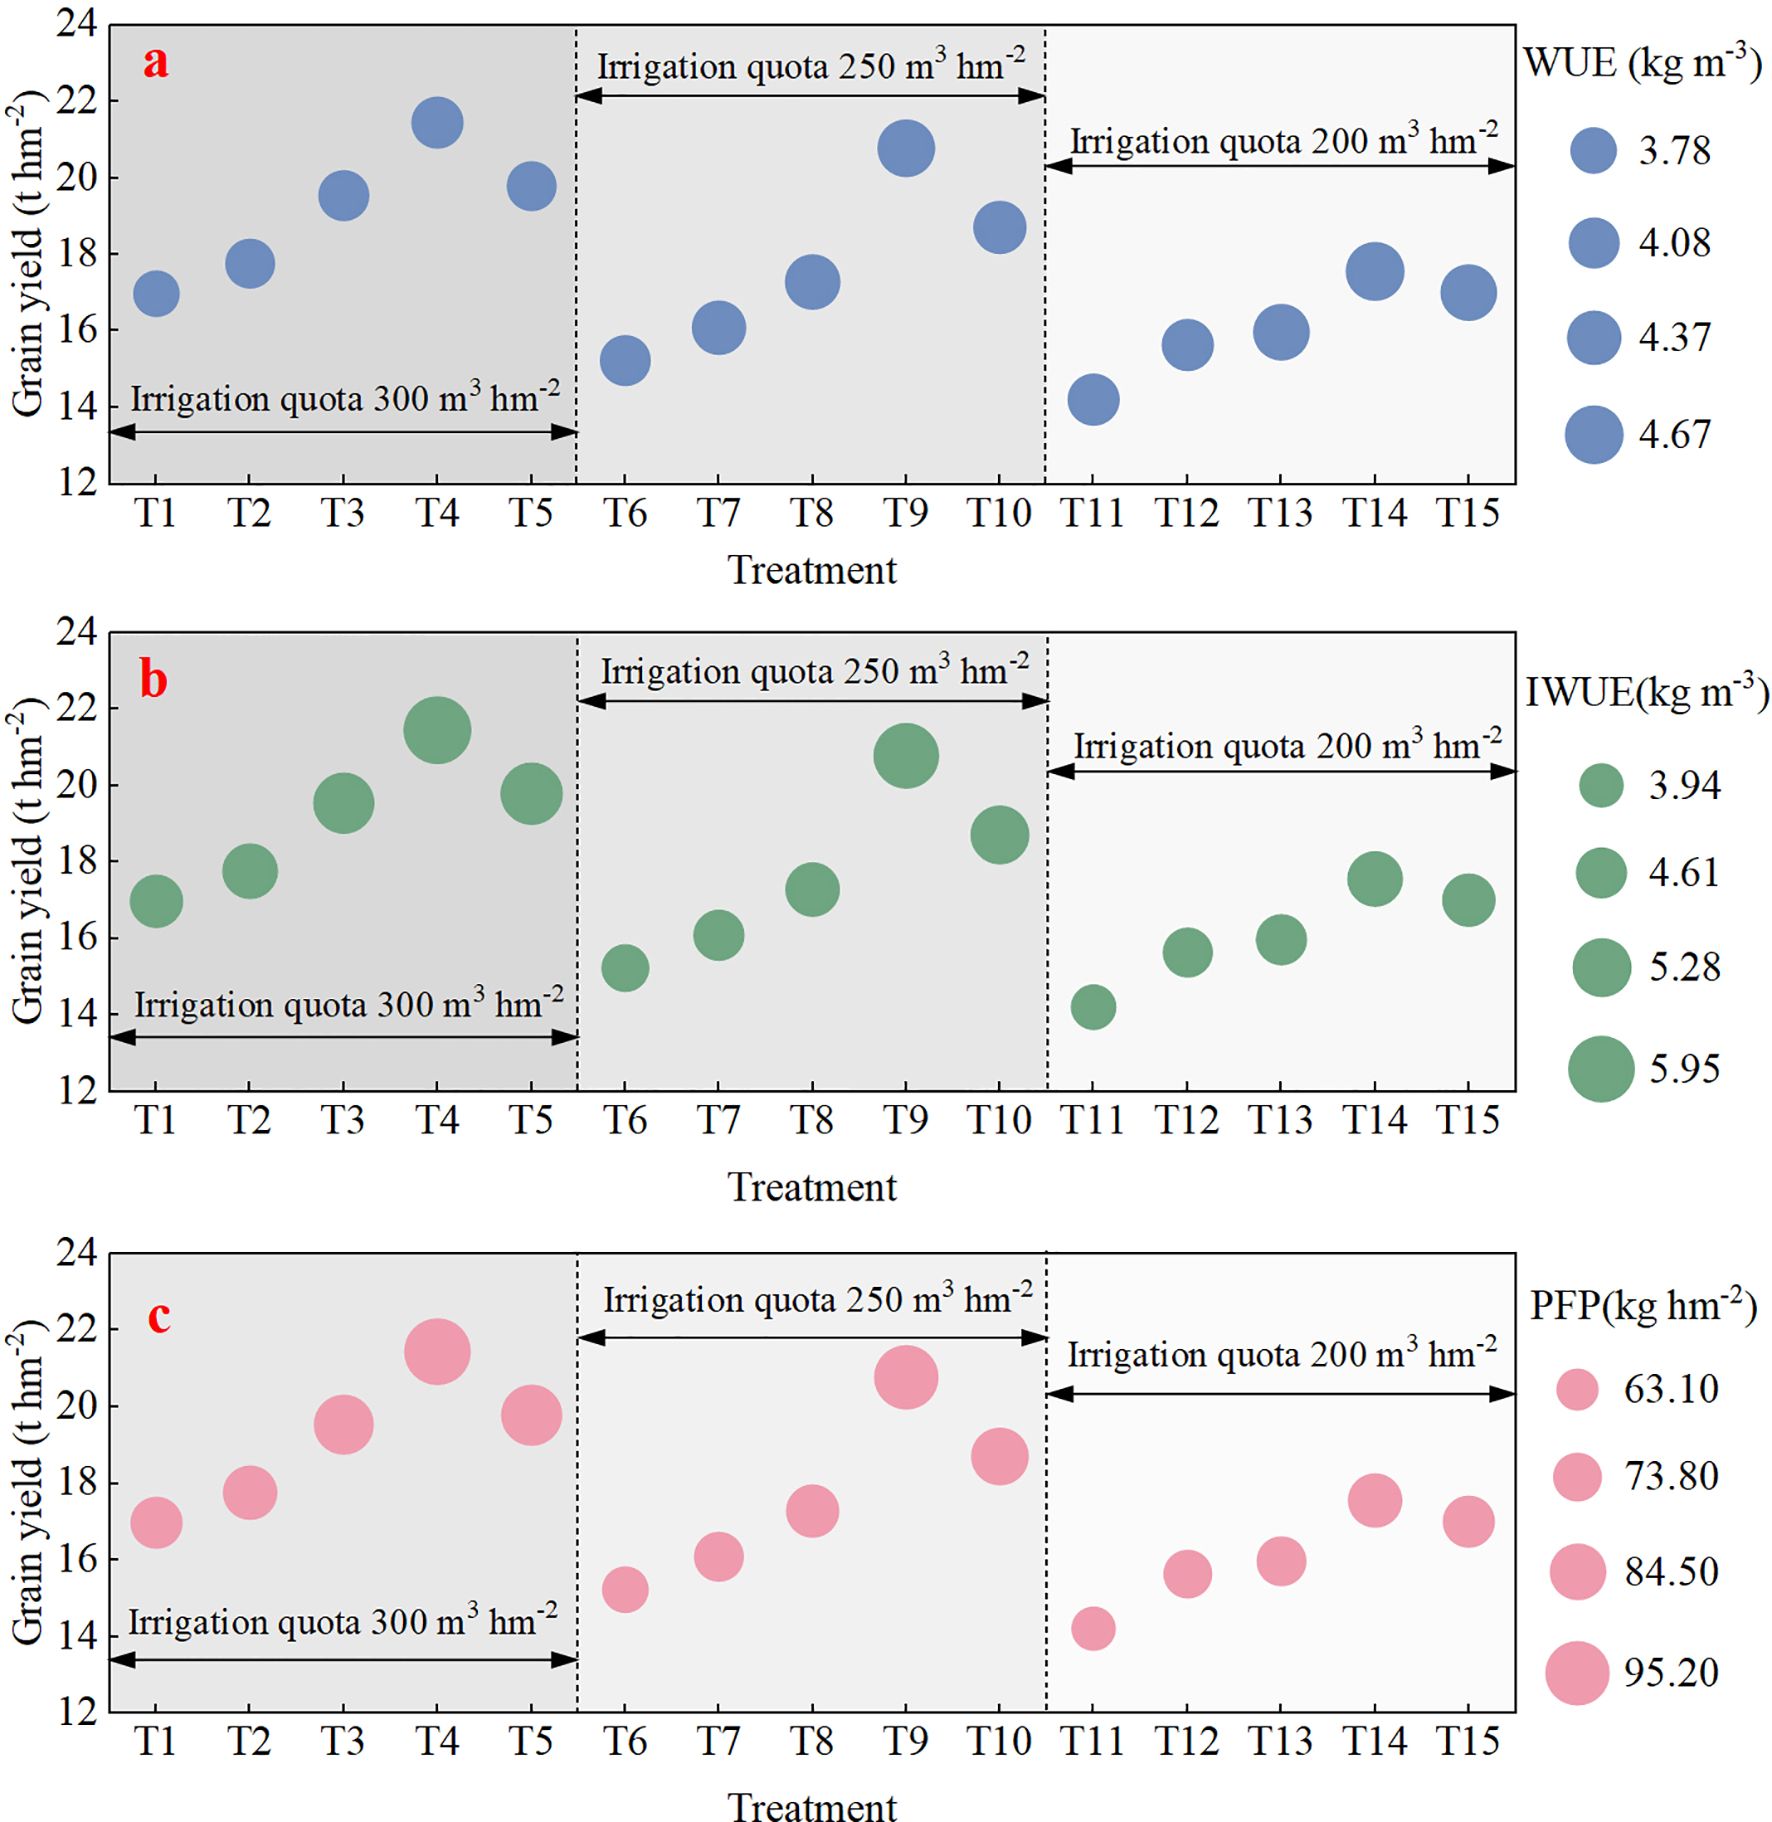
Figure 8. Spring maize yield, water use efficiency (WUE a), irrigation water use efficiency (IWUE b), and partial factor productivity (PFP c) under different combined water and fertilizer treatments in climate change scenarios. Treatments T1–T15 represent three irrigation quotas (300, 250, and 200 m3 hm−2) and five fertilizer applications (225 kg hm−2 organic fertilizer, 45 kg hm−2 nitrogen fertilizer and 180 kg hm−2 organic fertilizer, 90 kg hm−2 nitrogen fertilizer and 135 kg hm−2 organic fertilizer, 135 kg hm−2 nitrogen fertilizer and 90 kg hm−2 organic fertilizer, and 180 kg hm−2 nitrogen fertilizer and 45 kg hm−2 organic fertilizer).
4 Discussion
4.1 Model evaluation of soil water content, biomass, nitrate-N, ammonium-N, and grain yield in spring maize
In this study, the soil water content values of different soil layers (0–60 cm) were simulated to be consistent with observations, with MRE and NRMSE values less than 15% for all treatments and d values greater than 0.8 for both growth seasons (Figure 4). However, the model simulated lower values for full irrigation results than for the irrigation stress treatment. This is probably because the model has a warm-up process in the early stages of the simulation (Fang et al., 2013). Meanwhile, the results of the simulated values of soil water content were lower in the validation period (2023) than in the calibration period (2022), which may be attributed to the low simulation results due to the meteorological conditions in 2023 when the precipitation was lower than in 2022 (Ma et al., 2012).
In conclusion, the RZWQM2 model simulated spring maize grain yield (MRE values ranged from 5.28% to 12.31%) and aboveground biomass (MRE values ranged from 11.51% to 20.82%, with d-values greater than 0.85) better (Figure 6). Zhang et al. (2021) found that the calibrated RZWQM2 model was able to accurately simulate the yield and above-ground biomass of maize, and the simulation results with R2 ranged from 0.74 to 0.85, NRMSE < 15%. Sima et al. (2019) evaluated that the RZWQM2 model could provide a better simulation of the yield and biomass of irrigated maize in Eastern Colorado. This was similar to the results in this study where all d values of maize biomass were greater than 0.80 and maize yield MRE values were less than 10.00% as simulated by the RZWQM2 model. Therefore, it was further confirmed that the model has a better applicability for the simulation of maize yield and biomass.
The RZWQM2 model performed well for the fitting of NH4+-N and NO3−-N under different soil layers (0–20, 20–40, and 40–60 cm), with RMSE values less than 5.00 mg kg−1, MRE and NRMSE values less than 10%, and d values greater than 0.60 (Figure 7). Ding et al. (2020) used the RZWQM2 model for soil NH4+-N and NO3−-N contents for different tillage systems with consistency index d values ranging from 0.71 to 0.93. In this study, the fluctuation of nitrogen dynamics during the growth stage of maize was smaller in 2023 than in 2022 (Figure 7). This was probably because the precipitation was greater in 2022 (185.09 mm) than in 2023 (81.31 mm) during the spring maize growth period. The dynamics of NH4+-N and NO3−-N in different soil layers were strongly influenced by irrigation and rainfall (Sato et al., 2009; Allaire-Leung et al., 2001). Ding et al. (2024) also confirmed in their study that fluctuations in nitrogen content changes were greater in wet years than in dry years.
In summary, the calibrated RZWQM2 model performed well under different irrigation and fertilizer conditions, providing a promising tool for determining the optimal irrigation and fertilizer coupling for spring maize.
4.2 Optimization of spring maize irrigation quota and fertilizer application rate using the RZWQM2 model
In recent years, the continued warming of the climate has led to the expansion of the westerly wind belt, a progressively wetter climate, and a gradual trend toward increased precipitation (Li et al., 2024; Zheng et al., 2021). Sridevi et al. (2024) based on the DSSAT model enabled a 10% increase in maize yield to future temperature increases in climatic conditions and obtained an optimal fertilization program combining inorganic and organic fertilizers. In this study, similar results were obtained by increasing the temperature by 0.5°C to obtain an 18.08% higher maize yield. Ding et al. (2024) evaluated the optimal nitrogen fertilizer measurement for maize under different precipitation conditions through the RZWQM2 model and obtained higher maize growth, yield, and nitrogen fertilizer use efficiency, with future precipitation increased to 300 mm. In this study, the agronomic optimal irrigation–fertilization regime was determined through a multi-criterion assessment integrating grain yield maximization with improvements in WUE, irrigation water use efficiency (IWUE), and partial factor productivity (PFP) (Figure 8a–c). However, the partial factor productivity value was higher at 95.33 kg kg−1 when the irrigation gradient was 300 m3 hm−2 fertilized with 60% nitrogen and 40% organic fertilizers, but reduced the WUE (4.18 kg m−3) and IWUE (71.50 kg m−3) (Figure 8a). In addition, when the irrigation gradient was 200 m3 hm−2 and the fertilizer was 60% nitrogen and 40% organic fertilizers, WUE (4.67 kg m−3) and IWUE (4.88 kg m−3) improved but PFE (78.09 kg kg−1) severely reduced (Figures 8b,c), and the probable reason was excessive water stress while reducing nitrogen leaching, inhibiting plant uptake (Laskari et al., 2022; Liao et al., 2022).
Meanwhile, previous studies have shown that the optimal inorganic-to-organic fertilizer ratio for maximizing maize yield is 3:2 (Zhou et al., 2021), which is consistent with the results of this study. The main reason is that a moderate reduction of nitrogen fertilizer can reduce nitrogen leaching, while a moderate increase in organic fertilizer can effectively enhance soil fertility (Han, 2022) and promote crop root growth to increase the root–shoot ratio (Wei et al., 2023), thereby enhancing crop yield. In conclusion, the optimum fertilizer rates for spring maize in this study area were 135 kg hm−2 nitrogen fertilizer and 90 kg hm−2 organic fertilizer. The results of combining nitrogen fertilizers were similar to those of Han (2022). In Han’s study, the 40% organic fertilizer replacement treatment had higher yields than the 50% organic fertilizer replacement and 60% organic fertilizer replacement treatments.
This study mainly focused on the semi-arid region with the objective of obtaining high-yielding and efficient spring maize, which resulted in certain shortcomings such as the neglect of the soil texture, changes in soil physicochemical properties, and the impact of economic efficiency on irrigation and fertilizer. Therefore, to determine the optimal irrigation quota and fertilizer application rate for maize, further studies should comprehensively consider the impacts of the soil environment, economic benefits, and ecological benefits.
5 Conclusion
In this study, the RZWQM2 model was calibrated and validated using observed data of soil water content, soil NH4+-N and NO3−-N contents, biomass, and grain yield from 2022 and 2023. Then, it was applied for scenario analysis considering climate change during 2009–2023, irrigation, and fertilizer rates. Results determined four soil parameters and six crop parameters for “Tong Kang DK818” spring maize in the RZWQM2 model. The model’s accuracy in simulating soil water content, maize biomass, N content, and grain yield was validated through calibration (2022) and validation (2023). The simulation accuracy of soil water content, soil NH4+-N and NO3−-N contents, spring maize biomass, and grain yield were satisfactory, as indicated by the RMSE, NRMSE, MRE, and d values for both 2022 and 2023. The calibrated RZWQM2 model was then used to determine optimal irrigation and fertilizer application rates for spring maize using 15 years of historical weather data. Simulation results showed that an irrigation quota of 300 m3 hm−2 combined with 60% nitrogen fertilizer and 40% organic fertilizer (135 + 90 kg hm−2 of T9 treatment) could achieve high grain yield, WUE, IWUE, and PFP. These results contribute to the development of a scientific irrigation and fertilizer management system for achieving high yield and high resource use efficiency in the spring maize production of the semi-arid region.
Data availability statement
The original contributions presented in the study are included in the article/supplementary material. Further inquiries can be directed to the corresponding author.
Author contributions
HZ: Data curation, Writing – original draft, Writing – review & editing. RZ: Funding acquisition, Project administration, Writing – review & editing. LS: Data curation, Writing – review & editing. HL: Software, Writing – review & editing. YX: Methodology, Writing – review & editing. XZ: Data curation, Writing – review & editing. JL: Data curation, Writing – review & editing. CY: Data curation, Writing – review & editing.
Funding
The author(s) declare that financial support was received for the research and/or publication of this article. This research was supported by the Water Resources Science Experimental Research and Technology Promotion Program Project of Gansu Province (23GSLK047), the Science and Technology Program of Minqin County (24WWLK011), the Science and Technology Bureau talent introduction cultivation special project of Zhangye City (ZY2024RC07), Gansu Province Water Resources Science Experimental Research and Technology Promotion Program (25GSLK080), and the Project of “Innovation Star” for Excellent Graduate Students in Gansu Province (2025CXZX-793).
Acknowledgments
We thank the Water Resources Science Experimental Research and Technology Promotion Program Project of Gansu Province (23GSLK047), the Science and Technology Program of Minqin County (24WWLK011), the Science and Technology Bureau talent introduction cultivation special project of Zhangye City (ZY2024RC07), Gansu Province Water Resources Science Experimental Research and Technology Promotion Program (25GSLK080), and the Project of “Innovation Star” for Excellent Graduate Students in Gansu Province (2025CXZX-793) for funding.
Conflict of interest
The authors declare that the research was conducted in the absence of any commercial or financial relationships that could be construed as a potential conflict of interest.
Generative AI statement
The author(s) declare that no Generative AI was used in the creation of this manuscript.
Publisher’s note
All claims expressed in this article are solely those of the authors and do not necessarily represent those of their affiliated organizations, or those of the publisher, the editors and the reviewers. Any product that may be evaluated in this article, or claim that may be made by its manufacturer, is not guaranteed or endorsed by the publisher.
References
Ahuja, L. R., Rojas, K. W., Hanson, J. D., Shaffer, M. J., and Ma, L. (2000). Root Zone Water Quality Model (Highlands Ranch, CO: Water Resources Publications, LLC).
Allaire-Leung, S. E., Wu, L., Mitchell, J. P., and Sanden, B. L. (2001). Nitrate leaching and soil nitrate content as affected by irrigation uniformity in a carrot field. Agric. Water Manage. 48, 37–50. doi: 10.1016/S0378-3774(00)00112-8
Baharuddin, A. B. and Tejowulan, R. S. (2021). “Improving Maize (Zea mays L.) growth and yield by the application of inorganic and organic fertilizers plus,” in IOP Conference Series: Earth and Environmental Science, vol. 712. (IOP Publishing), 012027. doi: 10.1088/1755-1315/712/1/012027
Bassu, S., Brisson, N., Durand, J. L., Boote, K., Lizaso, J., Jones, J. W., et al. (2014). How do various maize crop models vary in their responses to climate change factors? Global Change Biol. 20, 2301–2320. doi: 10.1111/gcb.12520
Chen, C., Zhou, G. S., and Pang, Y. M. (2015). Impacts of climate change on maize and winter wheat yields in China from 1961 to 2010 based on provincial data. J. Agric. Sci. 153, 825–836. doi: 10.1017/S0021859614001154
Chen, X., Qi, Z., Gui, D., Gu, Z., Ma, L., Zeng, F., et al. (2019). Simulating impacts of climate change on cotton yield and water requirement using RZWQM2. Agric. Water Manage. 222, 231–241. doi: 10.1016/j.agwat.2019.05.030
Ding, J., Hu, W., Wu, J., Yang, Y., and Feng, H. (2020). Simulating the effects of conventional versus conservation tillage on soil water, nitrogen dynamics, and yield of winter wheat with RZWQM2. Agric. Water Manage. 230, 105956. doi: 10.1016/j.agwat.2019.105956
Ding, D., Yang, Z., Wu, L., Zhao, Y., Zhang, X., Chen, X., et al. (2024). Optimizing nitrogen-fertilizer management by using RZWQM2 with consideration of precipitation can enhance nitrogen utilization on the Loess Plateau. Agric. Water Manage. 299, 108890. doi: 10.1016/j.agwat.2024.108890
Fang, X., Ma, L., Yu, Q., Hu, S., Li, X., Malone, W., et al. (2013). Quantifying climate and management effects on regional crop yield and nitrogen leaching in the North China Plain. J. Environ. Qual. 42, 1466–1479. doi: 10.2134/jeq2013.03.0086
Fang, Q., Ma, L., Yu, Q., Malone, R. W., Saseendran, S. A., and Ahuja, L. R. (2008). Modeling nitrogen and water management effects in a wheat-maize double-cropping system. J. Environ. Qual. 37, 2232–2242. doi: 10.2134/jeq2007.0601
Gupta Hoshin, V., Sorooshian, S., and Yapo Patrice, O. (1999). Status of automatic calibration for hydrologic models: comparison with multilevel expert calibration. J. Hydrol. Eng. 4, 135–143. doi: 10.1061/(ASCE)1084-0699(1999)4:2(135
Han, B. (2022). Effect of combined organic and in organic application on nitrogen reduction and efficiency enhancement of summer maize in fluvo-aquic soil. Henan Agric. Univ. doi: 10.27117/d.cnki.ghenu.2022.000482
Harmsen, E. W. and Justiniano, S. T. (2016). “Reference evapotranspiration estimations using the penman-monteith method: Puerto Rico,” in Micro Irrigation Management (Apple Academic Press), 33–52.
He, H., Peng, M., Ru, S., Hou, Z., and Li, J. (2022). A suitable organic fertilizer substitution ratio could improve maize yield and soil fertility with low pollution risk. Front. Plant Sci. 13. doi: 10.3389/fpls.2022.988663
Hong, S., Jiao, F., Kuang, N., Liu, C., Ma, Y., and Li, Q. (2021). Simulating the effects of irrigation and tillage on soil water, evapotranspiration, and yield of winter wheat with RZWQM2. Soil Till. Res. 214, 105170. doi: 10.1016/j.still.2021.105170
Ilahi, H., Hidayat, K., Adnan, M., Rehman, F. U., Tahir, R., Saeed, M. S., et al. (2020). Accentuating the impact of inorganic and organic fertilizers on agriculture crop production: A review. Ind. J. Pure App. Biosci. 9, 36–45. doi: 10.18782/2582-2845.8546
Jamieson, P. D., Porter, J. R., and Wilson, D. R. (1991). A test of the computer simulation model ARCWHEAT1 on wheat crops grown in New Zealand. Field Crop Res. 27, 337–350. doi: 10.1016/0378-4290(91)90040-3
Jiang, Q., Qi, Z., Madramootoo, C. A., Smith, W., Abbasi, N. A., and Zhang, T. (2020). Comparison of RZWQM2 and DNDC models to simulate greenhouse gas emissions under combined inorganic/organic fertilization in a subsurface-drained field. Trans. ASABE. 63, 771–787. doi: 10.13031/trans.13668
Kang, Y., Ma, X., and Khan, S. (2014). Predicting climate change impacts on maize crop productivity and water use efficiency in the loess plateau. Irrigation Drainage. 63, 394–404. doi: 10.1002/ird.1799
Laskari, M., Menexes, G., Kalfas, I., Gatzolis, I., and Dordas, C. (2022). Water stress effects on the morphological, physiological characteristics of maize (Zea mays L.), and on environmental cost. Agronomy 12, 2386. doi: 10.3390/agronomy12102386
Li, C., Wang, C., Wen, X., Qin, X., Liu, Y., Han, J., et al. (2017). Ridge–furrow with plastic film mulching practice improves maize productivity and resource use efficiency under the wheat–maize double–cropping system in dry semi–humid areas. Field Crop Res. 203, 201–211. doi: 10.1016/j.fcr.2016.12.029
Li, Y., Zhang, Z., Zhou, X., Gao, M., Duan, J., Xue, Y., et al. (2024). Transformation and mechanisms of climate wet/dry change on the northern Tibetan Plateau under global warming: A perspective from paleoclimatology. Sci. China Earth Sci. 67, 1932–1951. doi: 10.1007/s11430-023-1260-6
Liao, Q., Ding, R., Du, T., Kang, S., Tong, L., and Li, S. (2022). Stomatal conductance drives variations of yield and water use of maize under water and nitrogen stress. Agric. Water Manage. 268, 107651. doi: 10.1016/j.agwat.2022.107651
Liu, H., Liu, Y., Zhang, L., Zhang, Z., and Gao, Z. (2019). Quantifying extreme climatic conditions for maize production using RZWQM in Siping, Northeast China. Int. J. Agr. Biol. Eng. 12, 111–122. doi: 10.25165/j.ijabe.20191202.3388
Liu, W. Z. and Zhang, X. C. (2007). Optimizing water and fertilizer input using an elasticity index: a case study with maize in the loess plateau of China. Field Crop Res. 100, 302–310. doi: 10.1016/j.fcr.2006.08.005
Liu, P., Zhao, H., Li, Y., Liu, Z., Gao, X., Zhang, Y., et al. (2018). Corn yields with organic and inorganic amendments under changing climate. Nutr. Cycl. Agroecosys. 111, 141–153. doi: 10.1007/s10705-018-9916-8
Ma, L., Hoogenboom, G., Ahuja, L., Ascough, J., and Saseendran, S. (2006). Evaluation of the RZWQM-CERES-Maize hybrid model for maize production. Agric. Syst. 87, 274–295. doi: 10.1016/j.agsy.2005.02.001
Ma, L., Malone, R. W., Heilman, P., Karlen, D. L., Kanwar, R. S., Cambardella, C. A., et al. (2007). RZWQM simulation of long-term crop production, water and nitrogen balances in Northeast Iowa. Geoderma 140, 247–259. doi: 10.1016/j.geoderma.2007.04.009
Ma, L., Ahuja, L. R., Nolan, B. T., Malone, R. W., Trout, T. J., and Qi, Z. (2012a). Root zone water quality model (RZWQM2): Model use, calibration, and validation. Trans. ASABE. 55, 1425–1446. doi: 10.13031/2013.42252
Ma, L., Trout, T. J., Ahuja, L. R., Bausch, W. C., Saseendran, S. A., Malone, R. W., et al. (2012b). Calibrating RZWQM2 model for maize responses to deficit irrigation. Agric. Water Manage. 103, 140–149. doi: 10.1016/j.agwat.2011.11.005
Matthews, R. B., Rivington, M., Muhammed, S., Newton, A. C., and Hallett, P. D. (2013). Adapting crops and cropping systems to future climates to ensure food security: The role of crop modelling. Glob. Food Secur. 2, 24–28. doi: 10.1016/j.gfs.2012.11.009
Moriasi, D. W., Gitau, M., Pai, N., and Daggupati, P. (2015). Hydrologic and water quality models: performance measures and evaluation criteria. Trans. ASABE. 58, 1763–1785. doi: 10.13031/trans.58.10715
Nash, J. E. and Sutcliffe, J. V. (1970). River flow forecasting through conceptual model. Part 1- A discussion of principles. J. Hydrol. 10, 282–290. doi: 10.1016/0022-1694(70)90255-6
Panda, R. K., Behera, S. K., and Kashyap, P. S. (2004). Effective management of irrigation water for maize under stressed conditions. Agric. Water Manage. 66, 181–203. doi: 10.1016/j.agwat.2003.12.001
Qi, Z., Ma, L., Helmers, M. J., Ahuja, L. R., and Malone, R. W. (2012). Simulating nitrate nitrogen concentration from a subsurface drainage system in response to nitrogen application rates using RZWQM2. J. Environ. Qual. 41, 289–295. doi: 10.2134/jeq2011.0195
Qiang, S., Zhang, Y., Fan, J., Zhang, F., Xiang, Y., Yan, S., et al. (2019). Maize yield, rainwater and nitrogen use efficiency as affected by maize genotypes and nitrogen rates on the Loess Plateau of China. Agric. Water Manage. 213, 996–1003. doi: 10.1016/j.agwat.2018.12.021
Sadhukhan, D., Qi, Z., Zhang, T. Q., Tan, C. S., and Ma, L. (2019b). Modeling and mitigating phosphorus losses from a tile-drained and manured field using RZWQM2-P. J. Environ. Qual. 48, 995–1005. doi: 10.2134/jeq2018.12.0424
Sadhukhan, D., Qi, Z., Zhang, T., Tan, C. S., Ma, L., and Andales, A. A. (2019a). Development and evaluation of a phosphorus (P) module in RZWQM2 for phosphorus management in agricultural fields. Environ. Model. Software 113, 48–58. doi: 10.1016/j.envsoft.2018.12.007
Sato, S., Morgan, K. T., Ozores-Hampton, M., and Simonne, E. H. (2009). Spatial and temporal distributions in sandy soils with seepage irrigation: I. Ammonium and nitrate. Soil Sci. Soc Am. J. 73, 1044–1052. doi: 10.2136/sssaj2008.0206
Shaffer, M. J., Rojas, K. W., DeCoursey, D. G., and Hebson, C. S. (1992). “Nutrient chemistry processes (OMNI),” in Root Zone Water Quality Model, Version 1.0, Technical Documentation. GPSR Tech. Rept. No. 2, p. 129-161. RZWQM Tea, USDA-ARS, Great Plains Systems Research Unit, Fort Collins, CO.
Sima, N. Q., Andales, A. A., Harmel, R. D., Ma, L., and Trout, T. J. (2019). Evaluating RZWQM2-CERES-Maize and water production functions for predicting irrigated maize yield and biomass in eastern Colorado. Trans. ASABE. 62, 213–223. doi: 10.13031/trans.13045
Singh, A., Bista, P., Deb, S. K., and Ghimire, R. (2025). Simulating cover crops impacts on soil water and nitrogen dynamics and silage yield in the semi-arid Southwestern United States. Agric. Water Manage. 307, 109246. doi: 10.1016/j.agwat.2024.109246
Sridevi, G., MS, S., Bhuvaneswari, K., and Surendran, U. (2024). Exploring the best nutrient management options for improving the maize yield for future climate change scenario with DSSAT crop simulation model in century old Permanent Manurial Experiment. J. Plant Nutr. 47(14), 2242–2256. doi: 10.1080/01904167.2024.2338759
Ureta, C., González, E. J., Espinosa, A., Trueba, A., Piñeyro-Nelson, A., and Álvarez-Buylla, E. R. (2020). Maize yield in Mexico under climate change. Agric. Syst. 177, 102697. doi: 10.1016/j.agsy.2019.102697
Wang, X., Ren, Y., Zhang, S., Chen, Y., and Wang, N. (2017). Applications of organic manure increased maize (Zea mays L.) yield and water productivity in a semi-arid region. Agric. Water Manage. 187, 88–98. doi: 10.1016/j.agwat.2017.03.017
Wei, L. C., Zhang, H. P., Wang, X. L., and Zhang, S. Q. (2023). Improved water use of the maize soil–root–shoot system under the integrated effects of organic manure and plant density. Agronomy 13, 1172. doi: 10.3390/agronomy13041172
Yang, Z., Hu, Y., Zhang, S., Raza, S., Wei, X., and Zhao, X. (2022). The thresholds and management of irrigation and fertilization earning yields and water use efficiency in maize, wheat, and rice in China: A meta-analysis (1990–2020). Agronomy 12, 709. doi: 10.3390/agronomy12030709
Zhai, L., Wang, Z., Zhai, Y., Zhang, L., Zheng, M., Yao, H., et al. (2022). Partial substitution of chemical fertilizer by organic fertilizer benefits grain yield, water use efficiency, and economic return of summer maize. Soil Till. Res. 217, 105287. doi: 10.1016/j.still.2021.105287
Zhang, Y., Lv, Y., Liao, Y., and Zhang, G. (2024). Effect of ridge–furrow with plastic film mulching system and different nitrogen fertilization rates on lodging resistance of spring maize in loess plateau China. Agronomy 14, 1298. doi: 10.3390/agronomy14061298
Zhang, H., Ma, L., Douglas-Mankin, K. R., Han, M., and Trout, T. J. (2021). Modeling maize production under growth stage-based deficit irrigation management with RZWQM2. Agric. Water Manage. 248, 106767. doi: 10.1016/j.agwat.2021.106767
Zhang, J., Wang, L., Cheng, G., and Jia, L. (2025). Characteristics of water supply and demand in an agroforestry ecosystem under long-term continuous cropping assessed using the RZWQM2 model. Agric. Water Manage. 307, 109245. doi: 10.1016/j.agwat.2024.109245
Zhang, H., Wang, J., Liu, M., Shen, Y., and Pei, H. (2023). Water budget of urban turf field and optimal irrigation schedule simulation in an ecotone between semi-humid and semi-arid regions, Northern China. Agronomy 13, 273. doi: 10.3390/agronomy13010273
Zhang, Q., Yang, J., Wang, W., Ma, P., Lu, G., Liu, X., et al. (2021). Climatic warming and humidification in the arid region of Northwest China: Multi-scale characteristics and impacts on ecological vegetation. J. Meteorol. Res. 35, 113–127. doi: 10.1007/s13351-021-0105-3
Zheng, S., Zhang, B., Peng, D., Yu, L., Lin, B., Pan, Y., et al. (2021). The trend towards a warmer and wetter climate observed in arid and semi-arid areas of northwest China from 1959 to 2019. Environ. Res. Commun. 3, 115011. doi: 10.1088/2515-7620/ac39f7
Zhou, S., Hu, X., Zhou, Z., Wang, W. E., and Ran, H. (2019). Improving water use efficiency of spring maize by adopting limited supplemental irrigation following sufficient pre-sowing irrigation in northwest China. Water 11, 802. doi: 10.3390/w11040802
Zhou, H., Shi, H., Zhang, W., Wang, W., Su, Y., and Yan, Y. (2021). Evaluation of organic inorganic nitrogen application on maize yield and nitrogen leaching by DNDC model. Trans. Chin. Soc. Agric. Machinery 52, 291–301. doi: 10.6041/j.issn.1000-1298.2021.09.033
Keywords: RZWQM2 model, spring maize, irrigation quota, fertilizer application rate, climate scenario
Citation: Zhang H, Zhang R, Sun L, Li H, Xue Y, Zhao X, Liu J and Yuan C (2025) Optimized irrigation and fertilization for spring maize under warming and wetting climate in a semi-arid region of China. Front. Plant Sci. 16:1600561. doi: 10.3389/fpls.2025.1600561
Received: 11 April 2025; Accepted: 02 June 2025;
Published: 02 July 2025.
Edited by:
Kailou Liu, Jiangxi Institute of Red Soil, ChinaReviewed by:
Peng Xiong, Jiangxi Agricultural University, ChinaTianfu Han, Zhengzhou University, China
Guiying Jiang, Henan Agricultural University, China
Copyright © 2025 Zhang, Zhang, Sun, Li, Xue, Zhao, Liu and Yuan. This is an open-access article distributed under the terms of the Creative Commons Attribution License (CC BY). The use, distribution or reproduction in other forums is permitted, provided the original author(s) and the copyright owner(s) are credited and that the original publication in this journal is cited, in accordance with accepted academic practice. No use, distribution or reproduction is permitted which does not comply with these terms.
*Correspondence: Rui Zhang, emhyXzEwMjlAMTYzLmNvbQ==