 Chazz Jordan
 James H. Leebens-Mack
- Department of Plant Biology and the Plant Center, University of Georgia, Athens, GA, United States
It has been difficult to resolve relationships among many important lineages within the Asteraceae family due to interspecific hybridization and rapid species diversification throughout the history of the family. Previous efforts to resolve evolutionary relationships among Echinacea species have relied heavily on variation in the plastid genome with limited analysis of nuclear loci. In this study, we combine whole plastome sequences and nuclear gene capture data to reconstruct species relationships and characterize the pace of speciation across the genus Echinacea. With more sampling of intraspecific variation in both the plastome and nuclear sequence data, we find evidence for interspecific gene flow and reject the previously hypothesized early split between Echinacea lineages, including species with ranges centered in the eastern and midwestern U.S. At the same time, we find evidence for rapid radiation early in the history of Echinacea in agreement with previous studies. Our findings have implications for Echinacea conservation and trait evolution in the genus.
Introduction
Rare plant species constitute up to a third of global plant diversity (Enquist, 2019), and they are important indicators for conservation initiatives as they can perform critical ecological functions, such as contributing to community stability (Säterberg et al., 2019). Considering the three axes of rarity defined by Rabinowitz (1981), the rarest species display highly restricted geographic distributions, low local abundance, and extreme specialization to uncommon habitats (e.g., Rabinowitz et al., 1986; Broennimann et al., 2005; Anacker et al., 2013). Comparative studies, especially those employing rigorous phylogenetics approaches, can elucidate diversification history and the processes contributing to both diversification and rarity (e.g., Molina-Venegas et al., 2020; Romeiro-Brito et al., 2023; Kress et al., 2025). For example, macroevolutionary analyses can test whether extant species diversity has been influenced by past adaptive radiations (Lunau, 2004), and reveal how the diversification of trait combinations following interspecific hybridization can spur rapid speciation (Flagel et al., 2008; Jackson et al., 2000).
The sunflower family (Asteraceae) comprises more than 25,000 species representing 10% of all flowering plant species (Mandel et al., 2017). The evolution of the capitulum, or flower head, is hypothesized to have contributed to the hyperdiversity of Asteraceae (Mandel et al., 2019). Given its size, it is safe to say that while many common species exist within the family, a significant fraction of species likely exhibit some form of rarity. In the NatureServe database, species are described globally, nationally, and subnationally with a rank between 1 (most imperiled) to 5 (most secure). The genus Echinacea Moench includes nine accepted species (Plants of the World Online 2025, Flora of North America 1993+), in which, most species have bright pink and purple ray florets within capitulum heads (Kindscher, 2016; McGregor, 1968). Species range sizes vary from the highly restricted range of E. tennesseensis (Beadle) Small, endemic to the cedar glades of six counties in central Tennessee, to the broad range of E. purpurea (L.) Moench, encompassing the eastern half of the United States (McGregor, 1968). All Echinacea species exhibit some degree of rarity [critically imperiled (S1), imperiled (S2), or vulnerable (S3)] in at least one state within the U.S. (NatureServe), and six of the nine species in the genus are ranked as globally imperiled (G2) or vulnerable (G3) (Figure 1). Morphologically, Echinacea exhibits among-species variation in flower color, stem and leaf trichome density, capitulum size, and number per individual (Kindscher, 2016; McGregor, 1968).
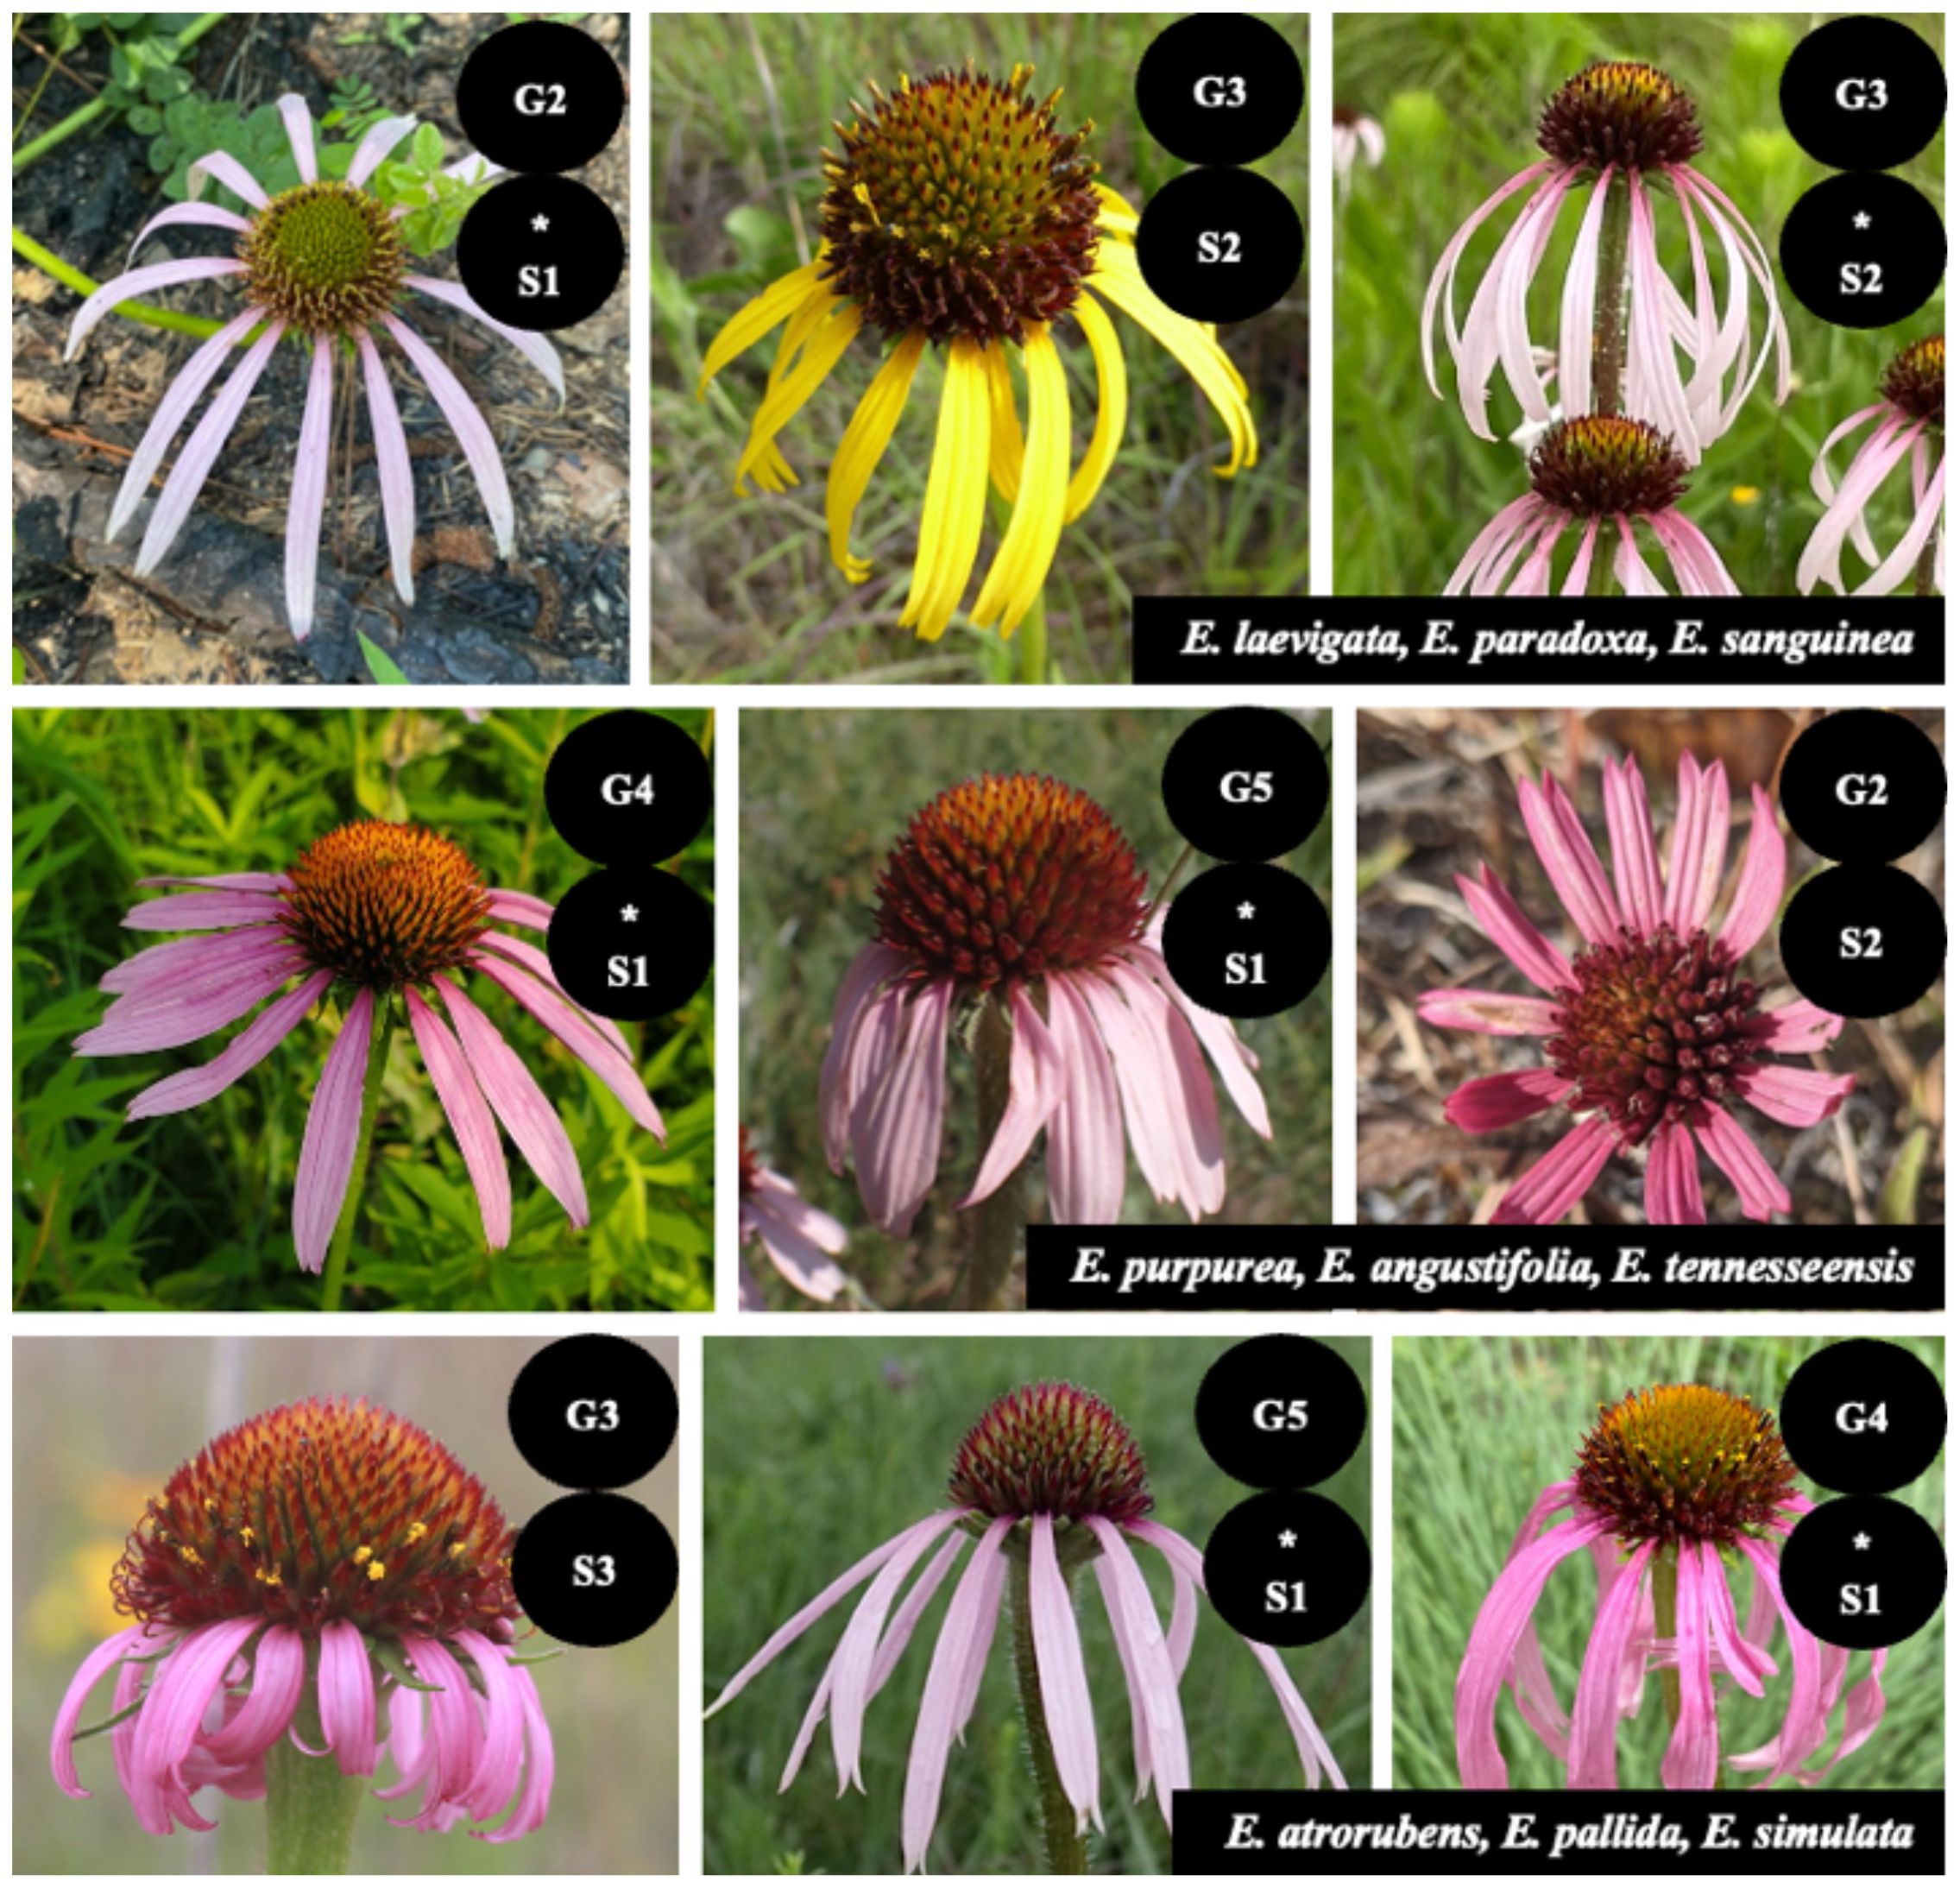
Figure 1. Echinacea species and NatureServe status rankings. All species of Echinacea, except for E. purpurea, E. angustifolia, and E. pallida, rank as G2 and G3. This indicates that most Echinacea species are imperiled or vulnerable. All species are ranked imperiled or critically imperiled in one or more states.
It has been arduous to resolve relationships among many important lineages within the Asteraceae due to hybridization and bursts of rapid speciation throughout the history of the family (Mandel et al., 2019). Phylogenetic analyses can inform conservation efforts for rarer species exhibiting narrow species ranges, habitat specialization, and lower local abundances (e.g., Molina-Venegas et al., 2020; Romeiro-Brito et al., 2023; Kress et al., 2025). Phylogenetic analyses also contribute to taxonomic clarification and the identification of unique and recently diverged lineages, determining species value for conservation priority, as well as informing comparisons between rare and widespread species (Byrne, 2003).
Previous phylogenetic analyses of Echinacea have relied heavily on variation in the plastid genome. This has resulted in many relationships remaining poorly resolved (Flagel et al., 2008), even in the analyses of whole plastomes (Zhang et al., 2017). Plastid genomes have been widely utilized to resolve species relationships, but the plastid genome evolves slowly relative to genes in the nuclear genome, and the plastome is typically inherited as a single unit without recombination (Doyle, 2022). Moreover, evolving as a single locus, the evolutionary history of the plastid genome may not match the history of speciation due to incomplete lineage sorting (ILS) (Degnan and Rosenberg, 2009) and interspecific gene flow (e.g., Baldwin et al., 2023). Genome-scale multispecies coalescence analyses using many nuclear gene loci can improve the resolution of species relationships while providing insights into the pace and nature of diversification (Winter et al., 2013). Such phylogenomic investigations can also help set conservation priorities for rare endemic species (Rokas and Carroll, 2005), including E. laevigata (C.L.Boynton & Beadle) S.F.Blake and E. tennesseensis among other Echinacea species listed as imperiled at the state of global level (Figure 1).
Few studies have utilized nuclear data to resolve relationships among all Echinacea species, and species relationships have not been well supported in studies that have used nuclear loci AFLP markers (Still et al., 2005), Adh + CesA + GPAT (Flagel et al., 2008), ITS + trnH – psbA (Zhang et al., 2017), and SCoT markers (Jedrzejczyk, 2020). A robust understanding of species relationships is critical given the conservation concerns for Echinacea species (Figure 1). The primary objective of this study is to reconstruct Echinacea species relationships under the multispecies coalescence model and assess whether internal branch lengths in the estimated species tree imply periods of rapid speciation in the genus (Flagel et al., 2008; Zhang et al., 2017). In addition, we assess the degree of concordance between the species tree estimated using nuclear loci and the plastid genome tree. We hypothesize that our phylogenomic analyses will elucidate the evolutionary history of Echinacea and contribute to conservation management plans for species across the genus.
Study system
Echinacea is a genus of outcrossing plants endemic to the United States, with species known for their bright floral colors, generalist pollinators, and medicinal properties (Figure 1; McKeown, 1999). While there is much research surrounding the medicinal and ecological attributes of Echinacea (Hensel et al., 2020; Manayi et al., 2015), there are fewer phylogenetic investigations of species relationships across the genus (Flagel et al., 2008; Jedrzejczyk, 2020; Zhang et al., 2017). At the same time, the relatively small size of the genus enables genus-wide investigations of Echinacea speciation (Flagel et al., 2008; Zhang et al., 2017). There are nine Echinacea species (Flagel et al., 2008, Plants of the World Online 2025, Flora of North America 1993) that vary in flower size and flower color (Wagenius and Lyon, 2010) (Figure 1). All Echinacea species, have the ability to hybridize where species ranges overlap (McGregor, 1968; Sassana et al., 2014), and rely on flying insect pollinators for reproduction (McGregor, 1968; Kindscher, 2016). Moreover, Echinacea populations are important components of threatened prairie ecosystems throughout the eastern half of the United States, including tallgrass, mixed grass, and short-grass prairie communities, as well as open habitats like limestone glades and hill sides (Wagenius and Lyon, 2010; Kindscher, 2016; McGregor, 1968).
Methods
Taxon sampling
Samples for all Echinacea species—E. angustifolia DC., E. atrorubens (Nutt.) Nutt., E. laevigata, E. pallida (Nutt.) Nutt., E. paradoxa Britton, E. purpurea, E. sanguinea Nutt., E. simulata McGregor, and E. tennesseensis—were included in our phylogenomic analyses (Figures 2, 3) along with available sequences for three closely related species in the Heliantheae Cassini tribe—Helianthus annuus L., H. argophyllus Torr. & A.Gray, and Parthenium argentatum A.Gray (Mandel et al., 2019), serving as outgroup taxa for phylogenomic analyses. Sequence data for the three outgroup samples were extracted from NCBI’s Sequence Read Archive (SRA) database (Appendix 1).
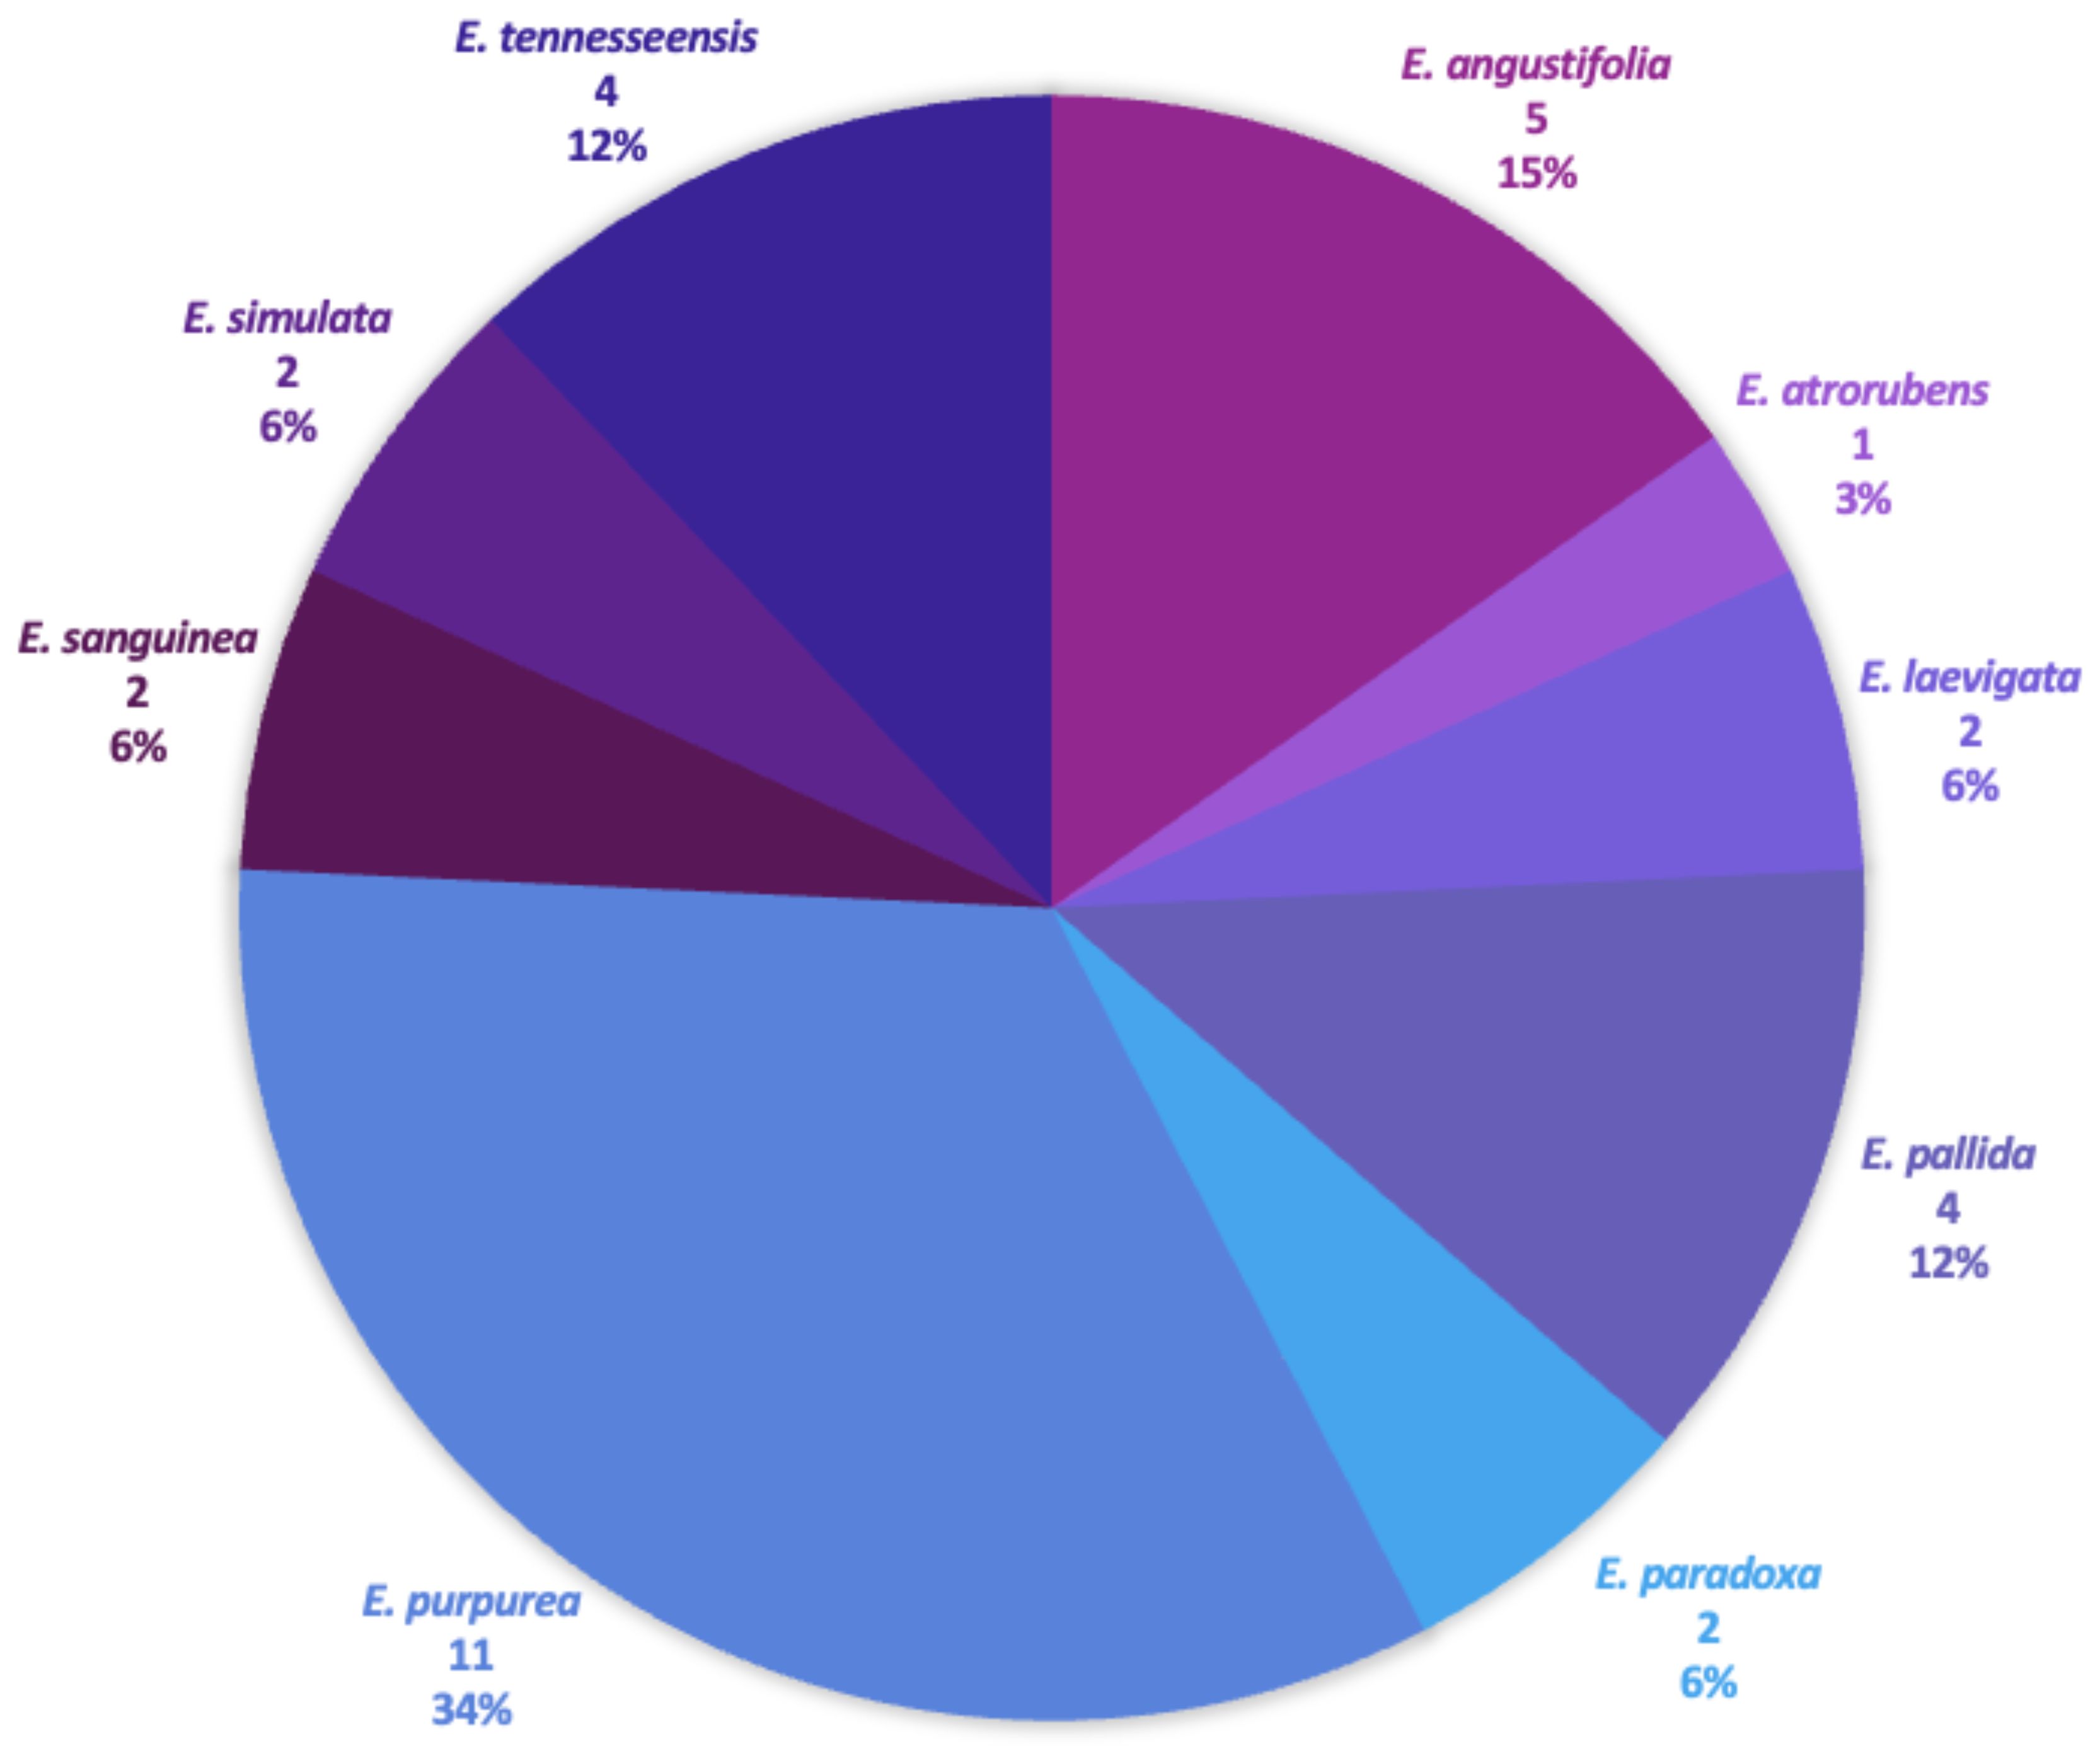
Figure 2. Echinacea study samples. Each species used in the study is displayed, as well as the number of samples per species and the species percentage used within the study.
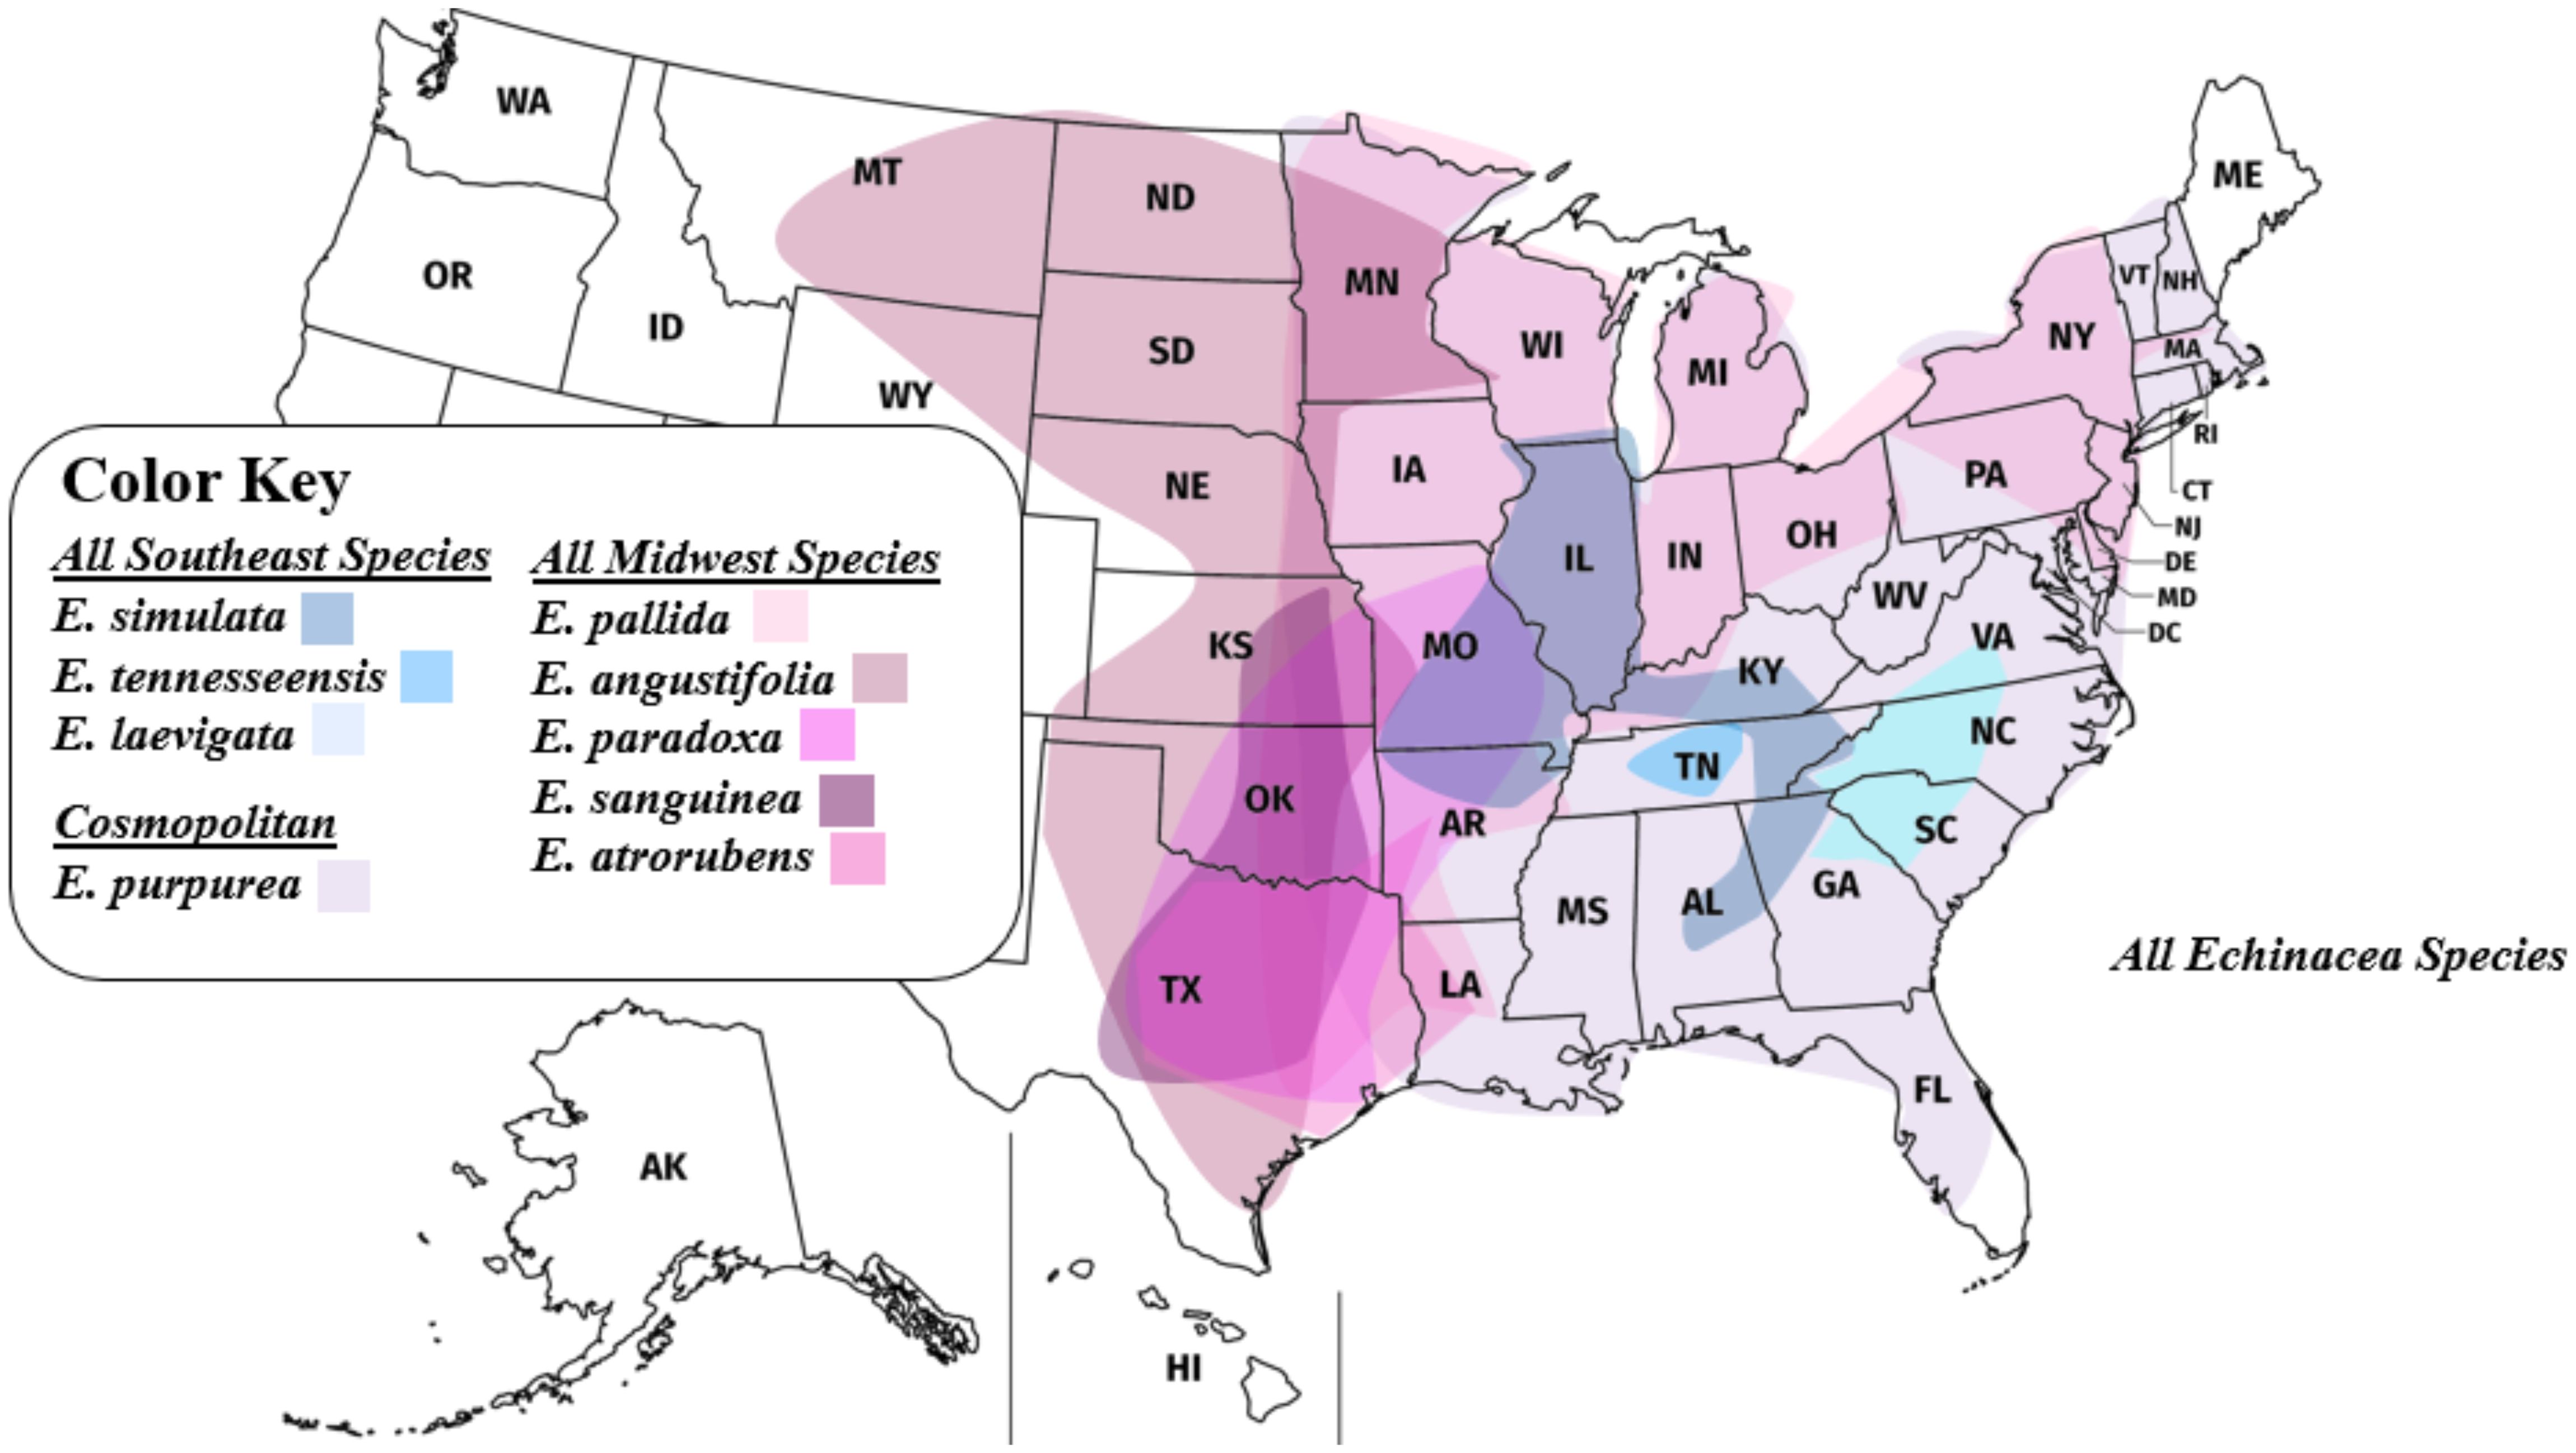
Figure 3. Range map of all Echinacea species. Southeastern Echinacea species (blue shades) have geographic ranges that generally lie side by side with minimal overlapping. In comparison, midwestern Echinacea species (pink shades) have increased overlap in their geographic ranges.
DNA isolation and library creation
DNA was extracted from silica-dried, snap-frozen, and herbarium leaf tissue samples (Appendix 1) using QIAGEN Plant Pro Kits, and a Qubit 2.0 fluorometer broad-range assay was used to assess DNA concentrations. Shotgun sequencing libraries were constructed using Roche KAPA HyperPlus Library Kits with universal Y-yoke stub adapters (30 Mm) and dual-indexed iTru primers (Glenn et al., 2019). Double-stranded DNA was fragmented, aiming for an average fragment size between 500 and 600 bp for sequencing preparation. The DNA was then end-repaired using an A-tailing reaction for 30 min at 35°C before ligation. Universal stub adapters were then ligated to the A-tailed overhangs in an overnight incubation at 20°C, followed by a post-ligation 0.8X KAPA HyperPure bead cleanup. The cleaned ligation product was then amplified for six PCR cycles with the Roche Company KAPA HiFi HotStart Ready Mix and dual-ended primers (i5, i7), followed by a post-amplification 1x bead cleanup using KAPA HyperPure Beads (Roche, USA, Indianapolis IN) to remove free oligonucleotides and smaller fragments. Library fragment size distributions were measured using Bioanalyzer High Sensitivity DNA Kits (Agilent Technologies), and DNA concentrations (mean nM) were quantified through real-time PCR (qPCR), using KAPA Library Quantification kits and KAPA SYBR Fast qPCR Master Mix (Roche, USA, Indianapolis IN). Concentration estimates of each library were size-corrected using the following formula for the 452bp qPCR Standards:
They were then converted from nM to ng/μL using the following formula (660 g/mol being the approximate weight of a base pair):
Hybridization and sequencing
Libraries were pooled (10–13 libraries per pool), with a target input of 150–200 ng from each library, and pools were bead-cleaned using 0.8x using KAPA HyperPure Beads (Roche). Pools were eluted from the beads in 100 μL of H2O and SpeedVac™ (Savant) concentrated to 7 μL as described in the Arbor Biosciences Hybridization Capture protocol. Each pool was incubated at 60°C for 24 h with 5.5 μL of the Compositae-ParaLoss-1272 target capture baits (Moore-Pollard et al., 2023). Following bait capture, hybridization reactions were amplified for 14 PCR cycles to enrich for targets, followed by a 0.8× bead cleanup for purification. Fragment size distributions for target-enriched libraries were assessed using Bioanalyzer High Sensitivity DNA chips (Agilent Technologies) and qPCR. Hybridization pools were combined for a final concentration of 10 mM for sequencing. Sequencing on the Illumina NovaSeq X Plus platform was performed through the SeqCenter (Pittsburgh, PA) sequencing service provider.
Target sequence recovery and assembly
All Hyb-Seq reads were quality-trimmed using Fastp v.0.23.2 (Chen et al., 2018). Reads that were shorter than 21 bp after trimming were removed. The HybPiper v.2.1.6 pipeline (Johnson et al., 2016) was used to map the filtered reads to target sequences in the Compositae target file (Mandel et al., 2019) and create “supercontig” assemblies for each target locus for each sample.
Phylogenomic analysis
Multiple sequence alignments for each locus were constructed for each target locus using MAFFT v.7.505 (Katoh and Standley, 2013) with the “—auto” flag, instructing MAFFT to choose the best alignment strategy to best fit the data. Misaligned sequences were identified and trimmed using trimAl v.1.4.1 (Capella-Gutiérrez et al., 2009). Maximum likelihood gene trees with support values were estimated using IQTree v.1.6.12 (Nguyen et al., 2015) with the “– mfp and -bb “ flags to implement ModelFinder optimization (Kalyaanamoorthy et al., 2017) and the ultrafast bootstrap (Minh et al., 2013), respectively. Species tree estimation was performed using the summary method ASTRAL v.5.7.8 (Mirarab et al., 2014) with the unrooted gene trees as input. The “-t” flag was used to report quartet scores for each node. Quartet frequencies were visualized as pie diagrams using the R packages GGTree, Ape, and TidyVerse.
Utilizing plastome sequences from off-target reads for phylogenetic analysis
Using a plastome gene target file, plastome-encoded genes were extracted from the trimmed target-enriched sequence data as bycatch. HybPiper v.2.1.6, MAFFT v.7.505, and Trimal v.1.4.1 were used as described above to capture, assemble, and align plastome sequences. Multiple sequence alignments for 76 plastome-encoded genes were concatenated in Geneious v.2023.2.1 (Kearse et al., 2012) to construct a super matrix. A maximum likelihood tree and ultrafast bootstrap support values were estimated on the concatenated alignment using IQTree v.1.6.12 (Nguyen et al., 2015).
Results
Phylogenomic analysis
Target capture efficiency ranged between 9% and 24% for the Compositae-Paraloss-1272 bait set, resulting in 1,234–1,272 recovered genes per sample (Figure 4), and gene trees for all targeted loci were estimated for the ASTRAL species tree analysis. The species tree inferred from the analysis of 1,272 nuclear gene trees placed a clade of E. purpurea samples as sister to all other Echinacea species (Figure 5). Most species were found to be monophyletic in the species tree analysis with local posterior probabilities ranging from 0.8 to 1 (Figure 5). At the same time, high quartet frequencies for alternative resolutions of each node (Q2 and Q3) implicated a high degree of gene tree–species tree discordance, suggesting rapid speciation and incomplete lineage sorting, particularly along the spine of the species tree (Figure 5). Alternative quartet frequencies (Q2 and Q3) are generally balanced, as would be expected with ILS (Figure 5). Two species, E. pallida and E. angustifolia, were not recovered as monophyletic. An E. angustifolia individual appeared in a clade with E. paradoxa, while E. pallida samples were scattered among clades containing E. sanguinea, E. atrorubens, E. angustifolia, and E. simulata (Figure 5).
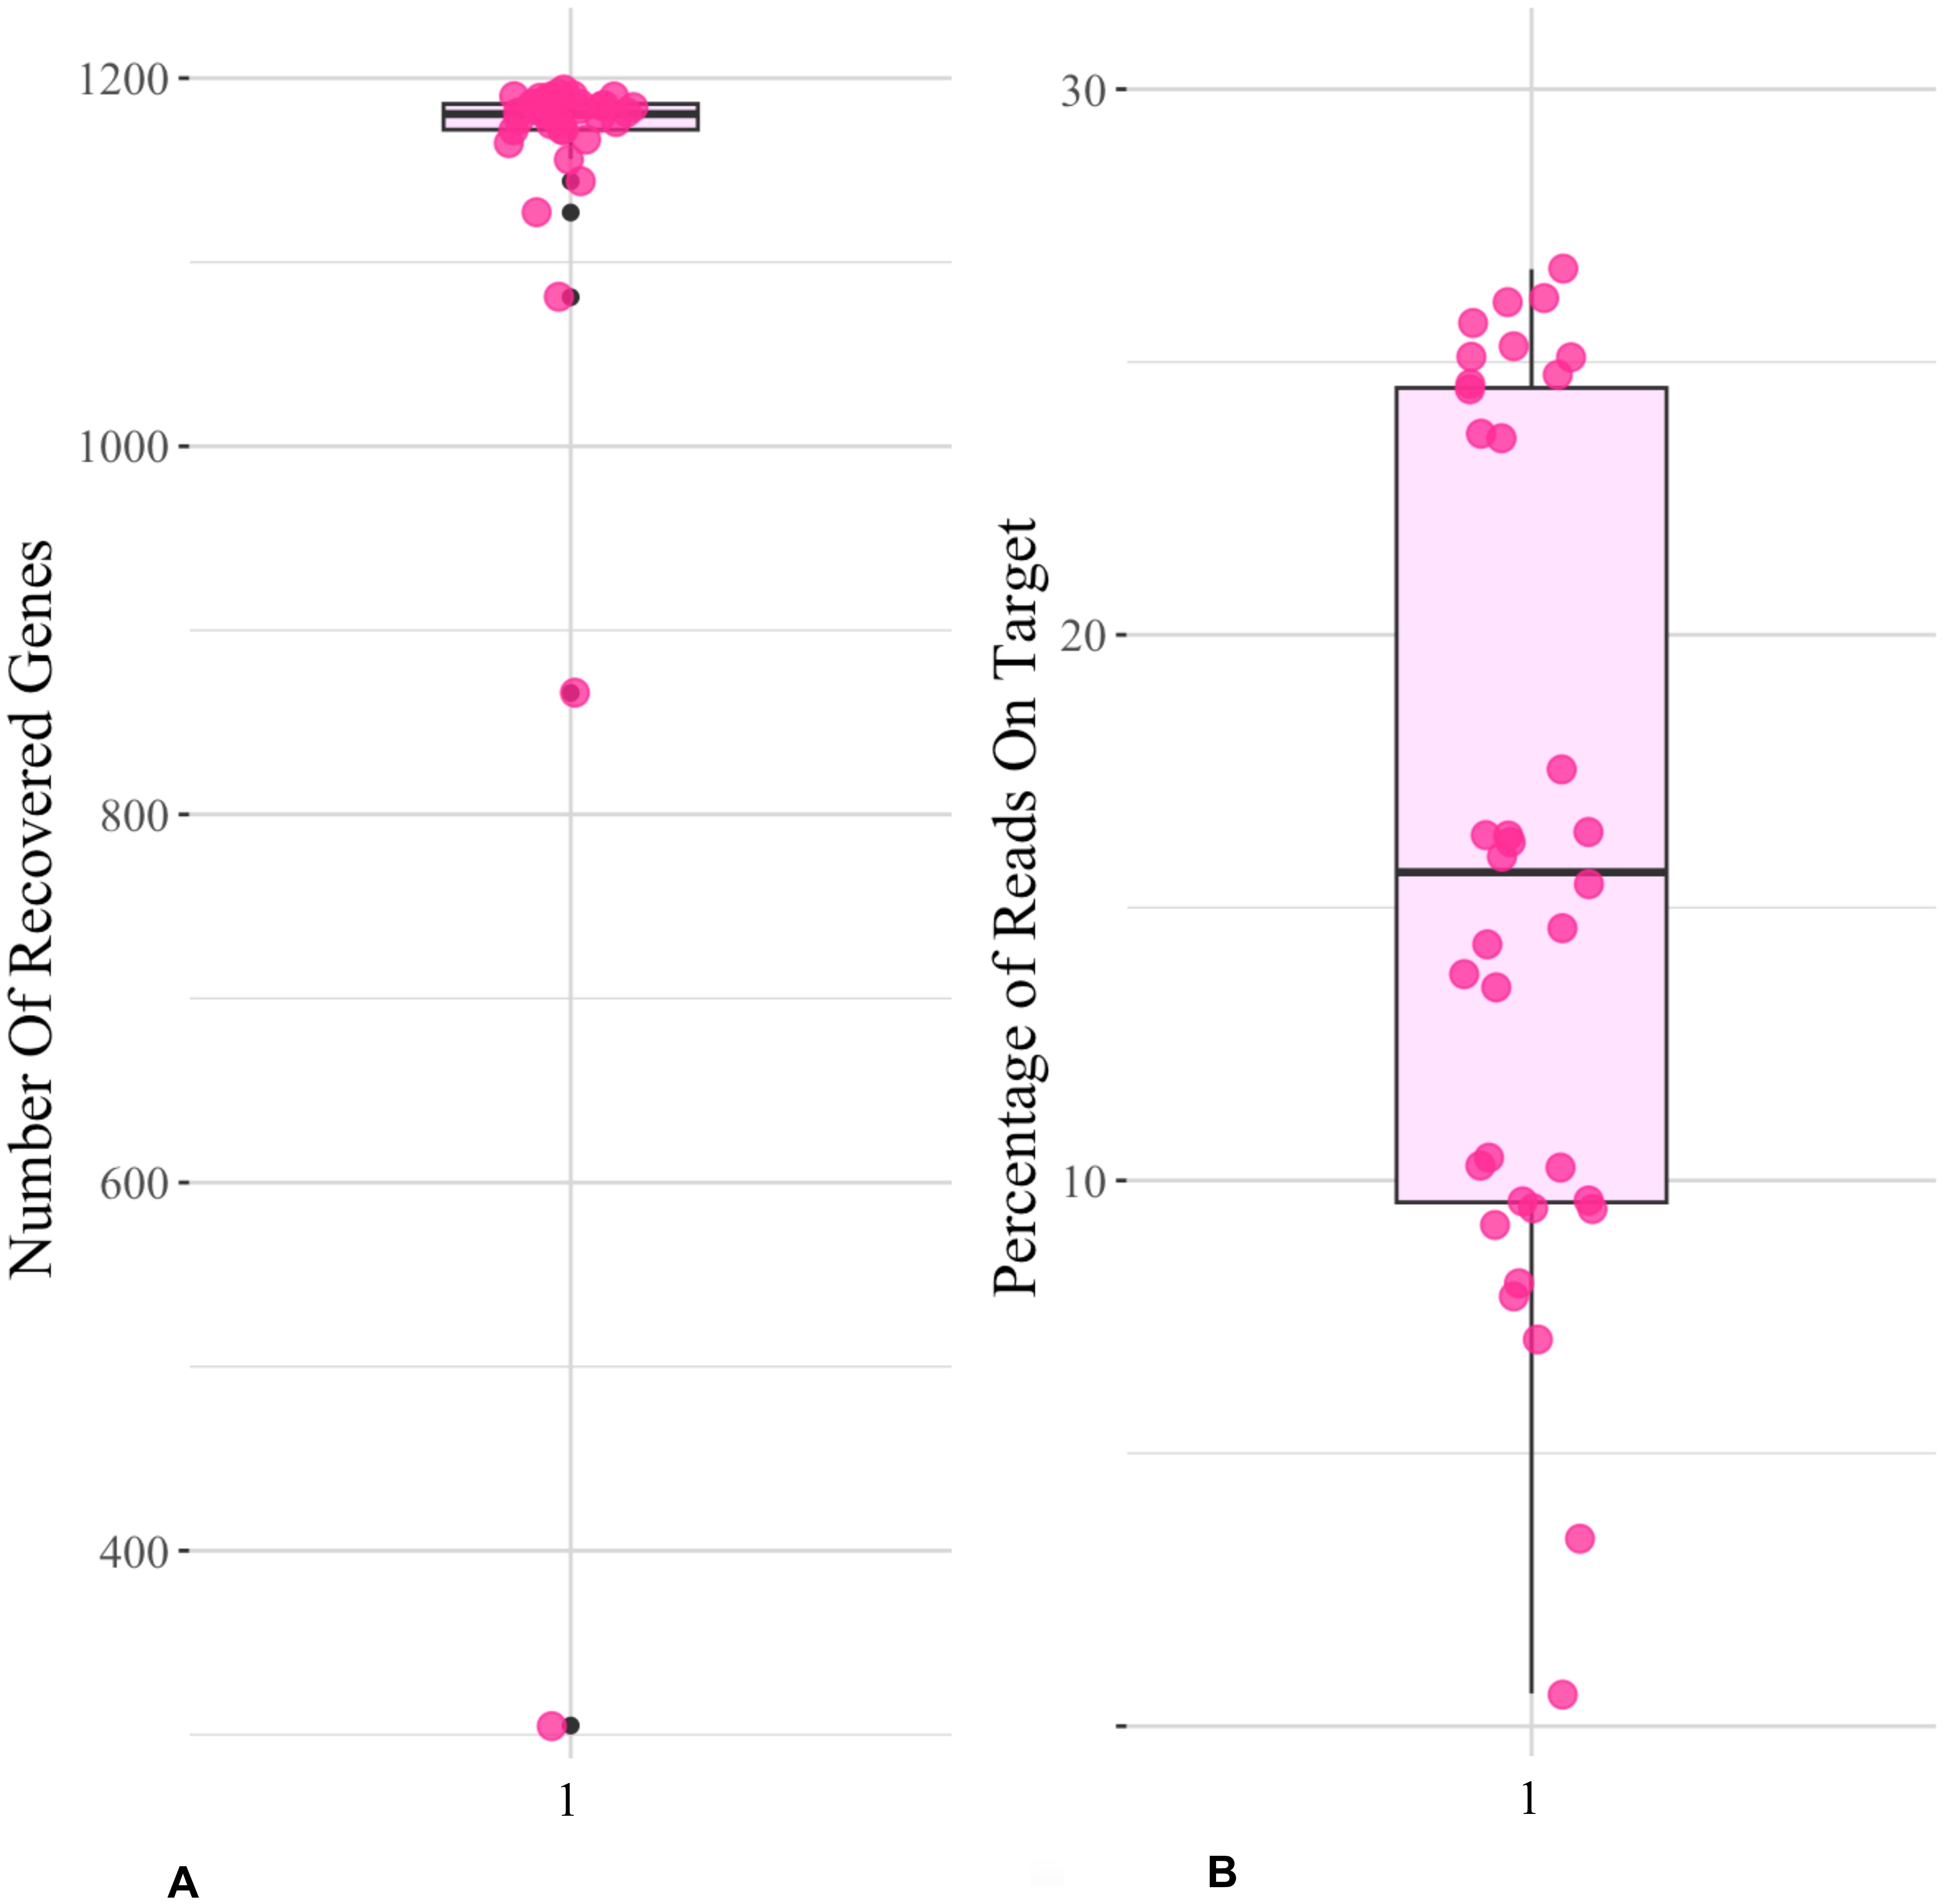
Figure 4. Compasitae-ParaLoss-1272 bait set on Echinacea. Boxplots show (A) the number of recovered genes, i.e., the number of targeted genes that were successfully enriched, sequenced, and assembled; and (B) the percentage of reads on target, i.e., the percentage of sequenced read that were successfully bound to the targeted regions of interest, which mapped to the reference target sequences from Mandel et al. (2019) using the Compositae-Paraloss-1272 baits on the Echinacea data set.
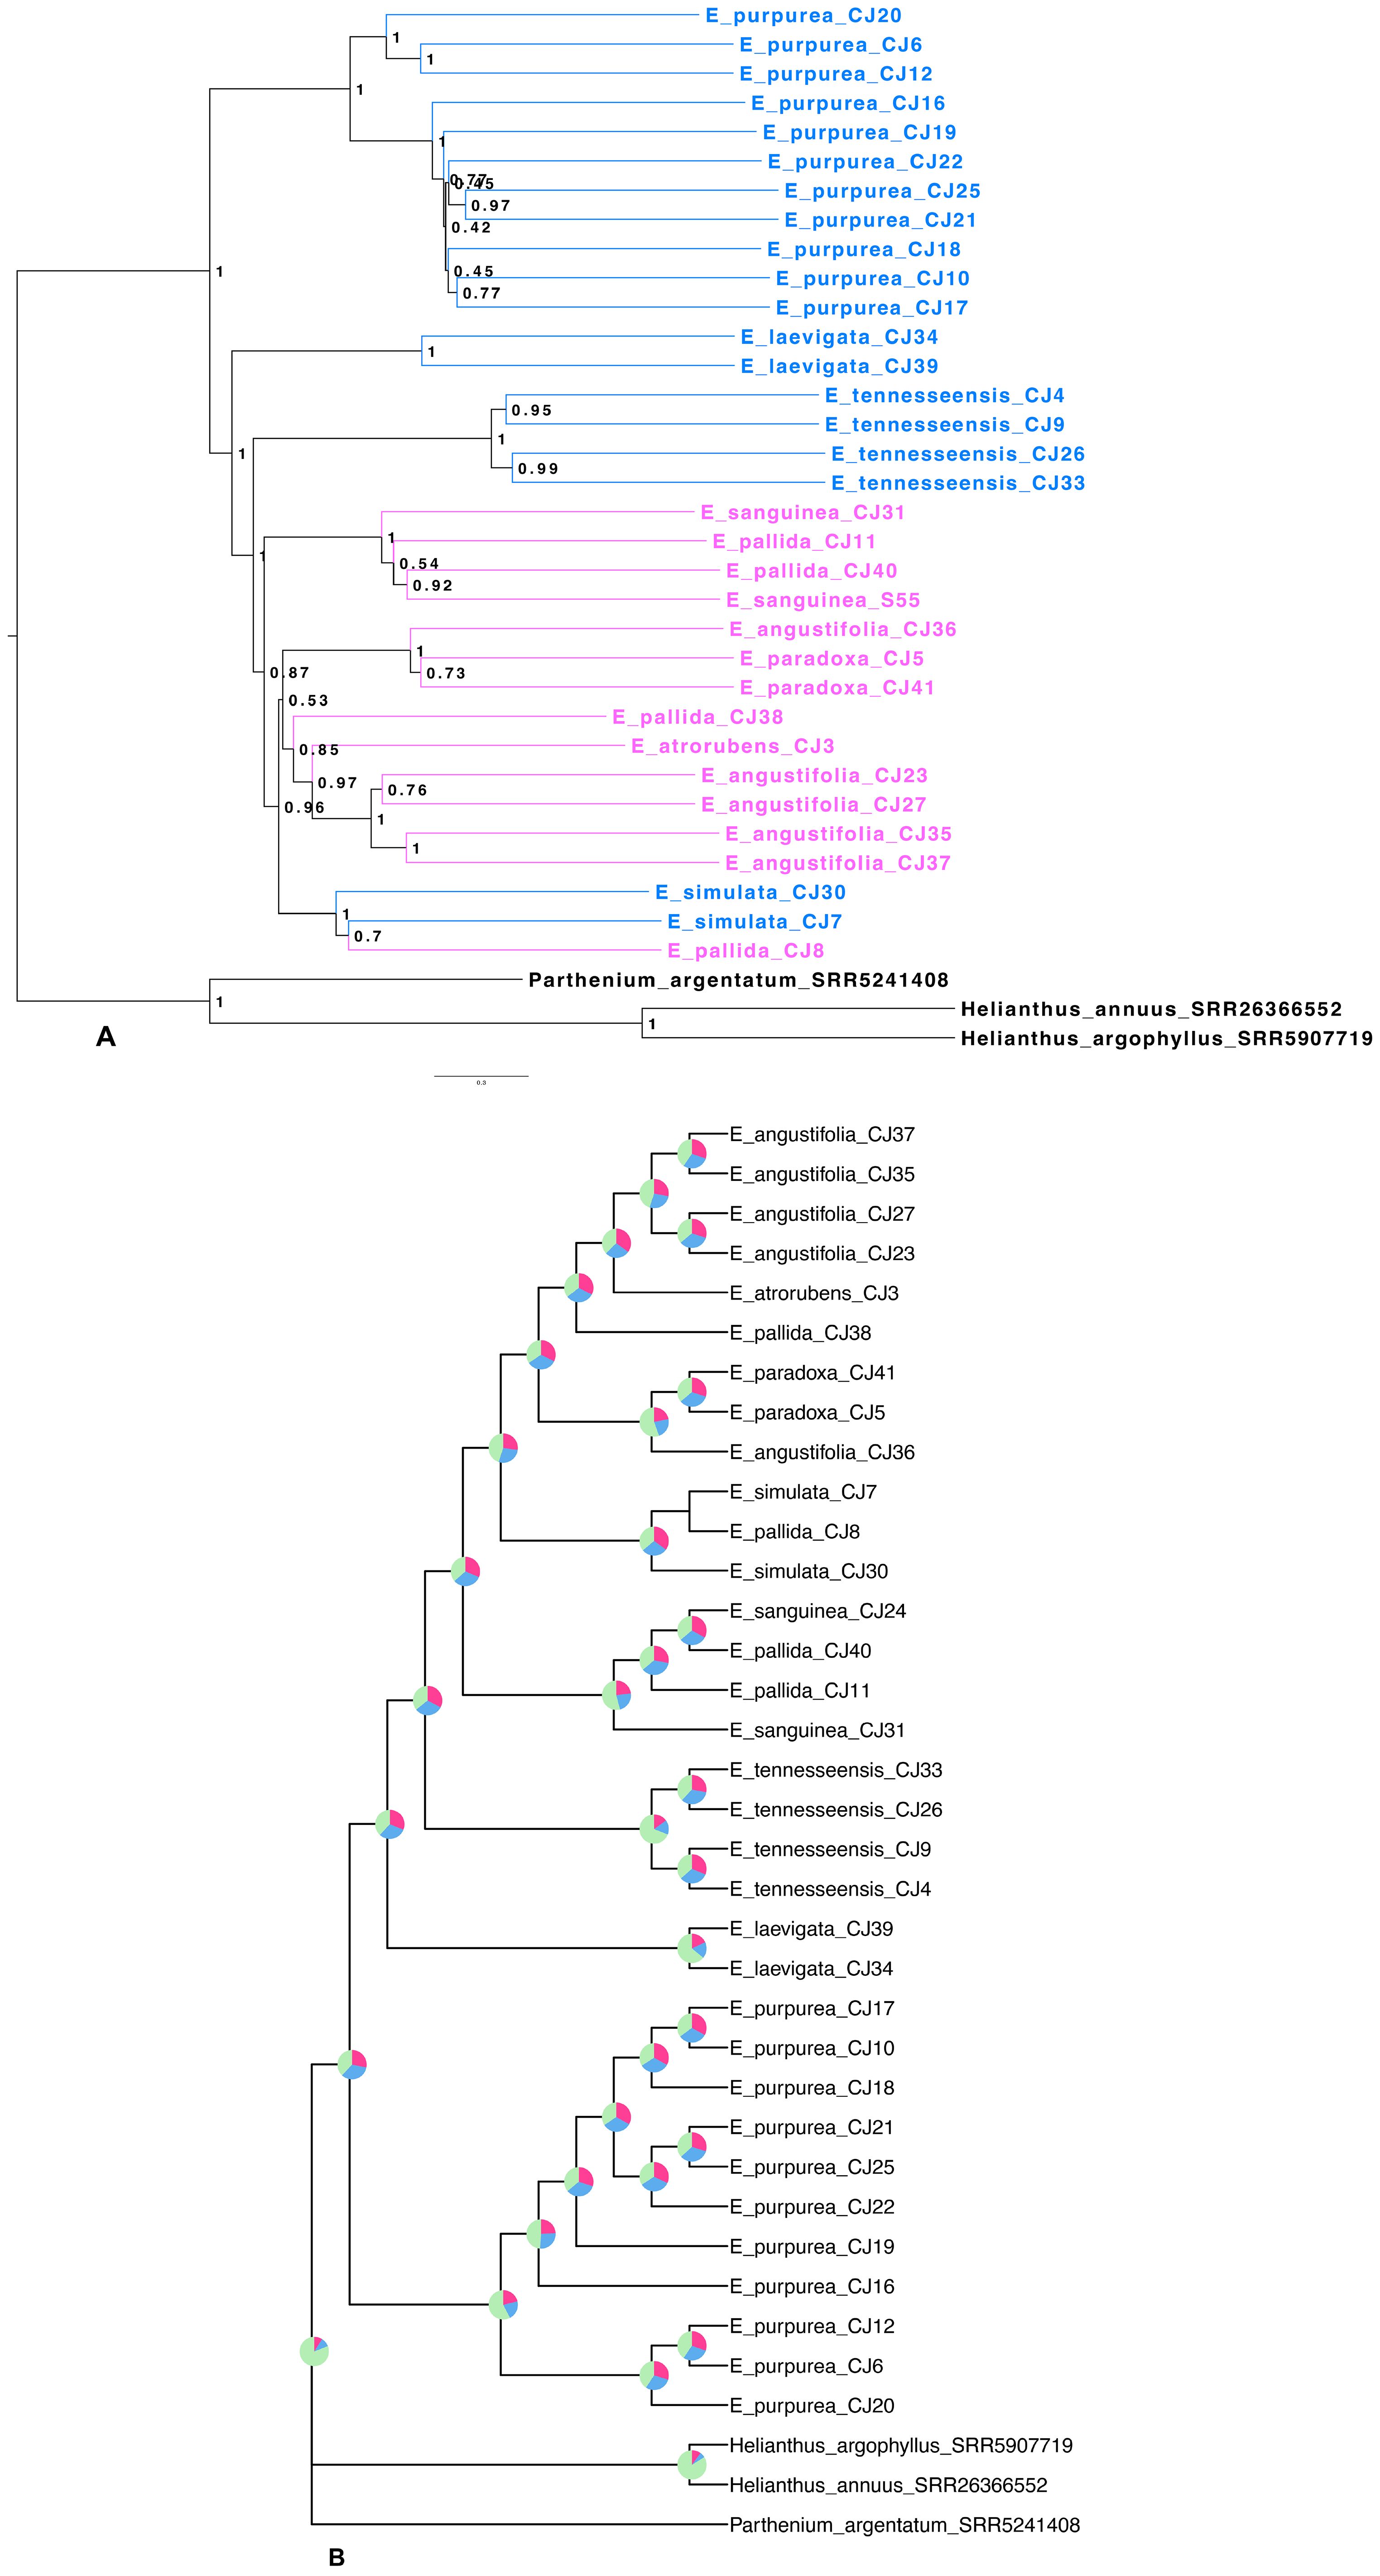
Figure 5. Echinacea species tree based on nuclear loci. (A) Echinacea species tree. Species in blue indicate southeastern species and cosmopolitan E. purpurea, while species in pink indicate midwestern species. Aside from E. simulata, eastern species are placed in a grade leading to a clade with all midwestern species. (B) Echinacea nuclear tree with quartet frequencies. Quartet frequencies on each node of the ASTRAL tree reveal extensive gene tree discordance due to rapid speciation leading to incomplete lineage sorting. For most nodes, quartets supporting alternative resolutions (Q2 and Q3) are balanced as expected with incomplete lineage sorting.
Utilizing plastome sequences from off-target reads for phylogenetic analysis
Plastome genes were assembled using off-target reads from the bait capture sequence data. The plastome tree revealed extensive polyphyly for each species (Figure 6), and the branch lengths for internodes along the spine were very short (Figure 6). Most bootstrap support values along the spine of the plastome tree were low despite the massive length of the concatenated plastome gene alignment, including 67,743 bases (Figure 6). Interestingly, samples E_purpurea_CJ18, E_angustifolia_CJ23, and the outgroup species exhibited much longer branch lengths compared to all other ingroup samples.
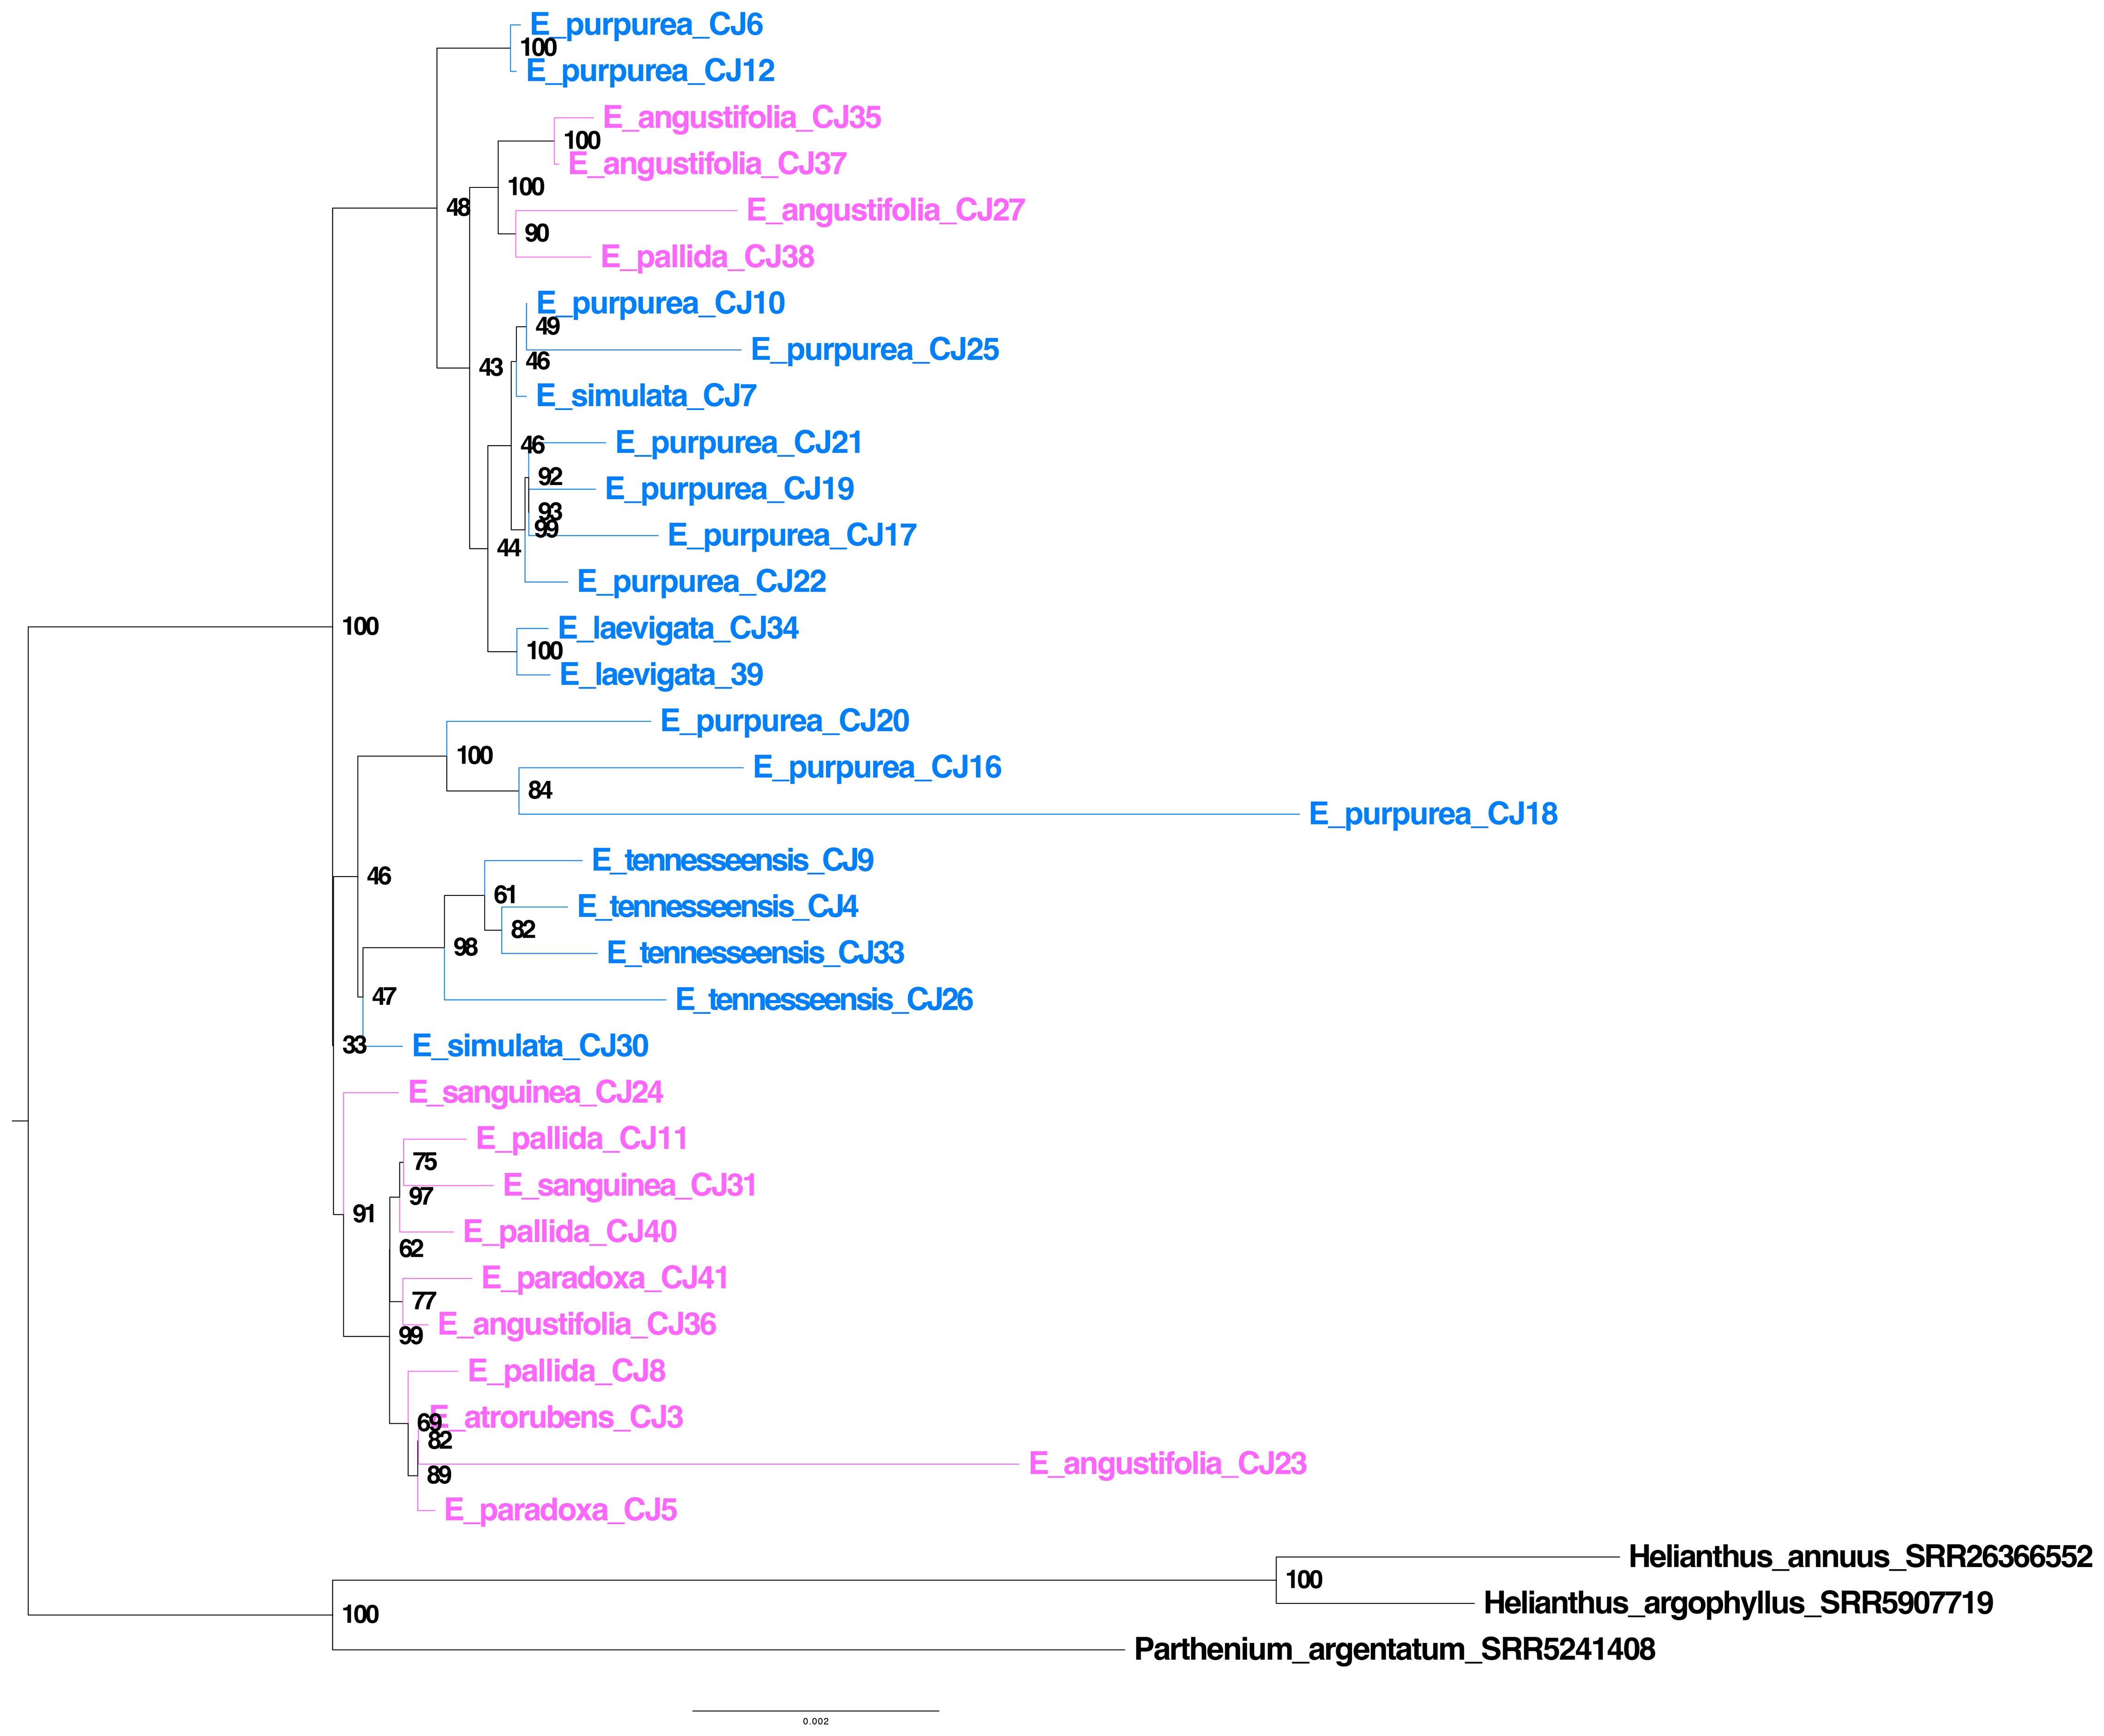
Figure 6. Echinacea plastome tree. Species in blue indicate southeastern species and cosmopolitan E. purpurea, while species in pink indicate midwestern species. The lack of monophyly for most species is striking, and samples do not fall into eastern and midwestern clades as found in an earlier study (Zhang et al., 2017).
Discussion
High gene recovery with a lower percentage of on-target sequence assembly
Here, we analyzed Echinacea species relationships based on an analysis of single-copy target capture genes (Mandel et al., 2019; Moore-Pollard et al., 2023). The large number of recovered genes for this genus indicates that the Compositae-Paraloss-1272 bait set is effective for sunflower family taxa beyond those originally tested (Moore-Pollard et al., 2023).
Phylogenomic analysis shows extensive gene tree–species tree discordance
Previous plastome phylogenomic analysis with single samples per species (Zhang et al., 2017) provided a misleading view of Echinacea relationships and diversification. The branching patterns evident in our plastome (Figure 6) and ASTRAL (Figure 5) trees suggest that the evolutionary history of Echinacea includes an early burst of rapid speciation and some degree of interspecific hybridization. In contrast to the plastome tree presented by Zhang et al. (2017), our species tree (Figure 5) places the cosmopolitan E. purpurea as sister to a clade with the remainder of the genus, and most southeastern species form a grade with a clade dominated by midwestern species arising later in the evolutionary history of Echinacea. A rapid rate of early branching (i.e., speciation) is indicated by the short internodes along the spine of the Echinacea species tree (Figure 5A) and extensive signal for incomplete lineage sorting as seen in the high frequency of alternative quartets in the species tree analysis (Figure 5B). The lack of monophyly among samples of each species in the plastome tree (Figure 6) may also be a consequence of ILS. At the same time, polyphyly of E. pallida and E. angustifolia in both the ASTRAL (Figure 5) and plastome (Figure 6) trees implicates hybridization and interspecific gene flow.
Nearly even quartet frequencies for many nodes in the species tree estimation, shown in Figure 5B as pie charts, indicate high levels of gene tree–species tree discordance. Given the low posterior probabilities for many nodes on the spine of the clade dominated by midwestern species (Figure 5A), we cannot discount the possibility of polytomies in the Echinacea species tree (i.e., ancestral species spawning more than two daughter species). In support of this hypothesis, a number of nodes exhibit quartets with equal frequencies for all three resolutions of nodes on the spine of the Midwest-dominated clade (Figure 5B). This pattern would be expected in the face of rapid radiation and rampant ILS. At the same time, the polyphyly of some species implicates post-speciation interspecific gene flow.
Echinacea angustifolia and E. pallida are polyphyletic in the species tree based on analysis of 1272 nuclear genes. While most E. angustifolia samples were grouped together in the species tree (Figure 5), one individual was placed in a clade with E. paradoxa. Echinacea pallida samples exhibited a higher degree of polyphyly, with samples being placed in several clades with E. sanguinea, E. atrorubens, E. angustifolia, and E. simulata, all with ranges in the Midwest. Previous work has documented that all species that have overlapping ranges can hybridize (Kindscher, 2016; McGregor, 1968; McKeown, 1999). We hypothesize that more extensive range overlap among midwestern species has resulted in higher rates of introgressive hybridization. Additional sampling across the ranges of E. simulata and the midwestern species (Figures 3, 5) is required to gain a deeper understanding of the influence of interspecific gene flow among these species.
Plastome sequences also suggest rapid speciation and the possibility of interspecific gene flow
Most nodes on the plastome tree have bootstrap robust support values, but as seen in the species tree analysis, some nodes on the spine of the tree are poorly supported, suggesting rapid early divergence among sampled plastome lineages. Whereas Zhang et al. (2017) inferred distinct clades for eastern and western species in their whole-plastome analysis, this interpretation of the plastome history does not hold up when we sampled more than a single individual per species. Whereas Zhang et al. (2017) identified distinct eastern and midwestern species clades, our plastome tree (Figure 6) suggests rapid speciation early in the history of the genus, and multigene species tree estimation (Figure 5) suggests that E. purpurea, with the broadest range of all Echinacea species, is sister to a clade with the remainder of the genus. The lack of species monophyly in the plastome tree and the poor correspondence between the species and the plastome trees (Figure 5 vs. Figure 6) are consistent with the hypothesis that species lineages retained ancestral variation in plastome haplotypes as they were diversifying. Hybridization resulting in interspecific exchange of plastomes may have also contributed to the polyphyly of the species tree (Figure 5) in the plastome phylogeny (Figure 6).
Conclusions
The purple coneflower is known for its vibrant fluorescence and ethnobotanical significance. Being a part of the Asteraceae family, this genus has had a complex evolutionary history, including but not limited to a history of rapid radiation, variation in ploidy, and high potential for hybridization. With heavier sampling, we must reject the previously hypothesized early split between eastern and western species clades (Zhang et al., 2017). It is interesting that the most widespread species, E. purpurea, is sister to all other Echinacea species (Figure 5). In agreement with previous works (Flagel et al., 2008; Zhang et al., 2017), we found very short internode branch lengths along the spine of the tree, implying rapid speciation (Figure 5). Evidence for some interspecific gene flow is not surprising given the ability of Echinacea species to hybridize (McGregor, 1968) and their overlapping ranges (Figure 1).
Given the results of our phylogenomic analyses, we hypothesize that Echinacea originated in the Southeast and expanded its range into the midwest. Geographic isolation and adaptation to local environmental conditions (Baskauf et al., 1994) likely contributed to the speciation process. For example, extant Echinacea species exhibit variation in soil characteristics (Baskauf and Eickmeier, 1994) and climate niches (Boyd et al., 2022). The persistence of clearly distinguishable species despite the ability of all Echinacea species to hybridize is also suggestive of ecological divergence in the speciation process. Nonetheless, actively hybridizing populations may be of conservation concern (Sassana et al., 2014).
Phylogenetics can be used as an asset to aid conservation efforts. In the case of this study, we aimed to utilize phylogenetic inferences to improve our understanding of Echinacea diversity and speciation. Our findings should inform Echinacea conservation efforts and priorities. For example, the narrow endemic E. tennesseensis is phylogenetically distinct, and the polyphyly of E. angustifolia and E. pallida (Figures 5, 6) implicates hybridization as a potential threat.
Data availability statement
The datasets presented in this study can be found in online repositories. The names of the repository/repositories and accession number(s) can be found in the article/Supplementary Material.
Author contributions
CJ: Methodology, Data curation, Writing – review & editing, Investigation, Formal Analysis, Funding acquisition, Writing – original draft, Visualization, Resources, Conceptualization, Validation, Project administration. JL: Conceptualization, Writing – review & editing, Project administration, Methodology, Supervision.
Funding
The author(s) declare financial support was received for the research and/or publication of this article. This research was supported by the National Science Foundation (NSF) Graduate Research Fellowship Program (GRFP) under the NSF Award #2236869.
Acknowledgments
We would like to thank Jen Manel and Erica Moore-Pollard (University of Memphis) for supplying and sharing their Compositae-specific baits; members and friends within the University of Georgia (UGA), Departments of Plant Biology, Ecology, Genetics, Plant Pathology, and Geography for their field assistance and contributions to field safety; all plant science colleagues, spread across the U.S., who contributed plant tissue specimens and vouchers; and members of the Leebens-Mack lab (Ethan Baldwin, Summer Blanco, Philip Bentz) for their research support. Lastly, we would like to thank Botanical Research Institute of Texas Herbarium (BRIT) – Morgan Gostel, The University of Texas at El Paso Herbarium (UTEP) – Minga Zhuang and Micheal Moody), and the UGA Herbarium staff (Steven Hughes and Tanisha Williams) for their sample contributions and help with this body of work. We would also like to thank the GRIN repository for sending seeds for research purposes.
Conflict of interest
The authors declare that the research was conducted in the absence of any commercial or financial relationships that could be construed as a potential conflict of interest.
The author(s) declared that they were an editorial board member of Frontiers, at the time of submission. This had no impact on the peer review process and the final decision.
Generative AI statement
The author(s) declare that no Generative AI was used in the creation of this manuscript.
Any alternative text (alt text) provided alongside figures in this article has been generated by Frontiers with the support of artificial intelligence and reasonable efforts have been made to ensure accuracy, including review by the authors wherever possible. If you identify any issues, please contact us.
Publisher’s note
All claims expressed in this article are solely those of the authors and do not necessarily represent those of their affiliated organizations, or those of the publisher, the editors and the reviewers. Any product that may be evaluated in this article, or claim that may be made by its manufacturer, is not guaranteed or endorsed by the publisher.
Supplementary material
The Supplementary Material for this article can be found online at: https://www.frontiersin.org/articles/10.3389/fpls.2025.1602041/full#supplementary-material
References
Anacker, B. L., Gogol-Prokurat, M., Leidholm, K., and Schoenig, S. (2013). Climate change vulnerability assessment of rare plants in California. Madroño 60, 193–210. doi: 10.3120/0024-9637-60.3.193
Baldwin, E., McNair, M., and Leebens-Mack, J. (2023). Rampant chloroplast capture in Sarracenia revealed by plastome phylogeny. Frontiers in Plant Science 14. doi: 10.3389/fpls.2023.1237749
Baskauf, C. J. and Eickmeier, W. G. (1994). Comparative ecophysiology of a rare and a widespread species of E Chinacea (Asteraceae). Am. J. Bot. 81, 958–645. doi: 10.1002/j.1537-2197.1994.tb15582.x
Baskauf, C. J., McCauley, D. E., and Eickmeier, W. G. (1994). Genetic analysis of a rare and a widespread species of Echinacea (Asteraceae). Evolution, 48, 180–188. doi: 10.2307/2410013
Boyd, J. N., Anderson, J. T., Brzyski, J., Baskauf, C., and Cruse-Sanders, J. (2022). Eco-evolutionary causes and consequences of rarity in plants: A meta-analysis. New Phytol. 235, 1272–1865. doi: 10.1111/nph.18172
Broennimann, O., Vittoz, P., Moser, D., and Guisan, A. (2005). Rarity types among plant species with high conservation priority in Switzerland. Botanica Helv. 115, 95–108. doi: 10.1007/s00035-005-0713-z
Byrne, M. (2003). Phylogenetics and the conservation of a diverse and ancient flora. Comptes Rendus. Biologies 326, 73–79. doi: 10.1016/S1631-0691(03)00041-6
Capella-Gutiérrez, S., Silla-Martínez, J. M., and Gabaldón, T. (2009). trimAl: A tool for automated alignment trimming in large-scale phylogenetic analyses. Bioinformatics 25, 1972–1735. doi: 10.1093/bioinformatics/btp348
Chen, S., Zhou, Y., Chen, Y., and Gu, J. (2018). Fastp: an ultra-fast all-in-one FASTQ preprocessor. Bioinformatics 34, i884–i890. doi: 10.1093/bioinformatics/bty560
Degnan, J. H. and Rosenberg, N. A. (2009). Gene tree discordance, phylogenetic inference and the multispecies coalescent. Trends Ecol Evol 24, 332–340. doi: 10.1016/j.tree.2009.01.009
Doyle, J. J. (2022). “Defining coalescent genes: theory meets practice in organelle phylogenomics,” in Systematic Biology, 71, 476–489. doi: 10.1093/sysbio/syab053
Enquist, B. J., Feng, X., Boyle, B., Maitner, B., Newman, E. A., Jørgensen, P. M., et al (2019). The commonness of rarity: Global and future distribution of rarity across land plants. Sci. Adv. 5, eaaz0414. doi: 10.1126/sciadv.aaz0414
Flagel, L. E., Rapp, R. A., Grover, C. E., Widrlechner, M. P., Hawkins, J., Grafenberg, J. L., et al. (2008). Phylogenetic, morphological, and chemotaxonomic incongruence in the north American endemic genus eChinacea. Am. J. Bot. 95, 756–765. doi: 10.3732/ajb.0800049
Glenn, T. C., Nilsen, R. A., Kieran, T. J., Sanders, J. G., Bayona-Vásquez, N. J., Finger, J. W., et al. (2019). Adapterama I: universal stubs and primers for 384 unique dual-indexed or 147,456 combinatorially-indexed illumina libraries (iTru & iNext). PeerJ 7, e7755. doi: 10.7717/peerj.7755
Hensel, A., Bauer, R., Heinrich, M., Spiegler, V., Kayser, O., Hempel, G., et al. (2020). Challenges at the time of COVID-19: opportunities and innovations in antivirals from nature. Planta Med. 86, 659–645. doi: 10.1055/a-1177-4396
Jackson, S. T., Webb, R. S., Anderson, K. H., Overpeck, J. T., Webb, T., III, Williams, J. W., et al. (2000). Vegetation and environment in eastern north America during the last glacial maximum. Quaternary Sci. Rev. 19, 489–5085. doi: 10.1016/S0277-3791(99)00093-1
Jedrzejczyk, I. (2020). Genome size and SCoT markers as tools for identification and genetic diversity assessment in eChinacea genus. Ind. Crops Products 144, 112055. doi: 10.1016/j.indcrop.2019.112055
Johnson, M. G., Gardner, E. M., Liu, Y., Medina, R., Goffinet, B., Shaw, A.J., et al. (2016). HybPiper: extracting coding sequence and introns for phylogenetics from high-throughput sequencing reads using target enrichment. Appl. Plant Sci. 4, 16000165. doi: 10.3732/apps.1600016
Kalyaanamoorthy, S., Minh, B. Q., Wong, T. K.F., von Haeseler, A., and Jermiin, L. S. (2017). ModelFinder: fast model selection for accurate phylogenetic estimates. Nat. Methods 14, 587–895. doi: 10.1038/nmeth.4285
Katoh, K. and Standley, D. M. (2013). MAFFT multiple sequence alignment software version 7: improvements in performance and usability. Molecular Biology and Evolution 30, 772–780. doi: 10.1093/molbev/mst010
Kearse, M., Moir, R., Wilson, A., Stones-Havas, S., Cheung, M., Sturrock, S., et al. (2012). Geneious basic: an integrated and extendable desktop software platform for the organization and analysis of sequence data. Bioinformatics 28, 1647–1649. doi: 10.1093/bioinformatics/bts199
Kindscher, K. (2016). Introduction. In: Kindscher, K. (ed.) Echinacea. Cham: Springer. doi: 10.1007/978-3-319-18156-1_1
Kress, J. W., Fér, T., Carlsen, M. M., and Krupnick, G. A. (2025). A conservation assessment and phylogenomic evaluation of protection status in the tropical genus heliconia L. (Zingiberales: Heliconiaceae). Plants People Planet 7, 1438–1457. doi: 10.1002/ppp3.70000
Lunau, K. (2004). Adaptive radiation and coevolution ? Pollination biology case studies. Organisms Diversity Evol. 4, 207–224. doi: 10.1016/j.ode.2004.02.002
Manayi, A., Vazirian, M., and Saeidnia, S. (2015). EChinacea purpurea: pharmacology, phytochemistry and analysis methods. Pharmacognosy Rev. 9, 63–725. doi: 10.4103/0973-7847.156353
Mandel, J. R., Barker, M. S., Bayer, R. J., Dikow, R. B., Gao, T.-G., Jones, K. E., et al. (2017). The compositae tree of life in the age of phylogenomics: the compositae tree of life. J. Systematics Evol. 55, 405–410. doi: 10.1111/jse.12265
Mandel, J. R., Dikow, R. B., Siniscalchi, C. M., Thapa, R., Watson, L. E., and Funk, V. A. (2019). A fully resolved backbone phylogeny reveals numerous dispersals and explosive diversifications throughout the history of asteraceae. Proc. Natl. Acad. Sci. 116, 14083–14885. doi: 10.1073/pnas.1903871116
McGregor, R. (1968). The taxonomy of the genus eChinacea (Compositae). Univ. Kansas Sci. Bull. 48, 113–142.
McKeown, K. A. (1999). A review of the taxonomy of the genus Echinacea. In: Janick, J. (ed) Perspectives on new crops and new uses. Alexandria, Va.: ASHS Press, pp 482–489.
Minh, B. Q., Nguyen, M. A. T., and Von Haeseler, A. (2013). Ultrafast approximation for phylogenetic bootstrap. Mol. Biol. Evol. 30, 1188–1195. doi: 10.1093/molbev/mst024
Mirarab, S., Reaz, R., Bayzid, M., Zimmermann, T., Swenson, M. S., and Warnow, T. (2014). ASTRAL: genome-scale coalescent-based species tree estimation. Bioinformatics 30, i541–i548. doi: 10.1093/bioinformatics/btu462
Molina-Venegas, R., Ramos-Gutiérrez, I., and Moreno-Saiz, J. C. (2020). Phylogenetic patterns of extinction risk in the endemic flora of a mediterranean hotspot as a guiding tool for preemptive conservation actions. Front. Ecol. Evol. 8. doi: 10.3389/fevo.2020.571587
Moore-Pollard, E. R., Jones, D. S., and Mandel, J. R. (2023). Compositae-paraLoss-1272: complementary sunflower specific probe-set reduces issues with paralogs in complex systems. Appl. Plant Sci. 12, e11568. doi: 10.1002/aps3.11568
Nguyen, L.-T., Schmidt, H. A., von Haeseler, A., and Minh, B. Q. (2015). IQ-TREE: A fast and effective stochastic algorithm for estimating maximum-likelihood phylogenies. Mol. Biol. Evol. 32, 268–745. doi: 10.1093/molbev/msu300
Rabinowitz, D. (1981). Seven forms of rarity, In: Synge, H. (ed.) The Biological Aspects of Rare Plant Conservation. Hoboken, N.J.: John Wiley & Sons Ltd., pp 205–217.
Rabinowitz, D., Cairns, S., and Dillon, T. (1986). Seven forms of rarity and their frequency in the flora of British Isles. In: Soulé, M. E. (ed.) Conservation Biology: Science of Scarcity and Diversity. Sunderland, Mass.: Sinauer Associates, pp 182–204.
Rokas, A. and Carroll, S. B. (2005). More genes or more taxa? The relative contribution of gene number and taxon number to phylogenetic accuracy. Mol. Biol. Evol. 22, 1337–1344. doi: 10.1093/molbev/msi121
Romeiro-Brito, M., Taylor, N. P., Zappi, D. C., Telhe, M. C., Franco, F. F., and Moraes, E. M. (2023). Unravelling phylogenetic relationships of the tribe Cereeae using target enrichment sequencing. Ann. Bot. 132, 989–1006. doi: 10.1093/aob/mcad153
Sassana, G., Suiter, A., English, L., and Wagenius, S. (2014). Evidence of hybridization between native Echinacea angustifolia and Echinacea pallida in a Minnesota prairie fragment. Retrieved from https://echinaceaproject.org/wp-content/uploads/HybridLabReport2014.pdf (accessed May 22, 2025).
Säterberg, T., Jonsson, T., Yearsley, J., Berg, S., and Ebenman, B (2019). A potential role for rare species in ecosystem dynamics. Sci. Rep. 9, 111075. doi: 10.1038/s41598-019-47541-6
Still, D. W., Kim, D.-H., and Aoyama, N. (2005). Genetic variation in eChinacea angustifolia along a climatic gradient. Ann. Bot. 96, 467–477. doi: 10.1093/aob/mci199
Wagenius, S. and Lyon, S. P. (2010). Reproduction of eChinacea angustifolia in fragmented prairie is pollen-limited but not pollinator-limited. Ecology 91, 733–425. doi: 10.1890/08-1375.1
Winter, M., Devictor, V., and Schweiger, O. (2013). Phylogenetic diversity and nature conservation: where are we? Trends Ecol. Evol. 28, 199–2045. doi: 10.1016/j.tree.2012.10.015
Keywords: Echinacea, plant conservation, phylogenomics, HybSeq, Compositae-ParaLoss-1272
Citation: Jordan C and Leebens-Mack JH (2025) Utilizing target capture sequencing to resolve the speciation history of Echinacea (Asteraceae). Front. Plant Sci. 16:1602041. doi: 10.3389/fpls.2025.1602041
Received: 28 March 2025; Accepted: 05 August 2025;
Published: 09 September 2025.
Edited by:
Robert Philipp Wagensommer, Free University of Bozen-Bolzano, ItalyReviewed by:
Itzi Fragoso-Martínez, Instituto de Ecología (INECOL), MexicoLihong Xiao, Zhejiang Agriculture and Forestry University, China
Enrico Vito Perrino, University of Foggia, Italy
Copyright © 2025 Jordan and Leebens-Mack. This is an open-access article distributed under the terms of the Creative Commons Attribution License (CC BY). The use, distribution or reproduction in other forums is permitted, provided the original author(s) and the copyright owner(s) are credited and that the original publication in this journal is cited, in accordance with accepted academic practice. No use, distribution or reproduction is permitted which does not comply with these terms.
*Correspondence: James H. Leebens-Mack, amxlZWJlbnNtYWNrQHVnYS5lZHU=