 Wenjuan Yu
 Oliver Körner
 Uwe Schmidt
- 1Department of Biosystems Engineering, Humboldt University of Berlin, Berlin, Germany
- 2Next-Generation Horticultural Systems, Leibniz-Institute of Vegetable and Ornamental Crops (IGZ), Grossbeeren, Germany
Combining information of plant physiological processes with climate control systems can improve control accuracy in controlled environments as greenhouses and plant factories. Through that, resource optimization can be achieved. To predict the plant physiological processes and implement them in control actions of interest, a reliable monitoring system and a capable control system are needed. In this paper, we focused on the option to use real-time crop monitoring for precision climate control in greenhouses. For that, we studied the processes and external factors influencing leaf net CO2 assimilation rate (AL, µmol CO2 m-2 s-1) as possible variables of a plant performance indicator. While measured greenhouse environmental variables such as light, temperature, or humidity showed a direct relation between AL and light-quantum yield of photosystem II (Φ2), we defined three objectives: (1) to explore the relationship between climate variables and AL, as well as Φ2; (2) create a simple and reliable method for real‐time prediction of AL with continuously Φ2 measurements; and (3) calibrate parameters to predict chloroplast electron transport rate as input in AL modelling. Due to practical obstacles in measuring CO2 gas-exchange in commercial production, we explored a method to predict AL by measuring Φ2 of leaves in a commercial hydroponic greenhouse tomato crop (“Pureza”). We calculated AL with two different approaches based on either the negative exponential response model with simplified biochemical equations (marked as Model I) or the non-rectangular hyperbola full biochemical photosynthetic models (marked as Model II). Using Model I can only be used to predict AL with large uncertainty (R2 0.64; RMSE 2.21), while using Φ2 as input to Model II could be used to improve the prediction accuracy of AL (R2 0.71; RMSE 1.98). Our results suggests that (1) Φ2 light signals can be used to predict net photosynthesis rate with high accuracy; (2) a parameterized photosynthetic electron transport rate model is suitable predicting measured electron transport rate (J) and AL. The system can be used as decision support system (DSS) for plant and crop performance monitoring when leaf-dynamics are up-scaled to the plant or crop level.
Introduction
In modern greenhouses and plant factories plant cultivation is usually done with computerized environmental climate control. To achieve the desired climate, a great variety of controllers and actuators are used (Körner and Van Straten, 2008; Rytter et al., 2012; Shamshiri et al., 2017; Gurban and Andreescu, 2018; Ramin et al., 2018), often supported by model-based decision support systems (DSS) (e.g. Körner, 2019). Although sensor-based monitoring and real-time model predictions strongly improved early warning and greenhouse climate control (Körner and Hansen, 2012; Mahlein, 2015; Körner, 2019), real-time crop monitoring still suffers from inadequate equipment and/or insufficiently model quality. The realization of soft-sensors (i.e. mathematical models using real-time sensor data) (De Koning, 2006) with deterministic explanatory models in greenhouse cultivation monitoring is still under development. In here, robust and simple sensors combined with models calibrated with data from laboratory experiments would be the most suitable approach to implement physiological based automatic control system in the greenhouse (Janka et al., 2013; Körner, 2019). To achieve that, a reliable system with both measured and modelled plant physiological parameters is needed.
Plant photosynthesis is a physiological process suitable to be used in DSS-development with monitoring and assessment tools. A monitoring system, initially based on measuring leaf net CO2 exchange (AL), was used as starting point in this study (BERMONIS, Steinbeis GmbH & Co. KG for Technology Transfer, Berlin, Germany). BERMONIS is real time photosynthesis monitoring system developed for long-time continuously measurement leaf gas exchange (Schmidt, 1998; Schmidt, 2005). The system can be used to up-scale multiple measured single leaf AL to crop photosynthesis (Acrop, µmol CO2 m-2 s-1) by considering the variations of both light distribution and specific leaf photosynthetic capacity within the plants' canopy; e.g. Huber (2011) used BERMONIS in combination with psychrometric charts to detect and follow the “comfort zone” for an adult tomato crop in real-time.
Another widely used and accepted approach to measure plant photosynthetic productivity is chlorophyll fluorescence analysis (CFA). With the pulse amplitude modulation method of CFA (PAM), the light beams are modulated and the system detects fluorescence excited by the measuring light in the presence of background illumination (Schreiber, 1986; Schreiber et al., 1986; Govindjee, 1995; Schreiber, 2004; Baker, 2008; Tschiersch et al., 2017). Its small size, ease to transfer, and high sensitivity have made PAM-CFA a widely accepted method for plant stress detection (Lawlor, 1995; Cornic and Massacci, 1996; Flexas et al., 1998; Flexas et al., 2000; Lawlor and Cornic, 2002). In comparison to the gas exchange method used for plant photosynthetic productivity measurements, CFA is more sensitive to plant water deficit: Water deficit leads to closed stomata that limits CO2 uptake, followed by reduced energy use and excessive light energy absorption. This results in an activated protection mechanism and increase of non-photochemical quenching (NPQ), which is one of the main variables used in CFA. This process is commonly faster than gas exchange (Herppich et al., 1996; Herppich and Peckmann, 1997; Herppich and Peckmann, 2000). Therefore, it is of great practical significance to apply CFA parameters to simulate the CO2 assimilation of plant leaves (Krall and Edwards, 1992; Edwards and Baker, 1993; Von Caemmerer, 2013). In addition, CFA can solve the problem of inconvenient operation of leaf gas-exchange measurement in production, for example, the installation of leaf chambers (e.g. BERMONIS) and the inspection of their air tightness (the main obstacles of leaf gas exchange in commercial greenhouse production). While both methods are suitable to measure plant photosynthetic productivity (each with pros and cons), the cuvette based leaf gas exchange measuring method delivers direct measurement response, while CFA is an indirect procedure but with a faster response in some situations.
With the underlying physiological process of plant photosynthesis, CFA provides insights into the relationship between chloroplast electron transport rates and carbon metabolism. Some scholars reported that CFA parameters could be used to indirect predict AL by measuring the electron transport rateof PSII (Jf) as under some conditions a linear relationship between AL and Jf exists (Krall and Edwards, 1992; Herppich and Peckmann, 2000; Yin and Struik, 2009). In addition, quantum yield of PSII (Φ2) shows linear correlated with quantum yield of CO2 fixation (Edwards and Baker, 1993). These results are often obtained under favorable experimental conditions, e.g. when light radiation (I, µmol m-2 s-1) linearly increases during controlled light response curve measurements.
This study provides a valuable data set of photosynthetic physiological responses of plants in a dynamic production environment. Furthermore, it provides a method for estimating AL by using the chlorophyll fluorescence parameters, and provides an approach for maximizing photosynthesis by manipulating the environmental conditions with real-time detection of limiting factors of leaf photosynthesis in greenhouse environments.
Materials and Methods
Model Background
Around four decades ago a nowadays widely used biochemical photosynthesis model was proposed (Farquhar et al., 1980) (hereafter “FvCB model”). This model estimates AL as minimum of the Rubisco limited rate (Ac, µmol CO2 m-2 s-1), the electron (e-) transport limited rate (Aj, µmol CO2 m-2 s-1), and the triose phosphate utilization limited rate (Ap, µmol CO2 m-2 s-1) of CO2 assimilation (Eqn. 1). Abbreviations for parameters are defined in Table 1.
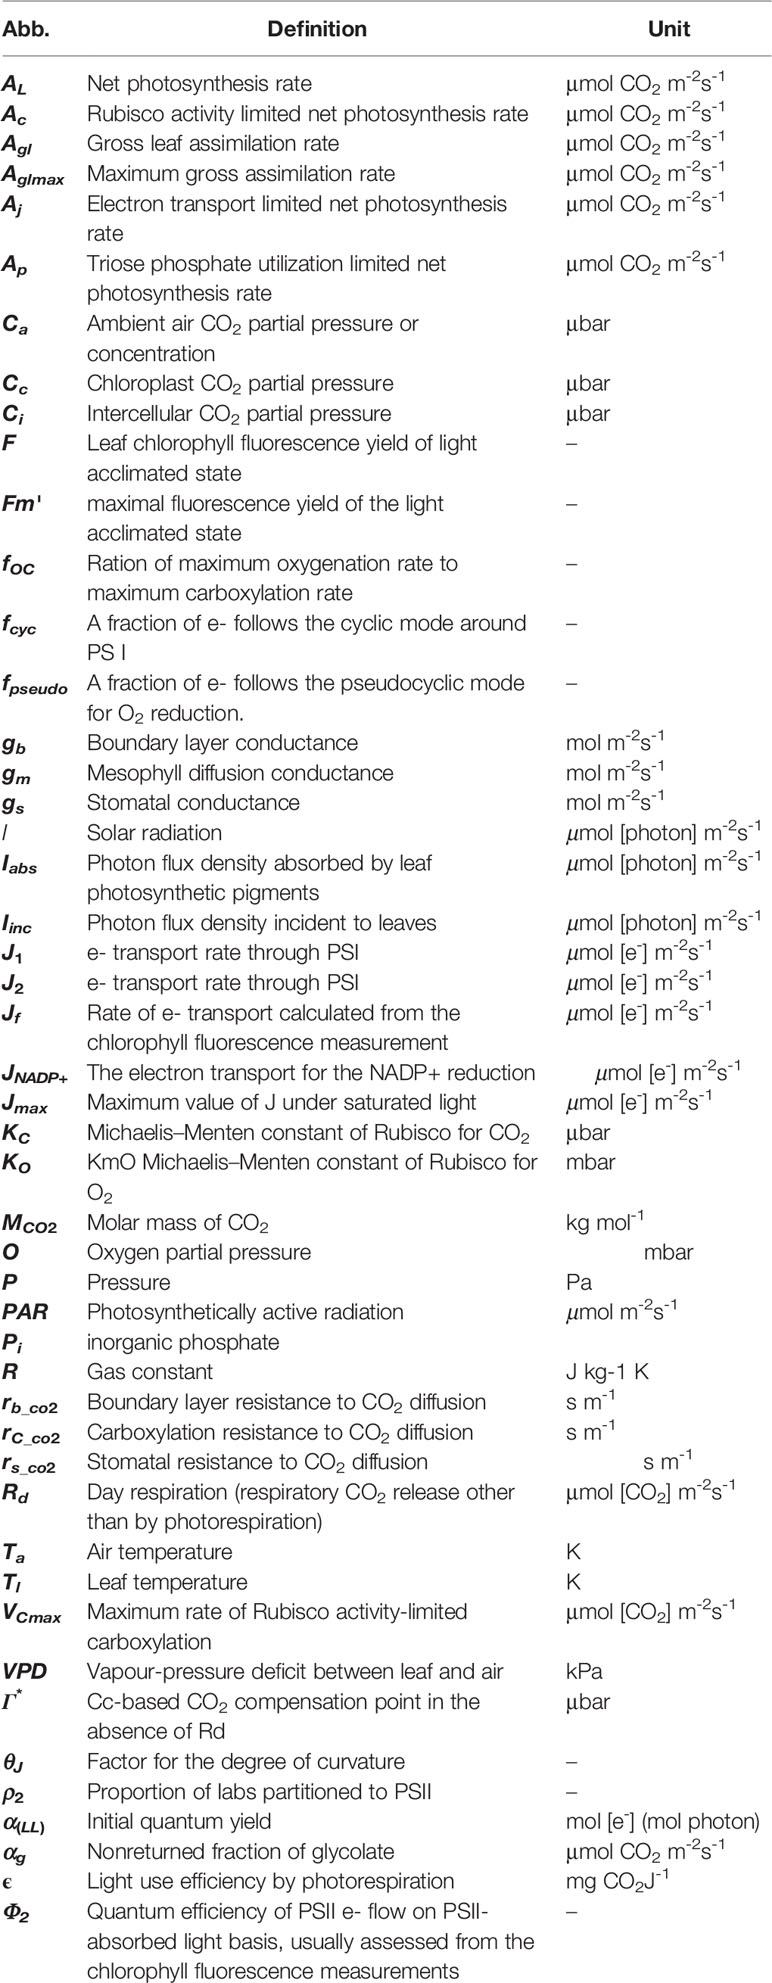
Table 1 Abbreviation used in this study.
The value of Rubisco limited rate (Ac) is calculated as a function of the maximum carboxylation rate (VCmax)
where Cc is the CO2 partial pressure at the carboxylation sites of Rubisco, KmC and KmO are Michaelis-Menten constants of Rubisco for CO2 and O2, respectively (Farquhar et al., 1980). Rd is the mitochondrial respiration of leaves.
According to the usage of energy suppliers NADPH and ATP, two similar equations with different parameter values (Eqns. 3 and 4) were used to estimate the RuBP-regeneration limitation, which is a function of the electron (e-) transport J:
Theoretically, J can be assessed by CFA (then J becomes Jf). Jf is given by:
where abs is the proportion of incident light that is absorbed by the leaf. It is frequently assumed to be 0.84 (Maxwell and Johnson, 2000) or 0.85 (Von Caemmerer, 2000); ρ2, is the fraction of absorbed light transported to PSII (frequently assumed to be 0.48; Von Caemmerer, 2000).
Jf is assumed equal to the rate of e- transport through PSII (J2), while J2 is the rate of e- transport through PSI. The rate of cyclic e- transport Jcyc is fcyc·J1, where fcyc is a fraction of e- follows the cyclic path (see Figure 1). This leads to the following balance as proposed by Yin et al. (2004).
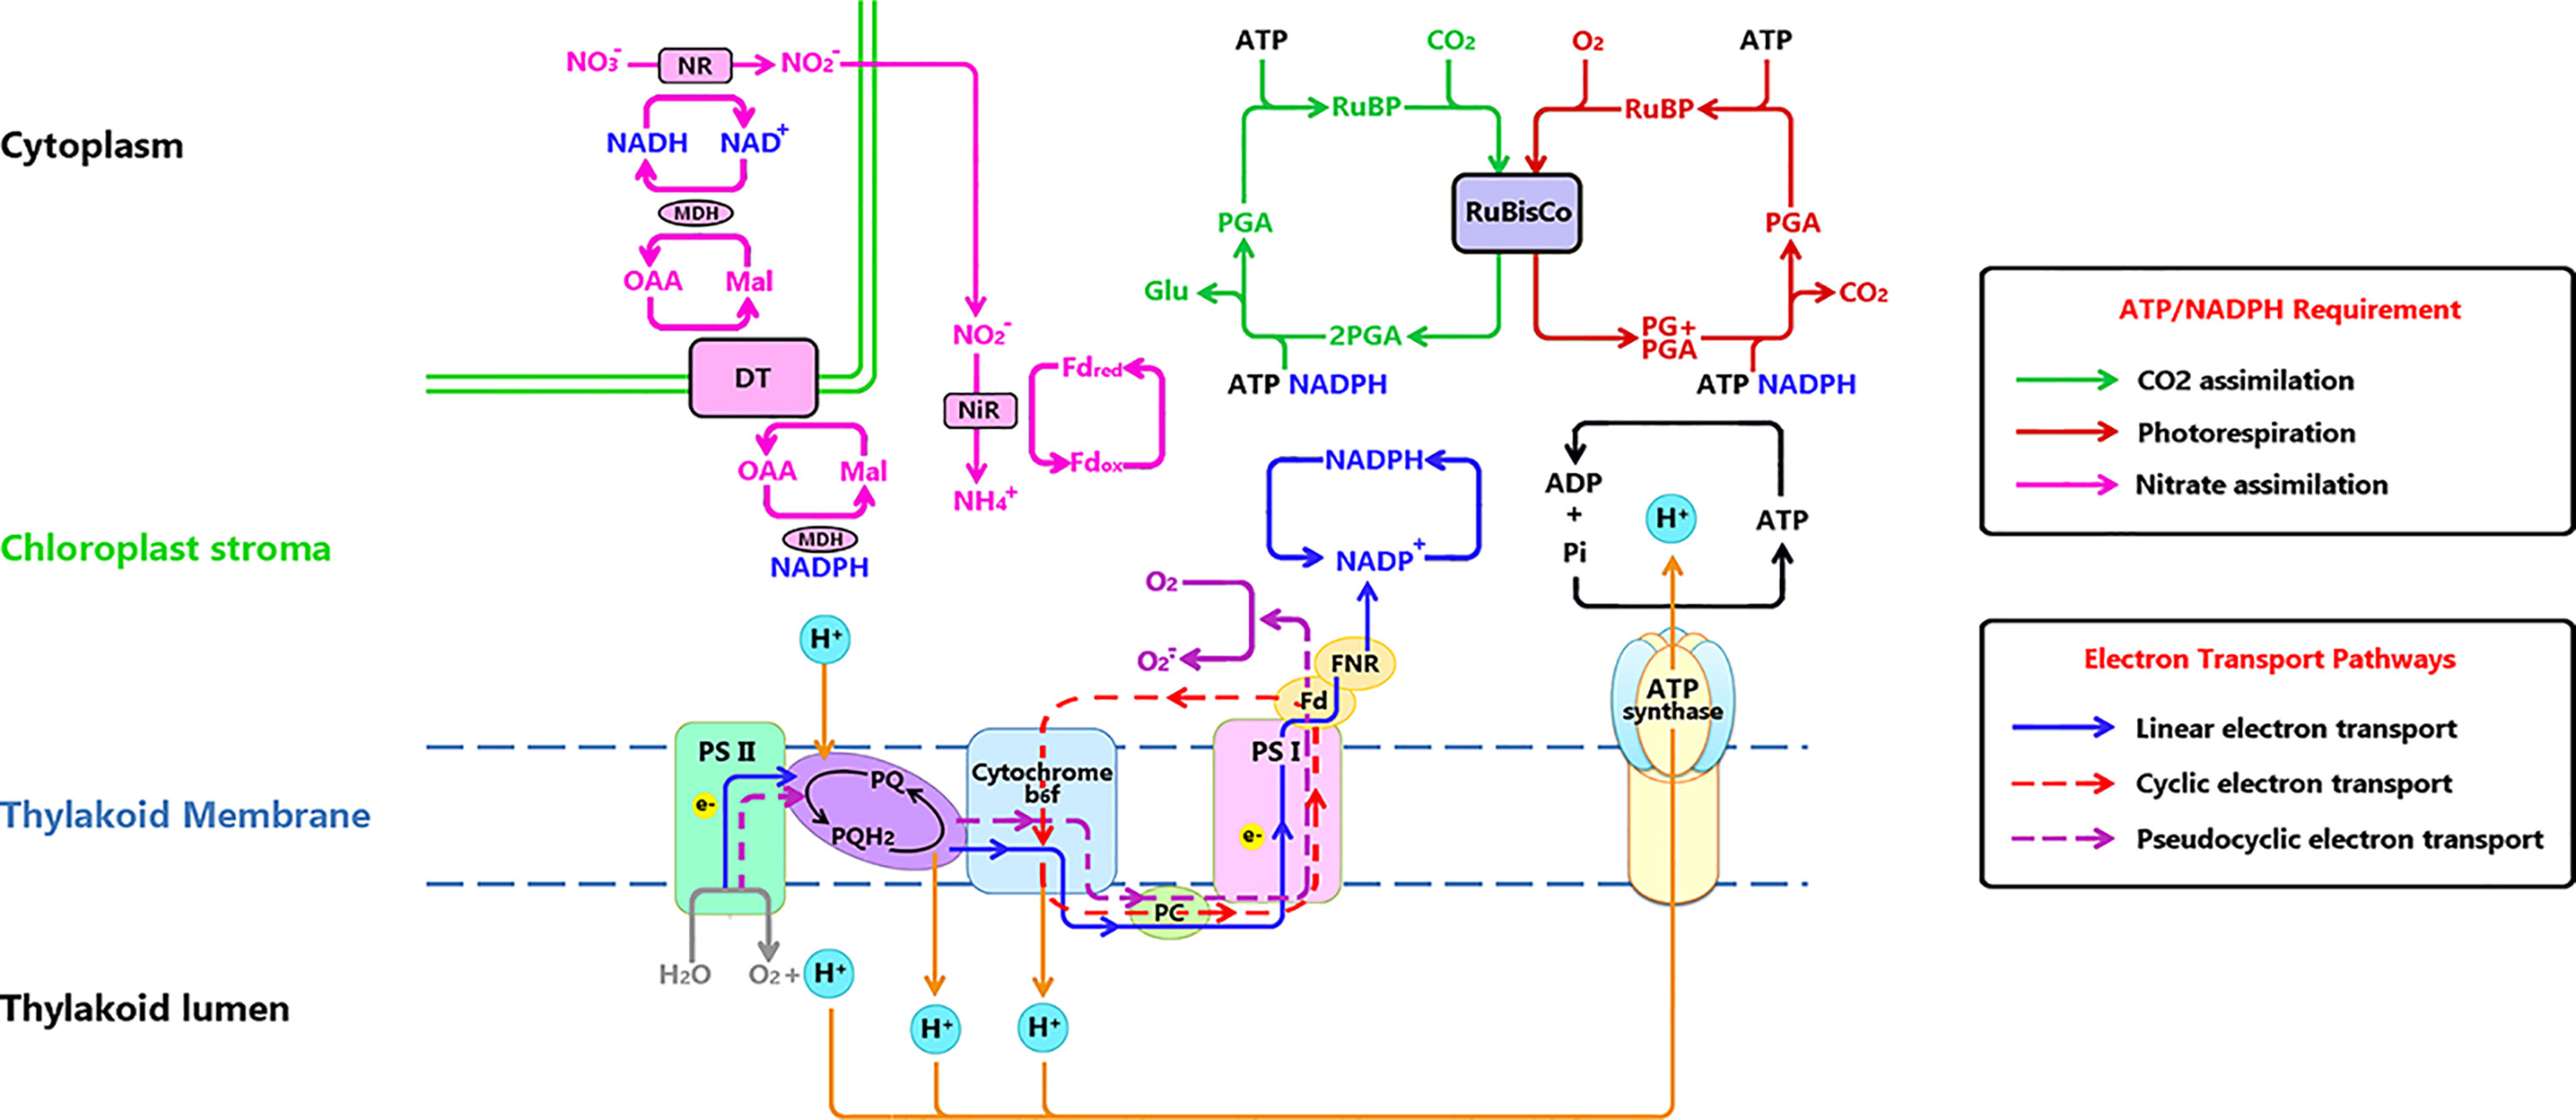
Figure 1 Electron transport chain on thylakoid membrane and related metabolisms. Three electron transport paths on thylakoid membrane: Linear electron transport (LET) (marked with blue line) is the electron (e-) flow transferred to NADP+, the end acceptor of LET for generating NADPH for CO2 reduction or photorespiration. Cyclic electron transport (CET) (marked with red dashed line) is the e- flow transferred alone PSI, cytochrome b6f, plastocyanin back to PSI. Pseudocyclic electron transport (PET) (marked with purple dashed line) functions similar to LET, while the final e- acceptor is O2. ATP and NADPH (originating from e- transport), are used to drive CO2 assimilation in the Calvin Cycle (green line), photorespiration (dark red line) and NO3 assimilation (pink line). Notations: DT, Dicarboxylic acid transporter; Fd, Ferredoxin; FNR, Ferredoxin reduction system; Glu, glucose; RuBP, Mal, malic; MDH, Malate dehydrogenase; NIR, Nitrite reductase; NR, nitrate reductase; OAA, oxalocetate; PC, plastocyanin; PG, phosphoglycolate; PGA, phosphoglyceric acid; Pi, inorganic phosphate; PQ, plastoquinone; Ribulose-1,5-bisphosphate.
We define all electron transport through PSI reaction center as 1, as well as the fractions e- for the cyclic and pseudocyclic paths (fcyc or fpseudo, respectively). The remaining fraction (1– fcyc – fpsedo) is transferred to NADP+. The electron transport for NADP+ reduction can thus be formulated as:
Combining Eqn. (5-1) and Eqn. (5-2), Eqn. (5-3) can be derived.
We assume the environment is steady state, the pseudocyclic path, which may occur at high light condition to produce oxygen radicals () is not considered, in this study (fpseudo = 0), means that:
Finally, at high CO2 partial pressure (particularly in combination with high radiation) the rate of AL is sometimes limited by the release of inorganic phosphate (Pi). Starch and sucrose synthesis may become inadequate to recycle the Pi sequestered in the production of triose phosphates, in which case Pi may become limiting (Woodrow and Berry, 1988; Harley and Sharkey, 1991; Lombardozzi et al., 2018). The Pi limited part of AL (Ap) is calculated as:
Where Tp is the triose-phosphate use (TPU) rate and αg is the non-returned fraction of glycolate.
In Eqns. 2 to 4 and Eqn. 6, the CO2 concentration on the chloroplast side (Cc, µmol mol-1) is calculated from the pathway of ambient CO2 (Ca, µmol mol-1) through leaf surface (Cs, µmol mol-1) and intercellular air spaces (Ci, µmol mol-1) to the chloroplast (Flexas et al., 2008; Flexas et al., 2012).
The leaf conductances to CO2, i.e. boundary layer conductance (gb, mmol CO2 m-2 s-1), stomatal conductance (gs, mmol CO2 m-2 s-1) and mesophyll conductance (gm, mmol CO2 m-2 s-1) are factors influencing Cc. (Yin et al., 2009a) Due to the complicated leaf gas-exchange measurements for gm estimation, intercellular CO2 concentration is commonly assumed as: Ci = Cc (Farquhar et al., 1980; Ethier and Livingston, 2004; Manter and Kerrigan, 2004; Sun et al., 2014). However, as gm is a major variable in photosynthesis, neglecting gm will result in inaccurate prediction of AL (Nobel, 1977; Nobel, 1983; Warren, 2006; Pons et al., 2009; Yin and Struik, 2009; Yin et al., 2009a; Yin and Struik, 2012). The influence of this potential error in prediction AL has been considered and discussed in this study.
Two equations (Eqns. 3 and 4) were used to simulate electron transport limitation. The detailed derivation process is well described by Von Caemmerer (2000) and Yin et al. (2004). To simplify, in the production of NADPH and ATP, electron transport and the concomitant proton transfer in the chloroplast thylakoids are central processes. Carboxylation and oxygenation in C3 metabolic reactions requires NADPH and ATP. Farquhar proposed that each carboxylation requires 2 NADPH and 3 ATP, and each oxygenation requires 2 NADPH and 3.5 ATP. In Eqn. 3, the regeneration of RuBP is assumed restricted by NADPH, the rate of whole chain electron transport required to support NADPH consumption by the photosynthetic carbon reduction (PCR) and photorespiratory carbon oxidation (PCO) cycles during CO2 fixation (Von Caemmerer and Farquhar, 1981; Dubois et al., 2007; Sharkey et al., 2007). Therefore, oxygenation to carboxylation ratio is given by 2 Г*/Ci (Farquhar and von Caemmerer, 1982). The rate of NADPH consumption can be expressed as (2 + 4Г*/Ci)Vc, where Vc is the rate of carboxylation. Since the reduction of one NADP+ to NADPH requires two e-, the rate of e- transport for satisfying the NADPH requirement is (4 + 8Г*/Ci) Vc (Figure 2).
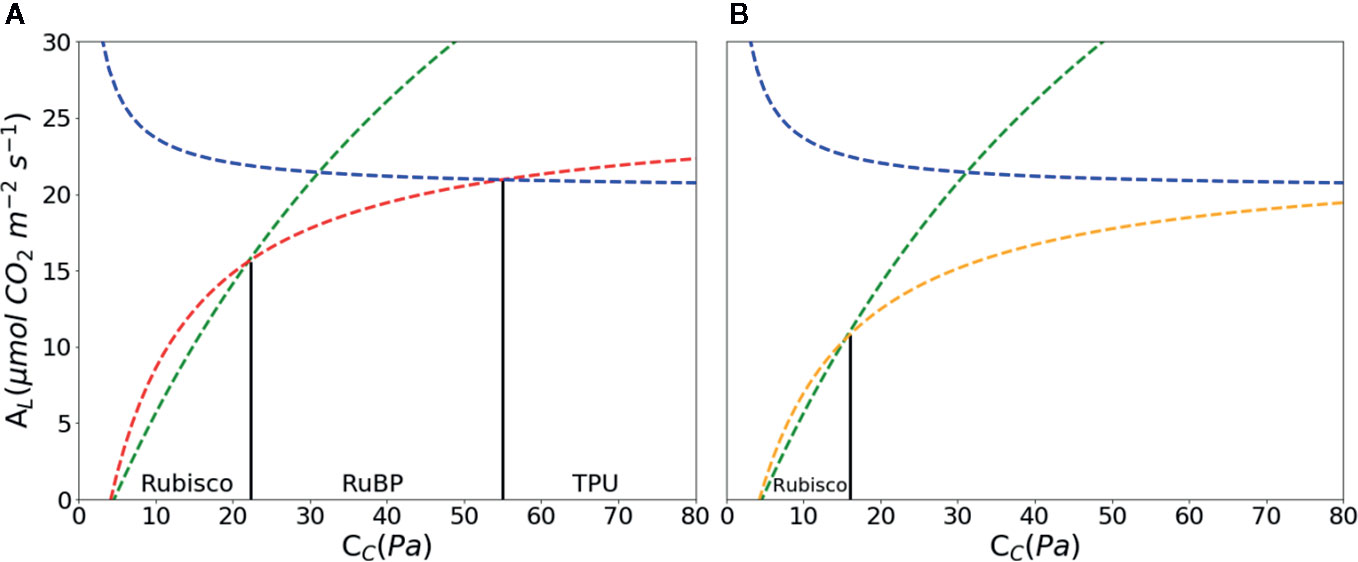
Figure 2 CO2 assimilation (A) as a function of chloroplast partial pressure of CO2 (CC) according to the FvCB model. With increasing Cc, AL is limited by ribulose-1, 5-bisphosphate (RuBP) carboxylase/oxygenase (Rubisco) marked with green, RuBP marked with red in A and orange in B; triose-phosphate utilization (TPU) marked with blue, respectively. Rubisco kinetics parameters were using values of Table 1 in Sharkey et al. (2007): KC = 27.24 Pa, KO = 16.58 kPa, O = 21 kPa, Γ* = 3.74 Pa. Other parameters: Rd = 1.0 μmol·m–2·s–1, VCmax = 97.0 μmol·m–2·s–1, Jmax = 144.0 μmol·m–2·s–1, Tp = 7.1 μmol·m–2·s–1, αg = 0.15 μmol CO2 m-2s-1. Abbreviations for parameters are defined in Table 1. The RuBP limitation is calculated with Eqn. 3 (A) and Eqn. 4 (B).
In Eqn. 4, the regeneration of RuBP is not only limited by NADPH, but also by ATP (Von Caemmerer and Farquhar, 1981; Bernacchi et al., 2003; Long and Bernacchi, 2003; Yin and Struik, 2009). The rate of ATP consumption in C3 reaction is (3 + 7Г*/Ci) Vc. The FvCB model assumes that 3 H+ are required for the photophosphorylation of 1 ADP to 1 ATP. Therefore, the flow of one e- via the linear chain produces 2/3 ATP. Assuming ATP is produced by the linear e- transport alone, the required rate of the linear e- flow is (4.5 + 10.5Г*/Ci) Vc (Figure 2) (Yin et al., 2004).
One key point of this study is the use of CFA to predict AL. Foyer and Noctor, 2002 Since the Mehler reaction (Mehler, 1951) is not subject to this study, we solely use the linear electron transport of steady state photosynthesis in Eqns. 3 and 4. ATP and NADPH are used to drive the CO2 assimilation, photorespiration and assimilation (see Figure 1) (Robinson, 1987; Noctor and Foyer, 1998; Foyer and Noctor, 2002; Allen, 2003). In that, the assimilation of has a lower requirement of ATP/NADPH, and furthermore, the reducing power for assimilation may not directly originate from the chloroplast (Miflin, 1974; Yin et al., 2006; Walker et al., 2014). Meanwhile, whether the reductants and energy is come from linear electron transport is still unclear. The ferredoxin, NADPH, and ATP may partly be produced by cyclic or pseudocyclic electron flow. And the fraction for nitrate reduction is not a constant. It may depend on species, nutrient supply and growth stage (Yin et al., 2006). Due to the difficult endeavor of quantifying the proportion of electron flow for nitrate reduction in real time and the small proportion of it, the electron flow for assimilation was not considered in this study.
Plant Material, Growth Conditions
One hundred and forty-four tomato plants (cv. “Pureza”) were cultivated in February 2016 in a 62.6 m2 Venlo-type greenhouse at a commercial grower in Abtshagen, Germany (52°31'12.025'' N; 13°24'17.834'' E). The greenhouse had a side wall height of 4.2 m, equipped with double glass and single glass in the roof. The internal construction consisted of two double gutters in the middle and two single gutters beside the walls. Plants were planted in rock wools slabs with a common drip irrigation system. Seed was placed on rock-wall cubes on January 23rd 2016 and young plants were placed on the rock wools slabs two weeks after. Three weeks after transplanting, the measurements started. Temperature and humidity were controlled with pipe heating and passive roof ventilation. Set points for heating system were defined as 22 and 18°C for day and night, respectively; ventilation set point was 21°C day and night between April and October and 26°C for the rest of the year. The energy screen was unfolded one hour before sunrise and folded one hour after sunset. Between 7 a.m. and 8 p.m. supplementary light (high-pressure sodium lamps, HPSL) started when global radiations outside the greenhouse was below 20 W m-2. Water and nutrients were adequately supplied to the needs of the crop. Nutrient solution was adjusted with mineral fertilizer to an electric conductivity (EC) of 1.8 dS m−1 and a pH of 6.5. The nutrient concentration was used according to Lattauschke (2004) (Table 2).
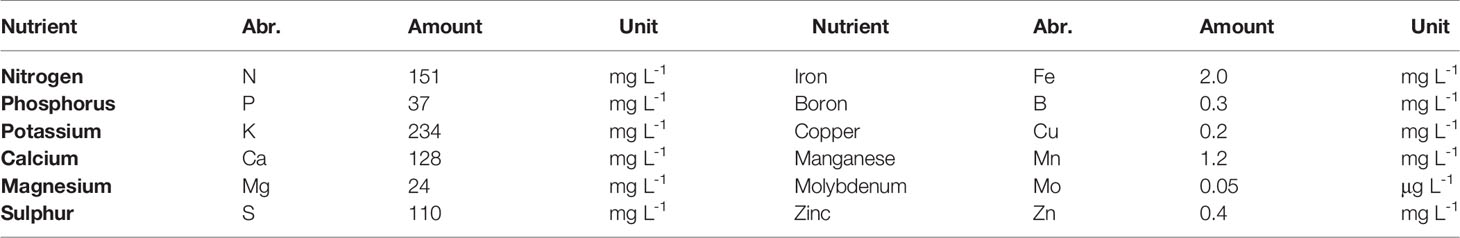
Table 2 Nutrient concentration for greenhouse tomato used in this study.
Environment and Plant Photosynthesis Monitoring
The environmental variables air temperature, relative humidity, light, and CO2 concentration (Ta, RH, I, and [CO2], respectively) were recorded by a commercial greenhouse monitoring system (Growwatch, Fytagoras BV, Leiden, The Netherlands). In this system, plant photosynthetic active radiation (PAR) was measured (Li-190R, LICOR, Lincoln, Nebraska, USA) as photosynthetically photon flux density (PPFD, µmol m-2 s-1). The monitoring system was placed on an uncovered area (right next to the plant) at the height of the seventh unfolded leaf (calculated from the top, the fifth leaf was usually the first mature leaf). Ta and RH were measured by a commercial sensor for volume applications (HMP60, VAISALA, Helsinki, Finland). Leaf temperature (Tl) of each seventh leaf of four plants was measured with an infrared radiation thermometer (CT11, HEITRONICS Infrarot Messtechnik, Wiesbaden, Germany). All variables were continuously measured and averaged over 5 min and stored on a central server. Outliers were detected according to Tukey (1977), i.e. an outlier is defined as a value that is smaller than the lower quartile minus 3 times the interquartile range, or larger than the upper quartile plus 3 times the interquartile range. Outliers and invalid measurements due to sensor calibration or failure were removed from the original data-set (Grubbs, 1950; Aggarwal and Yu, 2005). Scattered data outliers within PAR measurements as artifact based on sudden shade incidences hitting the PAR point-sensors during direct sunlight conditions (due to shade-spots of the greenhouse construction) were filtered with Savitzky-Golay filter (with order=3, window=21) (Orfanidis, 2006; Miranda, 2017); i.e., a mathematical procedure for smoothing data in order to increase data precision.
Leaf CO2 gas-exchange (GE) was recorded by the BERMONIS system, measuring the lump-sum of CO2 gas exchange of eight leaves and calculated to an averaged AL. Likewise, measurements of Tl, the eight cuvettes were set at each seventh leaf of four plants. On each plant two opposing leaflets were used resulting in two cuvettes per plant. The fully expanded leaves were placed into the cuvettes (acting as transparent leaf chambers) with the leaves face-up, the metal frame supported the cuvettes in a horizontal position. A pilot experiment demonstrated the functionality of BERMONIS to commercial instruments (Supplementary Material A).
Leaf chlorophyll fluorescence yield of light acclimated state (F, -), and maximal fluorescence yield of the light acclimated state (Fm′, -) were measured with a PAM monitor (Monitoring PAM, Walz, Effeltrich, Germany). The sensor was likewise BERMONIS set on the seventh leaves (on different plants). For that, F and Fm′ were measured in the same time and quantum efficiency of PSII e- flow on Φ2 of the leaf was calculated (Krause and Weis, 1984):
The sensors were re-placed to new leaves after two weeks. Recorded data are shown in Supplementary Material B.
Model Development
A complete data set with environmental variables (Ta, Tl, RH, I, and [CO2]), mean AL, and Φ2 was established for model validation and parameters calibration in this study and structured as shown in Figure 3. Four models were compared in this study: Model I, Model IIa and Model IIb, and Model IIb* used in greenhouse leaf photosynthesis modelling (Table 3). Model I is the negative exponential light response commonly used in greenhouse leaf photosynthesis modelling (Thornley, 1976; Gijzen, 1992; Goudriaan and Van Laar, 1994; Körner et al., 2002; Körner, 2004). Model IIa and IIb use Model I as basis and further employ the complete FvCB model with two different equation to estimate Aj. In these models, J is estimated by detected Φ2 (Eqn. 5). In Model IIb*, J is calculated with the non-rectangular hyperbolar curve (Eqn. 10).
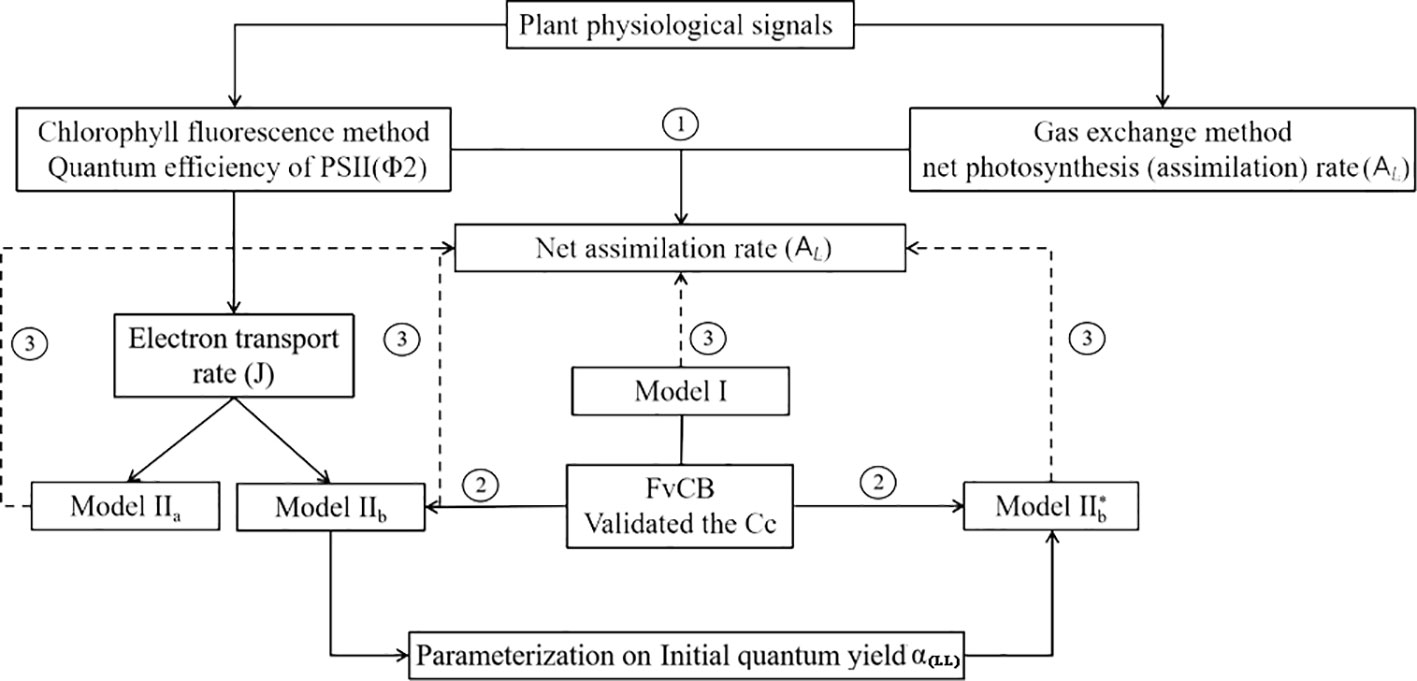
Figure 3 (1) Evaluation of two photosynthesis indicators with environmental factors; (2) Establishment of models: Model IIa and Model IIb, a coupled model with common model (Model I) with FvCB model. In Model IIa Aj is calculated with Eqn. (3), whereas in Model IIb Aj is calculated with Eqn. (4), in both models J is calculated by measured Φ2. In Model IIb* J is predicted with a non-rectangular hyperbolar curve Eqn. (10); (3) Evaluation of the three models with observed data.
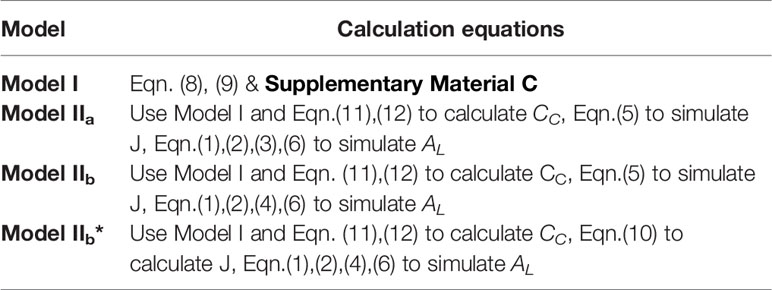
Table 3 A summary of model formulas.
Model I
In Model I, AL is determined from gross leaf assimilation rate (Agl, µmol CO2 m-2 s-1) minus leaf day respiration (Rd, µmol CO2 m-2 s-1).
Agl is determined from light use efficiency ϵ and maximum gross assimilation rate Aglmax with the negative exponential light-response curve (Goudriaan and Van Laar, 1994) using absorbed radiation (Iabs) as input.
This leaf photosynthesis light response model is commonly used to upscale leaf photosynthesis to the crop level (Acrop) considering light distribution with Gaussian integration over the crop depth (Goudriaan and Van Laar, 1994). It is commonly used as basic photosynthesis model in many crop growth models for yield estimation (Spitters et al., 1989; Hoogenboom et al., 1990; Jones et al., 1991; Heuvelink, 1996). The description of the biochemical processes is simplified. The key parameters in this model could be identified by curve fitting or converted from VCmax or Jmax. Detailed equations are shown in Supplementary Material C.
Model IIa/IIb
The steady-state version of the FvCB model has had the strongest impact and has become the standard model for photosynthesis of C3 species (Sharkey, 1984; Sharkey, 1985; Farquhar et al., 2001; Long and Bernacchi, 2003). The models predicts photosynthesis as the minimum of the Ac, Aj, Ap (Eqn. 1, see Section Model background). In both Models IIa and IIb, J is assessed by chlorophyll fluorescence Jf. While Model IIa includes Eqn. 3, Model IIb is using Eqn. 4 for Aj simulation.
Model IIb*
In Model IIb*, J is calculated with a non-rectangular hyperbolic curve of incident light (Farquhar and Wong, 1984). Solely environmental variables were used for parameter fitting of Model IIb*.
where Iabs µmol [ photon ] m−2s−1 is the absorbed light; α(LL) is a factor covert absorbed light to the useful light absorbed by PSII. Therefore, α(LL)·Iabs represents light absorbed by PSII. θJ is a factor for the degree of curvature, assumed as 0.85 (Ögren and Evans, 1993; Von Caemmerer, 2000; Ethier et al., 2006).
Estimating Chloroplast CO2 Partial Pressure
CC is derived from the pathway of CO2 from ambient Ca through leaf surface Cs and intercellular air spaces (Ci). Here, gb, gs and gm are indicated (Flexas et al., 2008). We analyzed the predicted results with and without calculated gm. According to Fick's first law of diffusion for CO2 transfer along the path from Ca to Cc is given by:
As shown in Eqns. 11 and 12, AL is required to be known a priori. To avoid infinite circulation of variables, the initial estimated AL rate of Model I is used as starting point for Cc and Ci calculation.
In some calculations, Ci is treated equal to Cc (Leuning, 2010) and it was suggested setting gm to be finite large (gm→∞) (Björkman, 1973; Laisk et al., 2005). Then Eqn. 11 can be re-formulated to Eqn. 12 and thus the need for gm will be redundant:
We propose the Jarvis model as sub-model for gb and gs.
Where P/RT is the coefficient used to convert the resistance units (s m-1) to molar units. rb_CO2 and rs_CO2 are the boundary-layer resistance and stomatal resistance respectively (Supplementary Material C).
Goudriaan and Van Laar (1994) suggested an equation for calculating carboxylation resistance (rC_CO2). In theory, rC_CO2 can be used to calculate gm as:
Consequently, the CO2 partial pressure within the chloroplast was calculated with and without inclusion of gm and the respective results were compared. In this context CC was calculated as:
1. Without gm, assuming that gm→∞; (See Eqn. 13)
2. With gm based on the inverse rC_CO2, namely gm=f(rC_co2) (rC_co2 see Supplementary Material C)
3. With a hypothetical value, from the perspective of optimal fitting of the model, set gm as 0.25 mol m-2 s-1. This value (gm = 0.25 mol m-2 s-1) is consistent with an average mesophyll conductance of annuals herbaceous (Flexas et al., 2008; Yin et al., 2009b).
Estimating the Rate of Photosynthetic Electron Transport
The value of α(LL) differs among published literature in e.g. Von Caemmerer, 2000; Niinemets et al. (2009), or Yin et al. (2009b). Three values of α(LL) were compared: two values were reported in literatures (Niinemets et al., 2009; Yin et al., 2009b); one value was estimated with the parameter optimization method in this study (α(LL) = 0.405).
Curve fitting was used for parameter estimation of gm and α(LL). The nonlinear least squares procedure available in python scipy.optimize tool box (function leastsq) was applied to minimize the sum of the residuals between measured data and predicted data (Madsen et al., 2004; Wallach et al., 2006; Salazar-Moreno et al., 2017).
Model-Parameterization
The biochemical parameters VCmax (μmol m-2 s-1) and Jmax (μmol m-2 s-1) were assessed with an open leaf gas exchange measuring system (LI-6400, Li-Cor Inc., Lincoln, Nebraska, USA). The system was used to create CO2-response curves (commonly referred to as A-Ci curve) at a CO2 concentration set at a course of different set points (i.e. 400, 350, 300, 250, 200, 100, 400, 450, 500, 550, 600, 800, 1,000 μmol mol-1), while keeping PAR at 1,500 μmol m-2 s-1 PPFD. Measurements were made at pre-set leaf temperature set points of 25°C and the system was set such that each CO2 level was reached constant for several seconds and the measurement was recorded at this point. Data of the three measurements were averaged for further calculations. The A-Ci curve fitting was carried out using the Ethier and Livingston method (Ethier and Livingston, 2004; Ethier et al., 2006).
Statistical Analysis and Model Performance
For all statistical analyses, the statistical software package SPSS was used (version 23.0, UNICOM Global, CA, USA). Multiple linear regression (MLR) was used for examining A and Φ2 response to multi-environmental variables: air temperature (Ta, K), vapour pressure deficit (VPD, kPa) and PAR. The coefficient of determination (R2), root mean squared error (RMSE), and mean absolute error (MAE) were used to analyze the goodness-of-fit between the simulated value and the measured value. RMSE and MAE were used to evaluate the model performance. The smaller the RMSE and MAE value, the better the consistency between the simulated and the measured value, thus the more accurate and reliable the model prediction becomes (Chai and Draxler, 2014).
Results
Evaluation of Physiological Signals
Photosynthetic signals are indicators of plant health and can be used as variables to formulate control strategies, when compared with the expected optimum at current environmental conditions. For multi linear regression, the collinearity of factors needs to be taken into account. These environmental factors meet the collinearity diagnostics with the variance inflation factor less than 10 (data not shown). The resulting regression equations are presented in Table 4. The results showed that the environmental variables can better explain the variation of AL than the variation in Φ2: 61.5% of the variation of AL could be assessed by Ta, VPD, and I, whereas only 50.2% of Φ2 variation can be assessed by environmental factors Thus, in our measurements AL is a better suited to evaluate plant responses to the environmental factors than Φ2.
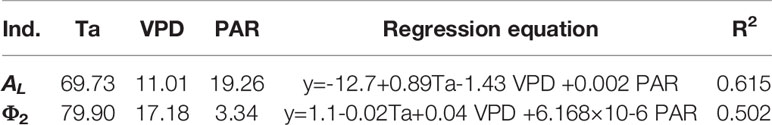
Table 4 Multiple linear regression: the environmental variables explain variance in AL andΦ2.
Model Validation and Parameters Calibration
In the present study, the method proposed by Ethier and Livingston (2004) was used to identify the biochemical parameters VCmax, Jmax, Rd. With a well-fitting result (R2 = 0.99; Figure 4). VCmax25 = 71.0 μmol m-2 s-1, Jmax25 =147.7 μmol m-2 s-1, and Rd25 = -0.34 μmol m-2 s-1 were used in the further modelling framework.
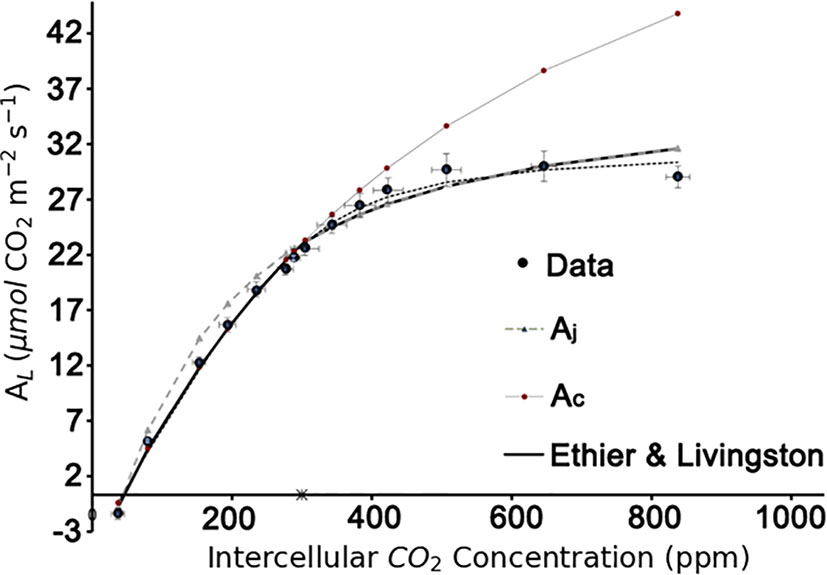
Figure 4 Estimation of the biochemical parameters by A-Ci curve fitting based on the Ethier-Livingston method. Data points represent the mean value of three leaf replicates.
From Figure 5 and Table 5, it is evident that calibrated gm improved the prediction quality with the highest coefficient of determination (R2), and achieved the lowest RMSE. Considering gm infinite, the simulation results are overestimated. gm, based on optimal fitting, equal to 0.25, achieved the highest R2 and the lowest RMSE and MAE.
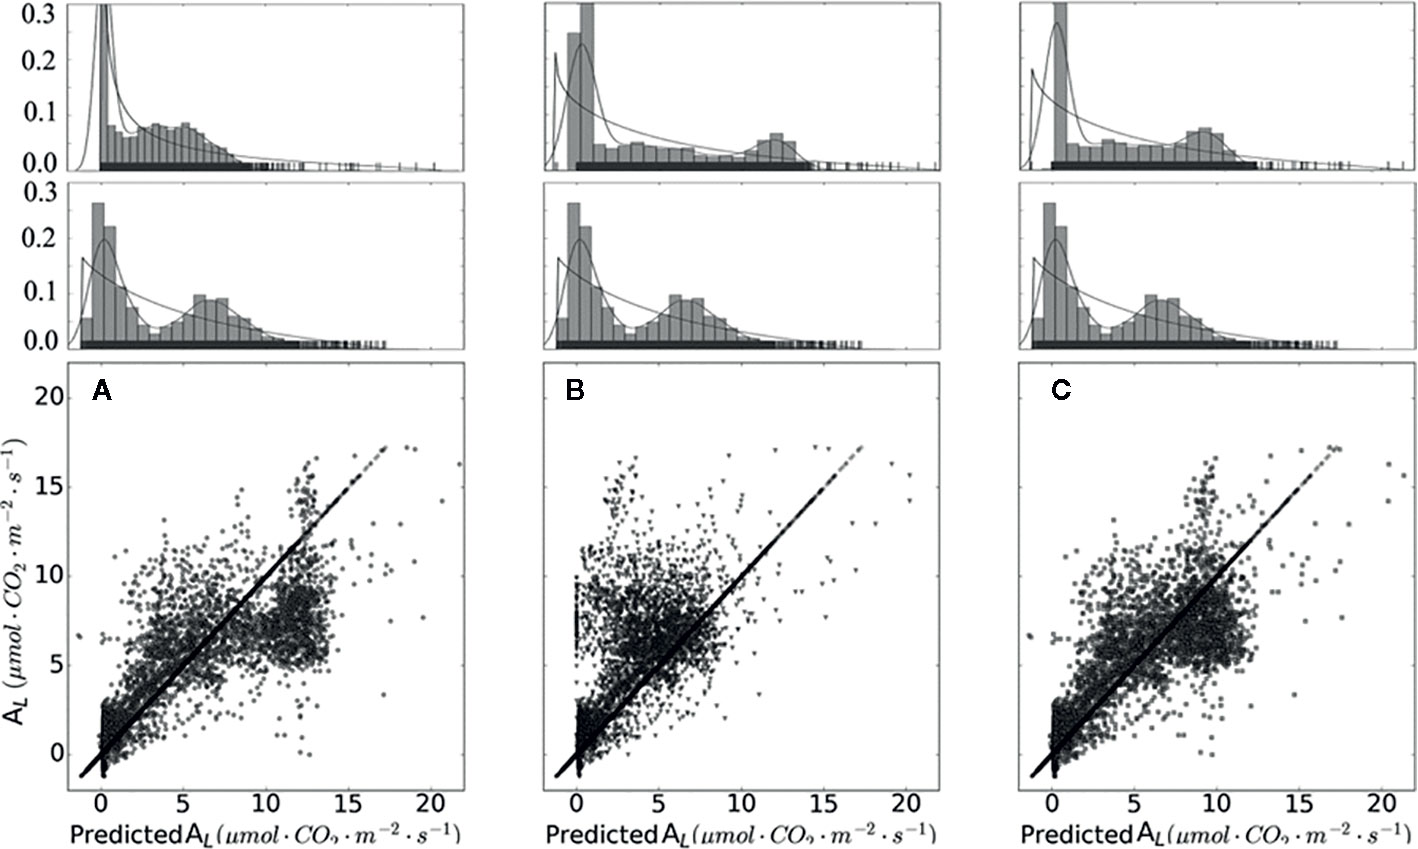
Figure 5 Measured and simulated net photosynthesis rate based on different chloroplast CO2 partial pressure. Data points shown in (A) were calculated with infinity mesophyll conductance (gm). Data points shown in (B) were calculated based on converted rC_co2. Data points shown in (C) were calculated with calibrated gm equal to 0.25. On the top of (A–C) are sub-graphs, displaying the data distribution of each plot, on the middle layer of (A–C) displayed the distribution of measured data.
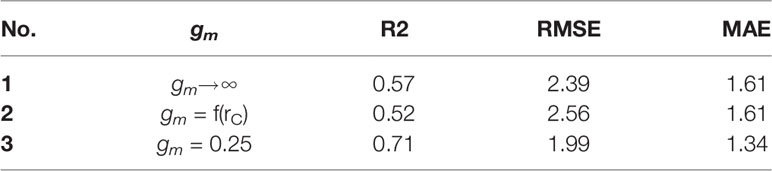
Table 5 Coefficient of determination (R2), root mean square of error (RMSE) and mean absolute error (MAE) of the linear regression calculated between the observations and simulations of mesophyll conductance gm.
Eqns. 3 and 4 are two approaches to calculate Aj (Table 7). In Model IIb (using Eqn. 4) yielded a higher R2 and lower RMSE compared to calculations with Model IIa (i.e. using Eqn. 3). Using Eqn. 10 to simulate the measured Jf, α(LL) value impacted the prediction performance of the model. Three α(LL) values were used in this study. From Figure 6, the results show that the calibrated parameters can largely improve the prediction quality (Table 6). RMSE and MAE decreased after applied the calibrated α(LL) value, which indicated that the R2 and RMSE between predicted value and measured value decreases after changing α(LL) and was used for Model IIb*.
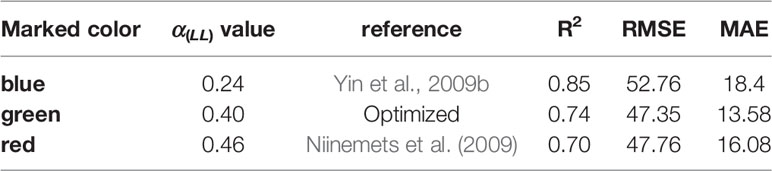
Table 6 Coefficient of determination (R2), root mean square of error (RMSE) and mean absolute error (MAE) of the linear regression calculated between the observations and simulations of electron transport rate J calculated with the three conversion factors (α(LL)) values.
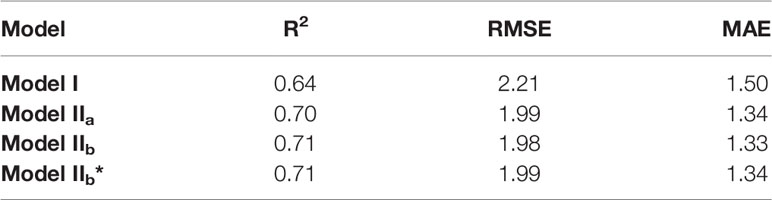
Table 7 Coefficient of determination (R2), root mean square of error (RMSE) of the linear regression calculated between the observations and Models.
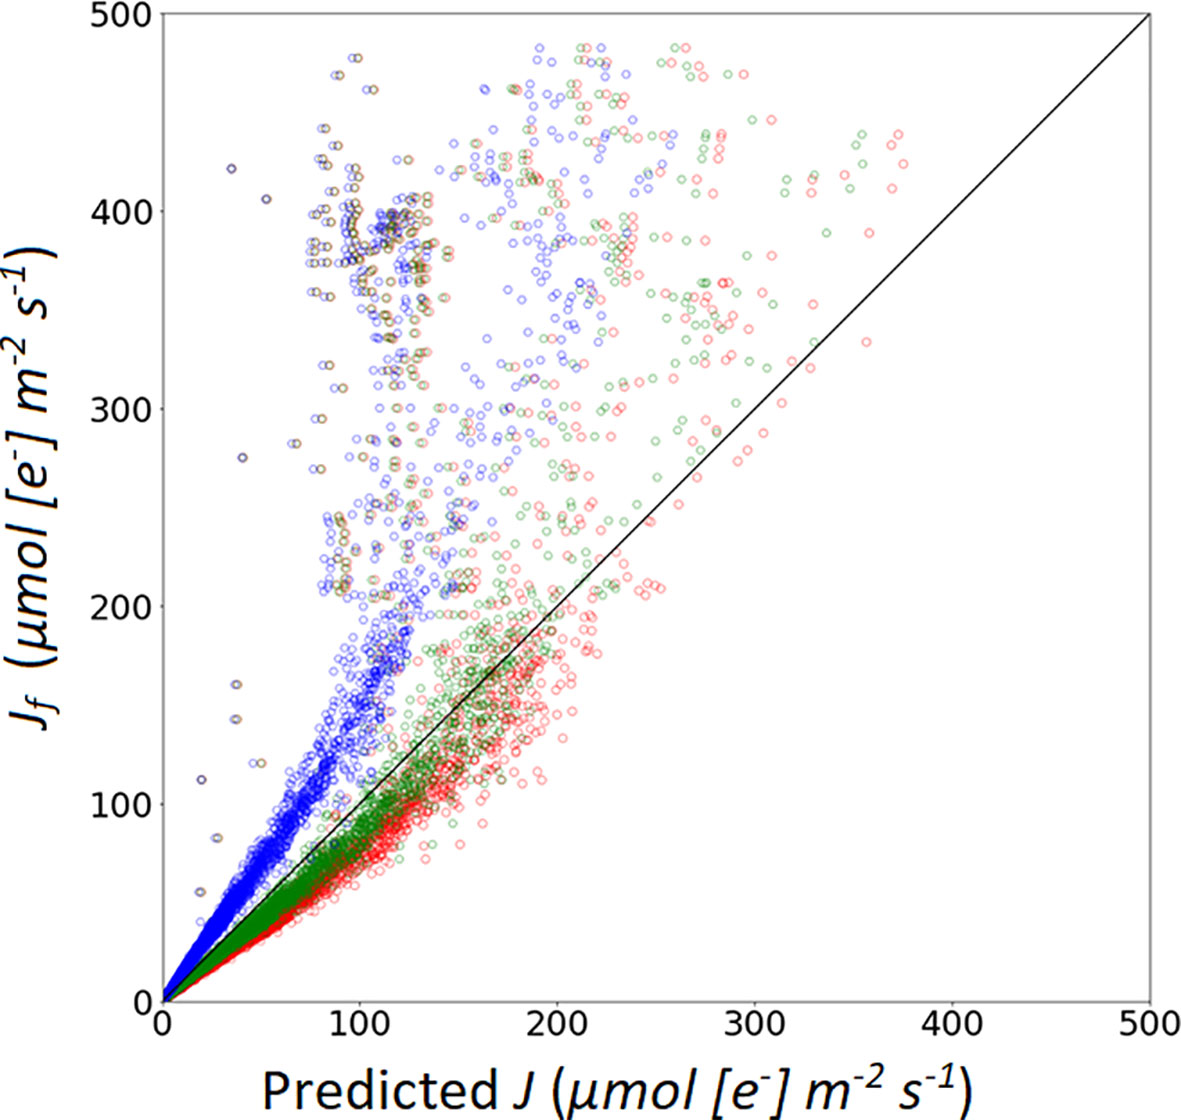
Figure 6 Simulation of photosynthetic electron transport rate based on: A recommended value of α from Niinemets et al. (2009), marked with red open circles; a recommended α value from Yin et al. (2009b), marked with blue open circles; a calibrated α value (0.405), marked with green open circles.
Model Test
The diurnal changes of the net photosynthesis rate and three models were illustrated in Figure 7. In contrast to Model I, the three versions of Model II (Model IIa, Model IIb and Model IIb*) improved the prediction of AL (i.e. higher R2, Table 7). Implementing the predictions obtained from CFA into the model family Model II (i.e. with Model IIb) yielded in a high R2 of 0.71. In addition, parameterization of α(LL) as part of calculation of J (Eqn. 10) could be used to well predict AL.
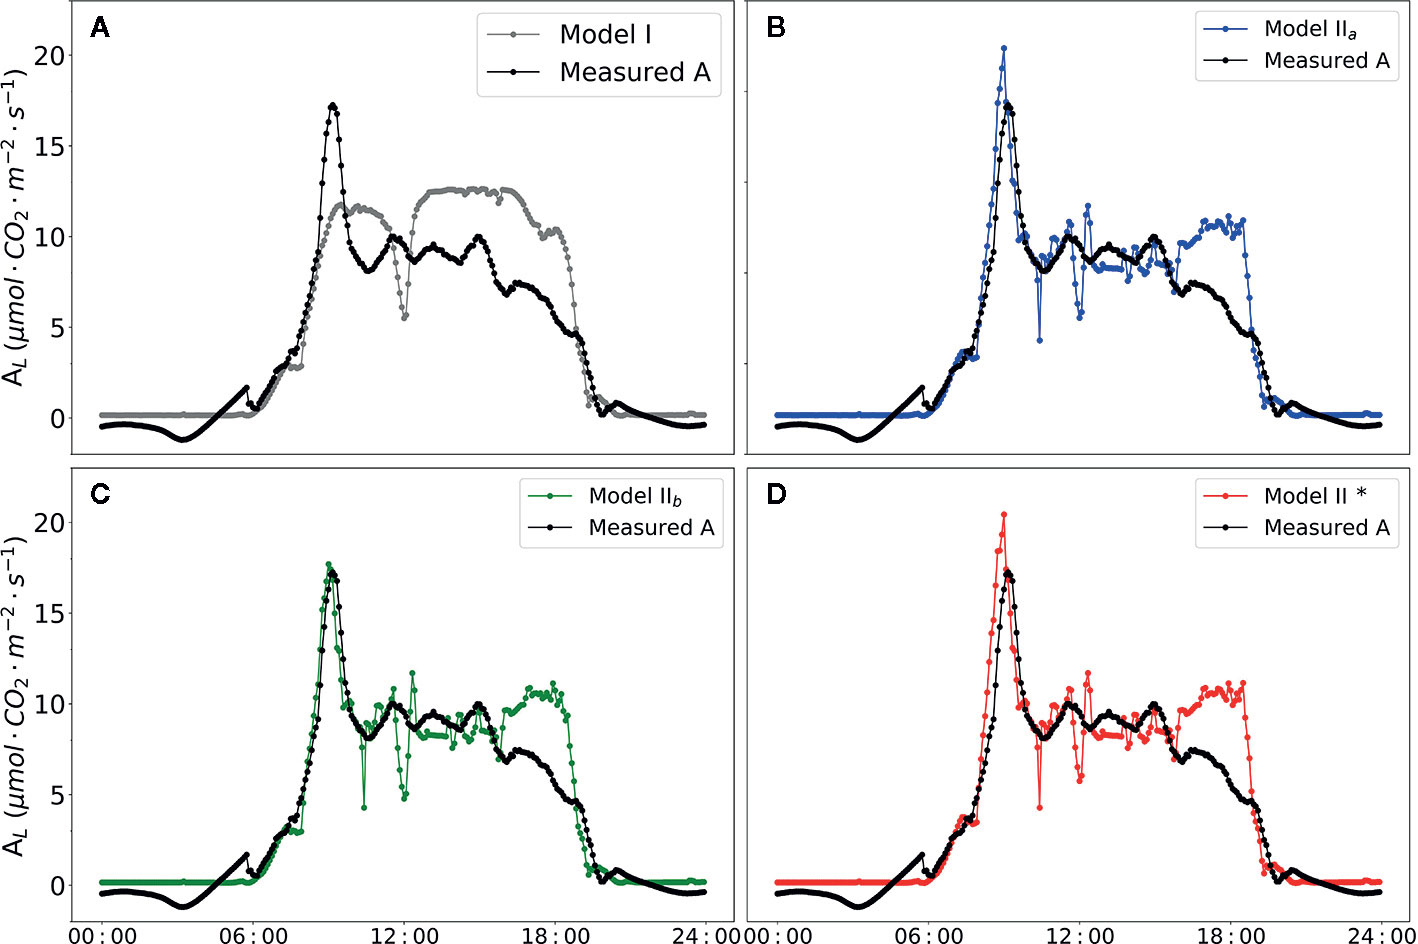
Figure 7 Diurnal dynamics of net photosynthesis rate. Data points shown in black circles are actual value measured by BERMONIS (A–D). Data points shown in filled gray circles in (A) are net photosynthesis rate calculated with Model I. Data points shown in filled blue circles in (B) are calculated with Model IIa. Data points shown in filled green circles in (C) are calculated with Model IIb. Data points shown in filled red circles in (D) are calculated with Model IIb*. VCmax = 71.0 μmol CO2 m-2 s-1, Jmax = 147.7 μmol [e-] m-2 s-1, Rd = -0.34 μmol CO2 m-2 s-1, gm = 0.25 mol m-2 s-1 were applied in the Model IIa, Model IIb and Model IIb*. In Model IIb* α(LL) =0.405 was applied in the modelling framework.
Model Application
During night, the ambient CO2 concentration in the greenhouse increases due to plant respiration (Figure 8). At this time, the limiting factor of photosynthesis is the insufficient electron transfer efficiency of chloroplasts caused by insufficient light. During the light period, photosynthesis consumes ambient CO2, and without CO2-supply its concentration in the greenhouse air rapidly decreases. Under this condition, the limiting factor of photosynthesis is shifted to “Rubisco-limitation”, a close relation to ambient CO2 concentration (Figure 8).
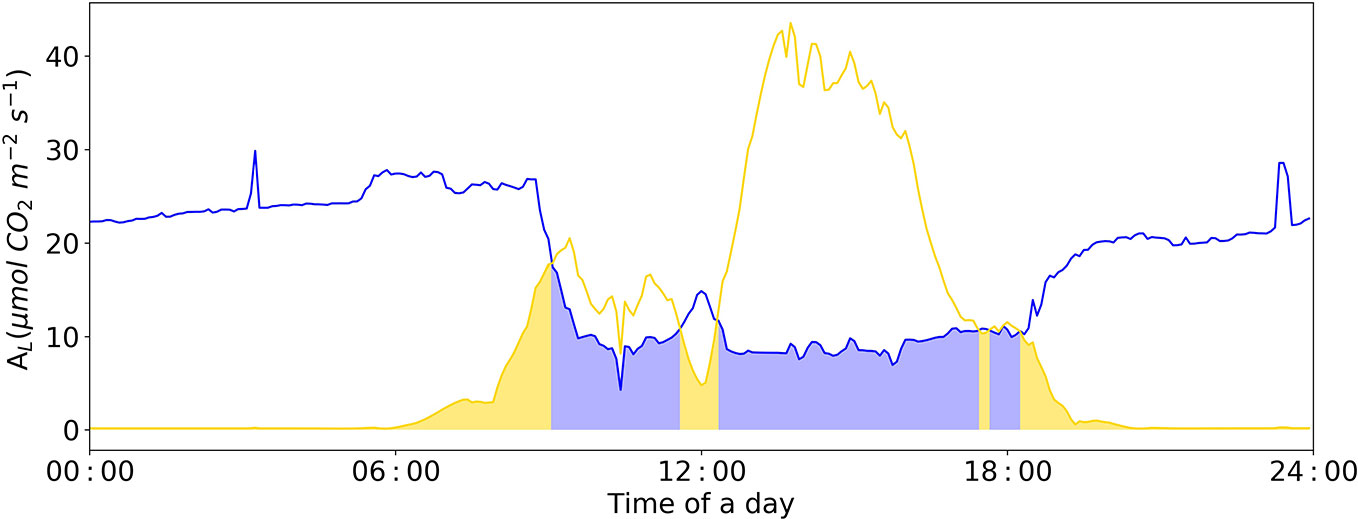
Figure 8 Diurnal dynamics of net photosynthesis rate for Rubisco and electron-transport limited rates calculated with Model IIb. The Blue line represents Rubisco carboxylation-limited assimilation rate (Ac). The yellow line represents electron transport-limited assimilation rate (Aj). The yellow area represents leaf assimilation limited by Aj; the blue area represents leaf assimilation limited by Ac. VCmax = 71.0 μmol CO2 m-2 s-1, Jmax = 147.7 μmol e- m-2 s-1, Rd = -0.34 μmol CO2 m-2 s-1, gm = 0.25 mol m-2 s-1 were applied in the Model IIb.
Based on our designed soft-sensor system, the CO2 concentration required by plants in the current cultivation environment can be calculated accurately. For instance, as illustrated in Figure 9 (before 01:00 p.m.), supplying excessive CO2 to concentrations of 1,000 μmol mol-1 under insufficient lighting conditions does not improve the rate of photosynthesis, resulting in the waste of CO2 (Schmidt, 1998). Meanwhile, when dosing extra CO2, duo to the limited inorganic phosphate (Pi) TPU limitation is likely to occur. The soft-sensor can improve the understanding and control of plant photosynthesis, so as to potentially improve greenhouse climate control.
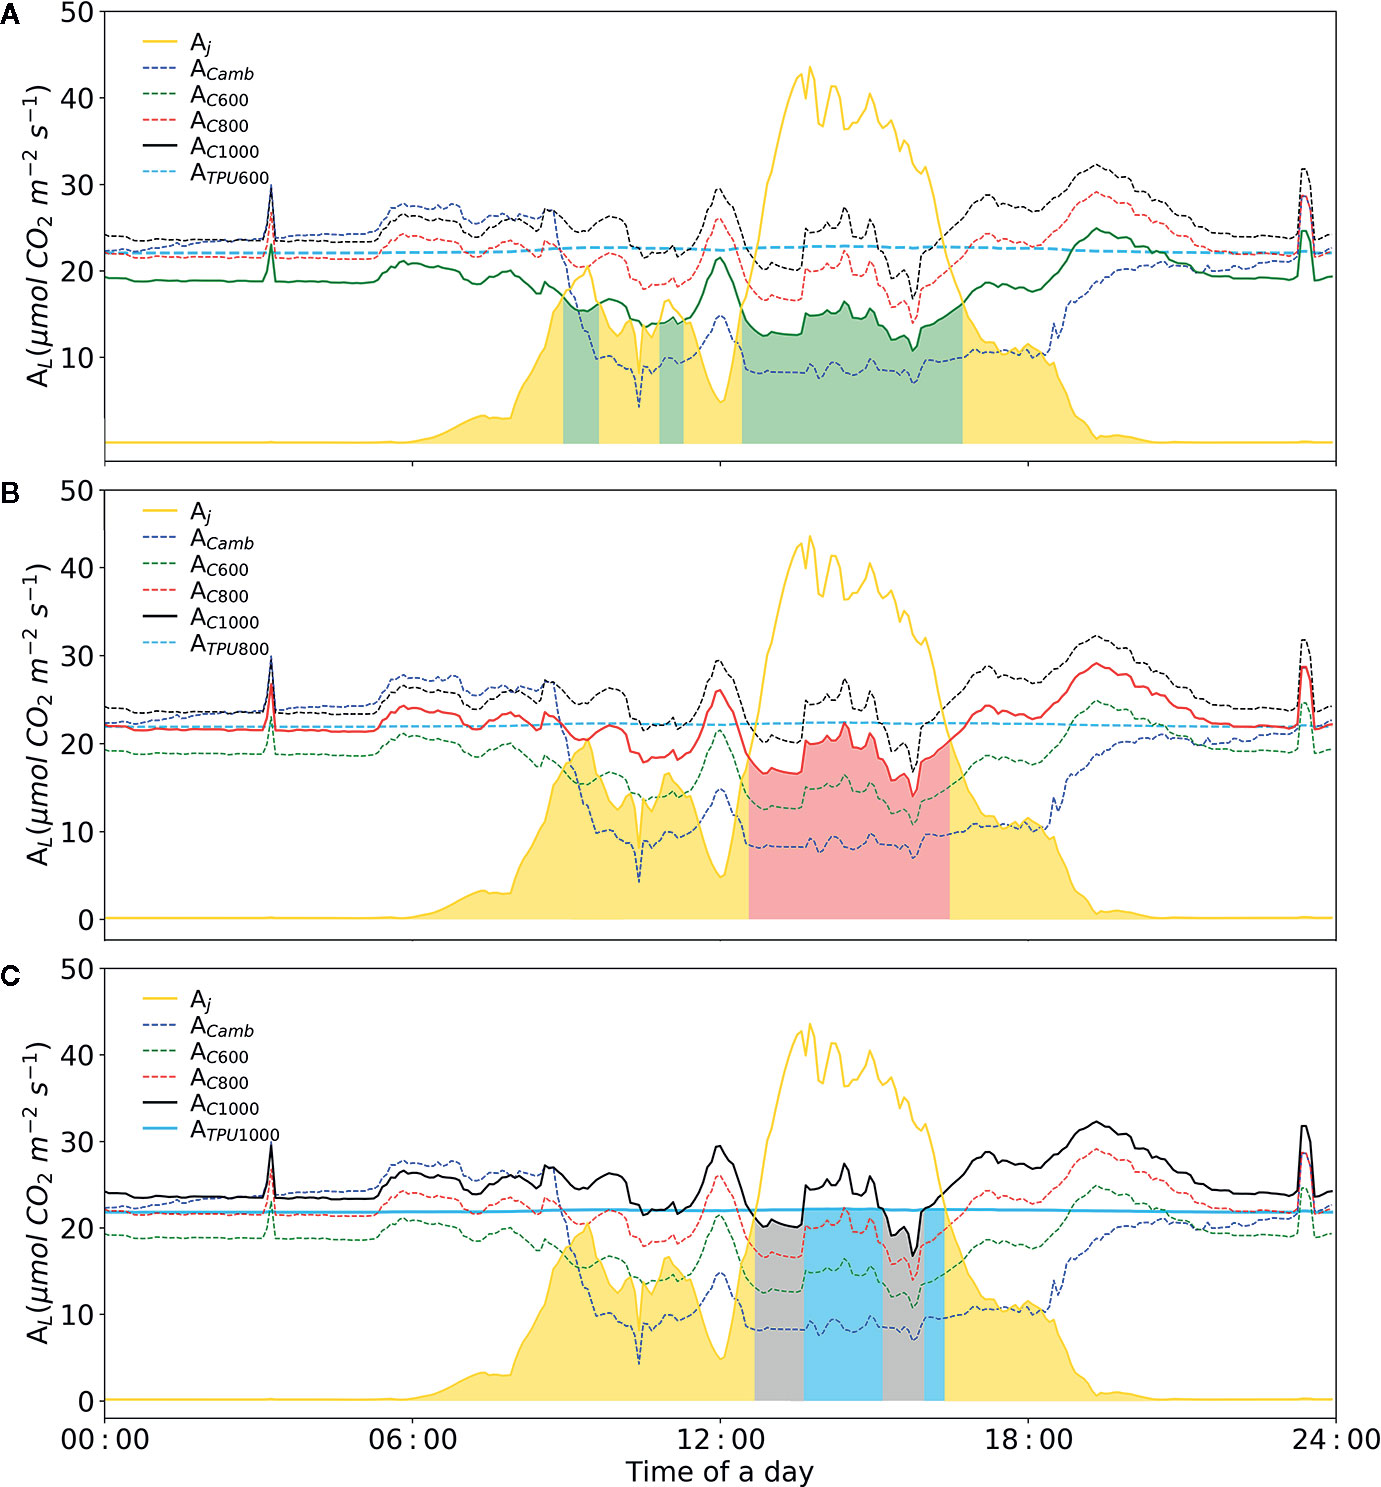
Figure 9 Diurnal dynamics of net photosynthesis rate for electron-transport and carboxylation limited rates calculated with Model IIb. (A) Simulation of diurnal net photosynthesis rate with air CO2 concentration of 600 μmol mol-1. (B) Simulation of diurnal net photosynthesis rate with air CO2 concentration of 800 μmol mol-1. (C) Simulation of diurnal net photosynthesis rate with air CO2 concentration of 1000 μmol mol-1. The yellow line represents electron transport-limited assimilation rate (Aj). The blue dashed-line represents rubisco carboxylation-limited assimilation rate (Ac) at the given CO2 concentration. The sky-blue line represents the TPU limited assimilation with corresponding CO2 concentration. The three colors, green, red and black represent simulations with three CO2 concentrations, i.e. 600, 800, 1000 μmol mol-1, respectively. The colored area represents leaf assimilation rate. VCmax = 71.0 mmol CO2 m-2 s-1, Jmax = 147.7 mmol e- m-2 s-1, Rd = -0.34 mmol CO2 m-2 s-1, gm = 0.25 mol m-2 s-1 were applied.
Discussion
Net photosynthesis prediction in a tomato crop can be improved significant when on-line measurements with sensor systems and intelligent algorithms of models are combined to a so-called soft-sensor (De Koning, 2006; Körner, 2019). Here, the combination of real-time chlorophyll fluorescence measurements and photosynthesis models is suggested. However, when model-predicted rates of CO2 exchange are compared with measured gas exchange, measuring accuracy of a gas exchange measurement system may complicate the determination of the true net photosynthesis. In this study, with the BERMONIS (Schmidt, 1998; Schmidt, 2005) a well-tested multi-leaf cuvette system was used for gas exchange measurements (Huber, 2011; Dannehl et al., 2014).
Another problem in designing soft-sensors often lies in the model structures. Here the difficulty is the unsuitability of the models for direct usage in a soft-sensor. The prediction efficiency of the used models depend among others on the identification and the estimation of substrate concentration, the chloroplast CO2 partial pressure (CC), and the photosynthetic electron transport rate (J). While (CC) can be estimated from the calculated intercellular CO2 concentration (Ci), AL and gm needs to be known beforehand. However, in general, Ci and AL are also unknown at the beginning and a consequential model nesting tends to get trapped in infinite loop in simulations. Therefore, the key issue of using the FvCB models to calculating the actual photosynthetic rate is to accurately provide CC and J data, either attained through model calculations or by measurements. To solve this problem, a commonly used but simplified biochemical AL-model with negative exponential light-response (Model I) was coupled with the full biochemical model approach based on Farquhar et al. (1980) for calculating CC, for which, in turn, gm needed to be identified. Niinemets et al. (2009) and Flexas et al. (2012) evaluated the importance of gm in estimation of net photosynthesis rate. It was demonstrated that a hypothetical situation, with gm→∞, which means there is no diffusion restriction in the mesophyll, resulted in higher daily photosynthesis, than any other parameterization. This is consistent with the conclusion of this study. Due to the assumption of a finite gm, a resistance between intercellular air spaces and the Rubisco carboxylation-sites in chloroplasts was used (Farquhar and Wong, 1984; Flexas et al., 2008). Results show that this equation does not fit AL very well. However, at daytime, the lower gm value resulted in lower CC values and led to the underestimation of AL. Therefore, we recommend a “universal” or cultivar dependent correction factor, or the usage of estimating gm according to different experiments.
For AL model estimations with Model I (used by Körner, 2004), maximum carboxylation rate and maximum electron transport rate (VCmax and Jmax) need to be known. A general model for calculation of VCmax and Jmax was reported by Farquhar et al. (1980). In this model, VCmax25 (i.e. VCmax at 25°C) is calculated with superficial chlorophyll density (ρchl; assumed as 0.45 g m-2), the turnover number of RuBP (carboxylase) (kC; assumed as 2.5 s-1), and the total CO2 concentration of enzyme sites (Et; assumed as 87.0 μmol g-1. Jmax25 was computed as 467 times ρchl (Van Ooteghem, 2007). The calculated results of VCmax25 and Jmax25 were 97.875 and 210.15 μmol m-2 s-1, which are different from our predictions. These values lead to an overestimation of AL (Model I). This underlines the insecure prediction quality of Model I and the central importance of carboxylation rate and maximum electron transport rate in photosynthesis prediction models.
For light-limited assimilation (Aj, electron transport-limited rate of photosynthesis), there are two widely used forms of the equations, i.e. Eqns. 3 and 4. The rate of carboxylation when electron transport is limiting has not yet been described unambiguously in the FvCB model. As discussed by Yin et al. (2009b), for Eqn. 3, RuBP regeneration is assumed limited because of insufficient NADPH. Von Caemmerer (2000) elaborated that Eqn. 4 assumes ATP limiting: its two forms result from different assumptions about the operation of the Q cycle and the number of protons (H+) required for synthesizing an ATP. Yin et al. (2009b) proposed that the stoichiometric relationship in Eqn. 4 assumes linear electron transport limited by ATP. Our results show a higher R2 and lower RMSE with Eqn. 4, implying that in common production condition RuBP regeneration is likely limited by ATP. It can be deduced that under actual production conditions, ATP deficiency may be more related to RuBP regeneration limitation. (Qian et al., 2012), As there are some unknown pathways that cannot be fully represented by this model, the reverse cannot be supported by our data. The model discussed in this study, mainly concerns the basic circumstance (steady-state). A more robust model in unstable conditions could be the model proposed by Yin et al. (2004). However, with this model, constraints for the dynamic variables are needed.
Furthermore, when using Eqn. 10 to calculate the electron transport rate, the essential parameter is α(LL). α(LL) can be gained by mathematical curve fitting. Therefore, once α(LL) is known, Eqn. 10 can be used to estimate the electron transfer rate in the absence of CFA.
In our model analysis, we have used real greenhouse data, in order to clearly interpret that a soft-sensor system can provide accurate information. In our simulations we used ceteris paribus conditions, as only one variable (CO2 concentration) was changed, while the other potentially dynamic parameters were set fixed. However, as VCmax is an exponential function of light (Von Caemmerer and Edmondson, 1986; Brooks et al., 1988; Arulanantham et al., 1990; Makino et al., 1994; Qian et al., 2012; Qian et al., 2015), it should be emphasized that light condition need to be considered in the practical application. The next step would therefore include a full simulation study (including sensitivity analysis) varying all external variables. Due to the difficult parameterization process of reduction and its small contribution, the fraction of NO3-used by ATP and NADPH was not considered in this study. However, in future investigations, this could be explored in hydroponics nutrient composition experiments variating or . This, nevertheless, was out of scope for the present research.
Our results suggest that (1) the CFA parameter Φ2 can be used to predict net photosynthesis rate and that (2) a parameterized photosynthetic electron transport rate model is suitable to predict measured electron transport rate and leaf photosynthesis. The combination of CFA measurements and mathematical modelling can be used for plant performance monitoring and furthermore used as a module for a DSS. The model performance expressed as R2 or RMSE was significantly improved with Jf.
Up-scaling AL to Acrop, i.e. from leaf to canopy photosynthesis, will include the heterogeneity of vertical leaf differences in age and light adaptation resulting in leaf morphological differences (e.g. Laisk et al., 2005). For that it is necessary to estimate the model parameters in AL -predictions with different vertical distribution in the canopy.
To summarize, in the present paper the basis of a monitoring system was introduced, which combines chlorophyll fluorescence analysis and model predictions using a biochemical leaf photosynthesis model (Model IIb). The performance of a predictive model may be improved by combining it with the sensor-based on-line measurement of plant physiological parameters. The approach evaluated in this study provides information on the relationship between rates of photosynthetic electron transport and carbon gain. Furthermore, it could be used as the scientific basis for practical application of CO2 enrichment in the greenhouse. The next step will be the incorporation of morphological differences of leaves in a canopy to the proposed soft-sensor system.
Conclusion
In summary, a soft-sensor, based on both sensors and models, is suitable to predicting rates of photosynthesis at the leaf level. However, for a well-fitting model system, a parameters validation of the biochemical parameters is needed. For estimating the CO2 concentration in chloroplasts, coupling of the Jarvis model with Model I can avoid a vicious cycle of parameters. Model IIb could reduce the effects of the errors of the simplified model as indicated by the reduced R2 between predicted data and measured data and the increased RMSE. Consequently, using these models as sub-systems in the soft-sensor approach could be a precise method for developing a greenhouse control strategy based on the direct evaluation of plant responses. However, differences in leaf morphology, which could result in different VCmax and Jmax need to be exactly parameterized for a well performing DSS.
Data Availability Statement
All datasets generated for this study are included in the article/Supplementary Material.
Author Contributions
WY performed the measurements. US was involved in planning and supervised the work. WY and OK processed the experimental data, performed the analysis, drafted the manuscript, and designed the figures. All authors discussed the results and commented on the manuscript.
Funding
We are grateful for the generous financial support received from Humboldt University of Berlin and the program of China Scholarships Council.
Conflict of Interest
The authors declare that the research was conducted in the absence of any commercial or financial relationships that could be construed as a potential conflict of interest.
Acknowledgments
The authors thank the financial support from the program of China Scholarships Council for the first author and Wolfgang Pfeiffer for the technique support with the BERMONIS.
Supplementary Material
The Supplementary Material for this article can be found online at: https://www.frontiersin.org/articles/10.3389/fpls.2020.01038/full#supplementary-material
References
Aggarwal, C., Yu, S. (2005). An effective and efficient algorithm for high-dimensional outlier detection. VLDB J. 14, 211–221.
Allen, J. F. (2003). Cyclic, pseudocyclic and noncyclic photophosphorylation: new links in the chain. Trends Plant Sci. 8, 15–19.
Arulanantham, A. R., Rao, I. M., Terry, N. (1990). Limiting Factors in Photosynthesis: VI. Regeneration of Ribulose 1,5-Bisphosphate Limits Photosynthesis at Low Photochemical Capacity. Plant Physiol. 93, 1466–1475.
Baker, N. R. (2008). Chlorophyll fluorescence: a probe of photosynthesis in vivo. Annu. Rev. Plant Biol. 59, 89–113.
Bernacchi, C. J., Pimentel, C., Long, S. P. (2003). In vivo temperature response functions of parameters required to model RuBP-limited photosynthesis. Plant Cell Environ. 26, 1419– 1430.
Björkman, O. (1973). Comparative studies on photosynthesis in higher plants. Photophysiology 8, 1–63.
Brooks, A., Portis, A. R., Sharkey, T. D. (1988). Effects of Irradiance and Methyl Viologen Treatment on ATP, ADP, and Activation of Ribulose Bisphosphate Carboxylase in Spinach Leaves. Plant Physiol. 88, 850–853.
Chai, T., Draxler, R. R. (2014). Root mean square error (RMSE) or mean absolute error (MAE)? – Arguments against avoiding RMSE in the literature. Geosci. Model Dev. 7 (3), 1247–1250.
Cornic, G., Massacci, A. (1996). “Leaf photosynthesis under drought stress,” in Photosynthesis and the Environment. Ed. Baker, N. R. (Dordrecht: Kluwer Academic Publishers), 347–366.
Dannehl, D., Josuttis, M., Ulrichs, C., Schmidt, U. (2014). The potential of a confined closed greenhouse in terms of sustainable production, crop growth, yield and valuable plant compounds of tomatoes. J. Appl. Bot. Food Qual. 87210 -, 219.
De Koning, A. N. M. (2006). Models and Sensors in greenhouse control. Acta Horticuturae 718, 175–182.
Dubois, J. J. B., Fiscus, E. L., Booker, F. L., Flowers, M. D., Reid, C. D. (2007). Optimizing the statistical estimation of the parameters of the Farquhar-von Caemmerer-Berry model of photosynthesis. New Phytol. 176, 402–414.
Edwards, G. E., Baker, N. R. (1993). Can CO2 assimilation in maize leaves be predicted accurately from chlorophyll fluorescence analysis? Photosynth. Res. 37 (2), 89–102.
Ethier, G., Livingston, N. (2004). On the need to incorporate sensitivity to CO2 transfer conductance into Farquhar – von Caemmerer – Berry leaf photosynthesis model. Plant Cell Environ. 27, 137–153.
Ethier, G. J., Livingston, N. J., Harrison, D. L., Black, T. A., Moran, J. A. (2006). Low stomatal and internal conductance to CO2 versus Rubisco deactivation as determinants of the photosynthetic decline of ageing evergreen leaves. Plant Cell Environ. 29, 2168–2184.
Farquhar, G. D., von Caemmerer, S. (1982). “Modelling of photosynthetic response to environmental conditions,” in Physiological Plant Ecology II, Water Relations and Carbon Assimilation. Encyclopedia of Plant Physiology, New Series, vol. 12. B . Eds. Lange, O. L., Nobel, P. S., Osmond, C. B., Ziegler, H. (Berlin, Germany: Springer Verlag), 549–588.
Farquhar, G. D., Wong, S. C. (1984). An empirical model of stomatal conductance. Aust. J. Plant Physiol. 11, 191–209.
Farquhar, G. D., Von Caemmerer, S., Berry, J. A. (1980). A biochemical model of photosynthetic CO2 assimilation in leaves of C3 species. Planta 149, 78–90.
Farquhar, G. D., von Caemmerer, S., Berry, J. A. (2001). Models of photosynthesis. Plant Physiol. 125, 42– 45.
Flexas, J., Briantais, J. M., Cerovic, Z., Medrano, H., Moya, I. (1998). "Continuous chlorophyll fluorescence and gas exchange measurements as a new approach to study water stress effects on leaf photosynthesis," in Photosynthesis: Mechanisms and Effects, E. Garab, Ed., (Netherlands: Kluwer Academic), p. 4305–4308.
Flexas, J., Jean-Marie, B., Zoran, C., Hipólito, M., Ismael, M. (2000). Steady-State and Maximum Chlorophyll Fluorescence Responses to Water Stress in Grapevine Leaves: A New Remote Sensing System. Remote Sens. Environ. 73, 283–297.
Flexas, J., Ribas-Carbo, M., Diaz-Espejo, A., Galmes, J., Medrano, H. (2008). Mesophyll conductance to CO2: current knowledge and future prospects. Plant Cell Environ. 31, 602–621.
Flexas, J., Barbour, M. M., Brendel, O., Cabrera, H. M., Carriqui, M., Diaz-Espejo, A., et al. (2012). Mesophyll diffusion conductance to CO2: An unappreciated central player in photosynthesis. Plant Sci. 193-194, 70–84.
Foyer, C. H., Noctor, G. (2002). Photosynthetic nitrogen assimilation and associated carbon and respiratory metabolism. Photosynthetica 41, 342.
Gijzen, H. (1992). Simulation of photosynthesis and dry matter production of greenhouse crops (Wageningen, The Netherlands: CABO-DLO).
Goudriaan, J., Van Laar, H. H. (1994). Modelling potential crop growth processes. vol. 2 (Dordrecht, The Netherlands: Kluwer academic publishers), 238 p.
Govindjee, E. (1995). Sixty-three years since Kautsky: Chlorophyll a fluorescence. Aust. J. Plant Physiol. 22, 131–160.
Grubbs, F. E. (1950). Sample criteria for testing outlying observations. Ann. Math Statist 21, 27–58.
Gurban, E. H., Andreescu, G.-D. (2018). Greenhouse environment monitoring and control: State of the art and current trends. Environ. Eng. Manage. J. 17, 399–416.
Harley, P. C., Sharkey, T. D. (1991). An improved model of C3 photosynthesis at high CO2: reversed O2 sensitivity explained by lack of glycerate reentry into the chloroplast. Photosynth. Res. 27, 169–178.
Herppich, W. B., Peckmann, K. (1997). Responses of gas exchange, photosynthesis, nocturnal acid accumulation and water relations of aptenia cordifolia to short-term drought and rewatering. J. Plant Physiol. 150 (4), 467–474.
Herppich, W. B., Peckmann, K. (2000). Influence of drought on mitochondrial activity, photosynthesis, nocturnal acid accumulation and water relations in the CAM plants prenia sladeniana (ME-type) and Crassula lycopodioides (PEPCK-type). Ann. Bot. 86, 611–620.
Hoogenboom, G., Jones, J. W., Boote, K. J. (1990). Modeling growth, development and yield of legumes: current status of the SOYGRO, PNUTGRO and BEANGRO models. ASAE PaperNo., 90–1060 Paper presented at the ASAE International Summer Meeting, Ohio, USA, 1990, 32 pp.
Herppich, W. B., Flach, B. M. T., von Willert, D. J., Herppich, M. (1996). Field investigations of photosythetic activity, gas exchange and water potential at different leaf ages in Welwitschia mirabilis during a severe drought. Flora 191, 59–66.
Heuvelink, E. (1996). Tomato growth and yield: quantitative analysis and synthesis. [Ph.D. Thesis], Wageningen, The Netherlands: Wageningen Agricultural University.
Huber, C. (2011). Bewertung des CO2-Gaswechsels von ausgewählten Gemüsekulturen und Optimierung der Steuerung des CO2-Gehaltes in semigeschlossenen Gewächshäusern. [PhD thesis] (Germany: Humboldt Universitaet zu Berlin).
Janka, E., Körner, O., Rosenqvist, E., Ottosen, C. O. (2013). High temperature stress monitoring and detection using chlorophyll a fluorescence and infrared thermography in chrysanthemum (Dendranthema grandiflora). Plant Physiol. Biochem. 67, 87–94.
Jones, J. W., Dayan, E., Allen, L H., van Keulen, H., Challa Keulen, H. (1991). A dynamic tomato growth and yield model (TOMGRO). T ASAE 34, 663–672.
Körner, O., Hansen, J. B. (2012). An on-line tool for optimising greenhouse crop production. Acta Hortic. 957, 147–154.
Körner, O., Van Straten, G. (2008). Decision support for dynamic greenhouse climate control strategies. Comput. Electron. Agric. 60, 18–30.
Körner, O., Challa, H., Van Ooteghem, R. J. C. (2002). Modeling temperature effects on crop photosynthesis at high radiation in a solar greenhouse. Acta Hortic. 593, 137–144.
Körner, O. (2004). Evaluation of crop photosynthesis models for dynamic climate control. Acta Hortic. 654, 295–302.
Körner, O. (2019). “Models, sensors and decision support systems in greenhouse cultivation,” in Achieving sustainable greenhouse cultivation. Eds. Marcelis, L. F. M., Heuvelink, E. (Burleigh Dodds: www.bdspublishing.com), 379–412.
Krall, J. P., Edwards, G. E. (1992). Relationship between photosystem II activity and CO2 fixation in leaves. Physiol. Plant. 86 (1), 180–187.
Krause, G. H., Weis, E. (1984). Chlorophyll fluorescence as a tool in plant physiology : II. Interpretation of fluorescence signals. Photosynth Res. 5, 139–157.
Laisk, A., Eichelmann, H., Oja, V., Rasulov, B., Padu, E., Bichele, I., et al. (2005). Adjustment of leaf photosynthesis to shade in a natural canopy: rate parameters. Plant Cell Environ. 28, 375–388.
Lattauschke, G. (2004). “Gewaechshaustomaten- Hinweis zum Umweltgerechten anbau und Managementunterlagen,” in Saechsische Landesanstalt fuer Landwirtschaft (Dresden, Germany: Saechsisches Staatsministerium fuer Umwelt und Landwirtschaft).
Lawlor, D. W. (1995). “The effects of water deficit on photosynthesis”, in Environment and Plant Metabolism. Ed. Smirnoff, N. (Oxford: Bios Scientific Publishers), 129–160.
Lawlor, D. W., Cornic, G. (2002). Photosynthetic carbon assimilation and associated metabolism in relation to water deficits in higher plants. Plant Cell Environ. 25, 275–294.
Leuning, R. (2010). A critical appraisal of a combined stomatal-photosynthesis model for C3 plants. Plant Cell Environ. 18, 339–355.
Lombardozzi, D. L., Smith, N. G., Cheng, S. J., Dukes, J. S., Sharkey, T. D., Rogers, A., et al. (2018). Triose phosphate limitation in photosynthesis models reduces leaf photosynthesis and gloval terrestrial carbon storage. Environ. Res. Lett. 13 (7), 1–9. doi: 10.1046/j.0016-8025.2001.00814.x
Long, S. P., Bernacchi, C. J. (2003). Gas exchange measurements, what can they tell us about the underlying limitations to photosynthesis? Procedures and sources of error. J. Exp. Bot. 54, 2393–2401.
Madsen, K., Nielsen, H. B., O, T. (2004). Methods for non-linear least squares problems (Lungby, Denmark: Technical University of Denmark), pp. 58.
Mahlein, A.-K. (2015). Plant disease detection by imaging sensors - Parallels and specific demands for precision agriculture and plant phenotyping. Plant Dis. 2, 241–251.
Makino, A., Nakano, H., Mae, T. (1994). Effects of Growth Temperature on the Responses of Ribulose-1,5-Biphosphate Carboxylase, Electron Transport Components, and Sucrose Synthesis Enzymes to Leaf Nitrogen in Rice, and Their Relationships to Photosynthesis. Plant Physiol. 105, 1231–1238.
Manter, D. K., Kerrigan, J. (2004). A/Ci curve analysis across a range of woody plant species: influence of regression analysis parameters and mesophyll conductance. J. Exp. Bot. 55, 2581–2588.
Maxwell, K., Johnson, G. N. (2000). Chlorophyll fluorescence–a practical guide. J. Exp. Bot. 51, 659–668.
Mehler, A. H. (1951). Studies on reactions of illuminated chloroplasts. I. Mechanism of the reduction of oxygen and other Hill reagents. Arch. Biochem. Biophys. 33, 65– 77.
Miflin, B. J. (1974). Nitrite reduction in leaves: studies on isolated chloroplasts. Planta 116, 187–196.
Miranda, L. (2017). Artificial neural networks in greenhouse modelling-two modelling applications in horticulture. [PhD thesis]. (Germany: Humboldt University).
Niinemets, U., Diaz-Espejo, A., Flexas, J., Galmes, J., Warren, C. R. (2009). Importance of mesophyll diffusion conductance in estimation of plant photosynthesis in the field. J. Exp. Bot. 60, 2271–2282.
Nobel, P. S. (1977). Internal leaf area and cellular CO2 resistance: photosynthetic implications of variations with growth conditions and plant speciesm. Physiol. Plant. 40, 137–144.
Nobel, P. S. (1983). Biophysical plant physiology and ecology (San Francisco: W. H. Freeman and company).
Noctor, G., Foyer, C. H. (1998). A re-evaluation of the ATP:NADPH budget during C3 photosynthesis: a contribution from nitrate assimilation and its associated respiratory activity? J. Exp. Bot. 49, 1895–1908.
Orfanidis, S. J. (2006). “Introduction to Signal Processing”, in Fundamentals of protein NMR Spectroscopy. Eds. Rule, R. S., Kevin, H. T. (The Netherlands: Springer), 65–88. doi: 10.1007/1-4020-3500-4
Pons, T. L., Flexas, S., von Caemmerer, S., Evans, J. R., Genty, B., Ribas-Carbo, M., et al. (2009). Estimating mesophyll conductance to CO2: Methodology, potential errors and recommendations. J. Exp. Bot. 8, 8.
Qian, T., Elings, A., Dieleman, J. A., Gort, G., Marcelis, L. F. M. (2012). Estimation of photosynthesis parameters for a modified Farquhar–von Caemmerer–Berry model using simultaneous estimation method and nonlinear mixed effects model. Environ. Exp. Bot. 82, 66–73.
Qian, T., Dieleman, J. A., Elings, A., de Gelder, A., Marcelis, L. F. M. (2015). Response of tomato crop growth and development to a vertical temperature gradient in a semiclosed greenhouse. J. Hortic. Sci. Biotechnol. 90 (5), 578–584.
Ramin, S. R., Kalantari, F., C. Ting, K., R. Thorp, K., A. Hameed, I., Weltzien, C., et al. (2018). Advances in greenhouse automation and controlled environment agriculture: A transition to plant factories and urban agriculture. Int. J. Agric. Biol. Eng. 11, 1–22.
Robinson, J. M. (1987). “Interactions of carbon and nitrogen metabolism in photosynthetic and nonphotosynthetic tissues of higher plants: metabolic pathways and controls,” in Models in Plant Physiology and Biochemistry, vol. 1. Eds. Newman, D. W., Wilson, K. G. (Boca Raton, Florida USA: CRC Press), 25–35.
Rytter, M., Sørensen, J. C., Sørensen, B. N., Körner, O. (2012). Advanced model-based greenhouse climate control using multi-objective optimization. Acta Hortic. 957, 29–35.
Salazar-Moreno, R., L.-C.I.L., Miranad, L., Schmidt, U., Fitz-Rodriguez, E., Rojano-Aguilar, A. (2017). Development and validation of a dynamic climate model in a semiclosed greenhouse. Acta Hortic. 1182, 111–118. doi: 10.17660/ActaHortic.2017.1182.13
Schmidt, U. (1998). Low-cost system for on-line measurement of plant transpiration and photosynthesis in greenhouse production. Acta Hortic. 421, 249–257.
Schmidt, U. (2005). Microclimate control in greenhouse based on phytomonitoring data and mollier phase diagram. Acta Hortic. 691, 125–132.
Schreiber, U., Schliwa, U., Bilger, W. (1986). Continuous recording of photochemical and non-photochemical chlorophyll fluorescence quenching with a new type of modulation fluorometer. Photosynth. Res. 10, 51–62.
Schreiber, U. (1986). Detection of rapid induction kinetics with a new type of high-frequency modulated chlorophyll fluorometer (Netherlands: Springer).
Schreiber, U. (2004). “Pulse-Amplitude (PAM) fluorometry and saturatio pulse method,” in chlorophyll a fluorescence. A signature of photosynthesis. Ed. Govindjee, P. G. (Dordrecht: Springer), 279–319.
Sharkey, T. D., Bernacchi, C. J., Farquhar, G. D., Singsaas, E. L. (2007). Fitting photosynthetic carbon dioxide response curves for C3 leaves. Plant Cell Environ. 30, 1035–1040.
Sharkey, T. D. (1984). Transpiration-induced changes in the photosynthetic capacity of leaves. Planta 160, 143–150.
Sharkey, T. D. (1985). Photosynthesis in Intact Leaves of C3 Plants: Physics, Physiology and Rate Limitations. Bot. Rev. 51, 53–105.
Shamshiri, R., Che Man, H., Zakaria, A. J., Beveren, P. V., Wan Ismail, W. I, Ahmad, D. (2017). Membership function model for defining optimality of vapor pressure deficit in closed-field cultivation of tomato. Acta Horticulturae 1152, 281–290. doi: 10.17660/ActaHortic.2017.1152.38
Spitters, C. J. T., Van Keulen, H., Van Kraalingen, D. W. G. (1989). “A simple and universal crop growth simulator: SUCROS87”, in Simulation and system management in crop protection. Eds Rabbinge, R., Ward, S. A., Van Laar, H. H. 147–181. (Wageningen: Pudoc Wageningen), 147–181.
Sun, Y., Gu, L., Dickinson, R. E., Norby, R. J., Pallardy, S. G., Hoffman, F. M. (2014). Impact of mesophyll diffusion on estimated global land CO2 fertilization. Proc. Natl. Acad. Sci. U. States America 111, 15774–15779.
Thornley, J. H. M. (1976). Mathematical models in plant physiology[M] (London, UK: Academic Press (Inc.)).
Tschiersch, H., Junker, A., Meyer, R. C., Altmann, T. (2017). Establishment of integrated protocols for automated high throughput kinetic chlorophyll fluorescence analyses. Plant Methods 13, 1–16.
Van Ooteghem, R. J. C. (2007). Optimal control design for a solar greenhouse. PhD Thesis (Wageningen, The Netherlands: Wageningen University).
Von Caemmerer, S., Edmondson, D. (1986). Relationship between steady-state gas exchange, in vivo ribulose bisphosphate carboxylase activity and some carbon reduction cycle Intermediates in Raphanus sativus. Aust. J. Plant Physiol. 13, 669–688.
Von Caemmerer, S., Farquhar, G. D. (1981). Some relationships between the biochemistry of photosynthesis and the gas exchange of leaves. Planta 153, 376–387.
Von Caemmerer, S. (2000). Biochemical Models of Leaf Photosynthesis. (Victoria, Australia: CISIRO Publishing), pp. 165.
Von Caemmerer, S. (2013). Steady-state models of photosynthesis. Plant Cell Environ. 36 (9), 1617–1630.
Walker, B. J., Strand, D. D., Kramer, D. M., Cousins, A. B. (2014). The response of cyclic electron flow around photosystem I to changes in photorespiration and nitrate assimilation. Plant Physiol. 165 (1), 453–462.
Wallach, D., Wallach, D., Makowski, D., Jones, J. W. (2006). Working with dynamic crop models evaluation, analysis, parameterization, and applications (Amsterdam: Elsevier), 11–54.
Warren, C. (2006). Estimating the internal conductance to CO2 movement. Funct. Plant Biol. 33, 431–442.
Woodrow, I. E., Berry, J. A. (1988). Enzymatic regulation of photosynthetic CO2 fixation in C3 plants. Ann. Rev. Plant Physiol. Plant Mol. Biol. 39, 533–594.
Yin, X., Struik, P. C. (2009). Theoretical reconsiderations when estimating the mesophyll conductance to CO2 diffusion in leaves of C3 plants by analysis of combined gas exchange and chlorophyll fluorescence measurements. Plant Cell Environ. 32, 1513–1524.
Yin, X. Y., Struik, P. C. (2012). Mathematical review of the energy transduction stoichiometries of C4 leaf photosynthesis under limiting light. Plant Cell Environ. 35, 1299–1312.
Yin, X., Van Oijen, M., Schapendonk, A. (2004). Extension of a biochemical model for the generalized stoichiometry of electron transport limited C3 photosynthesis. Plant Cell Environ. 27, 1211–1222.
Yin, X., Harbinson, J., Struik, P. C. (2006). Mathematical review of literature to assess alternative electron transports and interphotosystem excitation partitioning of steady-state C3 photosynthesis under limiting light. Plant Cell Environ. 29, 1771–1782.
Yin, X., Struik, P. C., Romero, P., Harbinson, J., Evers, J. B., Pe, V. D. P., et al. (2009a). Using combined measurements of gas exchange and chlorophyll fluorescence to estimate parameters of a biochemical C3 photosynthesis model: a critical appraisal and a new integrated approach applied to leaves in a wheat (Triticum aestivum) canopy. Plant Cell Environ. 32, 448–464.
Yin, X., Harbinson, J., Struik, P. C. (2009b). “A model of the generalised stoichiometry of electron transport limited C3 photosynthesis: development and application,” in Photosynthesis in Silico. Understanding Complexity from Molecules to Ecosystems. Eds. Laisk, A., Nedbal, L., Govindjee (Dordrecht, Netherlands: Springer), 247– 273.
Keywords: biochemical photosynthesis model, chlorophyll fluorescence, CO2 gas exchange, electron transport rate, photosynthesis, photosynthesis modelling, quantum yield
Citation: Yu W, Körner O and Schmidt U (2020) Crop Photosynthetic Performance Monitoring Based on a Combined System of Measured and Modelled Chloroplast Electron Transport Rate in Greenhouse Tomato. Front. Plant Sci. 11:1038. doi: 10.3389/fpls.2020.01038
Received: 27 July 2019; Accepted: 24 June 2020;
Published: 10 July 2020.
Edited by:
Paul Christiaan Struik, Wageningen University and Research, NetherlandsReviewed by:
Petronia Carillo, University of Campania Luigi Vanvitelli, ItalyBerkley James Walker, Michigan State University, United States
Copyright © 2020 Yu, Körner and Schmidt. This is an open-access article distributed under the terms of the Creative Commons Attribution License (CC BY). The use, distribution or reproduction in other forums is permitted, provided the original author(s) and the copyright owner(s) are credited and that the original publication in this journal is cited, in accordance with accepted academic practice. No use, distribution or reproduction is permitted which does not comply with these terms.
*Correspondence: Oliver Körner, a29lcm5lckBpZ3pldi5kZQ==; Uwe Schmidt, dS5zY2htaWR0QGFncmFyLmh1LWJlcmxpbi5kZQ==