 Ana Otero
 Mario Fernández-Mazuecos
 Pablo Vargas
- Real Jardín Botánico (RJB-CSIC), Madrid, Spain
Researchers in phylogenetic systematics typically choose a few individual representatives of every species for sequencing based on convenience (neighboring populations, herbarium specimens, samples provided by experts, garden plants). However, few studies are based on original material, type material or topotypic material (living specimens from the locality where the type material was collected). The use of type or topotypic material in phylogenetic studies is paramount particularly when taxonomy is complex, such as that of Antirrhinum (Plantaginaceae). In this paper, we used topotypic materials of Antirrhinum at the species level (34 species proposed by previous authors), 87 specimens representing the species distributions and >50,000 informative nucleotide characters (from ∼4,000 loci) generated by the genotyping-by-sequencing (GBS) technique: (i) to test two explicit taxonomic hypotheses widely followed by local taxonomic treatments; (ii) to robustly estimate phylogenetic relationships; (iii) to investigate the evolution of key morphological characters and biogeographic centers of differentiation. Two GBS phylogenies based on two datasets (87 localities and 34 topotypic specimens) revealed that: (1) Sutton’s (1988) taxonomic account is the most congruent with phylogenetic results, whereas division of Antirrhinum into three major clades disagrees with Rothmaler’s (1956) infrageneric classification; (2) monophyly of populations currently included in the same species is primarily supported; (3) the historically recognized Antirrhinum majus group is not monophyletic; (4) sister-group relationships are robust for eight species pairs; (5) the evolutionary radiation of 26 species since the Pliocene is underpinned given a high rate of diversification (0.54 spp. Myr–1); (6) a geographic pattern of speciation is reconstructed, with northern Iberia as the center of early diversification followed by more recent speciation in southeastern Iberia; and (7) multiple acquisitions of key taxonomic characters in the course of Antirrhinum diversification are strongly supported, with no evidence of hybridization between major clades. Our results also suggest incipient speciation in some geographic areas and point to future avenues of research in evolution and systematics of Antirrhinum.
Introduction
In botanical systematics and taxonomy, validly published species names are based on type materials, which are deposited in reference collections (herbaria). This way, any species is anchored to a single name and type material, i.e., a single specimen designated by taxonomists following the rules of the International Code of Nomenclature for Algae, Fungi, and Plants1. As a result, researchers can name any individuals or populations based on key characters contained in the type specimen, with the assistance of any other original materials.
Plant taxonomists have historically found two significant patterns: (1) not all plant groups have clear-cut characters circumscribing populations into species; and (2) unrelated species share similar morphological characters that have been independently acquired in the course of evolution (convergence and parallel evolution). The advent of molecular phylogenetics helped to tackle these two taxonomic obstacles. Taxonomy takes advantage of DNA sequence data not only for improving species circumscription, but also for species-level identification with the development of DNA barcoding (Li et al., 2015). In contemporary taxonomic studies, DNA sequences are frequently included to validate new species, whereas many historical specimens do not have sequences associated. These historical specimens include original material (the very specimens used for the first description of a species) and type material (physical specimen that serves as exemplar for any formal species name, preferentially selected from among the original material). However, sequencing of original and type materials usually faces two problems: (i) tissue destruction during DNA extraction, which may cause permanent damage to unique specimens (herbarium policies); and (ii) high DNA fragmentation because of specimen age, which hinders sequencing (Staats et al., 2011). Consequently, the utility of old herbarium specimens (including original and type materials) in phylogenetic studies is limited. To circumvent these two problems, an alternative approach relies on topotypic specimens, i.e., those collected at the type locality of a species, which usually corresponds to the locus classicus (the locality where plants were originally collected and studied for description of a new species). Topotypic specimens are expected to retain the genetic identity of the type material better than plants collected in any other locality. Unfortunately, researchers do not commonly use topotypic specimens, but rather identify species of a natural group (e.g., a genus) using the most recent taxonomic studies and then choose a few individual representatives of each species for sequencing based on convenience (neighboring populations, herbarium specimens, samples provided by experts, and garden individuals). Most phylogenetic reconstructions unfortunately ignore that any species name is ultimately linked to the type material, which is particularly critical when taxonomy is complex. In other words, to which degree can we rely on species-level phylogenetic relationships based on sequenced specimens whose genetic makeup may differ significantly from that of the type materials?
Taxonomy is particularly complex for plant groups actively evolving in biodiversity hotspots such as the Mediterranean region (Vargas et al., 2018). One of these groups is the model genus Antirrhinum L. (snapdragons), of which around 40 species have been historically proposed to circumscribe morphological differentiation of populations primarily distributed throughout the western Mediterranean. Published studies have repeatedly failed to obtain a well-supported phylogenetic structure using Sanger sequencing of nuclear and plastid DNA regions (Vargas et al., 2004, 2009; Carrió et al., 2010). A more resolved phylogeny was obtained by analyzing AFLP data, but species delimitation was still largely unresolved (Wilson and Hudson, 2011). A phylogenomic analysis based on genome-wide data is, however, promising to disclose evolutionary relationships among populations and species.
In this study, we investigated the phylogenetic structure of snapdragons (Antirrhinum species) by analyzing genome-wide genotyping-by-sequencing (GBS) data obtained from topotypic material of most species (36 specimens). In addition, materials of widespread species were collected from distant localities covering species distributions to test the monophyly of currently recognized taxa of Antirrhinum. Therefore, the main aim was to obtain a solid species-level phylogeny using specimens that are strongly linked to valid names. To this end, we tested two explicit taxonomic hypotheses proposed by the two worldwide taxonomic accounts of Antirrhinum published to date (Rothmaler, 1956; Sutton, 1988). We expected that species relationships and clade composition would help to propose a more consistent taxonomic and evolutionary framework for Antirrhinum at the species and supra-specific levels. Specific objectives were: (1) to analyze phylogenetic relationships of the populations and species described by previous authors; (2) to reconstruct primary and secondary centers of species diversification in a spatio-temporal framework; (3) to investigate the evolution of key morphological characters; and (4) to test the radiation hypothesis (abundant speciation from a common ancestor in a short period of time) proposed by previous studies.
Materials and Methods
Study System
Snapdragons (species of Antirrhinum) have been considered a model system for the study of plant genetics, development, and evolution since the 20th century because of their easy cultivation and morphological diversity (Schwarz-Sommer et al., 2003; Fernández-Mazuecos and Glover, 2017). The complexity of Antirrhinum systematics has historically been ascribed to the recent diversification of the genus, putatively accompanied by hybridization and introgression. In fact, dissimilar taxonomic treatments exist, of which those of Rothmaler (1956) and Sutton (1988) are the most complete to date. Rothmaler (1956) divided Antirrhinum into two sections: sect. Saerorrhinum and sect. Antirrhinum. Sect. Saerorrhinum comprised North American plants that are currently included in the genus Sairocarpus and other related genera, while sect. Antirrhinum comprised all the species currently included in the genus Antirrhinum. Rothmaler (1956) also split sect. Antirrhinum into three subsections: subsect. Antirrhinum, subsect. Kickxiella and subsect. Streptosepalum. These three subsections represent three major morphotypes/ecotypes: (1) species in subsect. Antirrhinum grow in sandy soils and have an upright tall habit, long thin leaves with no hairs and magenta or yellow flowers; (2) species in subsect. Kickxiella inhabit rocks and are small, prostrate, xerophytic woody plants; and (3) species in subsect. Streptosepalum occur on rocky substrates and have long thin leaves, glandular hairs only on the inflorescence and large yellow flowers (Figures 1, 2; Wilson and Hudson, 2011). The Iberian Peninsula appears to be the center of diversification of snapdragons (Vargas et al., 2014), although the distribution range of Antirrhinum encompasses most of Mediterranean Europe, northern Africa and the Middle East (Sutton, 1988).
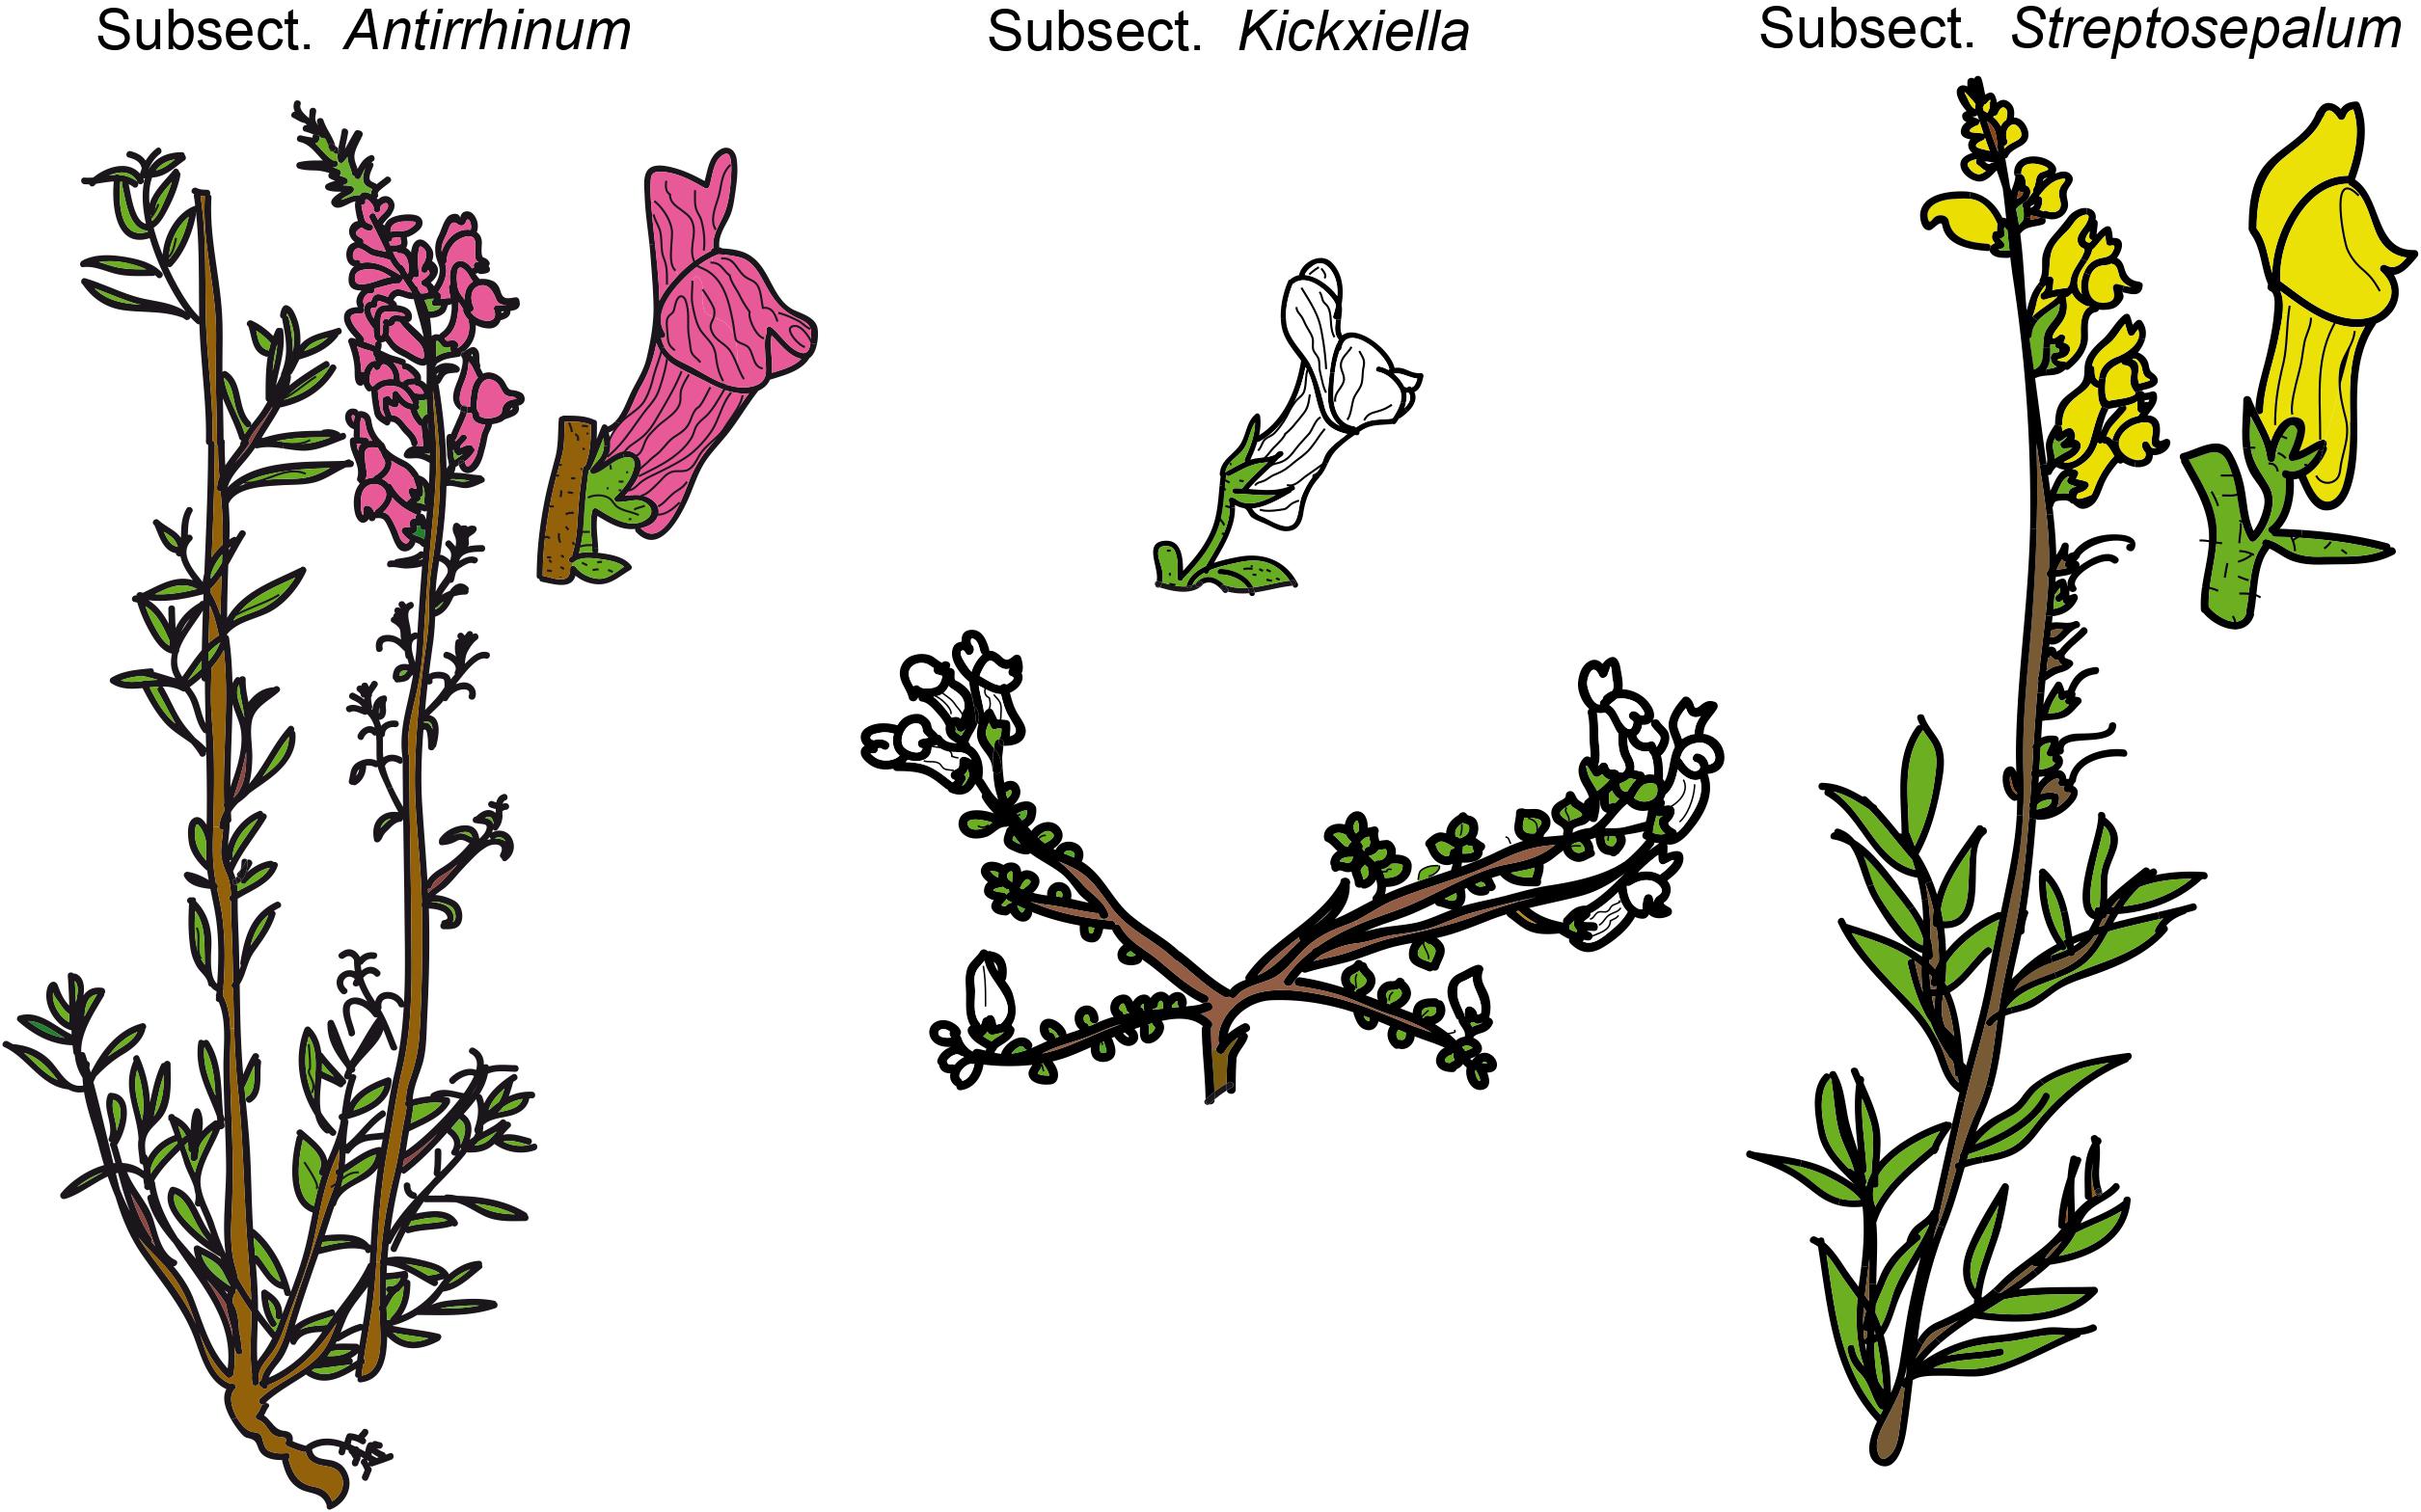
Figure 1. Schematic drawings of the three morphotypes of Antirrhinum based on the Rothmaler (1956) subsections. Drawings have been adapted from Güemes (2009).
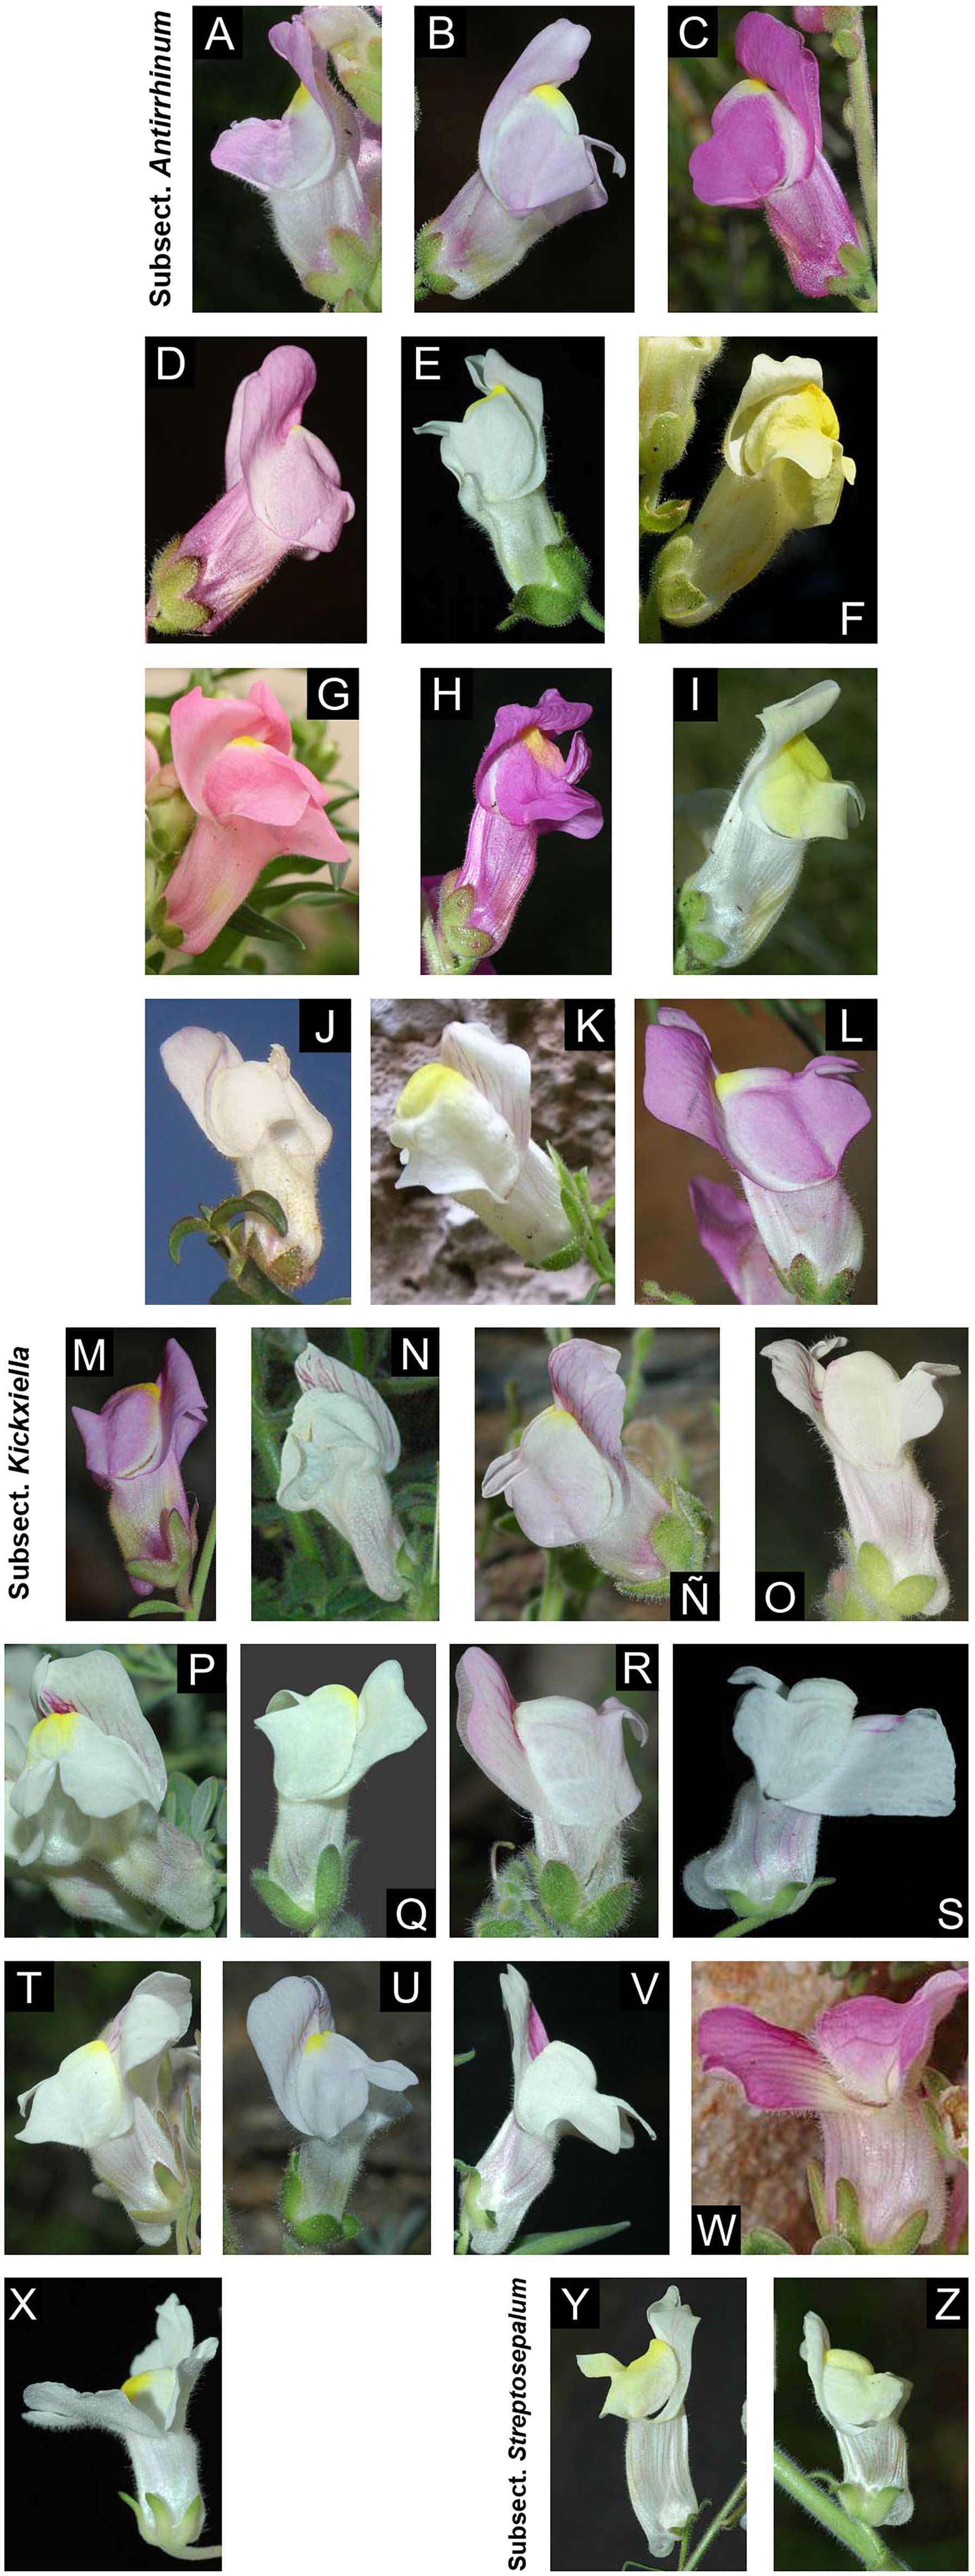
Figure 2. Diversity of flower color and shape in the 26 recognized species in this study. The photographs are arranged by subsections: subsect. Antirrhinum (A–L); subsect Kickxella (M–X); and subsect. Streptosepalum (Y-Z). Photographs: (A) A. australe; (B) A. barrelieri; (C) A. cirrhigerum; (D) A. controversum; (E) A. graniticum subsp. graniticum; (F) A. latifolium; (G) A. linkianum; (H) A. majus subsp. majus; (I) A. majus subsp. striatum; (J) A. onubensis; (K) A. siculum; (L) A. tortuosum; (M) A. charidemi; (N) A. grosii; (Ñ) A. hispanicum; (O) A. lopesianum; (P) A. microphyllum; (Q) A. molle; (R) A. mollissimum; (S) A. pertegasii; (T) A. pulverulentum; (U) A. rupestre; (V) A. sempervirens; (W) A. subbaeticum; (X) A. valentinum; (Y) A. braun-blanquetii; and (Z) A. meonanthum. All photographs were taken in Spain by Pablo Vargas, except for (F) van der Strate, Saxifraga Foundation; (G) (Luis Nunes; Wikipedia); (K) (Denis Barthel; Wikipedia), and (W) (José Quiles; www.florasilvestre.es). Locations for each photograph is detailed on Supplementary Material (see Supplementary Data Sheet 1).
Specimen Sampling
The sample was designed to obtain the phylogenetic structure of Antirrhinum based on the majority of the taxa validly described at the species level. A total of 32 of the 34 species included in the taxonomic treatments of Rothmaler (1956) and Sutton (1988) were sampled. Three more species recognized by specialists after Sutton’s (1988) account, were sampled: A. onubensis (Fernández-Casas, 1987), A. subbaeticum (Güemes et al., 1993), and A. rothmaleri (García-Barriuso et al., 2011) (see Güemes, 2009; Table 1 and Supplementary Table 1, in Supporting Information). The only two species in Rothmaler (1956) and Sutton (1988) of which no material was found were A. ambiguum Lange and A. martenii (Font Quer) Rothm. In the locus classicus of the former species (El Escorial, Madrid) we collected some snapdragons, but they had morphological characters more similar to those of A. graniticum than to the description (protologue) of A. ambiguum. Unfortunately, A. martenii from Morocco has not been found since description (1956), including unsuccessful collecting campaigns in recent times (E. Carrió pers. com.).
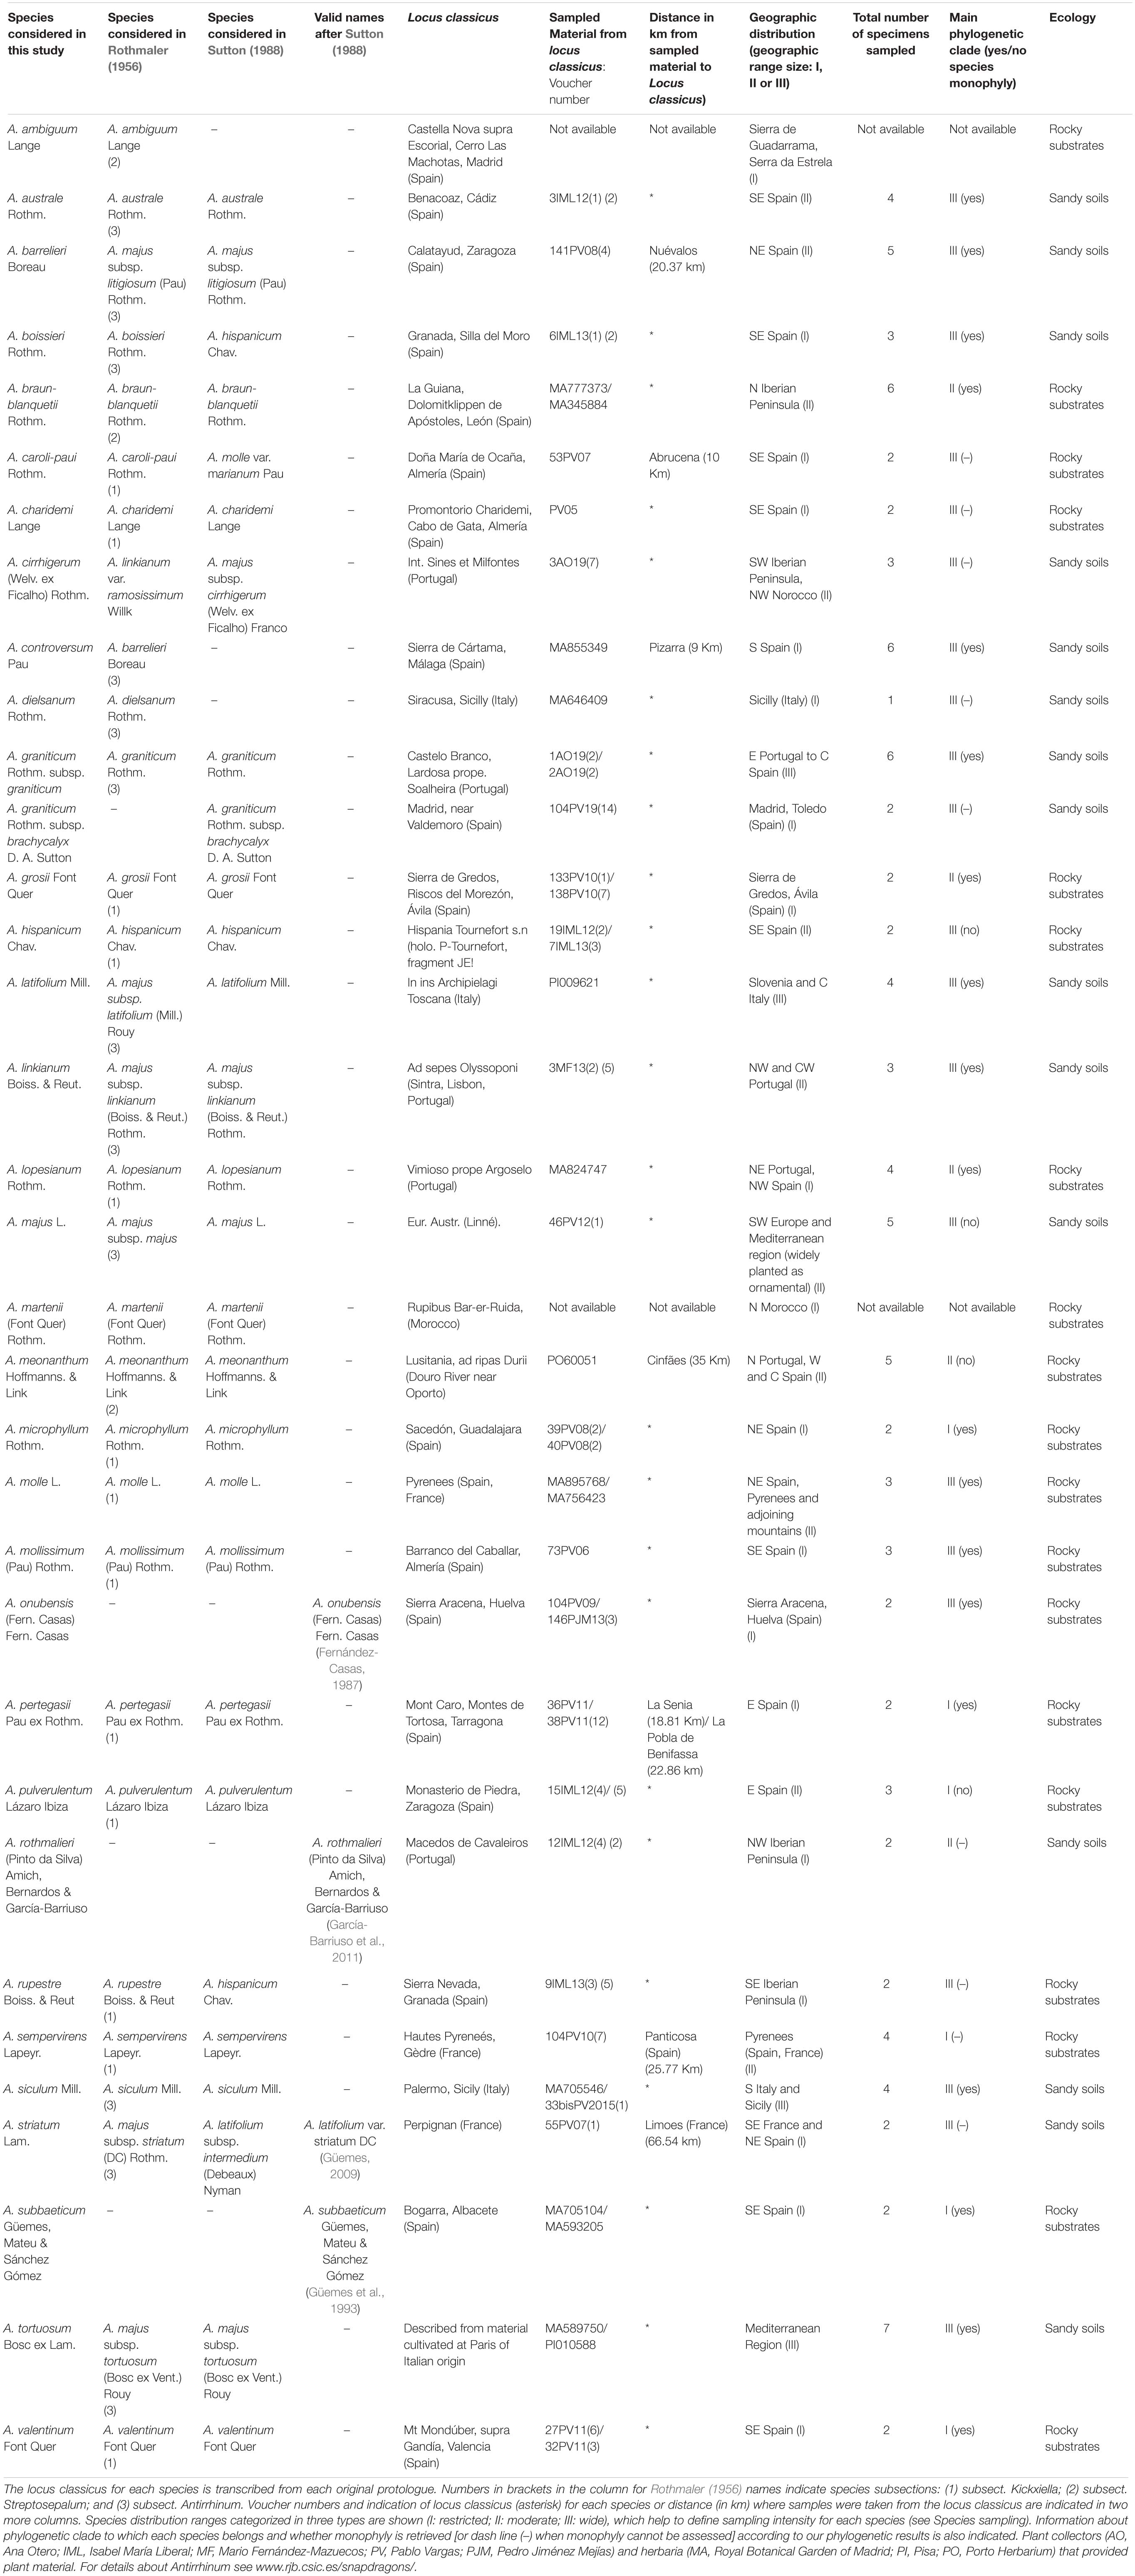
Table 1. Species considered for this study, including species names from the two worldwide accounts of Antirrhinum (Rothmaler, 1956; Sutton, 1988) and new species described after Sutton (1988).
The type species of the genus (A. majus) was described from cultivated specimens (Linnaeus, 1753), and thus it is not possible to localize its original source with certainty. Sutton (1988) indicates that the most characteristic morphological features of A. majus are found in wild populations of southern France and north-eastern Spain, where we sampled three specimens (see Supplementary Table 1). For the remaining species, a minimum of two topotypic specimens per species were sampled. When we failed to sample at the locus classicus itself, plants from nearby locations were collected. To test monophyly of each species, additional populations (from two to five depending on species range size) were sampled from distant locations. Based on distribution ranges reviewed by Vargas et al. (2009), three range size categories were considered: (I) widely distributed species (four to six samples); (II) moderately distributed species (three to five samples); and (III) narrowly distributed species (two to three samples) (see Table 1). As a result, 108 samples of Antirrhinum were initially included as the ingroup. Ten samples of genera belonging to the sister clade to Antirrhinum (Fernández-Mazuecos et al., 2019) were sampled as the outgroup (Supplementary Table 1). Most materials were collected in multiple field campaigns (2005–2019) or obtained from herbarium specimens (JACA, LEB, MA, MGC, PI, PO, and SALA).
DNA Extraction and GBS Library Preparation
DNA was extracted from leaf tissue (c. 20 mg) using a modified CTAB protocol (Doyle and Doyle, 1987; Cullings, 1992) and extractions were quantified at the Next Generation Sequencing Lab (Real Jardín Botánico, CSIC, Madrid, Spain) using a Qubit Fluorometer (Thermo Fisher, Waltham, MA, United States). The 118 genomic DNA samples (ingroup plus outgroup samples, 500 ng of DNA per sample when available) were sorted into two 96-well plates, and four samples per plate were replicated in order to evaluate possible biases derived from the lab technique, thus raising the total number of samples to 126. These were used to prepare two separate GBS libraries using the PstI-HF restriction enzyme and following the previously published procedures of Fernández-Mazuecos et al. (2018), which were adapted from Elshire et al. (2011), Escudero et al. (2014), and Grabowski et al. (2014) with some modifications. The 500 ng of genomic DNA per sample were combined with 0.6 pmol of a sample specific barcode adapter and 0.6 pmol of common adapter. Four units of PstI-HF (NEB, MA, United States) were used for the digestion step at 37°C overnight. The ligation step was done using 400 units of T4 DNA Ligase (NEB, MA, United States) at room temperature for 4 h. Then, 50 ng of each sample were pooled and purified with Agencourt AMPure XP beads (Beckman Coulter, CA, United States). DNA pools of each library were amplified for 19 PCR cycles using NEB 2x Taq MasterMix (NEB, MA, United States). The PCR products were purified using different ratios of AMPure beads. Concentration and fragment sizes were assessed in a 2100 Bioanalyzer (Agilent Technologies, CA, United States) at the genomic facilities of Real Jardín Botánico (CSIC, Madrid, Spain). The optimal purification ratio of AMPure beads (1:1) yielded a concentration of 2.13 and 2.63 ng/μl, with an averaged fragment size of 498.5 and 561 bp for each library, respectively. Both libraries were submitted to Macrogen Inc. (Seoul, South Korea) for 150 bp HiSeqX Illumina paired-end sequencing. Quality control of sequencing results was conducted in FastQC 0.11.7 (Andrews, 2010).
Data Assembly
The FASTQ sequence files from the two libraries were processed in ipyrad v.0.9.4 (Eaton and Overcast, 2020). Ipyrad is an assembly pipeline implementing seven sequential steps that have been specifically developed for the processing of high-throughput sequencing results derived from restriction digest-based methods such as GBS. We first demultiplexed and filtered reads from both libraries separately (steps one and two) using the default threshold of 33 quality score for filtering of reads, and then combined all samples from both libraries for subsequent assembly steps. Data were assembled using the reference mapping method, incorporating BWA and Bedtools algorithms (Li and Durbin, 2009; Quinlan and Hall, 2010), in which GBS reads are mapped to a reference genome to determine homology and all sequences that do not match the reference genome are discarded. As reference, we used the genome of the cultivar line JI7 of A. majus published by Li et al. (2019). Samples with low-quality results (<100 sequenced loci in preliminary assemblies) were discarded, leading to a total of 87 samples in the final datasets (trimmed dataset). Additional datasets were produced including topotypic specimens only (topotypic dataset, 38 samples; see Table 2). To assess the sensitivity of the results to data matrix completeness and number of loci, we tested four values of minimum taxon coverage, i.e., the minimum number of sequenced samples for a locus to be considered in the final matrix (m4, m6, m18, and m36). Thus, a total of eight assembled datasets were produced (see Table 2).
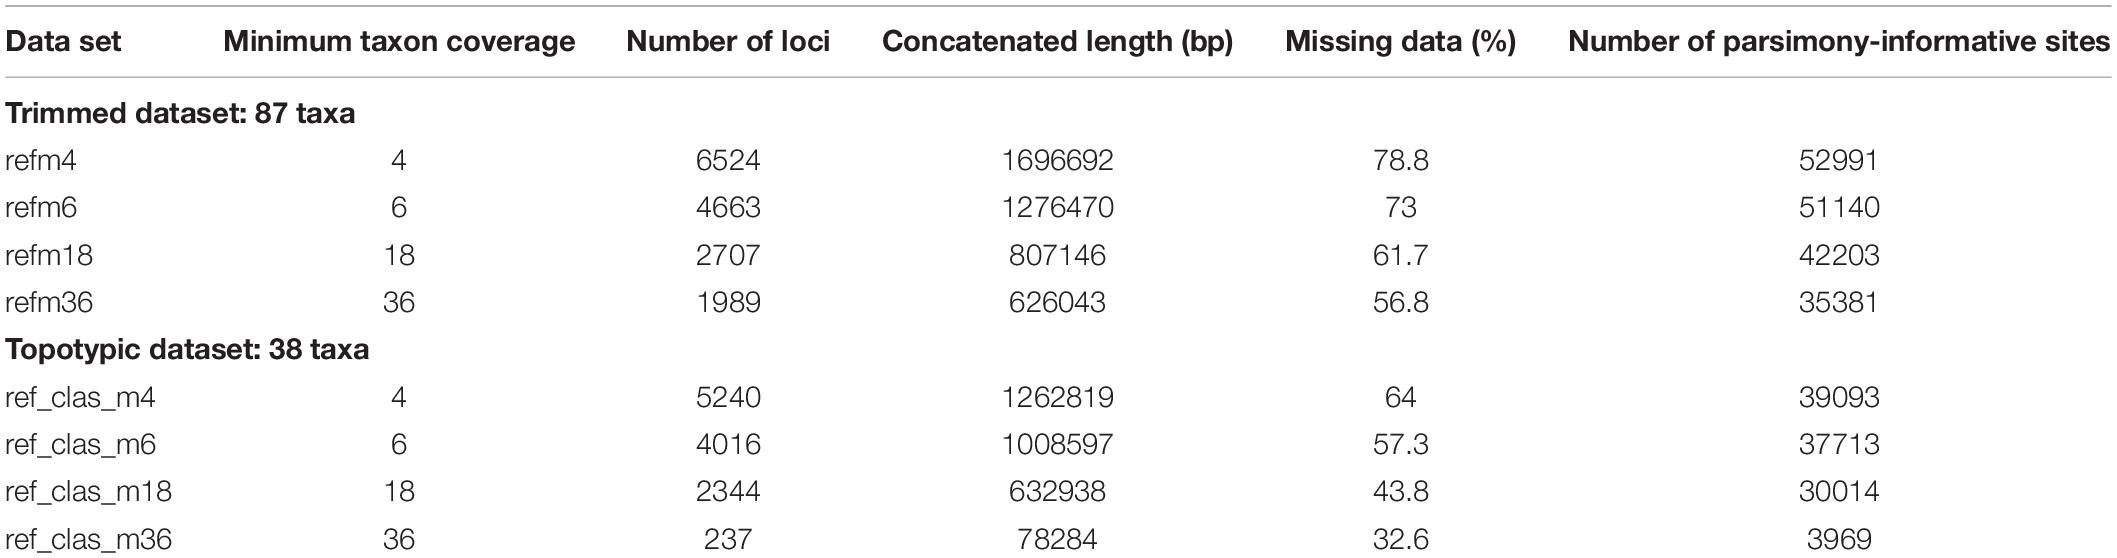
Table 2. Parameter combination of nucleotides assembled GBS datasets generated in ipyrad and used in the phylogenetic analyses.
Phylogenomic Analyses
Maximum likelihood (hereafter ML) analyses of the eight matrices of concatenated loci were performed through RAxML BlackBox (Stamatakis et al., 2008) by using the GTRCAT model of nucleotide substitution and automatic bootstrap stopping as recommended in CIPRES Portal (Miller et al., 2010). Among the four topologies obtained for each dataset (trimmed and topotypic dataset), we chose the one with the highest average bootstrap support (BS) for downstream phylogeny-based analyses. The matrices producing the best RAxML trees were also analyzed using Bayesian inference in ExaBayes 1.5 (Aberer et al., 2014), implemented in the CIPRES. We specified two runs, four coupled chains, one million generations with a sampling frequency of 500 and a burn-in proportion of 0.1. Convergence and effective sample size (ESS) values for all parameters were assessed using Tracer v.1.6 (Rambaut et al., 2014).
We additionally implemented the coalescent-based method SVDquartets (Chifman and Kubatko, 2014) in PAUP (Swofford, 2001). Individuals were grouped according to current species circumscriptions. All possible quartets were evaluated with 100 bootstrap replicates.
Estimates of Divergence Times
We used penalized likelihood as implemented in TreePL (Smith and O’Meara, 2012) to estimate a time-calibrated tree for the topotypic dataset using the best RAxML tree. TreePL is suitable for divergence time estimation when dealing with large amounts of data, such as those yielded by GBS (Zheng and Wiens, 2015). The tree was pruned to include a single topotypic individual per species of Antirrhinum by choosing the individual with the highest number of loci retrieved from the assembly. Two calibration points were used: (i) root age (minimum age = 11.0583; maximum age = 21.58182) and (ii) crown node of Antirrhinum (ingroup) (minimum age = 2.1168; maximum age = 5.6736) based on the 95% Highest Posterior Density (HPD) intervals inferred in Fernández-Mazuecos et al. (2019) and Gorospe et al. (2020). We first conducted an analysis under the “prime” option to select the optimal set of parameter values. Then we set the gradient-based (opt) optimizer to one, and autodifferentiation-based (optad) and autodifferentiation crossvalidation-based optimizers (optcvad) to two. Then, we ran a second analysis using random subsample and replicate crossvalidation (RSRCV) to identify the best value for the smoothing parameter. We ran the final analysis by setting the best chi-square value for the smoothing parameter (smoothing = 1e-129). For all runs, we used the thorough analysis option and set 200,000 iterations for penalized likelihood and 5,000 iterations for cross-validation. Based on estimated crown age, net diversification rate was calculated following the whole-clade method of Magallón and Sanderson (2001), implemented in the R package Geiger (Harmon et al., 2007).
Biogeographic Reconstruction
For biogeographic analyses we used the ultrametric tree resulting from TreePL after pruning the outgroup to avoid anomalous inferences of ancestral areas that may have resulted from the difference in sampling depth between outgroup and ingroup lineages. This approach also circumvents the potential effect of extinction between the outgroup and the ingroup expected after millions of years since the Oligocene (Gorospe et al., 2020). We additionally excluded four taxa originally described as different species but with limited phylogenetic and morphological distinctiveness that may have produced biogeographic bias: A. rothmalieri, A. dielsianum, A. caroli-paui, and A. boissieri. Areas for biogeographic reconstruction were based on the set of areas of endemicity for Antirrhinum proposed by Vargas et al. (2009). As a result, we considered six areas: (1) northwest of the Iberian Peninsula; (2) northeast of the Iberian Peninsula; (3) southwest of the Iberian Peninsula; (4) southeast of the Iberian Peninsula; (5) northern Africa; and (6) remaining circun-Mediterranean areas (non-Iberian Europe and SW Asia). We tested dispersal-extinction-cladogenesis (DEC, Ree and Smith, 2008) and dispersal-vicariance (DIVA, Ronquist, 1997) models using the “BioGeoBEARS” package (Matzke, 2013) in R (R Core Team, 2013) with no constraints in dispersal rates and adjacency between areas. In particular, the “BioGeoBEARS” package implements a likelihood interpretation of the parsimony-based DIVA method (DIVALIKE), i.e., processes are modeled as in DEC modeling, but including only the parameters considered in DIVA (widespread vicariance but not subset sympatry; Ronquist and Sanmartín, 2011). AIC was calculated for the two models although, given the inadequacy of likelihood comparison between different biogeographic models, DEC and DIVA results were discussed based on biological criteria (see Ree and Sanmartín, 2018).
Ancestral State Reconstruction
To evaluate the evolution of taxonomic characters traditionally used for Antirrhinum species delimitation, we selected four traits that best represent vegetative and reproductive variation used in dichotomous keys of the two main Antirrhinum monographs (Rothmaler, 1956; Sutton, 1988). Based on the consistent use of three reproductive characters in the two keys to Antirrhinum species, discrete traits were selected and codified as: (1) color of the corolla (yellow or pink/purple/white); (2) corolla size (large: >30 mm; or small: <30 mm); (3) capsule size (using the midpoint of the range provided by the keys, large: >10 mm; or small: <10 mm). In addition, we reconstructed the evolution of three major morphotypes as a discrete character with three states (Antirrhinum, Kickxiella, and Streptosepalum; see Figure 1) based on the subsectional classification of Rothmaler (1956). Ancestral state reconstructions were conducted using a stochastic character mapping approach (SIMMAP) implemented in the R package “PHYTOOLS” (Revell, 2012; R Core Team, 2013) and using the ultrametric tree resulting from TreePL as the input (after pruning the outgroup and the four conflicting taxa as previously done for biogeographic analyses, see above). For these analyses we tested up to three models of trait evolution differing in the transition rates among states: (i) equal rates (ER; rates are equal for all transitions among states); (ii) symmetric rates (SYM; transition rates vary, but backward and forward rates for each transition are equal); and (iii) different rates (ARD; all rates are different, including different backward and forward rates for each transition). We fit Mk models using the function “fitMk” of PHYTOOLS. The three models of trait evolution were tested for the three major morphotypes. For those traits with only two states, i.e., corolla color, and corolla and capsule size, model SYM was not applicable, and therefore only ER and ARD were tested. The best-fit model for each trait was chosen according to the Akaike Information Criterion (AIC). Two hundred stochastic reconstructions were simulated using the function “make.simmap.” As a result, a summary tree of each of the 200 simulations was obtained from each character reconstruction.
Introgression Tests
We evaluated the potential introgression between early-diverging lineages in clade III and species in clades I + II (see Figure 3 for major clades) by conducting four-taxon D-statistic tests (Durand et al., 2011) in PyRAD v. 3.0.6. D-statistic tests compare the occurrence of “ABBA” versus “BABA” patterns based on a four taxon pectinate topology: {[(P1, P2), P3], O} (Martin et al., 2015). Introgression either between P1 and P3 (BABA) or between P2 and P3 (ABBA) is suggested when one of those patterns is significantly more frequent than the other (Eaton et al., 2015). In particular, we tested introgression for A. molle, A. latifolium and A. siculum as suggested by previous results (Wilson and Hudson, 2011). This three species are involved in the early divergence in clade III (see Figures 3, 4). Therefore, we focused on three specific introgression hypotheses: (i) introgression between A. molle and clade I + II; (ii) introgression between A. latifolium and clade I + II; and (iii) introgression between A. siculum and clade I + II. To test these hypotheses, our pectinated four-taxon tree comprised: (1) the outgroup (O), which included the nine outgroup taxa of phylogenomic analyses; (2) P3, corresponding to a selection of two individuals per species from clade I + II, including at least one topotypic individual (see Supplementary Table 2); (3) P2, including all individuals from the three early-diverging lineages of clade III (A. molle, A. latifolium, and A. siculum); and (4) P1, comprising a selection of individuals from the remaining taxa of clade III following the same criteria as for P3 (see Supplementary Table 2). Combination of different individuals yielded a total of 46,980 ABBA-BABA tests. As input, we used the dataset that had produced the tree with the highest bootstrap average. Two hundred bootstrap replicates per test were run. We calculated percentages of tests with significant results (based on adjusted p-values calculated with the Holm–Bonferroni method; α = 0.05) for the three set of tests corresponding to the three introgression hypotheses.
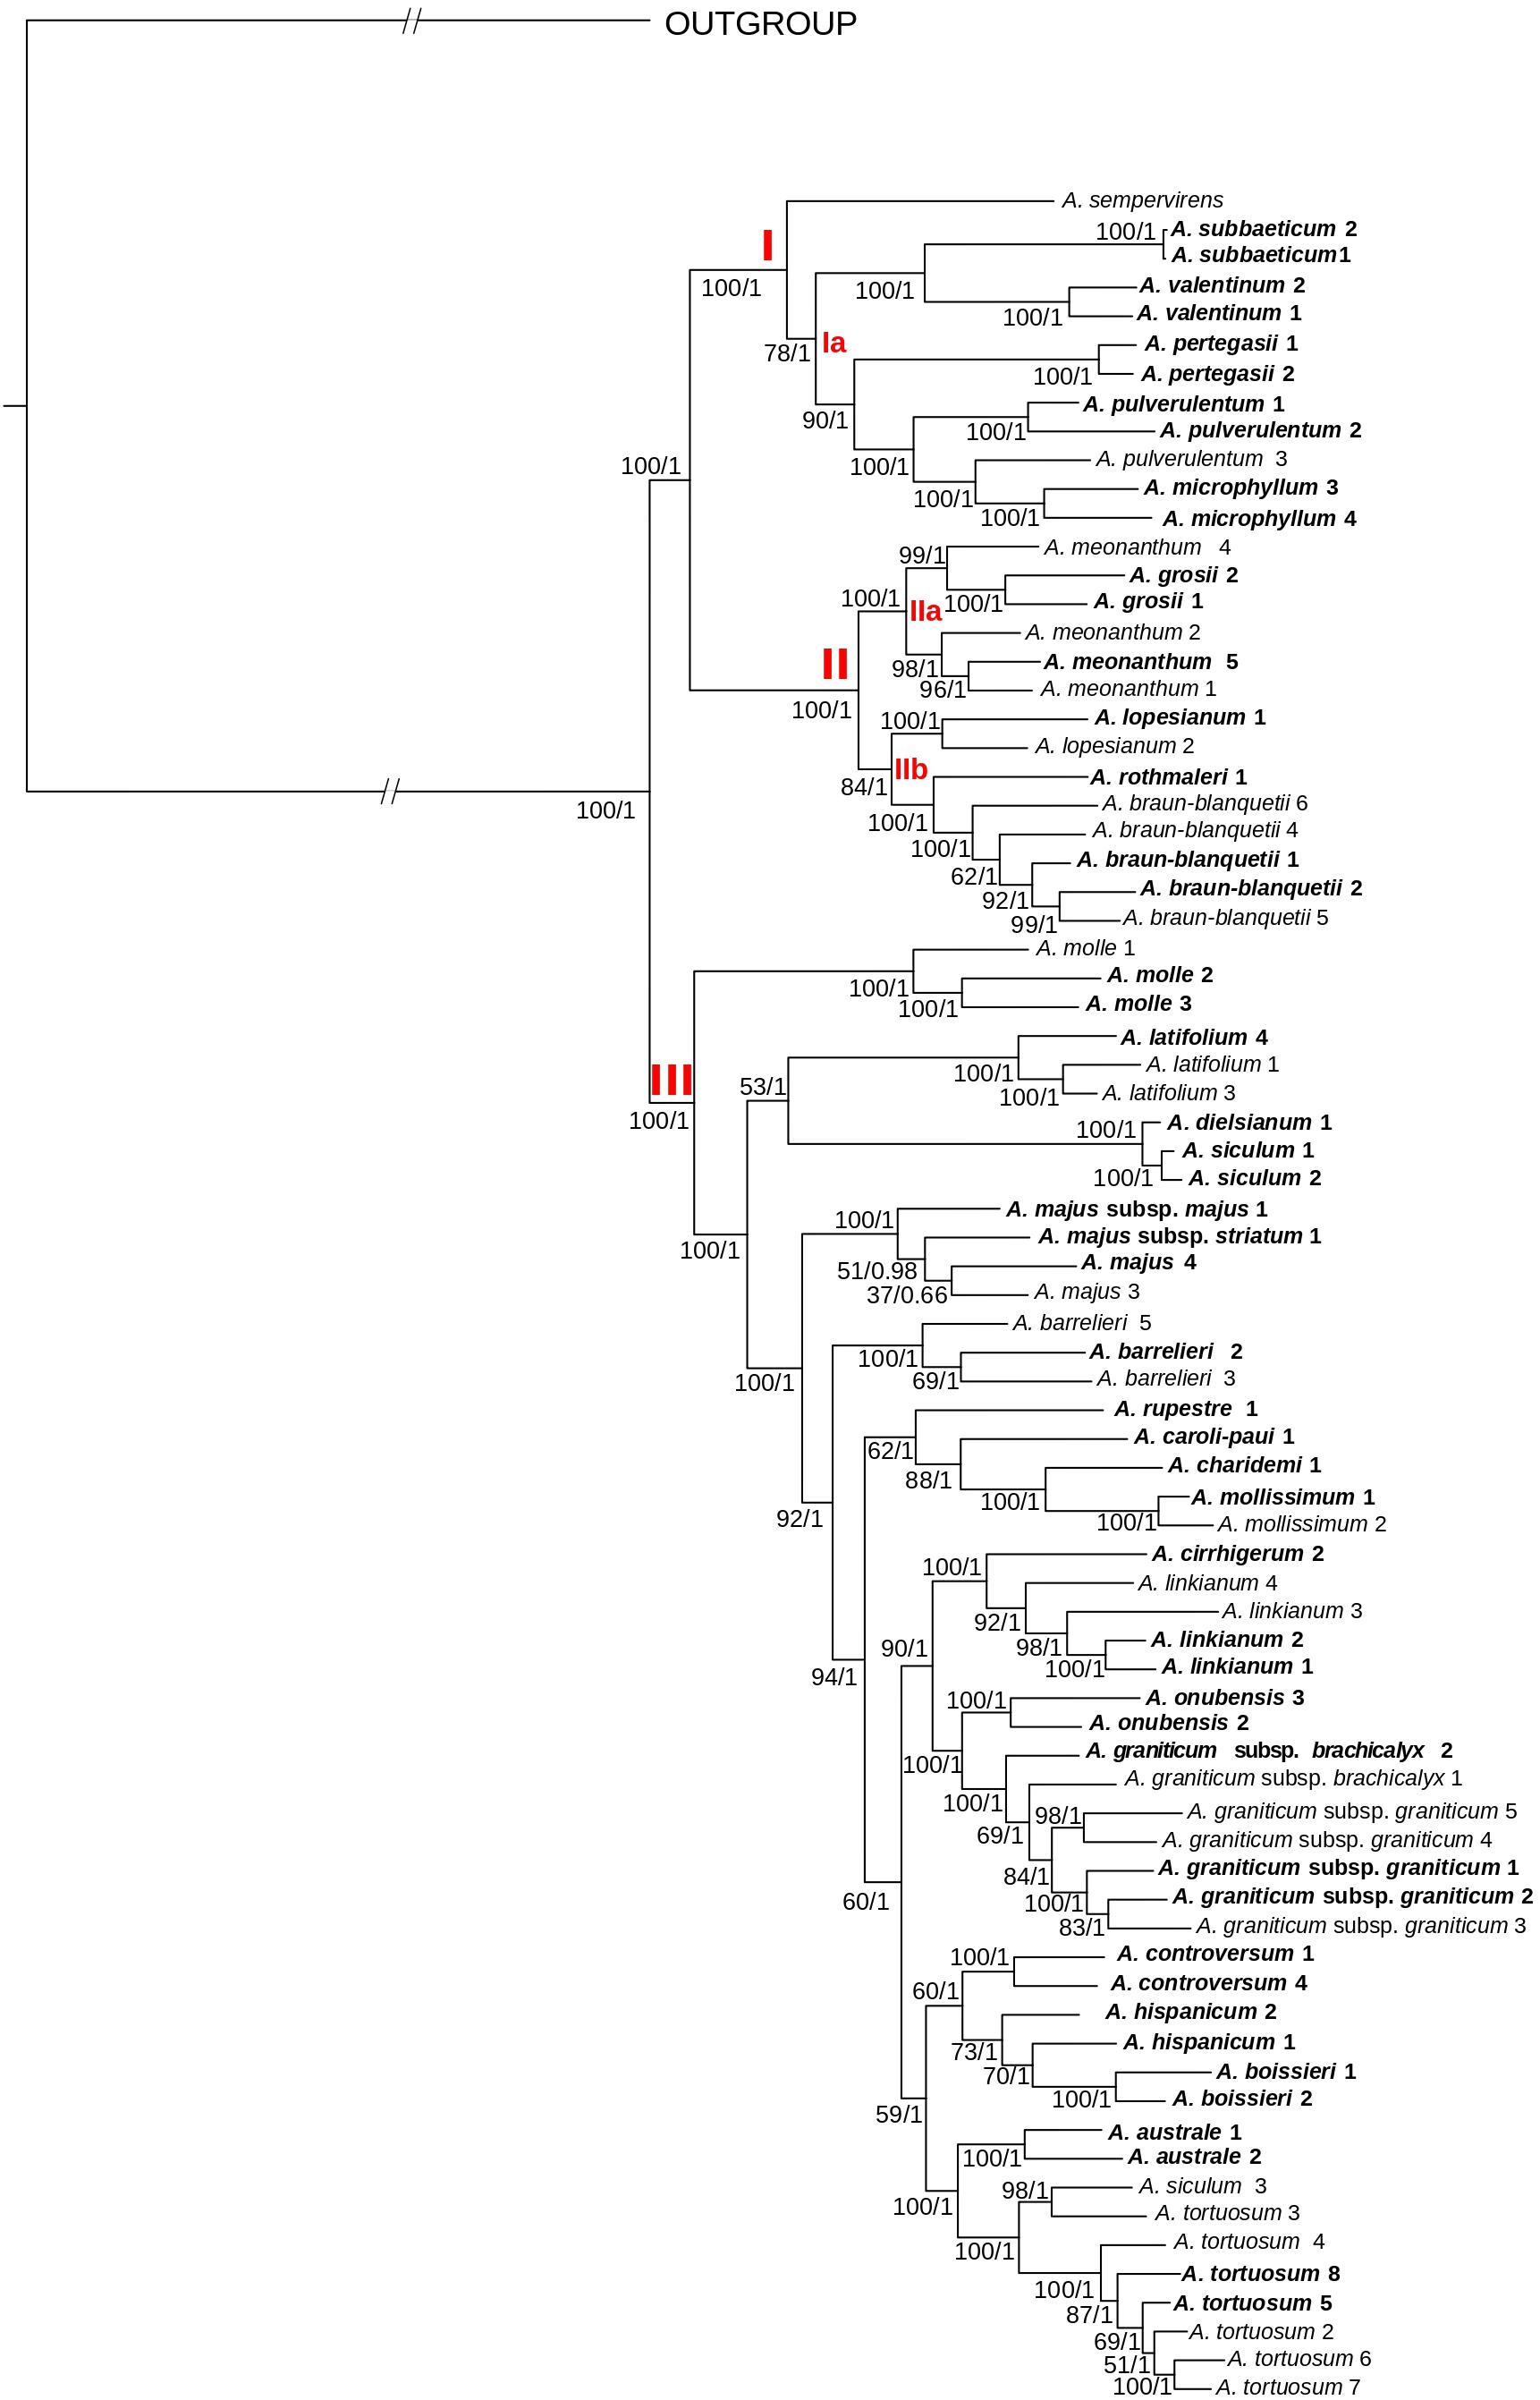
Figure 3. Phylogenetic reconstruction of Antirrhinum based on concatenated DNA sequences of 4,663 genotyping-by-sequencing loci (c90m6 dataset) obtained from a wide sample of specimens representing the geographic distribution of species. The best scoring of the maximum likelihood tree from RAxML analysis is shown. Three major clades (I–III) and subclades (Ia, IIa, and IIb) are indicated in red letters. Values at branches are bootstrap support values from the maximum likelihood (RaxML) analysis followed by posterior probabilities from the Bayesian (ExaBayes) analysis. In bold, populations collected from topotypic localities, i.e., those where the type material was collected. Further voucher information for each specimen (indicated with name and numbers) is detailed in Supplementary Table 1 of the Supplementary Files.

Figure 4. Phylogenetic relationships of the 26 Antirrhinum species herein recognized based on concatenated DNA sequences of 4,016 genotyping-by-sequencing loci (c90m6 dataset) obtained from topotypic specimens. The best scoring maximum likelihood tree from RAxML analysis is shown. The three major clades (I–III) and a subclade (Ia) are indicated in red letters. Values at branches are bootstrap support values from the maximum likelihood (RAxML) analysis followed by posterior probabilities from the Bayesian (ExaBayes) analysis. Thicker branches are also supported by coalescent-based analyses in SVDquartets. An asterisk (*) at some taxon names (in brackets) indicates current synonyms for particular species. Further voucher information for each specimen is detailed in Supplementary Table 1 of the Supplementary Files.
Results
Data Assembly
Illumina sequencing provided c. 700 millions of reads for each of the two libraries, with a GC content between 42–44% and around 96% of bases with quality >Q20. FastQC analysis showed high quality of reads with low signal of adapters or other contaminants. Reference mapping assembly yielded between 237 and 6,524 loci, concatenated lengths between 78,284 bp and 1.69 Mbp, and percentages of missing data varying from 32.6 to 78.8% depending on the set of localities included (all localities or topotypic localities only) and minimum taxon coverage (see Table 2).
Phylogenetic Analysis and Divergence Time Estimates
Topologies resulting from ML analyses were mostly congruent among the eight matrices, with differences in bootstrap support (BS) values at some nodes (Supplementary Figures 1, 2). The highest BS values were obtained for the m6 matrices (minimum coverage of six samples per locus). Consequently, these matrices were used for further phylogenetic analyses (Figures 3, 4). In general, bootstrap support values were high (the majority at 100) except for some medium-terminal nodes (BS < 70). Monophyly of multiple populations in species recognized by Sutton (1988) was reconstructed in many cases. In addition, phylogenetic distinctiveness and morphological characters led us to recognize one more species (A. rupestre). For the sake of brevity, we show results of 26 species herein recognized for the genus Antirrhinum, which includes all the species of Sutton (1988) and those recognized after this publication (see Güemes, 2009), plus A. rupestre (Figure 3). Additional taxonomic reassessment includes the transference of yellow-flowered plants from Morocco previously identified as A. siculum (Fiz et al., 2000) to the polymorphic A. tortuosum based on morphological characters other than flower color.
Regarding the topology of the tree including all samples, three well-supported main clades were obtained: (1) clade I, including A. sempervirens as the earliest-diverging lineage, sister to a subclade (subclade Ia) formed by A. subbaeticum, A. valentinum, A. pertegasii, A. pulverulentum, and A. microphyllum (the latter nested within A. pulverulentum); (2) clade II, sister to clade I, and in turn formed by the two sister subclades IIa (A. meonanthum–A. grosii) and IIb (A. lopesianum–A. rothmalerii, A. braun-blanquetii); and (3) clade III, containing all remaining species. The latter clade showed a repeated pattern of nested lineage differentiation in which A. molle was inferred to be the earliest-diverging lineage (see Figure 3).
The same three main clades were reconstructed in the tree of topotypic specimens (Figure 4). Topology was congruent except for the position of A. barrelieri and phylogenetic relationships among some subclades, although with moderate bootstrap support (A. meonanthum–A. grosii; A. linkianum-cirrhigerum, A. graniticum-onubensis, and A. hispanicum–A. controversum–A. australe–A. tortuosum) (Figures 3, 4). For the tree including all localities, A. barrelieri was inferred as an isolated early-diverging lineage, sister to Antirrhinum species from S and SW Iberian Peninsula plus A. tortuosum, whereas for tree of topotypic specimens, A. barrelieri was inferred as nested within the S-SW clade, although with marginal bootstrap support value (BS = 77) (Figure 4). Bayesian inference in ExaBayes yielded the same topologies as ML, and most nodes showed maximum Bayesian posterior probabilities (BPP = 1) (Figure 4). Topologies from coalescent-based analyses using the SVDquartets method were congruent with concatenation-based phylogenies (Figure 4). The three major clades were also inferred with high BS, although lower BS values were obtained for internal subclades within clade III (Supplementary Figure 3).
Estimates of divergence times obtained from TreePL are shown in Supplementary Figure 4. A stem age of 16.85 myr and a crown age of 4.77 myr were inferred for Antirrhinum, leading to a diversification rate estimate of 0.54 spp. Myr–1 assuming an extant diversity of 26 species. A stem age of 4.32 myr was inferred for diversification of clades I and II, while estimated crown ages were 2.43 and 3.49, respectively. The estimated crown age for clade III was 4.36 myr. Divergence times from the Pleistocene onward (<2 myr) were inferred for most Antirrhinum species, with some exceptions in the Pliocene such as A. sempervirens, A. molle, A. siculum, A. latifolium, and A. majus (Supplementary Figure 4).
Biogeographic Analyses
The DEC model showed lower AIC values than the DIVA-like model (132.6 and 138.6, respectively), with ΔAIC > 2 (Anderson and Burnham, 2002). Overall, DEC and DIVA models resulted in biologically congruent reconstructions, although DEC resulted in lower uncertainty at some deep nodes (Figure 5). The DEC model inferred a widespread ancestral range for the genus Antirrhinum, most likely including the NW, NE, and SE of the Iberian Peninsula (pACD = 0.41; Figure 5A), whereas the DIVA model showed a widespread ancestral range including northern Iberia and non-Iberian Europe but with higher ambiguity (pADF = 0.33; Figure 5B). Ancestral range for the common ancestor of clades I and II was inferred to be most likely in northern and SE Iberia (pACD = 0.52) for the DEC model, and only in northern Iberia for the DIVA model (pAD = 0.84; Figure 5). Meanwhile, a NW Iberian ancestral range was congruently inferred for clade II by DEC and DIVA models (DEC: p = 0.99; DIVA: p = 0.99), while an eastern (DEC: p = 0.69) or NE (DIVA: pD = 0.82) Iberian ancestral range was obtained for clade I. A geographic split was inferred for the eastern widespread ancestor of the subclade Ia, which led to lineage differentiation in NE (A. pertegasii–A. pulverulentum–A. microphyllum) and SE (A. subbaeticum–A. valentinum) Iberia, with maximum probabilities for both DEC and DIVA models. Ancestral range for clade III was inferred as most likely in NE Iberia with (p = 0.44 in DIVA) or without (p = 0.50 in DEC) other areas. For both DEC and DIVA, lineage colonization within clade III was inferred from NE Iberia to SE Iberia, accompanied by speciation in the latter area (A. rupestre, A. charidemi, and A. mollissimum). Later on, the subclade formed by A. barrelieri and the remaining species had a widespread eastern ancestor that also colonized SW Iberia. Within this subclade, lineage colonization led to differentiation of SW lineages on one side (A. linkianum, A. cirrhigerum, and A. onubensis) and SE lineages on the other side (A. hispanicum, A. boissieri, A. controversum, and A. australe), while A. graniticum expanded to a larger area. Three independent events of colonization of northern Africa were inferred in clade III: (1) from non-Iberian Europe by A. siculum; (2) from SW Iberia by A. cirrhigerum; and (3) from SE Iberia or non-Iberian Europe leading to differentiation of the widely distributed A. tortuosum (Figure 5). Lineage expansion was inferred for A. linkianum because it has an ancestral origin in SW Iberia, with subsequent colonization of NW Iberia.
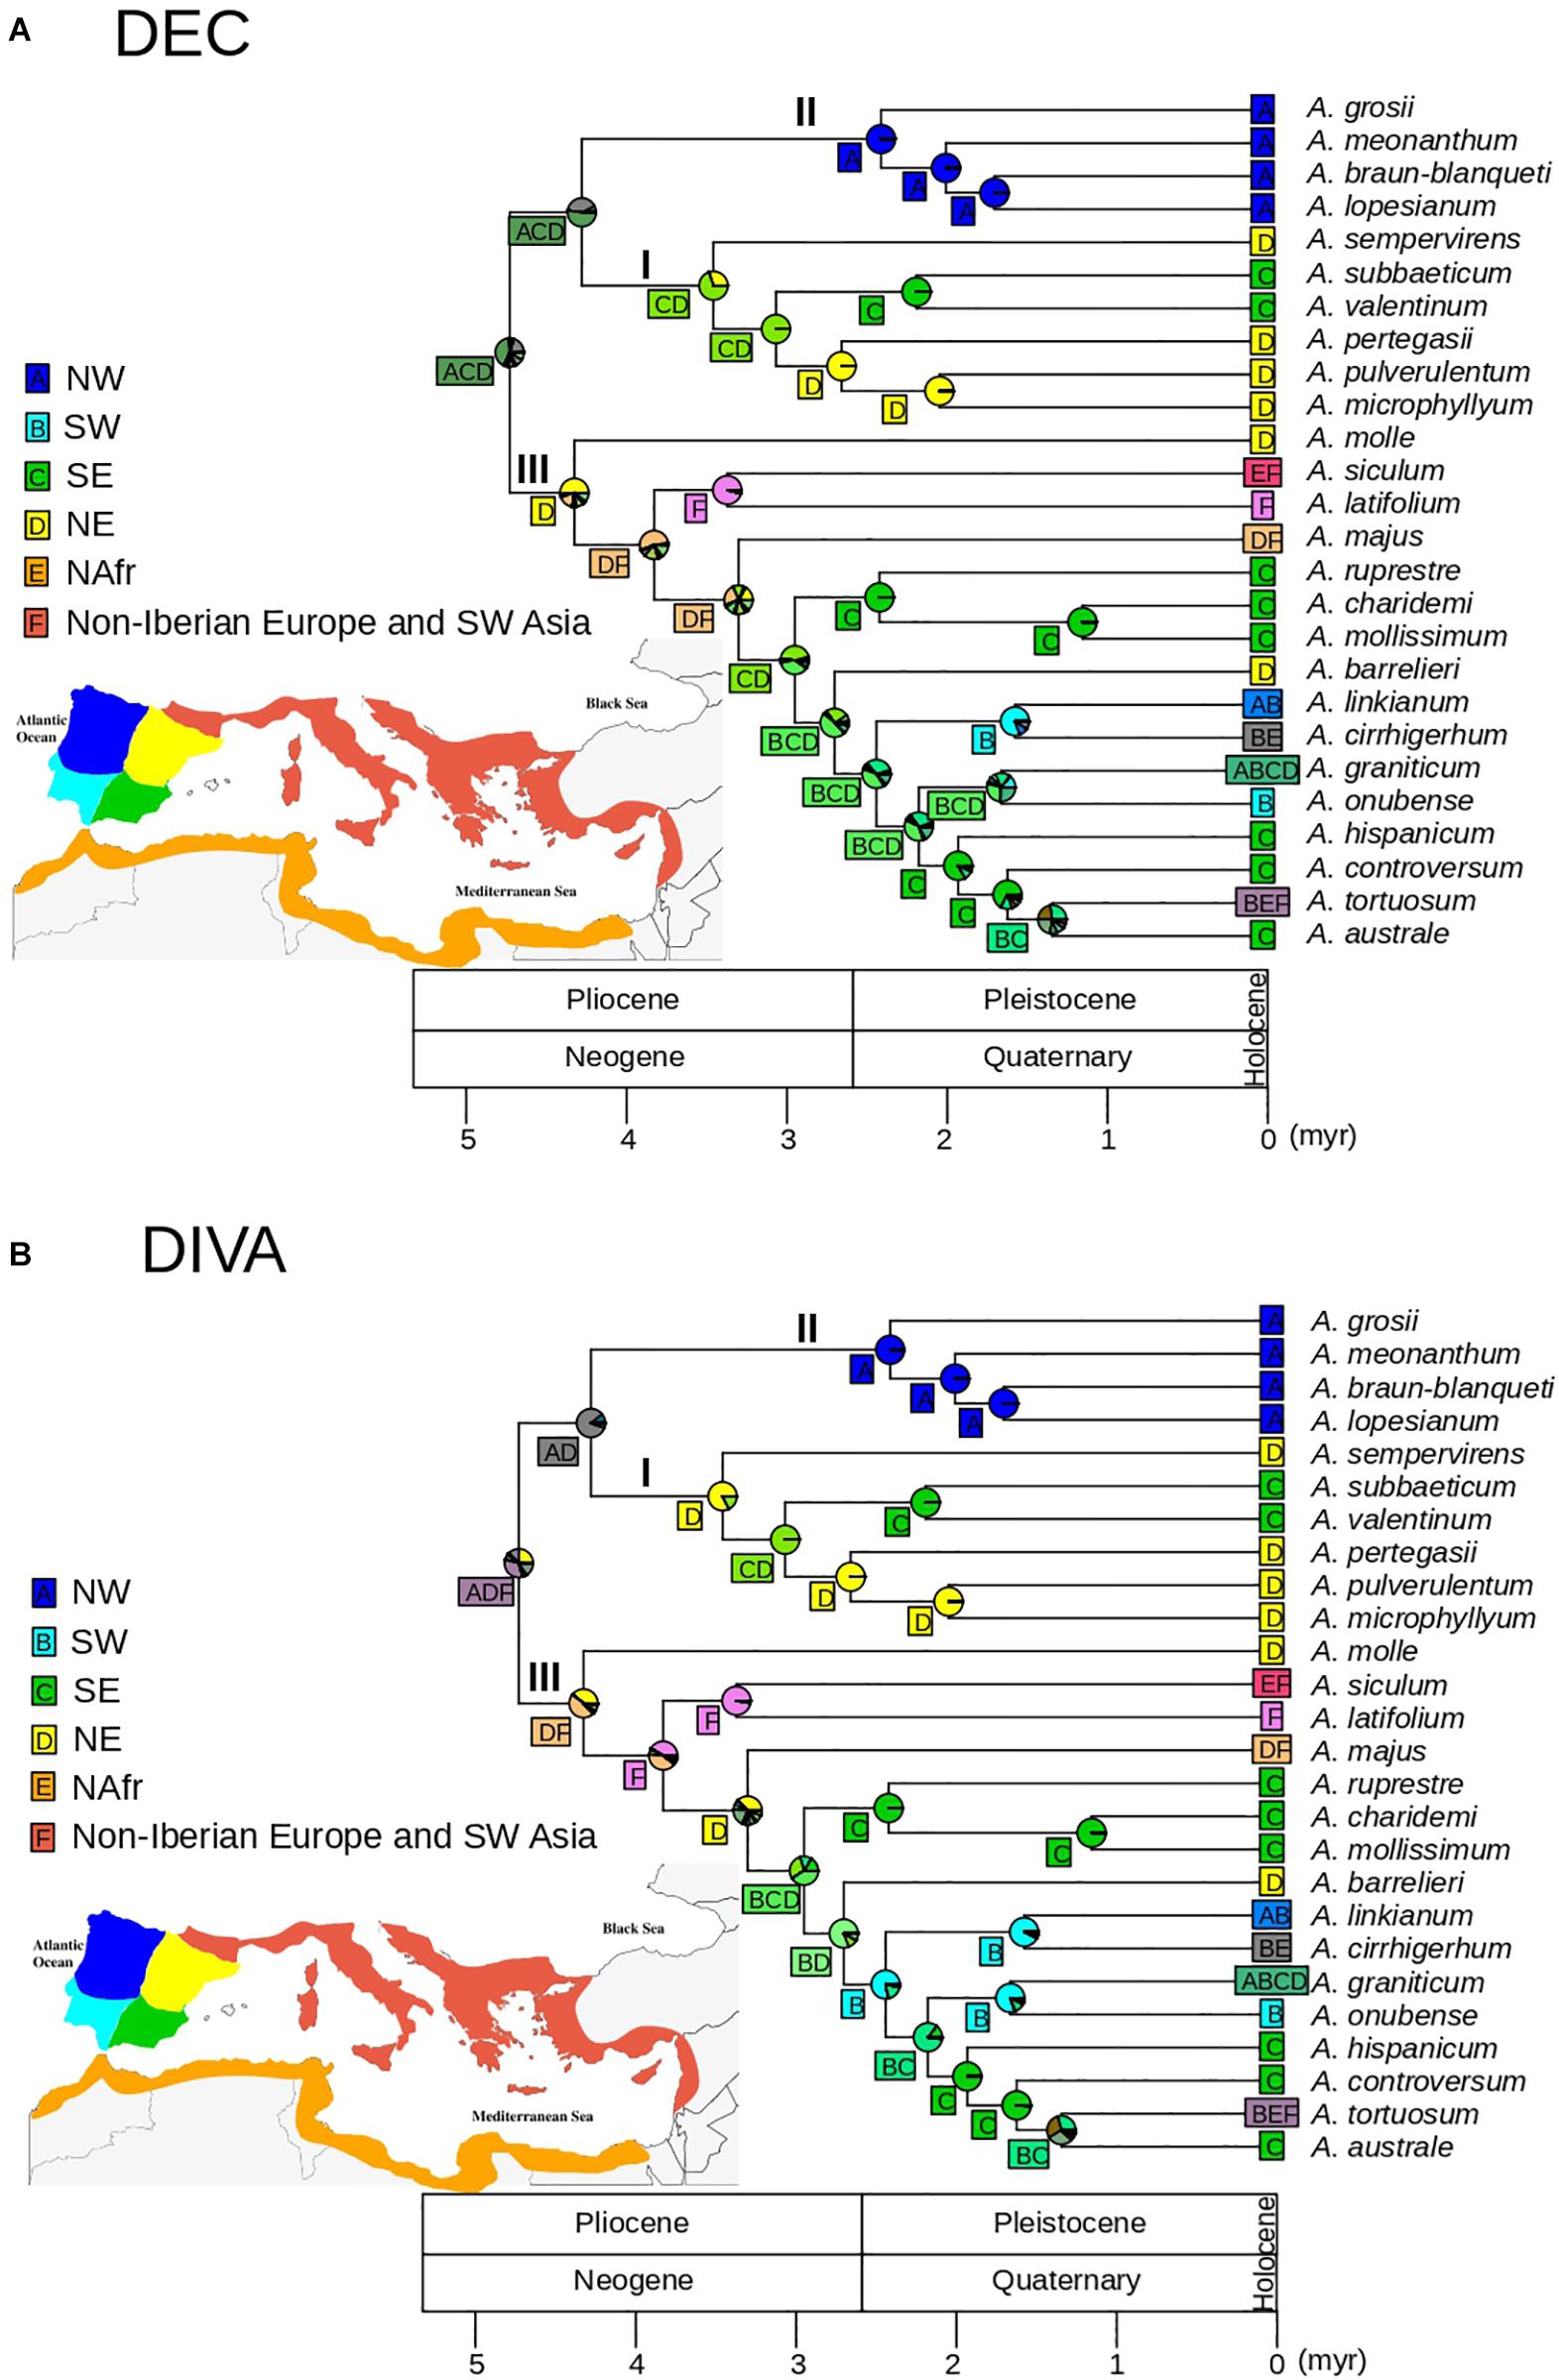
Figure 5. Biogeographic patterns for Antirrhinum estimated from the GBS phylogeny of topotypic specimens (see Figure 4) and inferred using a set of six areas previously defined: NW Iberia (A), SW Iberia (B), SE Iberia (C), NE Iberia (D), N Africa (E), and non-Iberian Europe and SW Asia (F) (see Vargas et al., 2009). Pie charts represent probabilities of alternative ancestral ranges at nodes based on the DEC (A) and DIVA (B) models. The most likely range areas at each node are indicated in a square.
Ancestral State Reconstruction
Ancestral state reconstruction estimated pink/purple/white corollas as the most likely state for all ancestors, with yellow corollas evolving six times independently (in A. meonanthum, A. braun-blanquetii, A. siculum–A. latifolium, and yellow-flowered populations of A. tortuosum and A. majus; Figure 6A). Large corollas were inferred as the most likely ancestral state for Antirrhinum, with multiple changes to smaller ones during the evolutionary history of the genus (Figure 6B). Acquisition of small corollas took place in the ancestors of clades I and II, but not clade III. This state was maintained to the present in all extant species of clades I and II except for A. braun-blanquetii, which showed a recent reversion to large corollas (Figure 6B). Within clade III at least six changes to small corollas were inferred (Figure 6B). Shifts in capsule size were inferred from the ancestral state of large capsules to small sizes for Clades I and II including a reversion to large size for A. braun-blanquetii (Figure 6C). Clade III maintained the ancestral state of large capsule with at least six shifts to small capsules toward the tips (A. molle, A. rupestre–A. charidemi–A. mollissimum; A. barrelieri; A. onubense; A. hispanicum; and A. controversum; Figure 6C). The Kickxiella morphotype (small prostate and xerophytic woody plants) was inferred as the most likely ancestral habit not only for the genus but also for the three main clades. The Antirrhinum morphotype (upright tall habit, long thin leaves with no hairs and magenta or yellow flowers growing in sandy soils) was acquired soon after divergence of clade III, and reverted twice to the Kickxiella morphotype in the evolution of four species. The Streptosepalum morphotype appeared to have evolved twice, giving rise to two species of clade II (Figure 6D).
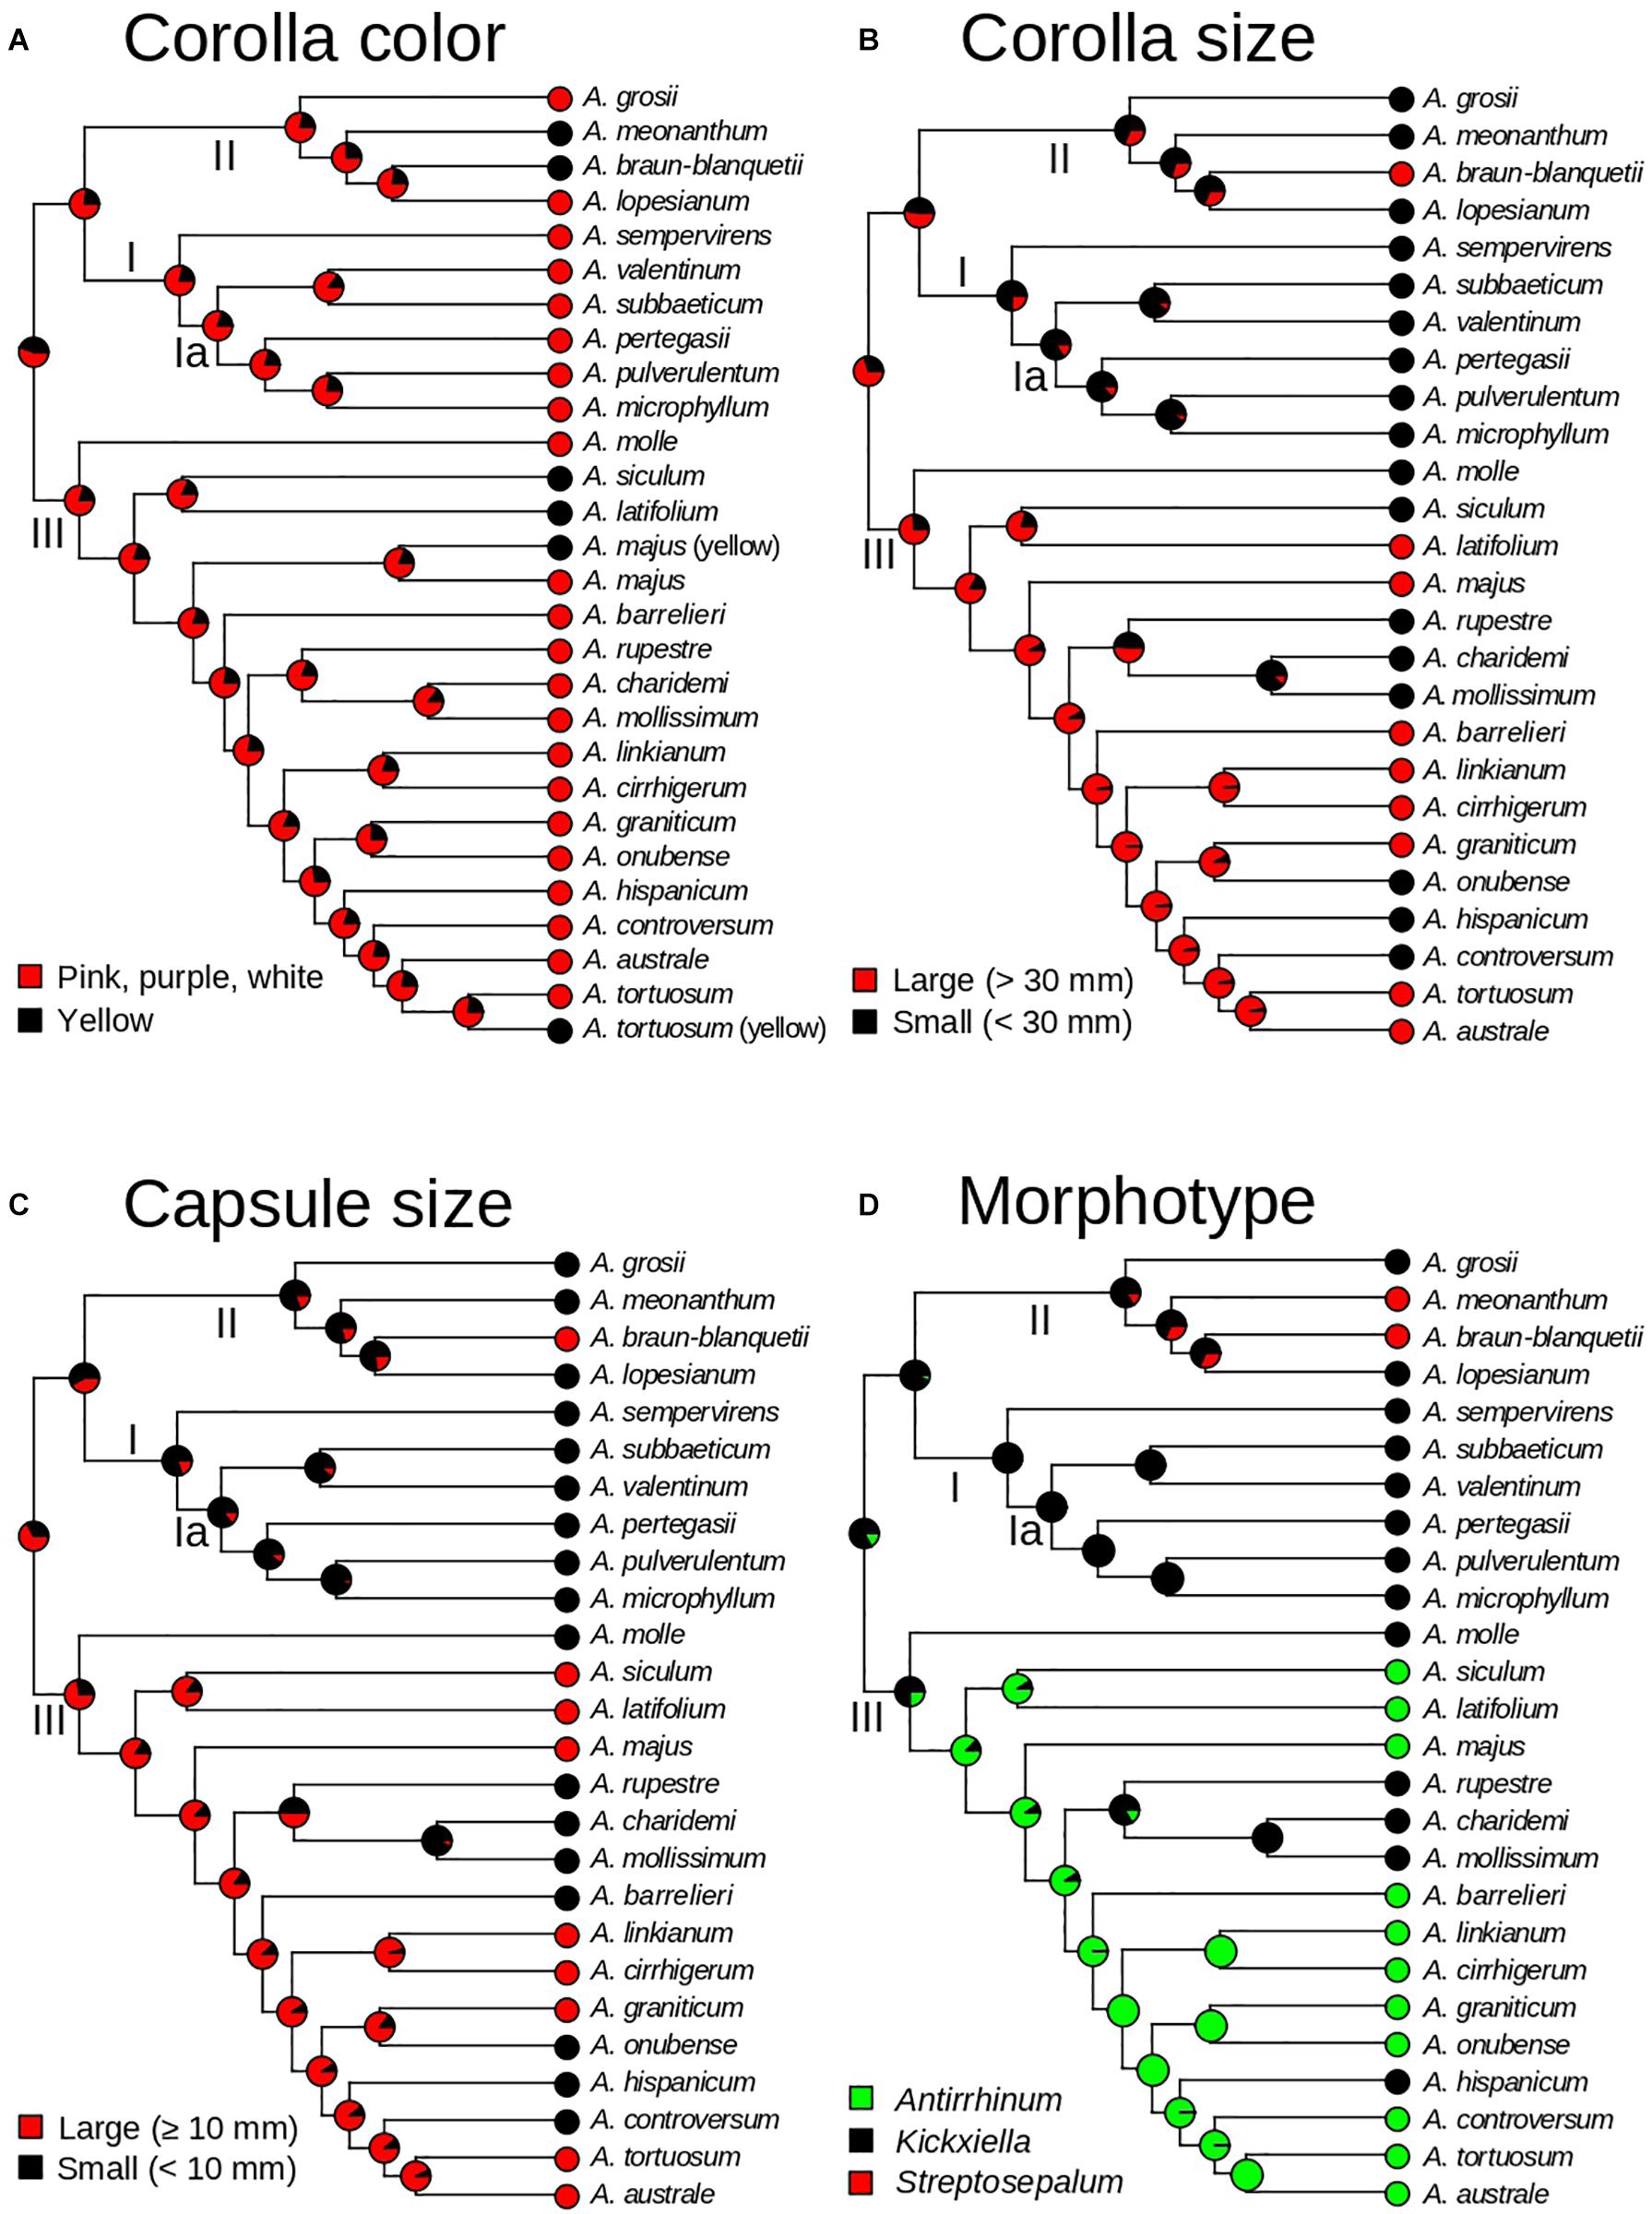
Figure 6. Evolution of morphological traits of Antirrhinum based on a stochastic character mapping approach (SIMMAP) and the GBS phylogeny of topotypic specimens (see Figure 4). Pie charts represent probabilities of alternative ancestral states at nodes after analyses of four traits: corolla color (A), corolla size (B), capsule size (C), and morphotype (D). Morphotypes are defined according to the three taxonomic subsections of Rothmaler (1956).
Introgression Tests
D-statistic analyses showed no significant ancestral introgression between any of the three early-diverging lineages of clade III (A. molle, A. latifolium, and A. siculum) and the clades I + II (see Table 3). However, ABBA-BABA tests suggested a certain level of introgression between remaining species of clade III and certain lineages of clade II. In particular, A. lopesianum was involved in 276 of 406 tests that yielded significant results for introgression of clade II and lineages from clade III (see Supplementary Table 2). None of the individuals of clade I was suggested to have experienced significant introgression with clade III.
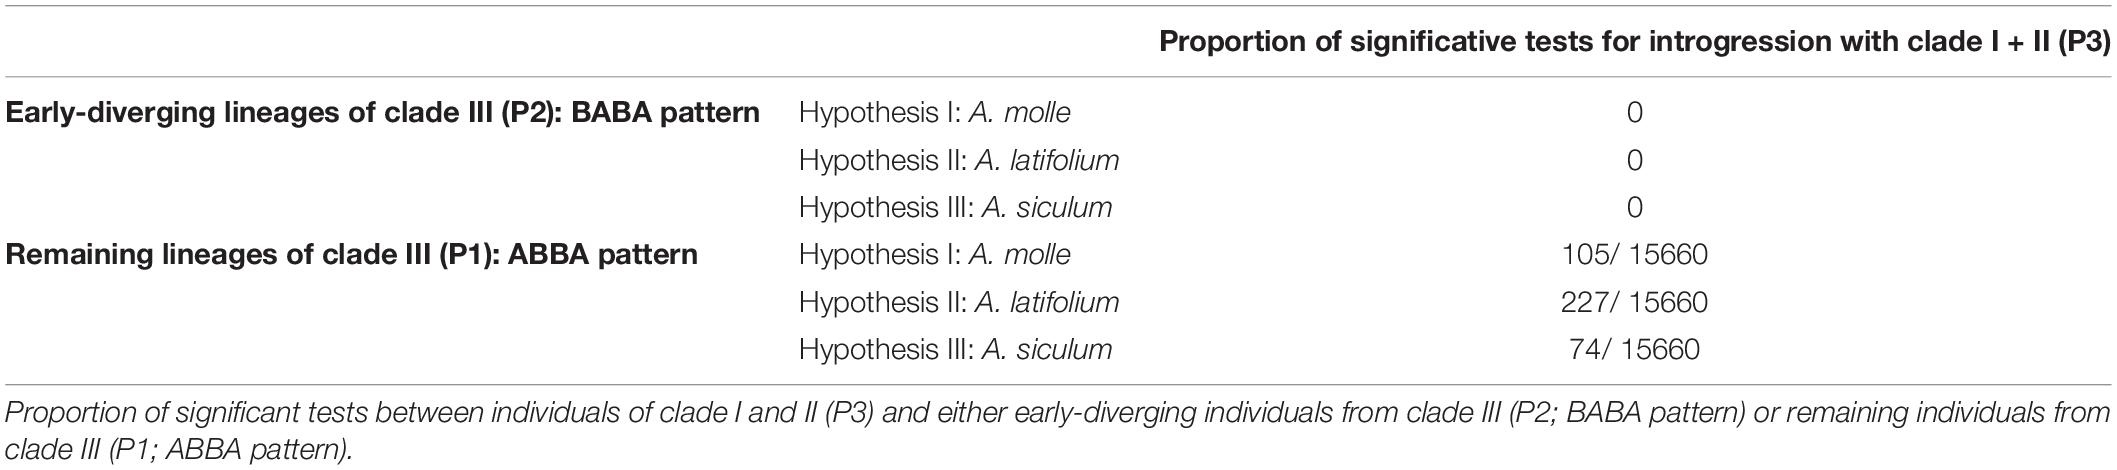
Table 3. D-statistic summary for the introgression test given a four-taxon tree {[(P1,P2),P3],O}.
Discussion
A phylogenetic structure of Antirrhinum has been elusive for a long time. Possible causes for lack of phylogenetic resolution included rapid speciation and hybridization (Vargas et al., 2004, 2009). In particular, Antirrhinum phenotypes seemed to be constrained by selection, which might reflect contrasting adaptations to life on bare rock faces or sandy soils (Wilson and Hudson, 2011). Indeed, recent speciation and hybridization appear to be the main causes of plant diversity in Mediterranean-type ecosystems (Rundel et al., 2016), and they may also be responsible for complex taxonomy of angiosperms (Vargas et al., 2018). Nevertheless, none of the previous phylogenetic studies of Antirrhinum included a considerable number of type or topotypic materials to contrast hypotheses (but see Vargas et al., 2009). This has also prevented the accurate naming of some Antirrhinum populations. In contrast, our study offers a new phylogenetic hypothesis that helps to elucidate systematics and evolution thanks to a high number of phylogenetically informative nucleotide characters (>50,000 bp) taken from genome-wide (GBS) sequences, together with DNA sequences that are anchored to original Antirrhinum names (Bell et al., 2020).
Our approach leads to strongly encourage researchers in plant systematics to not only use a high number of loci (as provided by the GBS technique) but also include topotypic material in phylogenetic analyses to ensure a correct naming of populations and stable evolutionary inferences.
Contribution to the Systematics of Antirrhinum
The family of restriction digest-based techniques (including GBS, RAD-Seq and similar techniques) is highly recommended for studies in systematics of diverse plant groups inasmuch as the combination of cost-effectiveness, high resolution and strong statistical support enables a robust overview of phylogenetic relationships among lineages. However, the nature of reduced representation sequencing based on restriction sites can result in high rates of missing data in concatenated matrices and lower repeatability of targeted genomic regions (Harvey et al., 2016). In our case, the percentages of missing data are similar to those analyzed in other studies that also used GBS data (e.g., Fernández-Mazuecos et al., 2018; Martín-Hernanz et al., 2019) and found robust phylogenetic support after discarding some low quality samples (see section “Results”).
The two worldwide taxonomic treatments of Antirrhinum (Rothmaler, 1956; Sutton, 1988) included species circumscriptions that mostly agree with our phylogenetic results. However, our results suggest a number of taxonomic re-arrangements, particularly at the species level. On the one hand, some species recognized by Rothmaler (1956) were not considered by Webb (1971) and Sutton (1988) or further authors, but should be re-visited (Table 1). On the other hand, new narrow endemic species found in the field were described after Sutton (1988), recognized in more recent floras (e.g., Güemes, 2009) and supported by our phylogenetic analyses. For the sake of brevity, we next discuss major phylogenetic results that disagree with those four treatments.
Monophyly and Species Recognition
Numerous (17) monophyletic groups of populations were congruently associated with current species (Vargas et al., 2004; Carrió et al., 2010; Wilson and Hudson, 2011). Some other species (4) fall in a pattern of paraphyly (A. microphyllum embedded in A. pulverulentum lineages; A. grosii embedded in A. meonanthum lineages) following Sutton’s (1988) circumscription of species (Figure 3). This suggests a pattern of budding speciation typically found in Iberia (Otero et al., 2019). The hypothesis of a general pattern of budding speciation in Antirrhinum needs to be tested with a higher number of populations, particularly from widespread species.
Infrageneric Taxa
The hypothesis of three main groups (subsections) of Antirrhinum proposed by Rothmaler (1956), which was not adopted by either Webb (1971) or Sutton (1988), is not supported by our phylogenetic analyses. The phylogenetic structure of Antirrhinum based on GBS data revealed two main clades (I + II and III, see Figures 3, 4), both of them with species of subsect. Kickxiella (Figure 3). In particular, the two species of subsect. Streptosepalum (A. braun-blanquetii and A. meonanthum) grouped together with most species of subsect. Kickxiella, whereas all the species of subsect. Antirrhinum grouped together with a few species of subsect. Kickxiella. This is partially congruent with Wilson and Hudson (2011) and prevents us from accepting any subsections based solely on classical morphological characters.
Antirrhinum majus Group
The type species of the genus is A. majus (Sutton, 1988). This species is an important model for plant genetics, development and evolution (see Schwarz-Sommer et al., 2003; Li et al., 2019). Despite the importance of this model plant, taxonomy of the “A. majus group” has neither met consensus yet nor been revisited using molecular phylogenetics. During most of the 20th century, researchers primarily considered six subspecies (barrelieri, cirrhigerum, linkianum, majus, striatum, and tortuosum) circumscribed in the A. majus group (Rothmaler, 1956; Webb, 1971; Sutton, 1988). The use of topotypic samples reveals that all these taxa do not form a natural group because they are placed in different subclades of clade III (Figure 4). This result agrees with a taxonomic treatment at the species level following the most recent treatment of Antirrhinum for the Iberian Peninsula (Güemes, 2009). The question remains as to whether laboratories using Antirrhinum as a model plant are employing plants correctly assigned to the true A. majus or any other species of the former A. majus group.
Further Taxonomic Research
Our phylogenetic results help taxonomic decision making at the supraspecific level, but also suggest further investigation in certain subclades that contain poorly studied species: (i) A. rupestre and A. caroli-paui are basal-most lineages of the subclade of A. mollissimum–A. charidemi; (ii) A. striatum is certainly unrelated to A. latifolium (see Liberal et al., 2014) and now considered within A. majus at the subspecies level (Khimoun et al., 2013); and (iii) four taxa described as independent species (A. bolosii, A. fernandezcasasii, A. saccharatum, and A. ternatum) need to be phylogenetically analyzed for systematic purposes given that there is no consensus among authors. High uncertainty about these species is illustrated by the fact that the same author who first described A. bolosii (Fernández-Casas, 1972) did not consider it shortly after (Fernández-Casas, 1974). In addition, as these species have never been included in a key to species of Antirrhinum or in a comparative table, a taxonomic study using their type specimens and topotypic populations is needed.
Radiation and Geographical Speciation of Antirrhinum
The hypothesis of an evolutionary radiation of Antirrhinum based on ITS and plastid sequences (Vargas et al., 2009) is supported by our phylogenetic analysis based on GBS data, which found a high rate of diversification (0.54 spp. Myr–1) into at least 26 species (Valente et al., 2010; Bell et al., 2012) since the Pliocene (Vargas et al., 2009). The combination of terrain complexity and eco-climatic novelty seems to explain why the Mediterranean basin contains numerous examples of explosive radiations in the angiosperms (Valente et al., 2010).
The hypothesis of a primarily geographic pattern of snapdragon speciation in Iberia has been put forward based on: (i) endemicity for the majority of Antirrhinum species (Vargas et al., 2009); (ii) numerous narrow, endangered endemics in small mountain ranges (Carrió et al., 2010); (iii) a high number of unique haplotypes and haplotype clades restricted to small geographic areas (Vargas et al., 2009). In particular, previous phylogeographic results are supported by our biogeographic analysis (Figure 5), in which a likely primary center of diversification in northern Iberia (or even out of the Iberian Peninsula) was followed by a secondary center of diversification in SE Iberia (Vargas et al., 2009). Six speciation events occurred unequivocally in SE Iberia during the Quaternary based on our biogeographic reconstruction and time-calibrated phylogeny (Figure 5). The mountains of eastern Andalusia (SE Iberia) contain one of the richest areas of Europe in terms of number of species and endemics (Cueto et al., 2018) and form indeed a main center of recent angiosperm diversification (Buira et al., 2020). One more argument for the strong pattern of recent geographic speciation in SE Iberia is shown by the considerable number of sister species pairs (A. subbaeticum–A. valentinum; A. mollissimum–A. charidemi; A. australe–A. tortuosum) in nearby areas (Figure 3). In addition, two more clades of NW and NE Iberian species support a strong pattern of geographic speciation for Antirrhinum (Vargas et al., 2009), which fits into a general pattern for Mediterranean plants. A pattern of geographic differentiation in the Mediterranean appears to be the rule rather than the exception because of unique opportunities for spatial isolation given the numerous islands, peninsulas, and high mountains of southern Europe. In particular, the complex geography and orography of Iberia provides a suitable spatial framework for speciation (Rundel et al., 2016; Vargas et al., 2018). Spatial differentiation has also been documented for early stages of speciation between A. majus subsp. majus and subsp. striatum separated by mountains (Pujol et al., 2017), albeit ecological conditions may have secondarily contributed (Khimoun et al., 2013). One more line of evidence that supports predominant speciation by geographic isolation reinforced by ecological factors is given by a strong geographic pattern of pollinator types associated with the bee-specialized flowers of Antirrhinum (Vargas et al., 2010). In particular, two pollinator systems (Mediterranean vs. temperate areas of Europe) were proposed based on two consistent pollinator niches that include 11 bee species and most Antirrhinum species (Vargas et al., 2017).
Hybridization vs. Convergent Evolution of Key Morphological Characters
None of the states of the three morphological characters (corolla color, corolla size, and fruit size) used in all taxonomic keys to Antirrhinum species turned out to be synapomorphic (Figure 6). This result was already observed in previous analyses, but poor resolution prevented from a detailed description of character homoplasy (Vargas et al., 2004; Wilson and Hudson, 2011). Our ancestral state reconstruction analyses revealed a strong pattern of convergent evolution for corolla color, corolla size, and capsule size (Figure 6). One of the fastest and most frequent mechanisms of phenotypic convergence is hybridization (Stern, 2013). Hybridization in Antirrhinum has been extensively documented based on the observation of plants with intermediate morphological characters between co-occurring species (see Güemes, 2009), production of viable offspring from crosses between multiple species (Günther and Rudolph, 1970) and molecular results (Vargas et al., 2009). In particular, plastid haplotype sharing among species (Vargas et al., 2009; Wilson and Hudson, 2011) and the occurrence of numerous nucleotide additivities in nuclear ribosomal ITS sequences (Vargas et al., 2009; Carrió et al., 2010) have been interpreted as evidence of recent hybridization in Antirrhinum. Indeed, both recent and ancient hybridization events have been proposed based on shallow and profound incongruence between morphology, plastid, and nuclear markers, which produce large phylogenetic polytomies (Vargas et al., 2004, 2009; Carrió et al., 2010; Wilson and Hudson, 2011). Our analyses to test a hybridization signal between main clades potentially resulting in the early-diverging position of three species of clade III (A. molle, A. latifolium, and A. siculum) failed to find a significant result. More recent hybridization may be easier to reconstruct based on the genetic makeup of current populations. At this level, no unequivocal support for hybridization was, however, found for some species of Antirrhinum based on nuclear fingerprints (RAPD) and morphology (Jiménez et al., 2005). Along the same lines, unique allozyme profiles were interpreted as long-term isolation between three species with similar morphotypes (Mateu-Andrés, 1999), while A. charidemi also shows unique plastid sequences and SSR profiles (Forrest et al., 2017). Sporadic hybrids in the field, together with rare cases of hybrid swarms indicate that hybridization between main clades is not currently playing an important role in Antirrhinum (Sutton, 1988; Mateu-Andrés, 1999). Indeed, reproductive experiments revealed that post-zygotic barriers are at play at least for two co-occurring species of Antirrhinum (A. controversum, A. valentinum) that are distant in our phylogenetic reconstruction (Carrió and Güemes, 2014).
In sum, our study provides a clear cladogenetic pattern for Antirrhinum thanks to a high number of loci obtained with the GBS technique. Besides, stability of the phylogeny is guaranteed by the use of topotypic material anchored to original Antirrhinum names. Lack of resolution using less variable DNA sequences appear to have primarily been the result of evolutionary radiation in the Pleistocene rather than hybridization between plants of different major lineages. A strong signal of monophyly and phylogenetic distinctiveness for currently recognized species was obtained, but the analysis of a higher number of populations is still needed for a more solid proposal of the systematics of snapdragons. Although some plants may have a hybrid origin, intermediate key morphological characters (corolla color and size, fruit size) in numerous species are better explained by parallel evolution due to gene reutilization, a hypothesis that has been put forward for some model genera including Antirrhinum (Preston et al., 2011). All sources of data strongly suggest a general pattern of divergence promoted by isolation in mountains, which accounts for a high number of endemics to the Iberian Peninsula. Geographical isolation is, therefore, the most plausible driver of speciation in Antirrhinum, followed by ecological factors such as pollination systems, soil preference and climate conditions.
Data Availability Statement
The data that support the findings of this study are openly available in Short Read Archive (SRA), under the reference number PRJNA690200. SRA accessions for each sample are indicated in Supplementary Material at Supplementary Table 1.
Author Contributions
PV conceived the idea and drafted the manuscript. AO led lab work. AO conducted the data analysis and summarized results with contributions of MF-M. PV, AO, and MF-M interpreted and discussed the results, and wrote the manuscript. All authors contributed to the article and approved the submitted version.
Funding
We gratefully acknowledge financial support by two Spanish projects: En busca de áreas de biodiversidad en Sierra Nevada: las técnicas de barcoding aplicadas a angiospermas (tribu Antirrhineae), polinizadores (abejas), y sus interacciones (Organismo Autónomo de Parques Nacionales 005/2008); and Evolución de la flor personada (Ministerio de Ciencia e Innovación CGL2009-10031). AO and MF-M were supported by two Special Intramural Projects of the Spanish National Research Council (CSIC, references 201730E029 and 201930E078 respectively).
Conflict of Interest
The authors declare that the research was conducted in the absence of any commercial or financial relationships that could be construed as a potential conflict of interest.
Acknowledgments
The authors thank Isabel Liberal, Jose Luis Blanco-Pastor, Emilio Cano, Yolanda Ruiz, Mónica García-Gallo, Concha Baranda, Leopoldo Medina, Alberto Coello, Pedro Jiménez-Mejías, Alberto Herrero, Jaime Güemes, Marcos Egea, Ferderico Selvi, Lorenzo Peruzzi, Chiara Nepi, Daniel Gómez, Luis Calderón, Francisco Javier Salgueiro, Víctor Manuel Pizarro, Manuel Joao Pinto, Ana Isabel de Vasconcelos, Ana Isabel Correia, Jose García, Cristiana Costa, Paulo Ventura, Miguel Porto, Jesus Riera, Francisco Javier Hernández, Estrella Alfaro, Ester Manjavacas, and all the authors who collected Antirrhinum material deposited in public herbaria (FI, JACA, LEB, MA, MGC, PI, PO, SALA, and VAL).
Supplementary Material
The Supplementary Material for this article can be found online at: https://www.frontiersin.org/articles/10.3389/fpls.2021.631178/full#supplementary-material
Supplementary Figure 1 | The best scoring maximum likelihood tree from RAxML analysis of all Antirrhinum taxa set under three different numbers of minimum taxa for a locus: m4, m18, and m36. Bootstrap support values are indicated at the nodes.
Supplementary Figure 2 | The best scoring maximum likelihood tree from RAxML analysis of Antirrhinum topotypic specimens under three different numbers of minimum taxa for a locus: m4, m18, and m36. Bootstrap support values are indicated at the nodes.
Supplementary Figure 3 | Consensus coalescent-based tree obtained from SVDquartets. Individuals were grouped according to current species circumscriptions. Bootstrap values are indicated at the nodes.
Supplementary Figure 4 | Time-calibrated tree of topotypic specimens of Antirrhinum obtained from TreePL analysis. Inferred ages are indicated at nodes.
Supplementary Table 1 | Data information and NCBI SRA accessions of all individuals sampled for GBS.
Supplementary Table 2 | Significant D-statistic tests given a four-taxon tree {[(P1,P2),P3],O}. Abbreviation for each individual is described at Supplementary Table 1. Tests are differentiated according to the three introgression hypotheses tested (MOLLE: hybrid origin for A. molle; LAT: hybrid origin for A. latifolium; and SIC: hybrid origin for A. siculum). D-statistic value (D), standard deviation [(std. (D)], z-score (Z), proportion of BABA and ABBA, number of loci involved for each test (nloci), number of bootstrap replicates (nboot), significant pattern (pattern), p-value and adjusted p-value through Bonferroni–Holm method are shown.
Supplementary Data Sheet 1 | Locations of Antirrhinum photographs included in Figure 2 of the main text.
Footnotes
References
Aberer, A. J., Kobert, K., and Stamatakis, A. (2014). ExaBayes: massively parallel Bayesian tree inference for the whole-genome era. Mol. Biol. Evol. 31, 2553–2556. doi: 10.1093/molbev/msu236
Anderson, D. R., and Burnham, K. P. (2002). Avoiding pitfalls when using information-theoretic methods. J. Wildlife Manag. 66, 912–918. doi: 10.2307/3803155
Andrews, S. (2010). FastQC: A Quality Control Tool for High Throughput Sequence Data”. Babraham Bioinformatics. Cambridge: Babraham Institute.
Bell, C. D., Mavrodiev, E. V., Soltis, P. S., Calaminus, A. K., Albach, D. C., Cellinese, N., et al. (2012). Rapid diversification of Tragopogon and ecological associates in Eurasia. J. Evol. Biol. 25, 2470–2480. doi: 10.1111/j.1420-9101.2012.02616.x
Bell, R. C., Mulcahy, D. G., Gotte, S. W., Maley, A. J., Mendoza, C., Steffensen, G., et al. (2020). The type locality project: collecting genomic-quality, topotypic vouchers and training the next generation of specimen-based researchers. Syst. Biodivers. 18, 1–16.
Buira, A., Fernández-Mazuecos, M., Aedo, C., and Molina-Venegas, R. (2020). The contribution of the edaphic factor as a driver of recent plant diversification in a Mediterranean biodiversity hotspot. J. Ecol. 1–13. doi: 10.1111/1365-2745.13527
Carrió, E., Forrest, A. D., Güemes, J., and Vargas, P. (2010). Evaluating species nonmonophyly as a trait affecting genetic diversity: a case study of three endangered species of Antirrhinum L.(Scrophulariaceae). Plant Syst. Evol. 288, 43–58. doi: 10.1007/s00606-010-0311-4
Carrió, E., and Güemes, J. (2014). The effectiveness of pre-and post-zygotic barriers in avoiding hybridization between two snapdragons (Antirrhinum L.: plantaginaceae). Bot. J. Linn. Soc. 176, 159–172.
Chifman, J., and Kubatko, L. (2014). Quartet inference from SNP data under the coalescent model. Bioinformatics 30, 3317–3324. doi: 10.1093/bioinformatics/btu530
Cueto, M., Melendo, M., Gimenez, E., Fuentes, J., Carrique, E. L., and Blanca, G. (2018). First updated checklist of the vascular flora of Andalusia (S of Spain), one of the main biodiversity centres in the Mediterranean Basin. Phytotaxa 339, 1–95. doi: 10.11646/phytotaxa.339.1.1
Cullings, K. (1992). Design and testing of a plant-specific PCR primer for ecological and evolutionary studies. Mol. Ecol. 1, 233–240. doi: 10.1111/j.1365-294x.1992.tb00182.x
Doyle, J., and Doyle, J. (1987). A rapid DNA isolation procedure for small quantities of fresh leaf tissue. Phytochem. Bull. 19, 11–15.
Durand, E. Y., Patterson, N., Reich, D., and Slatkin, M. (2011). Testing for ancient admixture between closely related populations. Mol. Biol. Evol. 28, 2239– 2252.
Eaton, D. A., Hipp, A. L., González-Rodríguez, A., and Cavender-Bares, J. (2015). Historical introgression among the American live oaks and the comparative nature of tests for introgression. Evolution 69, 2587–2601. doi: 10.1111/evo.12758
Eaton, D. A., and Overcast, I. (2020). ipyrad: interactive assembly and analysis of RADseq datasets. Bioinformatics 36, 2592–2594. doi: 10.1093/bioinformatics/btz966
Elshire, R. J., Glaubitz, J. C., Sun, Q., Poland, J. A., Kawamoto, K., Buckler, E. S., et al. (2011). A robust, simple genotyping-by-sequencing (GBS) approach for high diversity species. PLoS One 6:e19379. doi: 10.1371/journal.pone.0019379
Escudero, M., Eaton, D. A. R., Hahn, M., and Hipp, A. L. (2014). Genotyping-by-sequencing as a tool to infer phylogeny and ancestral hybridization: a case study in Carex (Cyperaceae). Mol. Phylogenet. Evol. 79, 359–367. doi: 10.1016/j.ympev.2014.06.026
Fernández-Casas, J. (1972). Dos especies nuevas del género Antirrhinum L. Cuad. Cienc. Biol. 2, 43–45.
Fernández-Mazuecos, M., and Glover, B. J. (2017). The evo-devo of plant speciation. Nat. Ecol. Evol. 1:0110.
Fernández-Mazuecos, M., Mellers, G., Vigalondo, B., Sáez, L., Vargas, P., and Glover, B. J. (2018). Resolving recent plant radiations: power and robustness of genotyping-by-sequencing. Syst. Biol. 67, 250–268. doi: 10.1093/sysbio/syx062
Fernández-Mazuecos, M., Blanco-Pastor, J. L., Juan, A., Carnicero, P., Forrest, A., Alarcón, M., et al. (2019). Macroevolutionary dynamics of nectar spurs, a key evolutionary innovation. New Phytol. 222, 1123–1138. doi: 10.1111/nph.15654
Fiz, O., Valcarcel, V., Martinez, J., Vargas, P., and Güemes, J. (2000). Antirrhinum siculum Mill.(Scrophulariaceae) in Morocco: a new record for Africa. An. Jard. Bot. Madr. 58, 362–363.
Forrest, A., Escudero, M., Heuertz, M., Wilson, Y., Cano, E., and Vargas, P. (2017). Testing the hypothesis of low genetic diversity and population structure in narrow endemic species: the endangered Antirrhinum charidemi (Plantaginaceae). Bot. J. Linn. Soc. 183, 260–270. doi: 10.1093/botlinnean/bow002
García-Barriuso, M., Nabais, C., Crespí, A. L., Fernández-Castellano, C., Bernardos, S., and Amich, F. (2011). Morphology and karyology of Antirrhinum rothmaleri comb. & stat. nov.(Plantaginaceae), a plant endemic to the NW Iberian Peninsula. Ann. Bot. Fenn. 48, 409–421.
Gorospe, J. M., Monjas, D., and Fernández-Mazuecos, M. (2020). Out of the Mediterranean Region: worldwide biogeography of snapdragons and relatives (tribe Antirrhineae, Plantaginaceae). J. Biogeogr. 47, 2442–2456. doi: 10.1111/jbi.13939
Grabowski, P. P., Morris, G. P., Casler, M. D., and Borevitz, J. O. (2014). Population genomic variation reveals roles of history, adaptation and ploidy in switchgrass. Mol. Ecol. 23, 4059–4073. doi: 10.1111/mec.12845
Güemes, J. (2009). “Antirrhinum L,” in Flora Ibérica. Plantas vasculares de la Península Ibérica e Islas Baleares. Plantaginaceae-Scrophulariaceae, Vol. 13, eds C. C. Benedí, E. Rico, J. Güemes, and A. Herrero (Madrid: Real Jardín Botánico, CSIC), 134–166.
Güemes, J., Andrés, I. M., and Gómez, P. S. (1993). Antirrhinum subbaeticum güemes, mateu & sánchez-gómez (Scrophulariaceae), especie nueva de la península Ibérica. An. Jard. Bot. Madr. 51, 237–247.
Günther, E., and Rudolph, L. (1970). Kreuzungen zur Ermittlung genetischer Beziehungen innerhalb der Gattung Antirrhinum. Biol. Zentralblatt 89, 735–750.
Harmon, L. J., Weir, J. T., Brock, C. D., Glor, R. E., and Challenger, W. (2007). GEIGER: investigating evolutionary radiations. Bioinformatics 24, 129–131. doi: 10.1093/bioinformatics/btm538
Harvey, M. G., Smith, B. T., Glenn, T. C., Faircloth, B. C., and Brumfield, R. T. (2016). Sequence capture versus restriction site associated DNA sequencing for shallow systematics. Syst. Biol. 65, 910–924. doi: 10.1093/sysbio/syw036
Jiménez, J., Sánchez-Gómez, P., Güemes, J., and Rosselló, J. (2005). Isolated populations or isolated taxa? A case study in narrowly-distributed snapdragons (Antirrhinum sect. Sempervirentia) using RAPD markers. Plant Syst. Evol. 252, 139–152. doi: 10.1007/s00606-004-0250-z
Khimoun, A., Cornuault, J., Burrus, M., Pujol, B., Thebaud, C., and Andalo, C. (2013). Ecology predicts parapatric distributions in two closely related Antirrhinum majus subspecies. Evol. Ecol. 27, 51–64. doi: 10.1007/s10682-012-9574-2
Li, H., and Durbin, R. (2009). Fast and accurate short read alignment with burrows-wheeler transform. Bioinformatics 25, 1754–1760. doi: 10.1093/bioinformatics/btp324
Li, M., Zhang, D., Gao, Q., Luo, Y., Zhang, H., Ma, B., et al. (2019). Genome structure and evolution of Antirrhinum majus L. Nat. Plants 5, 174–183.
Li, X., Yang, Y., Henry, R. J., Rossetto, M., Wang, Y., and Chen, S. (2015). Plant DNA barcoding: from gene to genome. Biol. Rev. 90, 157–166. doi: 10.1111/brv.12104
Liberal, I. M., Burrus, M., Suchet, C., Thébaud, C., and Vargas, P. (2014). The evolutionary history of Antirrhinum in the Pyrenees inferred from phylogeographic analyses. BMC Evol. Biol. 14:146. doi: 10.1186/1471-2148-14-146
Magallón, S., and Sanderson, M. J. (2001). Absolute diversification rates in angiosperm clades. Evolution 55, 1762–1780. doi: 10.1554/0014-3820(2001)055[1762:adriac]2.0.co;2
Martin, S. H., Davey, J. W., and Jiggins, C. D. (2015). Evaluating the use of ABBA–BABA statistics to locate introgressed loci. Mol. Biol. Evol. 32, 244–257. doi: 10.1093/molbev/msu269
Martín-Hernanz, S., Aparicio, A., Fernández-Mazuecos, M., Rubio, E., Reyes-Betancort, J. A., Santos-Guerra, A., et al. (2019). Maximize resolution or minimize error? Using genotyping-by-sequencing to investigate the recent diversification of Helianthemum (Cistaceae). Front. Plant Sci. 10:1416. doi: 10.3389/fpls.2019.01416
Mateu-Andrés, I. (1999). Allozymic variation and divergence in three species of Antirrhinum L.(Scrophulariaceae-Antirrhineae). Bot. J. Linn. Soc. 131, 187–199. doi: 10.1111/j.1095-8339.1999.tb01849.x
Matzke, N. J. (2013). BioGeoBEARS: Biogeography with Bayesian (and Likelihood) Evolutionary Analysis in R Scripts. R Package, Version 0.2 1. Berkeley, CA: University of California.
Miller, M. A., Pfeiffer, W., and Schwartz, T. (2010). “Creating the CIPRES science gateway for inference of large phylogenetic trees,” in Proceedings of the Gateway Computing Environments Workshop, New Orleans, LA, 1–8.
Otero, A., Vargas, P., Valcárcel, V., Fernández-Mazuecos, M., Jiménez-Mejías, P., and Hipp, A. L. (2019). A snapshot of progenitor-derivative speciation in action in Iberodes (Boraginaceae). bioRxiv [preprint]. doi: 10.1101/823641
Preston, J. C., Hileman, L. C., and Cubas, P. (2011). Reduce, reuse, and recycle: developmental evolution of trait diversification. Am. J. Bot. 98, 397–403. doi: 10.3732/ajb.1000279
Pujol, B., Archambeau, J., Bontemps, A., Lascoste, M., Marin, S., and Meunier, A. (2017). Mountain landscape connectivity and subspecies appurtenance shape genetic differentiation in natural plant populations of the snapdragon (Antirrhinum majus L.). Bot. Lett. 164, 111–119. doi: 10.1080/23818107.2017.1310056
Quinlan, A. R., and Hall, I. M. (2010). BEDTools: a flexible suite of utilities for comparing genomic features. Bioinformatics 26, 841–842. doi: 10.1093/bioinformatics/btq033
Rambaut, A., Suchard, M., Xie, D., and Drummond, A. (2014). Tracer v1. 6. Available online at: http://beast.bio.ed.ac.uk/Tracer (accessed May 13, 2018).
R Core Team (2013). R: a Language and Environment for Statistical Computing. Version 3.2.3. Vienna, Austria: R Foundation for Statistical Computing.
Ree, R. H., and Sanmartín, I. (2018). Conceptual and statistical problems with the DEC+ J model of founder-event speciation and its comparison with DEC via model selection. J. Biogeogr. 45, 741–749. doi: 10.1111/jbi.13173
Ree, R. H., and Smith, S. A. (2008). Lagrange: software for likelihood analysis of geographic range evolution. Syst. Biol. 57, 4–14. doi: 10.1080/10635150701883881
Revell, L. J. (2012). Phytools: an R package for phylogenetic comparative biology (and other things). Methods Ecol. Evol. 3, 217–223. doi: 10.1111/j.2041-210x.2011.00169.x
Ronquist, F. (1997). Dispersal-vicariance analysis: a new approach to the quantification of historical biogeography. Syst. Biol. 46, 195–203. doi: 10.1093/sysbio/46.1.195
Ronquist, F., and Sanmartín, I. (2011). Phylogenetic methods in biogeography. Annu. Rev. Ecol. Evol. Syst. 42, 441–464. doi: 10.1146/annurev-ecolsys-102209-144710
Rothmaler, W. (1956). Taxonomische Monographie der Gattung Antirrhinum. Feddes Repertorium Specierum Novarum Regni Vegetabilis, Vol. 136. Berlin: Akademie Verlag.
Rundel, P. W., Arroyo, M. T., Cowling, R. M., Keeley, J. E., Lamont, B. B., and Vargas, P. (2016). Mediterranean biomes: evolution of their vegetation, floras, and climate. Annu. Rev. Ecol. Evol. Syst. 47, 383–407. doi: 10.1146/annurev-ecolsys-121415-032330
Schwarz-Sommer, Z., Davies, B., and Hudson, A. (2003). An everlasting pioneer: the story of Antirrhinum research. Nat. Rev. Genet. 4, 655–664. doi: 10.1038/nrg1127
Smith, S. A., and O’Meara, B. C. (2012). treePL: divergence time estimation using penalized likelihood for large phylogenies. Bioinformatics 28, 2689–2690. doi: 10.1093/bioinformatics/bts492
Staats, M., Cuenca, A., Richardson, J. E., Vrielink-van Ginkel, R., Petersen, G., Seberg, O., et al. (2011). DNA damage in plant herbarium tissue. PLoS One 6:e28448. doi: 10.1371/journal.pone.0028448
Stamatakis, A., Hoover, P., and Rougemont, J. (2008). A rapid bootstrap algorithm for the RAxML web servers. Syst. Biol. 57, 758–771. doi: 10.1080/10635150802429642
Stern, D. L. (2013). The genetic causes of convergent evolution. Nat. Rev. Genet. 14, 751–764. doi: 10.1038/nrg3483
Swofford, D. L. (2001). Paup∗: Phylogenetic Analysis Using Parsimony (and other Methods) 4.0. B5. Duke: Department of Biological Sciences, Duke University.
Valente, L. M., Savolainen, V., and Vargas, P. (2010). Unparalleled rates of species diversification in Europe. Proc. R. Soc. B Biol. Sci. 277, 1489–1496. doi: 10.1098/rspb.2009.2163
Vargas, P., Carrió, E., Guzmán, B., Amat, E., and Güemes, J. (2009). A geographical pattern of Antirrhinum (Scrophulariaceae) speciation since the Pliocene based on plastid and nuclear DNA polymorphisms. J. Biogeogr. 36, 1297–1312. doi: 10.1111/j.1365-2699.2008.02059.x
Vargas, P., Fernández-Mazuecos, M., and Heleno, R. (2018). Phylogenetic evidence for a Miocene origin of Mediterranean lineages: species diversity, reproductive traits and geographical isolation. Plant Biol. 20, 157–165. doi: 10.1111/plb.12626
Vargas, P., Liberal, I., Ornosa, C., and Gómez, J. M. (2017). Flower specialisation: the occluded corolla of snapdragons (Antirrhinum) exhibits two pollinator niches of large long tongued bees. Plant. Biol. 19, 787–797. doi: 10.1111/plb.12588
Vargas, P., Ornosa, C., Ortiz-Sánchez, F. J., and Arroyo, J. (2010). Is the occluded corolla of Antirrhinum bee-specialized? J. Nat. Hist. 44, 1427–1443. doi: 10.1080/00222930903383552
Vargas, P., Rosselló, J., Oyama, R., and Güemes, J. (2004). Molecular evidence for naturalness of genera in the tribe Antirrhineae (Scrophulariaceae) and three independent evolutionary lineages from the new world and the old. Plant Syst. Evol. 249, 151–172. doi: 10.1007/s00606-004-0216-1
Vargas, P., Valente, L. M., Blanco-Pastor, J. L., Liberal, I., Guzmán, B., Cano, E., et al. (2014). Testing the biogeographical congruence of palaeofloras using molecular phylogenetics: snapdragons and the Madrean-Tethyan flora. J. Biogeogr. 41, 932–943. doi: 10.1111/jbi.12253
Wilson, Y., and Hudson, A. (2011). The evolutionary history of Antirrhinum suggests that ancestral phenotype combinations survived repeated hybridizations. Plant J. 66, 1032–1043. doi: 10.1111/j.1365-313x.2011.04563.x
Keywords: biogeography, genotyping-by-sequencing, high-throughput sequencing, locus classicus, molecular dating, phylogeny, Plantaginaceae, systematics
Citation: Otero A, Fernández-Mazuecos M and Vargas P (2021) Evolution in the Model Genus Antirrhinum Based on Phylogenomics of Topotypic Material. Front. Plant Sci. 12:631178. doi: 10.3389/fpls.2021.631178
Received: 19 November 2020; Accepted: 06 January 2021;
Published: 12 February 2021.
Edited by:
Andrew A. Crowl, Duke University, United StatesReviewed by:
Ezgi Ogutcen, Université de Genève, SwitzerlandSonia Herrando, Botanical Institute of Barcelona, Spain
Copyright © 2021 Otero, Fernández-Mazuecos and Vargas. This is an open-access article distributed under the terms of the Creative Commons Attribution License (CC BY). The use, distribution or reproduction in other forums is permitted, provided the original author(s) and the copyright owner(s) are credited and that the original publication in this journal is cited, in accordance with accepted academic practice. No use, distribution or reproduction is permitted which does not comply with these terms.
*Correspondence: Ana Otero, YW90ZXJvQHJqYi5jc2ljLmVz; YW5hb3Rlcm9nb21lekBnbWFpbC5jb20=