 Na Su1,2†Bin-bin Liu3,4†Jun-ru Wang1,2†Ru-chang Tong1,2Chen Ren5,6Zhao-yang Chang1,2
 Liang Zhao1,2*
 Daniel Potter7
 Jun Wen4
- 1College of Life Sciences, Northwest A&F University, Yangling, China
- 2Herbarium of Northwest A&F University, Yangling, China
- 3State Key Laboratory of Systematic and Evolutionary Botany, Institute of Botany, Chinese Academy of Sciences, Beijing, China
- 4Department of Botany, National Museum of Natural History, MRC 166, Smithsonian Institution, Washington, DC, United States
- 5Key Laboratory of Plant Resources Conservation and Sustainable Utilization, South China Botanical Garden, Chinese Academy of Sciences, Guangzhou, China
- 6Center of Conservation Biology, Core Botanical Gardens, South China Botanical Garden, Chinese Academy of Sciences, Guangzhou, China
- 7Department of Plant Sciences, MS2, University of California, Davis, Davis, CA, United States
The recognition, identification, and differentiation of closely related plant species present significant and notorious challenges to taxonomists. The Maddenia group of Prunus, which comprises four to seven species, is an example of a group in which species delimitation and phylogenetic reconstruction have been difficult, due to the lack of clear morphological distinctions, limited sampling, and low informativeness of molecular evidence. Thus, the precise number of species in the group and the relationships among them remain unclear. Here, we used genome skimming to generate the DNA sequence data for 22 samples, including 17 Maddenia individuals and five outgroups in Amygdaloideae of Rosaceae, from which we assembled the plastome and 446 single-copy nuclear (SCN) genes for each sample. The phylogenetic relationships of the Maddenia group were then reconstructed using both concatenated and coalescent-based methods. We also identified eight highly variable regions and detected simple sequence repeats (SSRs) and repeat sequences in the Maddenia species plastomes. The phylogenetic analysis based on the complete plastomes strongly supported three main subclades in the Maddenia group of Prunus, while five subclades were recognized based on the nuclear tree. The phylogenetic network analysis detected six hybridization events. Integrating the nuclear and morphological evidence, we proposed to recognize five species within the Maddenia group, i.e., Prunus fujianensis, P. himalayana, P. gongshanensis, P. hypoleuca, and P. hypoxantha. Within this group, the first three species are well-supported, while the gene flow occurring throughout the Maddenia group seems to be especially frequent between P. hypoleuca and P. hypoxantha, eroding the barrier between them. The phylogenetic trees based on eight concatenated hypervariable regions had a similar topology with the complete plastomes, showing their potential as molecular markers and effective barcodes for further phylogeographic studies on Maddenia.
Introduction
Prunus L. is a genus of more than 200 species, widely distributed in the temperate regions of the Northern Hemisphere and in the subtropics and tropics (Rehder, 1956; Yü et al., 1986; Lu et al., 2003; Hodel et al., 2021). Some taxa of Prunus (e.g., almonds, sweet cherries, peaches, and plums) are of significant economic value, and other species have also been used as ornamentals, timber, and medicine (Andro and Riffaud, 1995; Lee and Wen, 2001; Wen et al., 2008).
Maddenia Hook. f. & Thoms was established as a genus by Hooker and Thomson (1854) and was later merged with Prunus by Chin et al. (2010) based on the phylogenetic analyses of nuclear and plastid DNA sequences. This provided strong support for the monophyly of Maddenia but it was resolved as nested within Prunus; these conclusions have also been supported by subsequent studies (Chin et al., 2014; Zhao et al., 2016, 2018; Wang et al., 2021). The Maddenia group of Prunus is characterized by its simple deciduous leaves with a serrate margin, terminal racemose inflorescences, 10 undifferentiated perianth parts at maturity, and drupe fruits (Figure 1; Focke, 1894; Yü et al., 1986; Lu et al., 2003; Kalkman, 2004; Wang et al., 2021). The group includes about 4–7 species endemic to East Asia, mainly distributed in the temperate regions of the Himalayas and eastern China, with China as its center of diversity, and one species in Bhutan, Nepal, and Sikkim of India (Rehder, 1956; Yü et al., 1986; Lu et al., 2003; Chin et al., 2010; Wen and Shi, 2012).
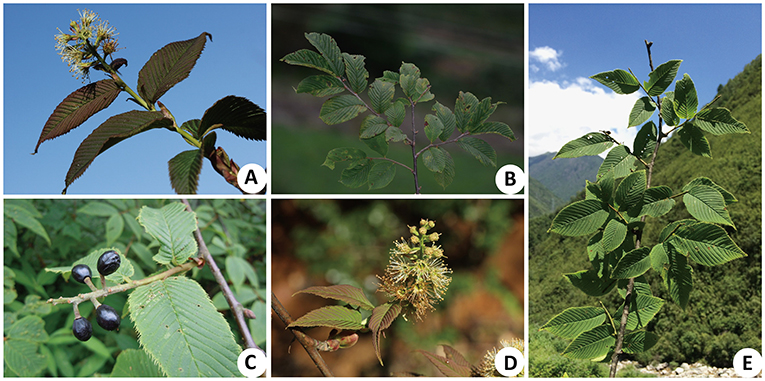
Figure 1. Morphological characteristics of Maddenia species. (A) Prunus incisoserrata; (B,C) P. wilsonii; (B) simple leaf and serrated leaf margin; (C) drupe; (D,E) P. hypoxantha; (D) racemose inflorescence; (E) simple leaf and serrated leaf margin.
Within the Maddenia group, Prunus himalayana Hook. f. & Thomson was the first species described, followed by six other putative species (i.e., P. hypoleuca Koehne, P. hypoxantha Koehne, P. wilsonii Koehne, P. fujianensis Y. T. Chang, P. incisoserrata T. T. Yü & T. C. Ku, and P. gongshanensis J. Wen; Hooker and Thomson, 1854; Koehne, 1911; Chang, 1985; Yü et al., 1985; Lu et al., 2003; Wen and Shi, 2012). The species in this group were originally described based on morphological traits, especially the abaxial leaf pubescence (Yü et al., 1986; Lu et al., 2003; Wen and Shi, 2012). For example, P. hypoxantha and P. wilsonii were considered as two separate species based on the denser pubescence on the veins in P. wilsonii, and the two were also differentiated based on the size of their winter bud scales (Yü et al., 1986; Lu et al., 2003). However, Wen and Shi (2012) noted a continuous variation in the leaf pubescence between P. hypoxantha and P. wilsonii, and therefore treated the latter as a synonym of P. hypoxantha. This treatment was also supported by Shi et al. (2013), based on pollen morphology. Furthermore, the relationships among P. fujianensis, P. hypoleuca, and P. incisoserrata are poorly understood (Chang, 1985; Yü et al., 1986; Wen and Shi, 2012). P. hypoleuca was described based on its abaxially glabrous leaves, while P. incisoserrata and P. fujianensis both have pubescent abaxial leaf surfaces (Lu et al., 2003). Additionally, P. incisoserrata and P. fujianensis were recognized by some workers based on their leaf margin morphology (incised doubly serrate in the former vs. margin incised irregular serrate in the latter; Lu et al., 2003). However, in previous observations, we found that there was a continuous variation in the degree of abaxial pubescence as P. hypoleuca also has abaxially pubescent leaf blades and that there was a broad variation on the margin shape of P. incisoserrata and P. fujianensis, which greatly increased the difficulty in identifying them. In the latest revision of the Maddenia clade, Wen and Shi (2012) treated P. fujianensis and P. incisoserrata as synonyms of P. hypoleuca and they also recognized the former variety P. himalaica var. glabrifolia as a distinct species, P. gongshanensis.
It has been challenging to identify these species due to the existence of intermediate morphological features in the Maddenia clade. Traditional morphological methods alone cannot meet the needs for the species delimitation of the Maddenia group. With the rapid development of the phylogenetic analysis of Prunus s.l., the relationships within the Prunus and the Maddenia group have attracted new attention [see Chin et al. (2014)]. Yet to date, interspecific relationships within the Maddenia group are still unclear due to the limited taxon sampling and phylogenetically informative sites included in previous studies (Wen et al., 2008; Chin et al., 2010, 2014; Zhao et al., 2016, 2018).
Deoxyribonucleic acid (DNA) barcoding is an effective way to identify species by using a short DNA sequence (Kress et al., 2005; China Plant BOL Group, 2011; Li et al., 2015; Kress, 2017), however, DNA barcodes generally provide a limited number of informative sites among closely related taxa. As an alternative, genome skimming has been employed to generate complete chloroplast genomes (plastomes), an approach that has been dubbed as “super-barcoding” (Erickson et al., 2008; Yang et al., 2013; Li et al., 2015). The maternal inheritance and conservative genome structure of plastomes have rendered them essential markers in studying the evolutionary history of angiosperms (Gitzendanner et al., 2018; Do et al., 2020; Cai et al., 2021); noteworthy examples include the recent applications in Magnoliaceae (Wang et al., 2020), Rosaceae (Liu et al., 2019, 2020a,b), and Vitaceae (Wen et al., 2018). However, the uniparental inheritance of plastomes limits their power to fully elucidate the evolutionary histories of lineages with reticulate evolution, which has been proved to be very common in Rosaceae (Liu et al., 2020a,b; Hodel et al., 2021). In a case study on Vitaceae, Liu et al. (2021) proposed a new method for obtaining single-copy nuclear (SCN) genes from deep genome skimming data (minimum 10 × coverage for optimal performance), and this approach provided a good opportunity to infer phylogenetic relationships using the uniparentally inherited plastomes and the biparentally inherited nuclear genes. Additionally, with the rapid development of next-generation sequencing, it has been feasible to obtain genome skimming data efficiently and economically (Zimmer and Wen, 2015; Zhang N. et al., 2017).
In this study, we assembled 22 plastomes and captured 446 SCN genes from seven assumed species of Maddenia and five outgroup species in Amygdaloideae of Rosaceae (Xiang et al., 2016; Zhang S. D. et al., 2017). We also examined their morphological and micromorphological characteristics. We identified simple sequence repeats (SSRs) and repeat sequences from the plastomes of Maddenia clade species. Additionally, eight highly variable regions were determined from the plastomes. We aim to test the hypotheses on species delimitations and resolve the interspecific relationships within Maddenia, integrating the plastome, nuclear, and morphological evidence. We also aim to provide potential molecular markers and effective barcodes for further population-level studies on the Maddenia group.
Materials and Methods
Sampling, DNA Extraction, and Sequencing
For this study, 22 individuals were sampled, including 17 ingroup individuals from the Maddenia group and five outgroup species from the other clades of the Rosaceae subfamily, Amygdaloideae (Table 1), which includes three other species of Prunus. The 17 ingroup samples represented the taxonomic and geographic coverage of Maddenia (Yü et al., 1986; Lu et al., 2003). Total genomic DNAs were extracted from 15 mg of silica gel dried leaves using the Cetyltrimethylammonium Bromide (CTAB) method (Doyle and Doyle, 1987). The libraries were prepared at the Molecular Biology Experiment Center, Germplasm Bank of Wild Species in Southwest China using a NEBNext® Ultra™ II DNA Library Prep Kit (New England Biolabs, Ipswich, MA, USA). The paired-end (150 bp) sequencing of the DNA libraries was done on a HiSeq 2500 (Illumina, Inc., San Diego, CA, USA) platform in Beijing Genomics Institution (BGI) (Shenzhen, China), generating ~2 GB of raw data for each sample.
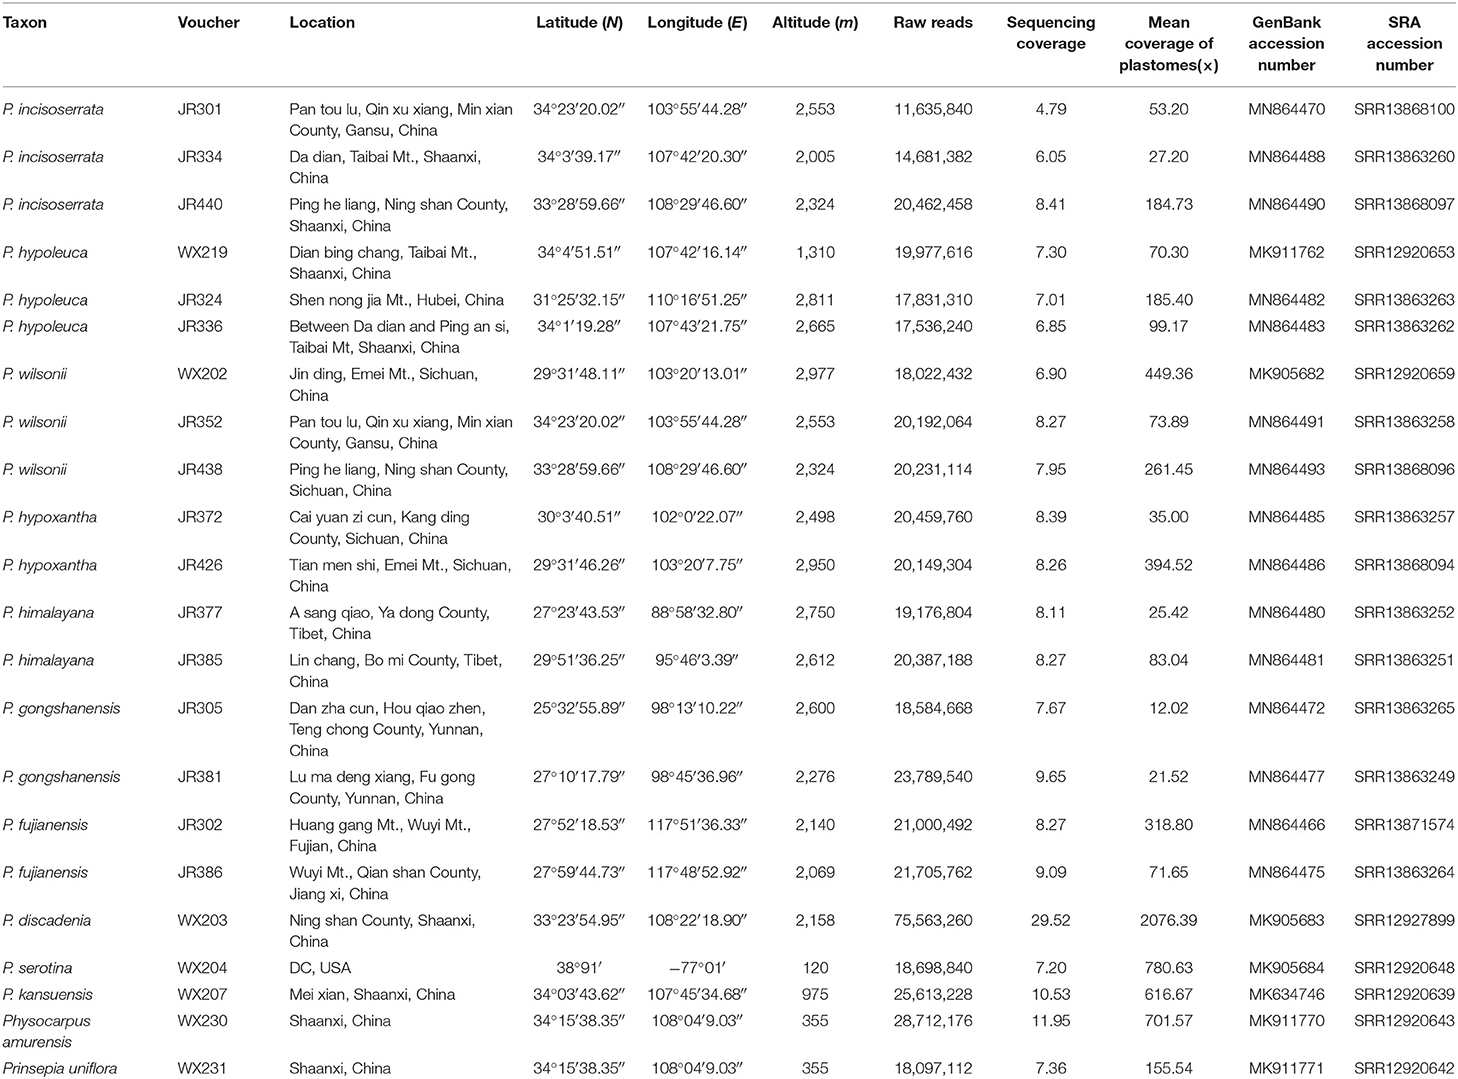
Table 1. Voucher information and GenBank accession numbers of sampled species.
Plastid Genome and Nuclear Ribosomal DNA (nrDNA) Assembly, Annotation, Visualization, and Phylogenetic Inference
The raw Illumina data were filtered for sequence quality using Trimmomatic v. 0.40 (Bolger et al., 2014) under default parameters. The filtered reads were assembled into plastome using the GetOrganelle pipeline (Jin et al., 2020). For a few accessions, Local Blast (Altschul et al., 1997) was used to align the contigs with the reference genomes (Prunus armeniaca (KY420025) and P. salicina (KY420002); Zhang N. et al., 2017; Zhang S. D. et al., 2017; Zhang X. et al., 2017). Finally, we concatenated each contig based on the orientation of the reference genome and obtained the consensus sequences through Geneious v.11.0.2 (Kearse et al., 2012). We annotated the assembled chloroplast genomes using Plastid Genome Annotator (PGA: Qu et al., 2019) and made minor manual adjustments using Geneious v.11.0.2. The transfer RNA (tRNA) genes were checked using tRNAscan-SE v.2.0 (Lowe and Chen, 2016). The circular plastid genome diagram was generated using the online OGDRAW (Lohse et al., 2013). The newly generated plastome sequence data of Maddenia and the other species of Rosaceae from this study have been submitted to GenBank (Table 1).
To obtain high-quality nuclear ribosomal DNA (nrDNA), including the Internal Transcribed Spacer (ITS) 1, 5.8S, and ITS2, a modified reference-based and de novo method (Zhang et al., 2015; Liu et al., 2019, 2020a,b) was employed for the assembly of the ITS sequences. The clean reads generated by Trimmomatic v. 0.40 (Bolger et al., 2014) were mapped to the reference sequence (Prunus hypoleuca: MH711078) using Bowtie2 v. 2.4.2 (Langmead and Salzberg, 2012), and then the draft sequence for each sample was generated. In addition, we conducted a de novo assembly using SPAdes v. 3.15.0 (Bankevich et al., 2012); the resulting scaffolds were used to correct the errors and ambiguities in the consensus sequences. Finally, we obtained high-quality nuclear ribosomal DNA (nrDNA) sequences for each sample using reference-based and de novo assembly methods.
We aligned the plastome and the ITS sequences using MAFFT (Katoh and Standley, 2013) using the software Geneious v.11.0.2 (Kearse et al., 2012). Based on maximum likelihood (ML) and Bayesian inference (BI) methods, we reconstructed the phylogeny of the Maddenia clade using the following nine datasets: (1) complete plastid genomes; (2) large-single-copy (LSC); (3) small-single-copy (SSC); (4) one inverted repeat (IR); (5) coding sequences (CDS); (6) non-coding region; (7) ITS; (8) concatenated sequence of matK, rbcL, and trnH-psbA; and (9) concatenated sequence of identified hypervariable regions. BI analyses were then conducted using MrBayes v.3.2 (Ronquist et al., 2012). The best-fitting models of nucleotide substitutions for BI analyses were determined based on the Akaike Information Criterion (AICc) through the CIPRES Science Gateway website (Miller et al., 2010). MrBayes was run for 10,000,000 generations, sampling every 1,000 generations. The first 25% of trees were discarded as a burn-in and the remaining trees were used to estimate the 50% majority-rule consensus tree and the Bayesian posterior probabilities (PP). For ML, all analyses were performed using the RAxML-HPC Black Box 8.2.12 (Stamatakis, 2014) with 10,000 bootstrap replicates and a GTR + G model at the CIPRES Science Gateway website (Miller et al., 2010).
Plastome Comparisons and Identification of Hypervariable Regions
Gene rearrangement events within the Maddenia clade were detected using the Mauve v2.4.0 (Darling et al., 2010) software. We chose one Maddenia sequence from each species for plastome comparisons, which were performed online using mVISTA in Shuffle-LAGAN mode (Frazer et al., 2004). The reference sequence used was P. wilsonii WX202.
To identify the hypervariable regions, we used 22 plastomes to conduct the sliding window analysis in DnaSP v5 (Librado and Rozas, 2009) using a step size of 200 bp and a window length of 600 bp. We chose the sequences with relatively higher values of nucleotide diversity (Pi) as the hypervariable regions. The Pi refers to the difference of the chloroplast genome sequences among sequenced samples.
Single-Copy Nuclear Marker Development, Gene Assembly, Alignment, and Phylogenetic Inference
As a part of the integrative systematic studies of Prunus, Hodel et al. (2021) identified 591 single-copy nuclear exons based on 17 transcriptomes of Prunus. Our genome skimming data were sequenced from the whole genomic DNA, which provided the opportunity to capture nuclear genes, including exon and intron sequences. We used three genomes of Prunus (P. dulcis (Mill.) D. A. Webb (https://www.ncbi.nlm.nih.gov/genome/10947), P. mume (Siebold) Sieb. et Zucc. (https://www.ncbi.nlm.nih.gov/genome/13911), and P. persica (L.) Batsch (https://www.ncbi.nlm.nih.gov/genome/388) as references to discover the corresponding complete genes (introns and exons) for the 591 exons. The resulting nuclear genes were used as references in the following gene assembly.
For assembling the SCN genes, we followed the pipelines of Liu et al. (2021). Briefly, the adapters and low-quality reads were trimmed using Trimmomatic v. 0.40 (Bolger et al., 2014), and the results were quality-checked using FastQC v. 0.11.9 (Andrews, 2018). The resulting clean reads were counted to calculate the sequencing coverage, assuming the genome size (352.9 Mb: Shirasawa et al., 2017) of P. avium (L.) L. HybPiper pipeline v. 1.3.1 (Johnson et al., 2016), with the default settings, was used to target the SCN genes; BWA v. 0.7.1 (Li and Durbin, 2009) was used to align and distribute the reads to the target genes; SPAdes v. 3.15.0 (Bankevich et al., 2012), with a coverage cutoff value of 5, was used to assemble the reads to the contigs; and Exonerate v. 2.2.0 (Slater and Birney, 2005) was used to align the assembled contigs to the target sequences and determine the exon-intron boundaries. To balance the quality and quantity of the captured SCN genes from the uneven sequencing coverage of genome skimming data (cf. Table 1), we used a relatively lower coverage cutoff for generating the contigs in SPAdes v. 3.15.0. Python and R scripts included in the HybPiper pipeline (Johnson et al., 2016) were used to retrieve the recovered gene sequences, and to summarize and visualize the recovery efficiency.
The sequences in each SCN gene were aligned using MAFFT v. 7.475 (Nakamura et al., 2018) with the settings: “–localpair –maxiterate1000.” Due to the variable sequencing depth in the genome skimming data, we employed three steps to remove the poorly aligned regions. In the first step, we used trimAL v. 1.2 (Capella-Gutiérrez et al., 2009) to trim the alignment of each SCN gene, in which all columns with gaps in more than 20% of the sequences or with a similarity score lower than 0.001 were removed. Considering the low-quality assembly in some regions, we used Spruceup (Borowiec, 2016) to discover, visualize, and remove the outlier sequences in the concatenated multiple sequence alignments with a window size of 50 and an overlap of 25. Because the Spruceup algorithm works better the more data it has, we concatenated all the SCN gene alignments using AMAS v. 1.0 (Borowiec, 2016) before running Spruceup, and we also used AMAS v. 1.0 (Borowiec, 2016) to split the processed/trimmed alignment back into single-locus alignments. The resulting alignments for each SCN gene were trimmed again using trimAL v. 1.2 (Capella-Gutiérrez et al., 2009) with the same parameters described above. At the third step, we excluded the sequences with <250 bp in each alignment using our customized python script (exclude_short_sequences.py), as the short sequences in each alignment have limited informative sites for the following coalescent-based species tree inference. Phylogenetic inference of the nuclear data of the Maddenia group was performed using both concatenated and coalescent-based methods. To reduce the effect of the missing data, gene alignments with at least 1,000 characters and 18 out of 22 taxa were retained. For the concatenation analysis, the best-fit partitioning schemes and nucleotide substitution models for the nuclear dataset were estimated using PartitionFinder2 (Stamatakis, 2006; Lanfear et al., 2016), under the corrected AICc and linked branch lengths, and with rcluster (Lanfear et al., 2014) algorithm options. The resulting scheme was then used to infer the ML trees using IQ-TREE 2 (Minh et al., 2020) and RAxML 8.2.12 (Stamatakis, 2014), respectively. To estimate the coalescent-based species tree, first, we inferred the individual ML gene trees using RAxML 8.2.12 (Stamatakis, 2014) with a GTRGAMMA model and 100 bootstrap replicates to assess the clade support, in which the low support branches (≤10) of gene trees were contracted by Newick Utilities (Junier and Zdobnov, 2010). The gene trees were then used to infer a species tree with ASTRAL-III v. 5.7.7 (Zhang et al., 2018) using local posterior probabilities (LPP; Sayyari and Mirarab, 2016) to assess clade support.
Retrieving Standard DNA Barcodes
To determine if standard DNA barcodes can resolve the interspecific relationships of Maddenia species, we extracted the gene sequences of matK, rbcL, and trnH-psbA from annotated plastomes, and then concatenated them into a single aligned dataset in Geneious v.11.0.2 (Kearse et al., 2012).
Phylogenetic Network Analyses
To explore the possibility of gene flow as a cause of discordance in the Maddenia group, we utilized 18 samples, including 17 Maddenia ingroups and one outgroup (Prunus davidiana (Carrière) Franch) for the phylogenetic network analyses. Species Networks applying Quartets (SNaQ: Solís-Lemus and Ané, 2016), as implemented in the Julia package PhyloNetworks (Solís-Lemus et al., 2017), was used to examine the contribution of the incomplete lineage sorting (ILS) and reticulation to the phylogenetic history of the Maddenia group. We used the ML tree inferred by RAxML for calculating the Concordance Factors (CFs), and the ASTRAL species tree was used as the input tree for SNaQ. We first tested the fit of the models, allowing from 0 to 8 reticulation events (h), and compared the models using their pseudolikelihood scores. For each number of hybrid nodes, we ran 50 SNaQ searches using the best topology from the previous run as a starting tree and retained the highest pseudolikelihood value. To distinguish the best fitting model, we used the log pseudolikelihood profile with h. A sharp improvement is expected until h reaches the best value and a slower, linear improvement thereafter. The best network was visualized in Julia using R.
Characterization of SSRs and Repeat Sequences in Plastomes
We searched for SSRs in seven Maddenia species using MISA (Thiel et al., 2003) with the settings at 10, 5, 4, 3, 3, 3 repeat units for mono-, di-, tri-, tetra-, penta-, and hexanucleotide SSRs, respectively. Tandem Repeat Finder (Benson, 1999) was used to analyze the tandem repeat sequences with the default parameters. One inverted repeat sequence was removed before detecting large repeat sequences. We employed REPuter (Kurtz et al., 2001) to identify the large repeat sequences, including forward, reverse, complement, and palindromic repeats. The minimal repeat size and Hamming distance were set at 30 bp and 3, respectively.
Morphological and Micromorphological Characteristics Detection
Images of mature leaves were taken with a Nikon SM225 Stereo microscope (Japan). To show the micromorphological traits, a scanning electron microscope (SEM) was used. The mature leaves were fixed in Formaldehyde-acetic acid-ethanol (FAA) (methanol: acetic acid: ethanol: water = 10:5:50:35), cut into small pieces, and washed in 70% alcohol. Then, they were dehydrated in an increasing alcohol series and iso-amyl acetate series. Afterward, the material was critical-point dried using liquid CO2 with a K850 critical-point dryer (Quorum). The leaf pieces were then mounted on aluminum stubs and sputter-coated with gold using a JS-1600 sputter coater (HTCY). Photos were taken with a Hitachi S-3400 SEM (Hitachi, Tokyo, Japan).
Results
Characteristics of Maddenia Plastomes
We used genome skimming to generate DNA sequence data for 22 samples, including seven Maddenia species (17 individuals) and five outgroup species. The size of the Maddenia plastomes ranged from 158,479 to 158,972 bp in length. The plastomes of all the Maddenia species had a quadripartite structure (Figure 2), including a large single-copy region (LSC, 86,939–87,405 bp), a small single-copy region (SSC, 18,862–18,930 bp), and two inverted repeated regions (IRs, 26,292–26,363 bp) (Table 2). The total Guanine-cytosine (GC) content of all the Maddenia plastomes was 36.6%, but the GC content in IRs (42.5–42.6%) was higher than that in LSC (34.4%) and SSC (30.4–30.5%). All the Maddenia plastomes encoded 113 unique genes, including 79 protein-coding genes (CDS), four ribosomal RNAs (rRNAs), and 30 tRNAs. In addition, 17 genes were duplicated in the IRs, of which 6, 4, and 7 encoded proteins, rRNAs, and tRNAs, respectively (Table 2). In Maddenia plastomes, 14 unique genes had introns, of which two (ycf3 and clpP) had two introns (Supplementary Table 1). The genome size, GC content, gene number, and order in all the Maddenia plastomes were relatively conserved in comparison to the outgroups (Table 2).
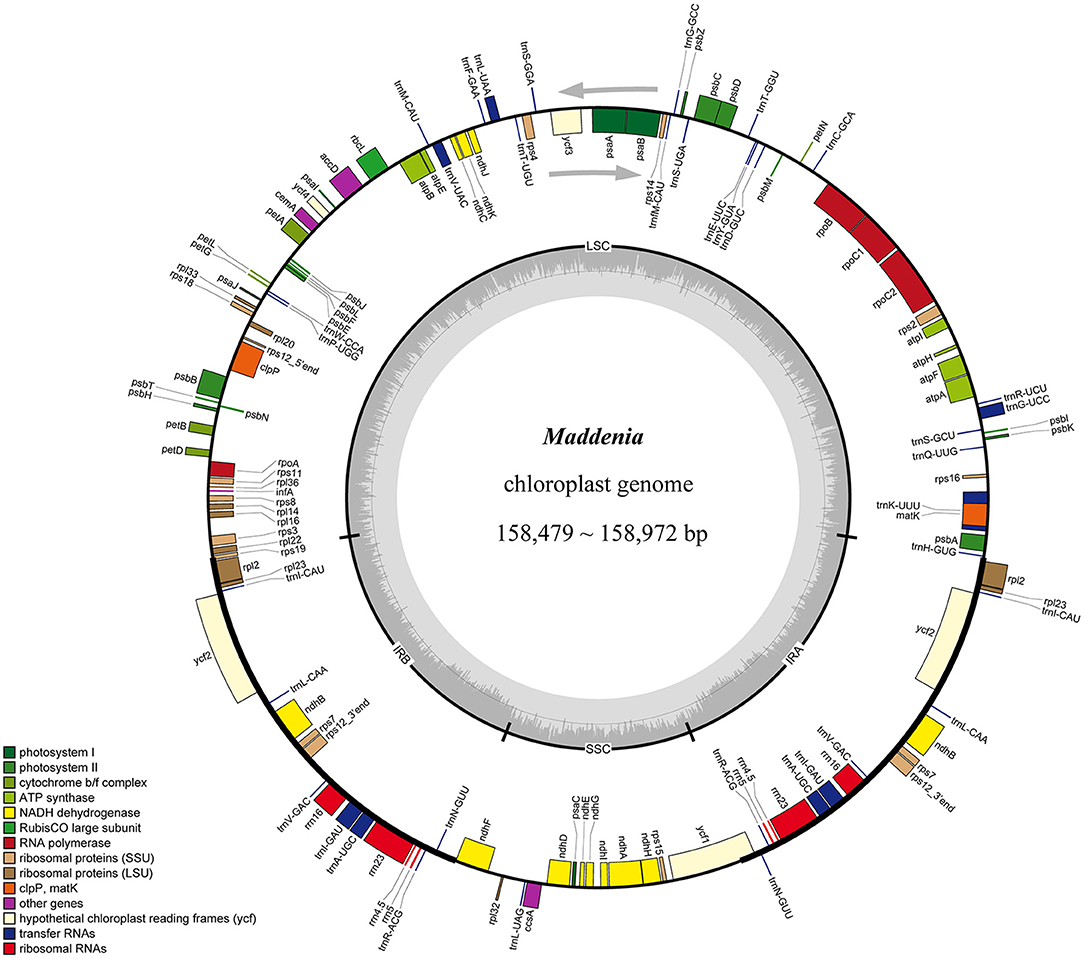
Figure 2. Gene map of Maddenia chloroplast genome. The two gray arrows indicate the direction of gene transcription. The dashed area in the inner circle indicates the GC content of the plastome. LSC, large-single-copy; SSC, small-single-copy; IR, inverted repeat.

Table 2. Summary information for the plastome sequences of Maddenia species.
Plastome Comparisons
Overall, Maddenia plastomes showed high sequence similarity, and non-coding regions had more divergence than coding regions (Figure 3). In the Mauve analysis, no rearrangement event was detected among the Maddenia plastomes (Supplementary Figure 1).
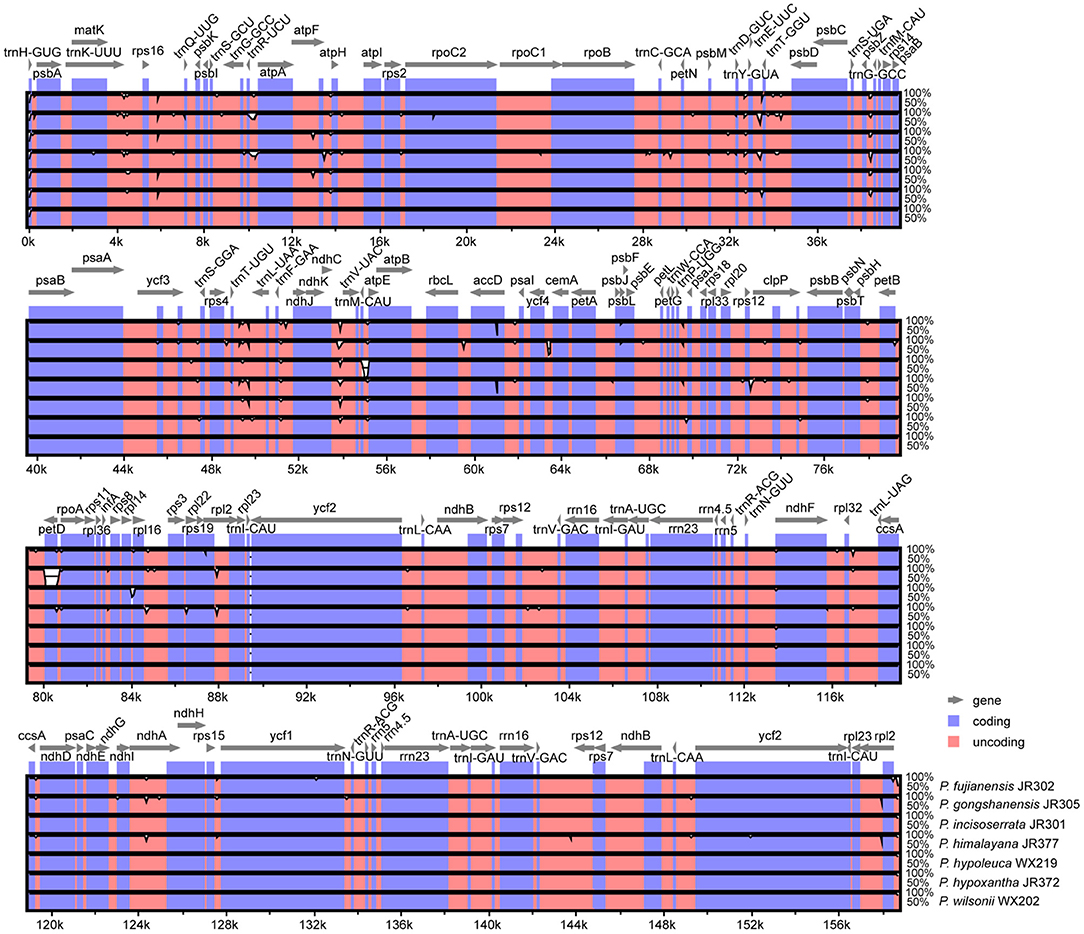
Figure 3. Visualization of alignment of the seven Maddenia chloroplast genome sequences using mVISTA. P. wilsonii WX202 was used as a reference sequence. Blue represents coding regions, and pink represents non-coding regions.
Nucleotide substitution and sequence distance were used to compare the difference of plastomes between the seven Maddenia species. Across all individuals, the number of nucleotide substitutions was 0–266 bp and the pairwise sequence distance percentage among the whole plastome sequences was 0–0.00169. The sequence differences between P. fujianensis, P. himalayana, and P. gongshanensis were much higher than those between P. hypoleuca, P. hypoxantha, P. incisoserrata, and P. wilsonii (Table 3).
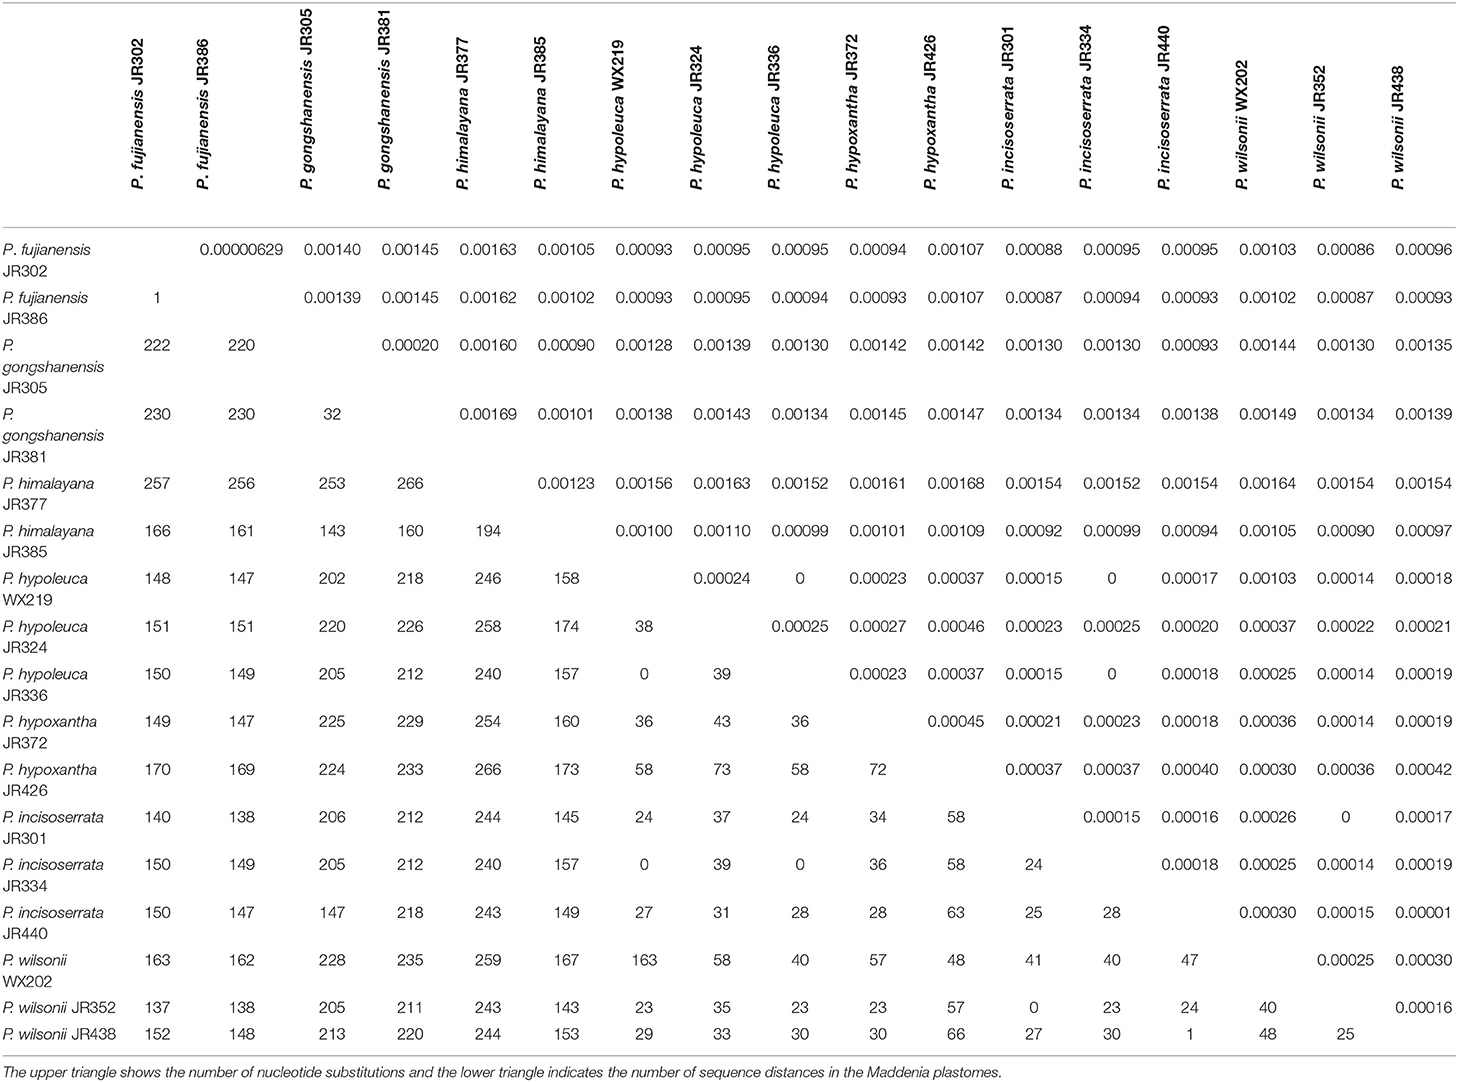
Table 3. Numbers of nucleotide substitutions and sequence distance in Maddenia plastomes.
IRs Expansion and Contraction
Given that there were no significant differences among the Maddenia plastomes (Supplementary Figures 1, 2), P. wilsonii WX202 in Maddenia was chosen to conduct border comparisons. Six Rosaceae species, i.e., Physocarpus amurensis (Maxim.) Maxim. WX230 and Prinsepia uniflora Batalin WX231 from Amygdaloideae; Rosa multiflora Thunb. (NC_039989) and Fragaria vesca L. (NC_015206) from Rosoideae; Dryas octopetala var. Asiatica (Nakai) Nakai (KY420029) and Purshia tridentata (Pursh) DC. (KY420000) from Dryadoideae, were compared to P. wilsonii WX202. Variation was detected in the expansion and contraction of IR regions (Figure 4). The LSC/IRb borders of Amygdaloideae species and Purshia tridentatawere located in the rps19 gene, which extended 81–134 bp into the IRb. In Rosoideae species, the LSC/IRb borders were in the intergenic spacers, and the intact rps19 gene in the LSC contracted 12–13 bp from the LSC/IRb border. In addition, the SSC/IRs borders were in the ndhF/ψycf1 and ycf1 genes except for the Rosa multiflora (only in ycf1 gene). The IRb/SSC border was located in the pseudogene ycf1 for Fragaria vesca and Dryas octopetala var. asiatica, and between the pseudogene ycf1 and ndhF gene for Rosa multiflora. The ndhF gene extended 9–29 bp into the IRb in the Amygdaloideae species and Purshia tridentata but was completely located in the SSC for Rosoideae species and Dryas octopetala var. asiatica. The SSC/IRa border was located in the ycf1 gene across the Rosaceae species. The gene trnH in the LSC contracted 3–324 bp from the border region of IRa/LSC.
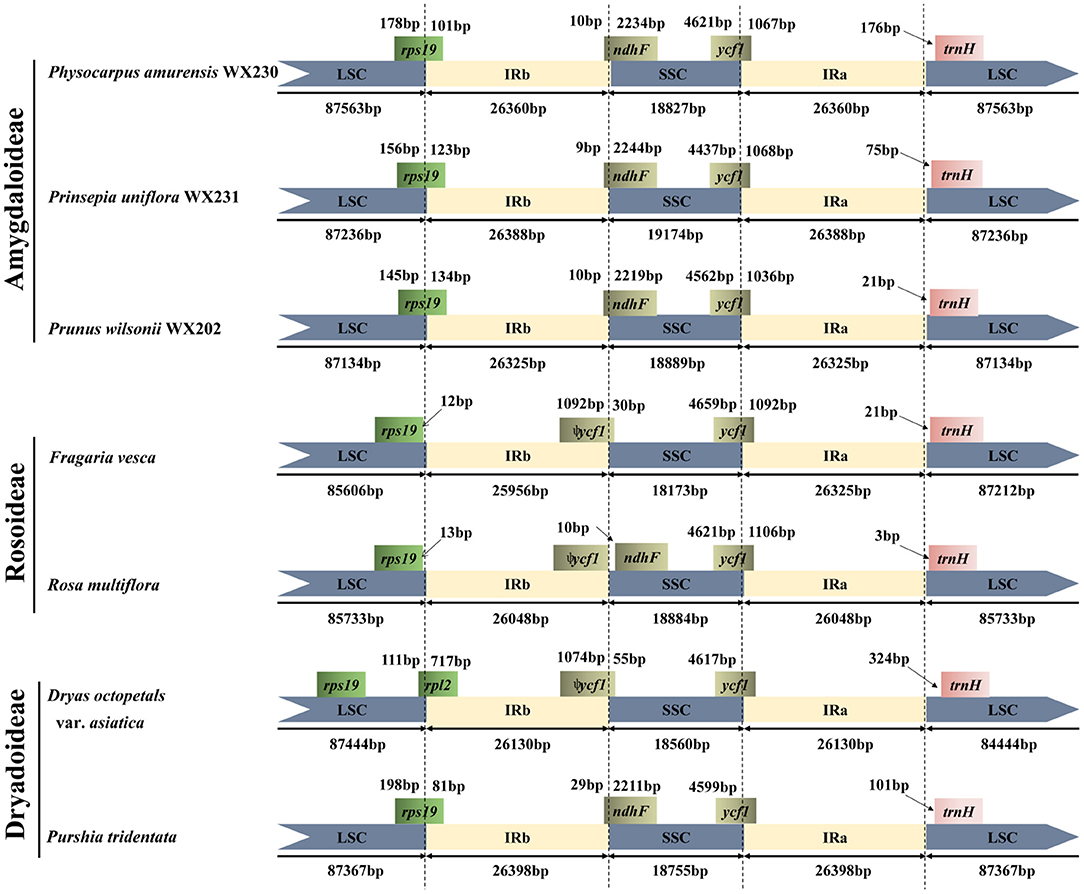
Figure 4. Comparison of the LSC, IRs, and SSC border regions of Maddenia group and other Rosaceae plastomes.
Identification of Hypervariable Regions
The Pi values were used to determine hypervariable regions. The result showed that the Pi values in IRs were less than those in LSC and SSC. We chose the regions with relatively higher Pi values as hypervariable regions. A total of eight hypervariable regions were identified, including seven intergenic spacer regions (trnS–trnG, trnR–atpA, trnC–petN, trnT–trnL, ndhC–trnV, ndhF–rpl32, and rpl32–trnL) and one protein-coding region (ycf1). These sequences were all located in two single-copy regions and none in IR regions (Figure 5). The Pi value of eight hypervariable regions ranged from 0.01619–0.03251 (Table 4).
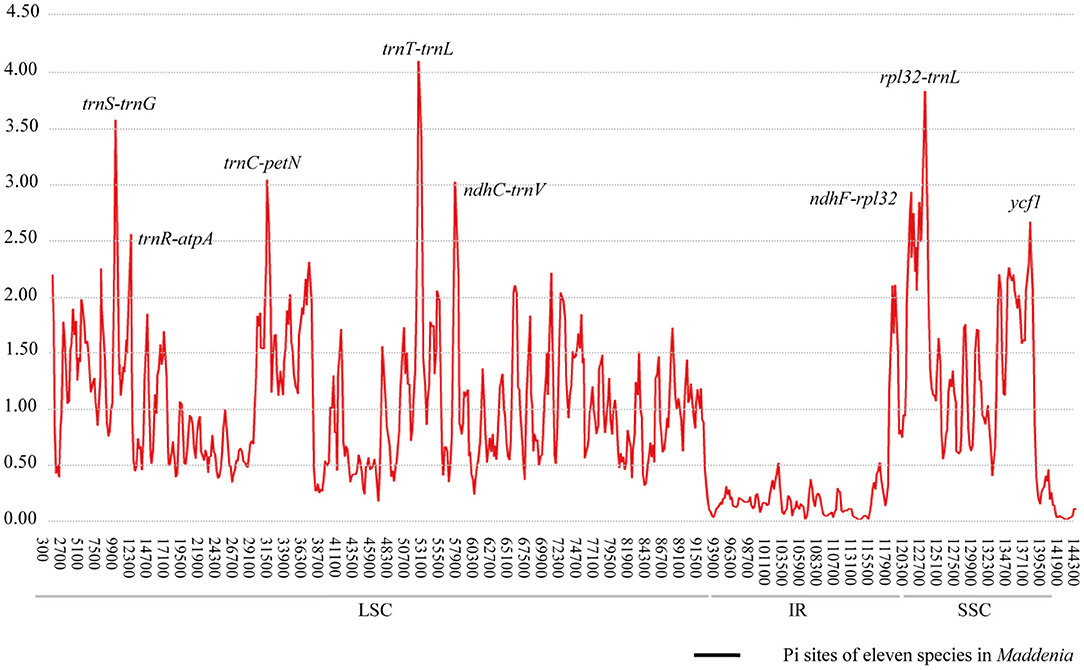
Figure 5. Sliding window analysis of the plastomes of samples.
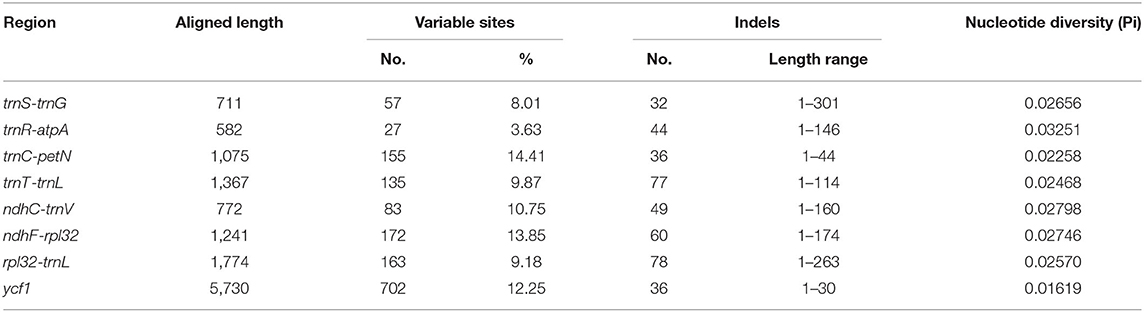
Table 4. Sequence characteristics of eight high variable regions among 22 plastomes.
Repeat Analyses
A total of 558 SSRs were identified in seven Maddenia species, including mono-, di-, tri-, tetra-, and pentanucleotide, but there was no hexanucleotide in all plastomes (Figure 6B). P. fujianensis showed the most SSRs, followed by P. hypoxantha, P. wilsonii, P. hypoleuca, P. incisoserrata, and P. himalayana, while the SSR numbers of P. gongshanensis were the least (Figure 6B). There were many SSR motif types in the Maddenia plastomes, but most of them had few SSRs and only two types (A/T and AT/TA) contained more SSRs (Supplementary Figure 3A). The lengths of SSRs ranged from 10 to 24 bp (Figure 6C).
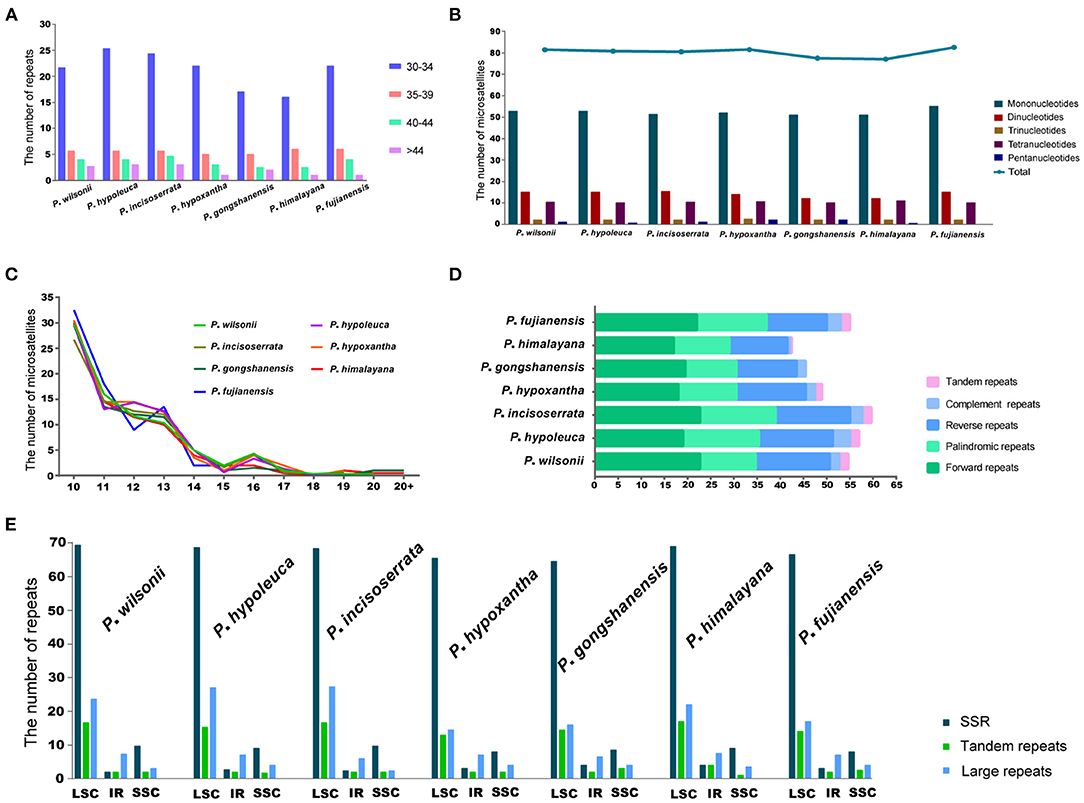
Figure 6. Analyses of simple sequence repeats (SSRs) and repeated sequences in plastomes of Maddenia species. (A) Frequency of four repeats by length; (B) Number of five repeat types; (C) Frequency of microsatellites by length; (D) Numbers of five different types of repeats; (E) Number of all repeats by location.
In Maddenia plastomes, the repeat sequences included forward, reverse, palindromic, complement, and tandem repeats. P. incisoserrata contained the most repeat sequences, P. himalayana had the least, and P. gongshanensis had no tandem repeats (Figure 6D). The most common type of repeat sequences by length was 30–34 bp (Figure 6A).
Most of the SSRs and repeat sequences were located in the LSC, followed by the SSC and IRs (Figure 6E). In addition, repeat sequences were mainly distributed in the intergenic spacers (IGS), but some were also found in the CDS and intron regions (Supplementary Figure 3B).
Phylogenetic Analysis
To resolve the phylogenetic relationship of the Maddenia clade, different trees were reconstructed based on complete plastomes and SCN genes. For plastome data, all the trees had identical topology except SSC and IR (Figure 7A and Supplementary Figure 4). In the rest of this section, the tree based on complete plastomes will be used to discuss the phylogenetic relationships of the Maddenia group, which was monophyletic and was separated into three subclades with high support values. Subclade I only include one species (P. fujianensis) from Fujian Province of eastern China. Subclade II is sister to subclade III, and together they are both sister to subclade I with a posterior probability of 1.00 Subclade II consists of P. gongshanensis from Yunnan Province (China) and P. himalayana from Tibet (China) and the adjacent Himalayan region. For the individuals sampled, the two species are reciprocally monophyletic. Subclade III is composed of four former species with a posterior probability of 1.00 and bootstrap value of 100%, in which samples from the same geographical position were grouped, although the four species were each not clearly identified.
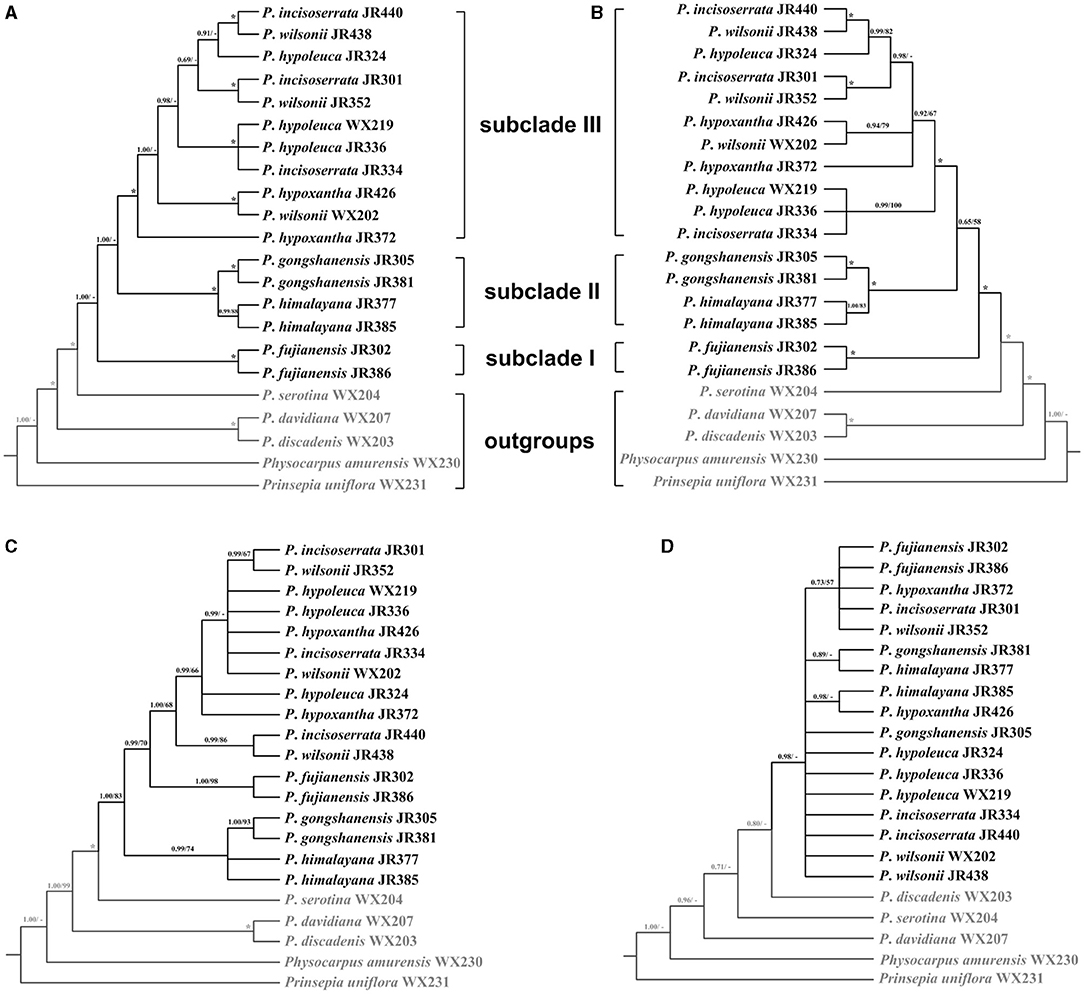
Figure 7. Phylogenetic relationships of the Maddenia group of Prunus inferred from Bayesian inference (BI) and maximum likelihood (ML) based on four datasets. (A) complete plastomes; (B) hypervariable regions; (C) rbcL+matK+trnH-psbA; (D) internal transcribed spacer (ITS) sequence. The support values above the branches show PP (posterior probability) / BS (bootstrap support), and asterisks indicate 1.00/100%. Dashes represent incongruences of BI and ML trees.
To save costs of sequencing for further investigations on Maddenia, we also tried to explore four standard DNA barcodes to identify Maddenia species. Concatenated rbcL, matK, and trnH-psbA and ITS datasets were used to construct the phylogenetic trees of Maddenia, respectively. The trees constructed by the standard DNA barcodes were not congruent with those reconstructed using the complete plastomes (Figures 7C,D). In the phylogenic tree based on concatenated rbcL, matK, and trnH-psbA, although the Maddenia species formed a clade, P. fujianensis was sister to subclade III rather than to the remaining Maddenia species. In addition, the two P. himalayana individuals did not group, and subclade III exhibited more polytomies than the tree based on complete plastomes. For the tree based on ITS sequences, there were many polytomies and the interspecific relationships within Maddenia were poorly resolved.
Eight concatenated hypervariable regions (“specific barcodes”; see Discussion) were also employed to reconstruct the phylogenetic relationship of the Maddenia clade. We found that the topology based on the hypervariable regions was similar to that of complete plastomes, though there were lower support values at some branches (Figure 7B).
The recovery efficiency of each SCN gene is shown in Figure 8. The quality of the nuclear genes recovered was relatively high. In total, we got 446 SCN genes from raw data. We also filtered out genes with <80% samples, leaving 413 SCN genes with more than 600 bp in length. For the tree generated by 446 SCN genes data, the Maddenia clade was monophyletic but its deep nodes were not resolved well (Figure 9). It was obvious that there were five subclades in the Maddenia internal clade according to their geographic positions (e.g., Fujian Province, Yunnan Province, Tibet, Sichuan Province, and Qingling Mountain). Subclades A, B, and C comprise P. fujianensis, P. gongshanensis, and P. himalayana, respectively. The monophyly of each of the three species was well-supported, which was congruent with that of 413 SCN genes (Supplementary Figure 5). Subclade D consists of samples of P. hypoxantha and one individual of P. wilsonii. Subclade E contains P. hypoleuca, P. incisoserrata, and two individuals of P. wilsonii. However, these four species are not identified clearly.
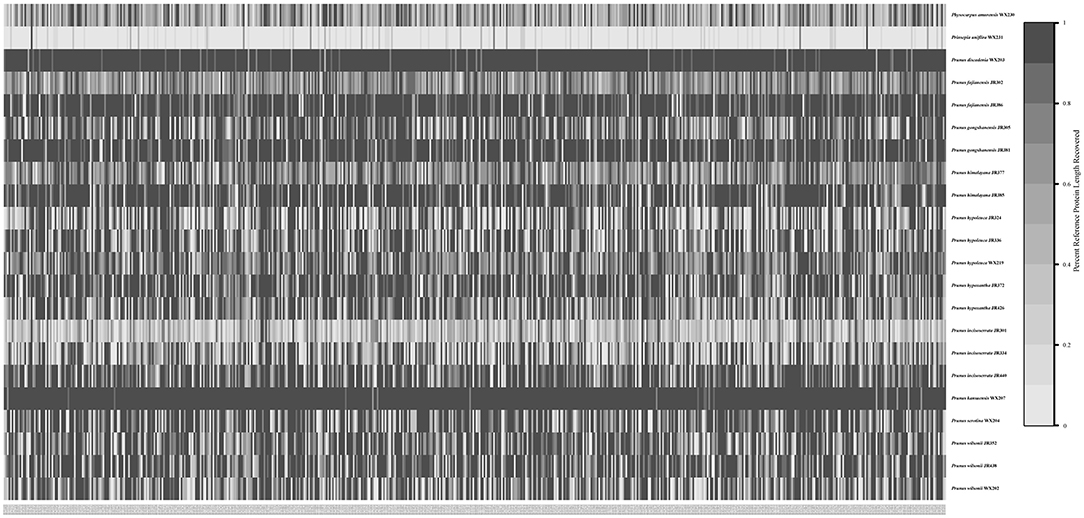
Figure 8. Heat map showing recovery efficiency for 591 genes enriched in the Maddenia group recovered by HybPiper. Each column is a gene, and each row is one sample. The shade of gray in the cell is determined by the length of sequence recovered by the pipeline, divided by the length of the reference gene (maximum of 1).
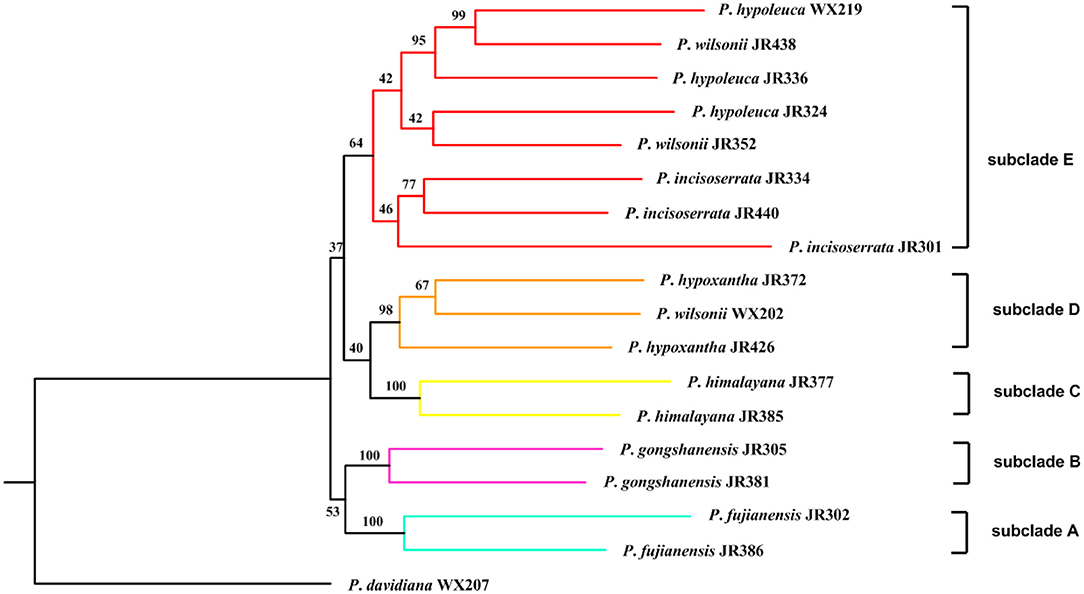
Figure 9. Maximum likelihood inferred from 446 single-copy nuclear (SCN) genes of Maddenia group of Prunus. The number above branch indicated bootstrap support from the IQ-TREE.
Phylogenetic Network Analyses of Nuclear Data With SNaQ
The optimal hmax value inferred in the SNaQ was six, which has the highest pseudolikelihood network score (−676.478, Supplementary Figure 6). The phylogenetic network analyses showed that there were widespread hybridization events within the Maddenia group (Figure 10). The two P. himalayana individuals were 74.4% sister to each other and 25.6% sister to P. gongshanensis JR381. The group (P. fujianensis JR302+P. hypoxantha JR426+ P. incisoserrata JR334) was 66.1% sister to (P. fujianensis JR386+ P. incisoserrata JR301) and 33.9% sister to P. wilsonii WX202. P. incisoserrata JR334 was 53.5% sister to P. hypoxantha JR426 and 46.5% sister to P. fujianensis JR302. P. wilsonii JR438 was 95.8% sister to P. hypoleuca WX219 and 4.21% sister to P. hypoleuca JR336.
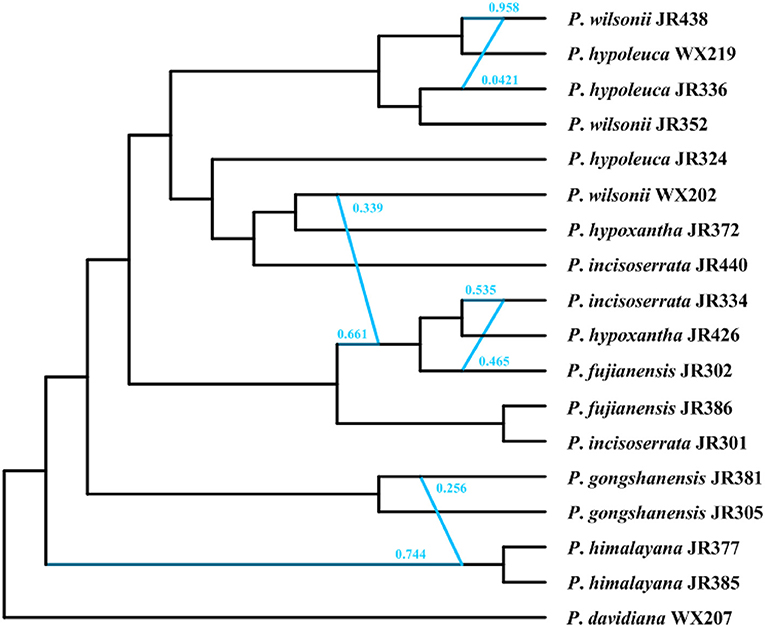
Figure 10. The phylogenetic network inferred in the SNaQ/PhyloNetworks analysis. The blue line indicated the hybridization events in the network.
Morphological and Micromorphological Traits
The mature leaves of the Maddenia species are green to deep green adaxially. The shapes of the leaves and leaf bases are multiple (Figure 11A1−7). The leaf margins are serrulate, irregularly serrate, or doubly serrate. A few glandular teeth were found at the leaf bases of P. hypoleuca, P. incisoserrata, P. wilsonii, P. hypoxantha, and P. fujianensis (Figure 11B1−5), while many glandular teeth grow at the lower margins of P. gongshanensis (Figure 11A6). For P. himalayana, leaf margins have less glandular on the foliage branch while, in the reproductive branch, the glandular teeth are distributed abundantly near the bases (Figure 11B7).
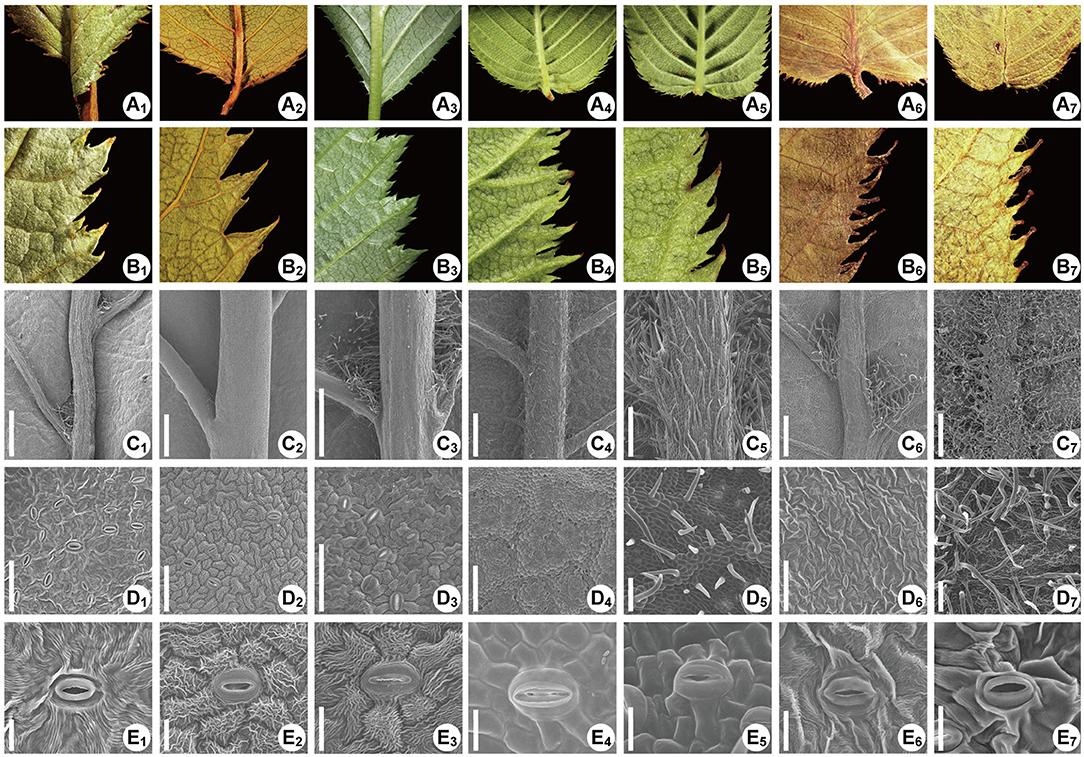
Figure 11. The leaf morphology of the Maddenia species. The species are Prunus fujianensis, Prunus hypoleuca, P. incisoserrata, Prunus hypoxantha, P. wilsonii, Prunus gongshanensis, and Prunus himalayana, respectively in each row from left to right. (A1-A7) Leave bases, showing the glandular teeth; (B1-B7) Partial views of leaf margins, showing the shapes of teeth and glandular teeth; (C1-C7) Abaxial leaves, showing the pubescence distribution; (D1-D7) Detailed view of the pubescence on intercostal areas; (E1-E7) Stomata and guard cells, showing the ornamentation.
The most notable morphological character differentiating species in Maddenia is the hair distribution on the abaxial leaf surface. In P. fujianensis, few hairs were found at the axils between midvein and secondary veins, and there is no hair on the intercostal area (Figure 11C1,D1). The intercostal area of P. hypoleuca and P. incisoserrata are also glabrous, but the distribution pattern of hairs at the axils shows high diversity (Figure 11C2,3,D2,3). There were no hairs or only a few hairs growing on the bases of secondary veins, or there was a cluster of hairs growing on the axil. Such three situations could be found on a single blade of the leaf. In P. wilsonii and P. hypoxantha hairs grow all along the veins, but the hairs are present on veinlets in the intercostal area of P. wilsonii, which distinguishes it from P. hypoxantha (Figure 11C4,5,D4,5). Hairs were also observed at the axils of P. gongshanensis, and sometimes there are a few hairs on the midvein at the base (Figure 11C6,D6). Leaves of P. himalayana are densely pubescent on the abaxial side (Figure 11C7,D7).
In all seven species, stomata are found only on the abaxial surface, and each of them consists of a pair of guard cells encircled by several other cells (Figure 11E1−7). Distinct circular ornamentations were found on the cell wall of guard cells in P. hypoleuca and P. incisoserrata (Figure 11E2,3). In the other species, such ornamentations are relatively obscure or nearly inexistent (Figure 11E1,4−7).
Discussion
Comparative Plastomes of Maddenia
All sequenced Maddenia plastomes share a typical quadripartite structure, which is similar to most photosynthetic angiosperms (Jansen and Ruhlman, 2012; Abdullah et al., 2019; Xu et al., 2019). However, the loss of one complete IR region also occurred in some taxa, such as the inverted-repeat-lacking clade of Fabaceae (Wang et al., 2017), Erodium of Geraniaceae (Guisinger et al., 2011), and Carnegiea of Cactaceae (Sanderson et al., 2015). In addition, the GC content in the IRs was higher than that in LSC and SSC, which is due to the presence of rRNA genes with high GC content (Kim and Lee, 2004). The conserved genome size, GC content, and gene number of Maddenia plastomes resemble other Amygdaloideae species (Wang et al., 2013; Kim et al., 2018). Although gene rearrangement events have been reported in some genera of other families, such as Lasthenia of Asteraceae (Walker et al., 2014), Anemone of Ranunculaceae (Liu et al., 2018), and Passiflora of Passifloraceae (Rabah et al., 2018), we observed no such events in Maddenia plastomes (Supplementary Figure 1).
The expansion and contraction of the IR region have an impact on the plastome size to some extent (Jansen and Ruhlman, 2012). Expansion events caused several genes in SC regions to enter the IR region. However, small IR expansions and contractions have a much higher frequency than large ones in seed plants (Goulding et al., 1996; Downie and Jansen, 2015). For Maddenia, no significant variation and slight IR expansions and contractions exist in every border of plastomes (Supplementary Figure 2), demonstrating their conserved traits. Nevertheless, compared with other Rosaceae species, we observe that Rosoideae plastomes have a partial rps19 gene in the LSC region but an intact rps19 gene in the LSC of Amygdaloideae. Variations in the location of the rps19 gene were also documented in other Rosaceae species (e.g., Wang et al., 2013; Kim et al., 2018). However, our results indicate that the location of the rps19 gene is not useful in distinguishing the three subfamilies, since the two Dryadoideae plastomes we analyzed showed two different locations of the rps19 gene: one matching Amygdaoideae and the other matching a member of Rosoideae.
The SSRs are effective molecular markers to population genetic and phylogenetic studies in plants (Powell et al., 1995; Doorduin et al., 2011; Zhang X. et al., 2017; Sun et al., 2020). A total of 558 SSRs were identified in seven Maddenia species (Figure 6). The SSRs motif type (A/T) was quite common and most of SSRs were located in the intergenic spacers, which were similar to other Rosaceae species (Wang et al., 2013). In addition, previous studies supported that the region rich in A/T had the most repeats and indels (Cai et al., 2008). Thus, Maddenia SSRs could be further utilized for population genetics research in the future.
Phylogenetic Analyses and Implications for Species Delimitation
Our results provided strong support for the monophyly of the Maddenia clade based on both plastome and nuclear datasets. The phylogenetic trees based on complete plastomes and nuclear datasets divided Maddenia into three and five major subclades, respectively. Subclade I in the plastome tree (= subclade A in the nuclear tree) included one species (P. fujianensis) only distributed at Wuyi Mountain of Fujian Province in Southeast of China. Maddenia fujianensis has been treated as a synonym of P. hypoleuca, for the differentiating characters between them are continuous (Wen and Shi, 2012). P. fujianensis was, however, sister to all remaining species of the Maddenia group based on plastome data. Even though this relationship was not congruent with that of SCN genes (Figure 9), the monophyly of P. fujianensis was well-supported. The SNaQ analyses suggested one hybridization event between P. fujianensis JR302 and P. incisoserrata JR334 (Figure 10). Therefore, it is likely that P. fujianensis may be a cryptic species, even though it is morphologically and micromorphologically similar to P. hypoleuca (Figure 11). More attention should be focused on the origin of P. fujianensis in our future studies, sampling P. hypoleuca broadly across its entire distribution range.
Subclade II in the plastome tree consists of P. gongshanensis and P. himalayana (= subclades B and C, respectively, in the nuclear tree) distributed in Yunnan Province (Northwest Hengduan Mountains) and Southeast Tibet, respectively. P. gongshanensis is characterized by subcordate to cordate leaf bases and glabrous leaf surfaces. P. himalayana stands out by its abaxially dense pubescent leaf blade. Although these two species can be identified based on both molecular, morphological, and micromorphological evidence, one hybridization event between them was detected in the SNaQ analyses (Figures 10, 11).
Subclade III in the plastome tree (comprising subclades D and E in the nuclear tree) is composed of the remaining four species, but their relationships were not resolved. Interestingly, most different species from the same geographical area were grouped, such as P. hypoxantha JR426 and P. wilsonii WX202 from the Emei Mountain of Sichuan Province and P. hypoxantha JR372 from Kangding of Sichuan Province, and all others from the Qinling Mountain region. Meanwhile, the nuclear tree showed that these four species were divided into two groups according to their geographical distribution. Therefore, we assume that Maddenia subclade III might represent two species, i.e. P. hypoleuca and P. hypoxantha, which is congruent with the treatment of Wen and Shi (2012). P. incisoserrata may best be merged with P. hypoleuca because they cannot be reliably distinguished by either molecular or morphological evidence (Figure 11). Although P. hypoxantha and P. wilsonii can be identified, to some extent, by the distribution of pubescence on the abaxial leaf surface (i.e., pubescence only on veins vs. denser pubescence on veins (Figure 11), we conclude that the latter should be treated as a synonym of the former due to the unsolved relationship between them in the various phylogenetic trees based on our results. Moreover, the sequence differences among species of subclade III of chloroplast tree are minimal (Table 3). Gene flow might be widespread within these two species as detected by the SNaQ analyses (Figure 10). Future studies should aim to explore the speciation history of subclade III using a broader populational sampling scheme.
On Specific Barcoding of Maddenia
Considering the limitations of the standard DNA barcodes and the higher cost of super barcoding, an alternative approach known as “specific barcoding” was proposed, which combined the advantages of the other two (Li et al., 2015). Specific barcoding uses the sequences in target plastomes with high mutation rates. Compared to standard DNA barcodes, specific barcoding is more applicable for differentiation among closely related taxa (Li et al., 2015). We detected eight hypervariable regions among 22 individual plastomes, most of which are located in intergenic spacers (Figure 5). This result as well as those from mVISTA, SSRs, and repeat sequence analyses support that the intergenic spacers harbor the highest levels of variation in plastomes. High variability regions in the intergenic spacer have been reported in other studies and shown excellent discriminating ability, such as Echinacea of Asteraceae (Zhang N. et al., 2017), Rhodiola of Crassulaceae (Zhao et al., 2019), and Pulsatilla of Ranunculaceae (Li et al., 2020). Therefore, developing specific barcodes in the intergenic spacers is well-founded and should provide a reliable approach to assess the phylogenetic relationships and identification among Maddenia species.
The tree estimated from the specific barcoding regions (Figure 7B) had a similar topology with that of the complete chloroplast genomes. However, the sister relationship between subclades II and III was relatively weakly supported (posterior probability of 0.65 and bootstrap support of 58%). At the same time, the gene flow between the species of subclade III within Maddenia is active. The utility of these barcodes from chloroplast genomes would be limited for this group. More sampling in population-scale and high-throughput sequencing nuclear data such as RAD or whole-genome resequencing are needed to further explore the relationships of the species of subclade III.
Data Availability Statement
The datasets presented in this study can be found in online repositories. The names of the repository/repositories and accession number(s) can be found in the article.
Author Contributions
LZ and JW planned and designed the research. NS, B-BL, J-RW, CR, and R-CT performed the experiments and analyzed the data. NS, B-BL, J-RW, R-CT, CR, Z-YC, LZ, DP, and JW wrote the manuscript. All authors approved the final manuscript.
Funding
This project was supported by the National Natural Science Foundation of China (Nos. 32170381, 31770200, 32000163, and 31300158) and the Chinese Universities Scientific Fund (No. 2452020179).
Conflict of Interest
The authors declare that the research was conducted in the absence of any commercial or financial relationships that could be construed as a potential conflict of interest.
Publisher's Note
All claims expressed in this article are solely those of the authors and do not necessarily represent those of their affiliated organizations, or those of the publisher, the editors and the reviewers. Any product that may be evaluated in this article, or claim that may be made by its manufacturer, is not guaranteed or endorsed by the publisher.
Acknowledgments
We are very grateful to Fuzhen Guo, Xiaohua He, Minrong Luo, Ningjuan Fan, and Guoyun Zhang of Northwest A&F University for their assistance with the SEM and LM. We sincerely thank Prof. Rong Li for the sample collection and Prof. Zhong-hu Li for his help with data analysis.
Supplementary Material
The Supplementary Material for this article can be found online at: https://www.frontiersin.org/articles/10.3389/fpls.2021.743643/full#supplementary-material
Supplementary Figure 1. Structural variation between plastomes of Maddenia and outgroups revealed by Mauve.
Supplementary Figure 2. Comparison of the large-single-copy (LSC), inverted repeats (IRs), and small-single-copy (SSC) border regions of Maddenia plastomes.
Supplementary Figure 3. Microsatellites number of different base compositions and distribution of all repeated sequences. (A) Frequency of microsatellites by base composition; (B) Number of all repeats by location. CDS, coding sequences; IGS, intergenic spacers.
Supplementary Figure 4. Phylogenetic relationships of Maddenia inferred from Bayesian inference (BI) and maximum likelihood (ML) based on six datasets. (A) complete plastomes; (B) coding regions; (C) LSC region; (D) non-coding regions; (E) SSC region; (F) IR region. The support values above the branches show PP (posterior probability) / BS (bootstrap support), and asterisks indicate 1.00/100%. Dashes represent incongruences of BI and ML trees.
Supplementary Figure 5. Maximum likelihood inferred from 413 single-copy nuclear (SCN) genes of Maddenia group of Prunus. The number above branch indicated bootstrap support from the IQ-TREE.
Supplementary Figure 6. The pseudolikelihood network score from the Species Networks applying Quartets (SNaQ) analysis for each of the maximum number of hybridizations allowed (hmax).
Supplementary Table 1. Genes present in the 17 complete Maddenia chloroplast genomes.
References
Abdullah, A., Shahzadi, I., Mehmood, F., Ali, Z., Malik, M. S., Wassem, S., et al. (2019). Comparative analyses of chloroplast genomes among three Firmiana species: identification of mutational hotspots and phylogenetic relationship with other species of Malvaceae. Plant Gene 19:100199. doi: 10.1016/j.plgene.2019.100199
Altschul, S. F., Madden, T. L., Schäffer, A. A., Zhang, J., Zhang, Z., Miller, W., et al. (1997). Gapped BLAST and PSI–BLAST: a new generation of protein database search program. Nucl. Acids Res. 25, 3389–3402. doi: 10.1093/nar/25.17.3389
Andrews, S. (2018). FastQC: A Quality Control Tool for High Throughput Sequence Data. Available online at: http://www.bioinformatics.babraham.ac.uk/projects/fastqc/ (accessed March 20, 2021).
Andro, M. C., and Riffaud, J. P. (1995). Pygeum africana extract for the treatment of patients with benign prostatic hyperplasia: a review of 25 years of published experience. Curr. Ther. Res. 56, 796–817. doi: 10.1016/0011-393X(95)85063-5
Bankevich, A., Nurk, S., Antipov, D., Gurevich, A. A., Dvorkin, M., Kulikov, A. S., et al. (2012). SPAdes: a new genome assembly algorithm and its applications to single-cell sequencing. J. Comput. Biol. 19, 455–477. doi: 10.1089/cmb.2012.0021
Benson, G. (1999). Tandem repeats finder: a program to analyze DNA sequences. Nucl. Acids Res. 27, 573–580. doi: 10.1093/nar/27.2.573
Bolger, A. M., Lohse, M., and Usadel, B. (2014). Trimmomatic: a flexible trimmer for Illumina sequence data. Bioinformatics 30, 2114–2120. doi: 10.1093/bioinformatics/btu170
Borowiec, M. L. (2016). AMAS: A fast tool for alignment manipulation and computing of summary statistics. PeerJ 4:e1660. doi: 10.7717/peerj.1660
Cai, C. N., Ma, H., Ci, X. Q., Conran, J. G., and Li, J. (2021). Comparative phylogenetic analyses of Chinese Horsfieldia (Myristicaceae) using complete chloroplast genome sequences. J. Syst. Evol. 59, 504–514. doi: 10.1111/jse.12556
Cai, Z. Q., Guisinger, M., Kim, H. G., Ruck, E., Blazier, J. C., McMurtry, V., et al. (2008). Extensive reorganization of the plastid genome of Trifolium subterraneum (Fabaceae) is associated with numerous repeated sequences and novel DNA insertions. J. Mol. Evol. 67, 696–704. doi: 10.1007/s00239-008-9180-7
Capella-Gutiérrez, S., Silla-Martínez, J. M., and Gabaldón, T. (2009). trimAL: a tool for automated alignment trimming in large-scale phylogenetic analyses. Bioinformatics 25, 1972–1973. doi: 10.1093/bioinformatics/btp348
Chin, S. W., Shaw, J., Haberle, R., Wen, J., and Potter, D. (2014). Diversification of almonds, peaches, plums and cherries–molecular systematics and biogeographic history of Prunus (Rosaceae). Mol. Phylogenet. Evol. 76, 34–38. doi: 10.1016/j.ympev.2014.02.024
Chin, S. W., Wen, J., Johnson, G., and Potter, D. (2010). Merging Maddenia with the morphologically diverse Prunus (Roseaceae). Bot. J. Linn. Soc. 163, 236–245. doi: 10.1111/j.1095-8339.2010.01083.x
China Plant BOL Group (2011). Comparative analysis of a large dataset indicates that internal transcribed spacer (ITS) should be incorporated into the core barcode for seed plants. Proc. Natl. Acad. Sci. U. S. A. 108, 19641–19646. doi: 10.1073/pnas.1104551108
Darling, A. E., Mau, B., and Perna, N. T. (2010). Progressive Mauve: multiple genome alignment with gene gain, loss and rearrangement. PLoS ONE 5:e11147. doi: 10.1371/journal.pone.0011147
Do, H. D. K., Kim, C., Chase, M. W., and Kim, J. H. (2020). Implications of plastome evolution in the true lilies (monocot order Liliales). Mol. Phylogenet. Evol. 148:106818. doi: 10.1016/j.ympev.2020.106818
Doorduin, L., Gravendeel, B., Lammers, Y., Ariyurek, Y., Chin-A-Woeng, T., and Vrieling, K. (2011). The complete chloroplast genome of 17 individuals of pest species Jacobaea vulgaris: SNPs, microsatellites and barcoding markers for population and phylogenetic studies. DNA Res. 18, 93–105. doi: 10.1093/dnares/dsr002
Downie, S. R., and Jansen, R. K. (2015). A comparative analysis of whole plastid genomes from the Apiales: expansion and contraction of the inverted repeat, mitochondrial to plastid transfer of DNA, and identification of highly divergent noncoding regions. Syst. Bot. 40, 336–351. doi: 10.1600/036364415X686620
Doyle, J., and Doyle, J. (1987). A rapid DNA isolation procedure for small quantities of fresh leaf tissue. Phytochem. Bull. 19, 11–15.
Erickson, D. L., Spouge, J., Resch, A., Weigt, L. A., and Kress, J. W. (2008). DNA barcoding in land plants: developing standards to quantify and maximize success. Taxon 57, 1304–1316. doi: 10.1002/tax.574020
Focke, W. O. (1894). “Rosaceae,” in Dienatürlichen Pflanzenfamilien Volume 8, eds A. Engler and K. Prantl (Leipzig: Engelmann), 1–61.
Frazer, K. A., Pachter, L., Poliakov, A., Rubin, E. M., and Dubchak, I. (2004). Vista: computational tools for comparative genomics. Nucl. Acids Res. 32, 273–279. doi: 10.1093/nar/gkh458
Gitzendanner, M. A., Soltis, P. S., Yi, T. S., Li, D. Z., and Soltis, D. E. (2018). Plastome phylogenetics: 30 years of inferences into plant evolution. Adv. Bot. Res. 85, 293–313. doi: 10.1016/bs.abr.2017.11.016
Goulding, S. E., Olmstead, R. G., Morden, C. W., and Wolfe, K. H. (1996). Ebb and flow of the chloroplast inverted repeat. Mol. Gen. Genet. 252, 195–206. doi: 10.1007/BF02173220
Guisinger, M. M., Kuehl, J. V., Boore, J. L., and Jansen, R. K. (2011). Extreme reconfiguration of plastid genomes in the angiosperm family Geraniaceae: rearrangements, repeats, and codon usage. Mol. Biol. Evol. 28, 583–600. doi: 10.1093/molbev/msq229
Hodel, R. G. J., Zimmer, E., and Wen, J. (2021). A phylogenomic approach resolves the backbone of Prunus (Rosaceae) and identifies signals of hybridization and allopolyploidy. Mol. Phylogenet. Evol. 160:107118. doi: 10.1016/j.ympev.2021.107118
Hooker, J. D., and Thomson, T. (1854). On Maddenia and Diplarche, new genera of Himalayan plants. Hooker's Journal of Botany and Kew Garden Miscellany 6, 380–384.
Jansen, R. K., and Ruhlman, T. A (2012). “Plastid genomes of seed plants” in Genomics of Chloroplasts and Mitochondria, eds R. Bock and V. Knoop (Dordrecht: Springer Netherlands), 103–126. doi: 10.1007/978-94-007-2920-9_5
Jin, J. J., Yu, W. B., Yang, J. B., Song, Y., de Pamphilis, C. W., Yi, T. S., et al. (2020). Getorganelle: a fast and versatile toolkit for accurate de novo assembly of organelle genomes. Genome Biol. 21:241. doi: 10.1186/s13059-020-02154-5
Johnson, M. G., Gardner, E. M., Liu, Y., Medina, R., Goffinet, B., Shaw, A. J., et al. (2016). HybPiper: extracting coding sequence and introns for phylogenetics from high-throughput sequencing reads using target enrichment. Appl. Plant Sci. 4:1600016. doi: 10.3732/apps.1600016
Junier, T., and Zdobnov, E. M. (2010). The Newick utilities: high-throughput phylogenetic tree processing in the UNIX shell. Bioinformatics 26, 1669–1670. doi: 10.1093/bioinformatics/btq243
Kalkman, C. (2004). “Rosaceae,” in The Families and Genera of Vascular Plants. Flowering Plants–Dicotyledons: Celastrales, Oxalidales, Rosales, Cornales, Ericales, ed K. Kubitzki (Berlin: Springer), 343–386. doi: 10.1007/978-3-662-07257-8_39
Katoh, K., and Standley, D. M. (2013). MAFFT multiple sequence alignment software version 7: improvement in performance and usability. Mol. Biol. Evol. 30, 772–780. doi: 10.1093/molbev/mst010
Kearse, M., Moir, R., Wilson, A., Stones Havas, S., Cheung, M., Sturrock, S., et al. (2012). Geneious Basic: an integrated and extendable desktop software platform for the organization and analysis of sequence data. Bioinformatics 28, 1647–1649. doi: 10.1093/bioinformatics/bts199
Kim, H. T., Kim, J. S., Li, Y. M., Mun, J. H., and Kim, J. H. (2018). Molecular markers for phylogenetic applications derived from comparative plastome analysis of Prunus species. J. Syst. Evol. 57, 15–22. doi: 10.1111/jse.12453
Kim, K. J., and Lee, H. L. (2004). Complete chloroplast genome sequences from Korean Ginseng (Panax schinseng Nees) and comparative analysis of sequence evolution among 17 vascular plants. DNA Res. 11, 247–261. doi: 10.1093/dnares/11.4.247
Koehne, E. (1911). “Maddenia,” in Plantae Wilsonianae: An Enumeration of the Woody Plants Collected in Western China for the Arnold Arboretum of Harvard University During the Years 1907, 1908, and 1910, eds E. H. Wilson and C. S. Sargent (Cambridge: The University Press), 56–59.
Kress, W. J. (2017). Plant DNA barcodes: application today and in the future. J. Syst. Evol. 55, 291–307. doi: 10.1111/jse.12254
Kress, W. J., Wurdack, K. J., Zimmer, E. A., Weigt, L. A., and Janzen, D. H. (2005). Use of DNA barcodes to identify flowering plants. Proc. Natl. Acad. Sci. U. S. A. 102, 8369–8374. doi: 10.1073/pnas.0503123102
Kurtz, S., Choudhuri, J. V., Ohlebusch, E., Schleiermacher, C., Stoye, J., and Giegerich, R. (2001). REPuter: the manifold applications of repeat analysis on a genomic scale. Nucl. Acids Res. 29, 4633–4642. doi: 10.1093/nar/29.22.4633
Lanfear, R., Calcott, B., Kainer, D., Mayer, C., and Stamatakis, A. (2014). Selecting optimal partitioning schemes for phylogenomic datasets. BMC Evol. Biol. 14:82. doi: 10.1186/1471-2148-14-82
Lanfear, R., Frandsen, P. B., Wright, A. M., Senfeld, T., and Calcott, B. (2016). Partitionfinder 2: new methods for selecting partitioned models of evolution for molecular and morphological phylogenetic analyses. Mol. Biol. Evol. 34, 772–773. doi: 10.1093/molbev/msw260
Langmead, B., and Salzberg, S. L. (2012). Fast gapped-read alignment with bowtie 2. Nat. Methods 9:357. doi: 10.1038/nmeth.1923
Lee, S., and Wen, J. (2001). A phylogenetic analysis of Prunus and the Amygdaloideae (Rosaceae) using ITS sequences of nuclear ribosomal DNA. Am. J. Bot. 88, 150–160. doi: 10.2307/2657135
Li, H., and Durbin, R. (2009). Fast and accurate short read alignment with Burrows-Wheeler transform. Bioinformatics 25, 1754–1760. doi: 10.1093/bioinformatics/btp324
Li, Q. J., Su, N., Zhang, L., Tong, R. C., Zhang, X. H., Wang, J. R., et al. (2020). Chloroplast genomes elucidate diversity, phylogeny, and taxonomy of Pulsatilla (Ranunculaceae). Sci. Rep. 10:19781. doi: 10.1038/s41598-020-76699-7
Li, X. W., Yang, Y., Henry, R. J., Rossetto, M., Wang, Y. T., and Chen, S. L. (2015). Plant DNA barcoding: from gene to genome. Biol. Rev. 90, 157–166. doi: 10.1111/brv.12104
Librado, P., and Rozas, J. (2009). DnaSP v5: a software for comprehensive analysis of DNA polymorphism data. Bioinformatics 25, 1451–1452. doi: 10.1093/bioinformatics/btp187
Liu, B. B., Campbell, C. S., Hong, D. Y., and Wen, J. (2020a). Phylogenetic relationships and chloroplast capture in the Amelanchier-Malacomeles-Peraphyllum clade (Maleae, Rosaceae): evidence from chloroplast genome and nuclear ribosomal DNA data using genome skimming. Mol. Phylogenet. Evol. 147:106784. doi: 10.1016/j.ympev.2020.106784
Liu, B. B., Hong, D. Y., Zhou, S. L., Xu, C., Dong, W. P., Johnson, G., et al. (2019). Phylogenomic analyses of the Photinia complex support the recognition of a new genus Phippsiomeles and the resurrection of a redefined Stranvaesia in Maleae (Rosaceae). J. Syst. Evol. 57, 678–694. doi: 10.1111/jse.12542
Liu, B. B., Liu, G. N., Hong, D. Y., and Wen, J. (2020b). Eriobotrya belongs to Rhaphiolepis (Maleae, Rosaceae): evidence from chloroplast genome and nuclear ribosomal DNA data. Front. Plant Sci. 10:1731. doi: 10.3389/fpls.2019.01731
Liu, B. B., Ma, Z. Y., Ren, C., Hodel, R. G. J., Sun, M., Liu, X. Q., et al. (2021). Capturing single-copy nuclear genes, organellar genomes, and nuclear ribosomal DNA from deep genome skimming data for plant phylogenetics: a case study in Vitaceae. J. Syst. Evol. 59, 1124–1138 doi: 10.1111/jse.12806
Liu, H. J., He, J., Ding, C. H., Lyu, R. D., Pei, L. Y., Cheng, J., et al. (2018). Comparative analysis of complete chloroplast genomes of Anemoclema, Anemone, Pulsatilla, and Hepatica revealing structural variations among genera in tribe Anemoneae (Ranunculaceae). Front. Plant Sci. 9:1097. doi: 10.3389/fpls.2018.01097
Lohse, M., Drechsel, O., Kahlau, S., and Bock, R. (2013). OrganellarGenomeDRAW–a suite of tools for generating physical maps of plastid and mitochondrial genomes and visualizing expression data sets. Nucl. Acids Res. 41, 575–581. doi: 10.1093/nar/gkt289
Lowe, T. M., and Chen, P. P. (2016). tRNAscan-SE On-line: integrating search and context for analysis of transfer RNA genes. Nucl. Acids Res. 44, 54–57. doi: 10.1093/nar/gkw413
Lu, L. D., Gu, C. Z., Li, C. L., Alexander, C., Bartholomew, B., Brach, A. R., et al. (2003). “Rosaceae,” in Flora of China Volume 9. eds Z. Y. Wu, P. H. Raven, and D. Y. Hong (Beijing: Science Press; St. Louis, MO: Botanical Garden Press), 46–434.
Miller, M. A., Pfeiffer, W., and Schwartz, T. (2010). “Creating the CIPRES Science Gateway for inference of large phylogenetic trees,” in Proceedings of the Gateway Computing Environments Workshop (GCE). New Orleans, LA, 1–8. doi: 10.1109/GCE.2010.5676129
Minh, B. Q., Schmidt, H. A., Chernomor, O., Schrempf, D., Woodhams, M. D., Haeseler, A., et al. (2020). IQ-TREE 2: new models and efficient methods for phylogenetic inference in the genomic era. Mol. Biol. Evol. 37, 1530–1534. doi: 10.1093/molbev/msaa015
Nakamura, T., Yamada, K. D., Tomii, K., and Katoh, K. (2018). Parallelization of MAFFT for large-scalemultiple sequence alignments. Bioinformatics 34, 2490–2492. doi: 10.1093/bioinformatics/bty121
Powell, W., Morgante, M., Andre, C., McNicol, J. W., Machray, G. C., and Rafalski, J. A. (1995). Hypervariable microsatellites provide a general source of polymorphic DNA markers for the chloroplast genome. Curr. Biol. 5, 1023–1029. doi: 10.1016/S0960-9822(95)00206-5
Qu, X. J., Moore, M. J., Li, D. Z., and Yi, T. S. (2019). PGA: a software package for rapid, accurate, and flexible batch annotation of plastomes. Plant Methods 15, 1–12. doi: 10.1186/s13007-019-0435-7
Rabah, S. O., Shrestha, B., Hajrah, N. H., Sabir, M. J., Alharby, H. F., Sabir, M. J., et al. (2018). Passiflora plastome sequencing reveals widespread genomic rearrangements. J. Syst. Evol. 9999, 1–14. doi: 10.1111/jse.12425
Rehder, A. (1956). Manual of Cultivated Trees and Shrubs Hardy in North America Exclusive of the Subtropical and Warmer Temperate Regions, 2nd Edn. New York, NY: The MacMillan Company.
Ronquist, F., Teslenko, M., van der Mark, P., Ayres, D. L., Darling, A., Höhna, S., et al. (2012). MrBayes 3.2: efficient Bayesian phylogenetic inference and model choice across a large model space. Syst. Biol. 61, 539–542. doi: 10.1093/sysbio/sys029
Sanderson, M. J., Copetti, D., Búrquez, A., Bustamante, E., Charboneau, J. L., Eguiarte, L. E., et al. (2015). Exceptional reduction of the plastid genome of saguaro cactus (Carnegiea gigantea): loss of the ndh gene suite and inverted repeat. Am. J. Bot. 102, 1115–1127. doi: 10.3732/ajb.1500184
Sayyari, E., and Mirarab, S. (2016). Fast coalescent-based computation of local branch support from quartet frequencies. Mol. Biol. Evol. 33, 1654–1668. doi: 10.1093/molbev/msw079
Shi, W. T., Wen, J., and Lutz, S. S. (2013). Pollen morphology of the Maddenia clade of Prunus and its taxonomic and phylogenetic implications. J. Syst. Evol. 51, 164–183. doi: 10.1111/j.1759-6831.2012.00233.x
Shirasawa, K., Isuzugawa, K., Ikenaga, M., Saito, Y., Yamamoto, T., Hirakawa, H., et al. (2017). The genome sequence of sweet cherry (Prunus avium) for use in genomics-assisted breeding. DNA Res. 24, 499–508. doi: 10.1093/dnares/dsx020
Slater, G. S. C., and Birney, E. (2005). Automated generation of heuristics for biological sequence comparison. BMC Bioinformatics 6:31. doi: 10.1186/1471-2105-6-31
Solís-Lemus, C., and Ané, C. (2016). Inferring phylogenetic networks with maximum pseudolikelihood under incomplete lineage sorting. PLoS Genet. 12:e1005896. doi: 10.1371/journal.pgen.1005896
Solís-Lemus, C., Bastide, P., and Ané, C. (2017). PhyloNetworks: a package for phylogenetic networks. Mol. Biol. Evol. 34, 3292–3298. doi: 10.1093/molbev/msx235
Stamatakis, A. (2006). RAxML-VI-HPC: maximum likelihood-based phylogenetic analyses with thousands of taxa and mixed models. Bioinformatics 22, 2688–2690. doi: 10.1093/bioinformatics/btl446
Stamatakis, A. (2014). RaxML version 8: a tool for phylogenetic analysis and post-analysis of large phylogenies. Bioinformatics 30, 1312–1313. doi: 10.1093/bioinformatics/btu033
Sun, J. H., Wang, Y. H., Liu, Y. L., Xu, C., Yuan, Q. J., Guo, L. P., et al. (2020). Evolutionary and phylogenetic aspects of the chloroplast genome of Chaenomeles species. Sci. Rep. 10:11466. doi: 10.1038/s41598-020-67943-1
Thiel, T., Michalek, W., Varshney, R. K., and Graner, A. (2003). Exploiting EST databases for the development and characterization of gene derived SSR-markers in barley (Hordeum vulgare L). Theor. Appl. Genet. 106, 411–422. doi: 10.1007/s00122-002-1031-0
Walker, J. F., Zanis, M. J., and Emery, N. C. (2014). Comparative analysis of complete chloroplast genome sequence and inversion variation in Lasthenia burkei (Madieae, Asteraceae). Am. J. Bot. 101, 722–729. doi: 10.3732/ajb.1400049
Wang, S., Shi, C., and Gao, L. Z. (2013). Plastid genome sequence of a wild woody oil species, Prinsepia utilis, provides insights into evolutionary and mutational patterns of Rosaceae chloroplast genomes. PLoS ONE 8:e73946. doi: 10.1371/journal.pone.0073946
Wang, X., Wang, J. R., Xie, S. Y., Zhang, X. H., Chang, Z. Y., Zhao, L., et al. (2021). Floral morphogenesis of the Maddenia and Pygeum groups of Prunus (Rosaceae), with an emphasis on the perianth. J. Syst. Evol. doi: 10.1111/jse.12748. [Epub ahead of print].
Wang, Y. B., Liu, B. B., Nie, Z. L., Chen, H. F., Chen, F. J., Figlar, R. B., et al. (2020). Major clades and a revised classification of Magnolia and Magnoliaceae based on whole plastid genome sequences via genome skimming. J. Syst. Evol. 58, 673–695. doi: 10.1111/jse.12588
Wang, Y. H., Qu, X. J., Chen, S. Y., Li, D. Z., and Yi, T. S. (2017). Plastomes of Mimosoideae: structural and size variation, sequence divergence, and phylogenetic implication. Tree Genet. Genomes 13, 1–18. doi: 10.1007/s11295-017-1124-1
Wen, J., Berggren, S. T., Lee, C. H., Ickert-Bond, S., Yi, T. S., Yoo, K. O., et al. (2008). Phylogenetic inferences in Prunus (Rosaceae) using chloroplast ndhF and ribosomal ITS sequences. J. Syst. Evol. 46, 322–332. doi: 10.3724/SP.J.1002.2008.08050
Wen, J., Harris, A. J., Kalburgi, Y., Zhang, N., Xu, Y., Zheng, W., et al. (2018). Chloroplast phylogenomics of the New World grape species (Vitis, Vitaceae). J. Syst. Evol. 56, 297–308. doi: 10.1111/jse.12447
Wen, J., and Shi, W. T. (2012). Revision of the Maddenia clade of Prunus (Rosaceae). Phytokeys 11, 39–59. doi: 10.3897/phytokeys.11.2825
Xiang, Y. Z., Huang, C. H., Hu, Y., Wen, J., Li, S. S., Yi, T. S., et al. (2016). Well-resolved Rosaceae nuclear phylogeny facilitates feological time and genome duplication analyses and ancestral fruit character reconstruction. Mol. Biol. Evol. 34, 262–281. doi: 10.1093/molbev/msw242
Xu, W. Q., Losh, J., Chen, C., Li, P., Wang, R. H., Zhao, Y. P., et al. (2019). Comparative genomics of figworts (Scrophularia, Scrophulariaceae), with implications for the evolution of Scrophularia and Lamiales. J. Syst. Evol. 57, 55–65. doi: 10.1111/jse.12421
Yang, J. B., Tang, M., Li, H. T., Zhang, Z. R., and Li, D. Z. (2013). Complete chloroplast genome of the genus Cymbidium: lights into the species identification, phylogenetic implications and population genetic analyses. BMC Evol. Biol. 13:84. doi: 10.1186/1471-2148-13-84
Yü, T. T., Lu, L. T., and Ku, T. C. (1985). Taxa nova Rosacearum Sinicarum (V). Acta Phytotaxonomica Sinica 23, 209–215.
Yü, T. T., Lu, L. T., Ku, T. C., Li, C. L., and Chen, S. X. (1986). “Rosaceae (3) Prunoideae,” in Flora Reipublicae Popularis Sinicae, Vol. 38, ed T. T. Yü (Beijing: Science Press), 1–133.
Zhang, C., Rabiee, M., Sayyari, E., and Mirarab, S. (2018). ASTRAL-III: polynomial time species tree reconstruction from partially resolved gene trees. BMC Bioinform. 19:153. doi: 10.1186/s12859-018-2129-y
Zhang, N., Erickson, D. L., Ramachandran, P., Ottesen, A. R., Timme, R. E., Funk, V. A., et al. (2017). An analysis of Echinacea chloroplast genomes: implications for future botanical identification. Sci. Rep. 7:216. doi: 10.1038/s41598-017-00321-6
Zhang, N., Wen, J., and Zimmer, E. A. (2015). Congruent deep relationships in the grape family (Vitaceae) based on sequences of chloroplast genomes and mitochondrial genes via genome skimming. PLoS ONE 10 :e0144701. doi: 10.1371/journal.pone.0144701
Zhang, S. D., Jin, J. J., Chen, S. Y., Chase, M. W., Soltis, D. E., and Li, H. T. (2017). Diversification of Rosaceae since the Late Cretaceous based on plastid phylogenomics. New Phytol. 214, 1355–1367. doi: 10.1111/nph.14461
Zhang, X., Zhou, T., Kanwal, N., Zhao, Y. M., Bai, G. Q., and Zhao, G. F. (2017). Completion of eight Gynostemma BL. (Cucurbitaceae) chloroplast genomes: characterization, comparative analysis, and phylogenetic relationships. Front. Plant Sci. 8:1583. doi: 10.3389/fpls.2017.01583
Zhao, D. N., Ren, Y., and Zhang, J. Q. (2019). Conservation and innovation: plastome evolution during rapid radiation of Rhodiola on the Qinghai-Tibetan Plateau. Mol. Phylogenet. Evol. 144:106713. doi: 10.1016/j.ympev.2019.106713
Zhao, L., Jiang, X. W., Zuo, Y. J., Liu, X. L., Chin, S. W., Haberle, R., et al. (2016). Multiple events of allopolyploidy in the evolution of the racemose lineages in Prunus (Rosaceae) based on integrated evidence from nuclear and plastid data. PLoS ONE 11:e0157123. doi: 10.1371/journal.pone.0157123
Zhao, L., Potter, D., Xu, Y., Liu, P. L., Johnson, G., Chang, Z. Y., et al. (2018). Phylogeny and spatio-temporal diversification of Prunus subgenus Laurocerasus section Mesopygeum (Rosaceae) in the Malesian region. J. Syst. Evol. 56, 637–651. doi: 10.1111/jse.12467
Keywords: Maddenia, Prunus, Rosaceae, barcoding, chloroplast genome, single-copy nuclear genes, species delimitation
Citation: Su N, Liu BB, Wang JR, Tong RC, Ren C, Chang ZY, Zhao L, Potter D and Wen J (2021) On the Species Delimitation of the Maddenia Group of Prunus (Rosaceae): Evidence From Plastome and Nuclear Sequences and Morphology. Front. Plant Sci. 12:743643. doi: 10.3389/fpls.2021.743643
Received: 19 July 2021; Accepted: 06 September 2021;
Published: 11 October 2021.
Edited by:
Jim Leebens-Mack, University of Georgia, United StatesReviewed by:
Qiang Fan, Sun Yat-sen University, ChinaGregory W. Stull, Kunming Institute of Botany (CAS), China
Copyright © 2021 Su, Liu, Wang, Tong, Ren, Chang, Zhao, Potter and Wen. This is an open-access article distributed under the terms of the Creative Commons Attribution License (CC BY). The use, distribution or reproduction in other forums is permitted, provided the original author(s) and the copyright owner(s) are credited and that the original publication in this journal is cited, in accordance with accepted academic practice. No use, distribution or reproduction is permitted which does not comply with these terms.
*Correspondence: Liang Zhao, YmlvbG9neV96aGFvbGlhbmdAMTI2LmNvbQ==
†These authors have contributed equally to this work