 Huizhen Chen1,2,3†Laiyuan Zhai2,4†
 Kai Chen2†
 Congcong Shen2Shuangbing Zhu2Pingping Qu4Jie Tang3Jianping Liu3Haohua He1*
 Jianlong Xu2,4*
- 1Key Laboratory of Crop Physiology, Ecology and Genetic Breeding, Ministry of Education/College of Agronomy, Jiangxi Agricultural University, Nanchang, Jiangxi, China
- 2Shenzhen Branch, Guangdong Laboratory for Lingnan Modern Agriculture, Agricultural Genomics Institute at Shenzhen, Chinese Academy of Agricultural Sciences, Shenzhen, China
- 3Pingxiang Center for Agricultural Sciences and Technology Research, Pingxiang, Jiangxi, China
- 4The National Key Facility for Crop Gene Resources and Genetic Improvement, Institute of Crop Sciences, Chinese Academy of Agricultural Sciences, Beijing, China
Many QTL have been identified for grain appearance quality by linkage analysis (LA) in bi-parental mapping populations and by genome-wide association study (GWAS) in natural populations in rice. However, few of the well characterized genes/QTL have been successfully applied in molecular rice breeding due to genetic background (GB) and environment effects on QTL expression and deficiency of favorable alleles. In this study, GWAS and LA were performed to identify QTL for five grain appearance quality-related traits using three multi-parent advanced generation inter-cross (MAGIC) populations. A total of 22 QTL on chromosomes 1-3, 5-8 were identified by GWAS for five traits in DC1, DC2 and 8way, and four combined populations DC12 (DC1+DC2), DC18 (DC1+8way), DC28 (DC2+8way) and DC128 (DC1+DC2+8way). And a total of 42 QTL were identified on all 12 chromosomes except 10 by LA in the three single populations. Among 20 QTL identified by GWAS in DC1, DC2 and 8way, 10, four and three QTL were commonly detected in DC18, DC28, and DC128, respectively. Similarly, among 42 QTL detected by LA in the three populations, four, one and two QTL were commonly detected in DC18, DC28, and DC128, respectively. There was no QTL mapped together in DC12 by both two mapping methods, indicating that GB could greatly affect the mapping results, and it was easier to map the common QTL among populations with similar GB. The 8way population was more powerful for QTL mapping than the DC1, DC2 and various combined populations. Compared with GWAS, LA can not only identify large-effect QTL, but also identify minor-effect ones. Among 11 QTL simultaneously detected by the two methods in different GBs and environments, eight QTL corresponded to known genes, including AqGL3b and AqGLWR3a for GL and GLWR, AqGW5a, AqGLWR5, AqDEC5 and AqPGWC5 for GW, GLWR, DEC and PGWC, and AqDEC6b and AqPGWC6b for DEC and PGWC, respectively. AqGL7, AqGL3c/AqGLWR3b, AqDEC6a/AqPGWC6a, and AqPGWC7 were newly identified and their candidate genes were analyzed and inferred. It was discussed to further improve grain appearance quality through designed QTL pyramiding strategy based on the stable QTL identified in the MAGIC populations.
Introduction
Rice (Oryza sativa) is one of the most important cereal crops grown worldwide, feeding more than half of the world population. With the everlasting growth of population and development of the economy and living standards, high yield with good grain quality has becomes the prime objective of breeding (Wang et al., 2017; Murchie et al., 2009). Among grain quality, appearance quality is responsible for final rice market value. Grain appearance quality are mainly associated with grain shape, which is specified by grain length (GL), grain width (GW), the ratio of grain length to width (GLWR) and grain thickness. The slender grains with grain length-to-width ratio larger than 3 are preferred by most rice consumers from Southern China, the USA, and South and Southeast Asian countries (Gong et al., 2017). As most important component of appearance quality, chalkiness is usually evaluated by the degree of endosperm chalkiness (DEC) and the percentage of grain with chalkiness (PGWC). DEC and PGWC are easily affected by growing environment (Zhao et al., 2015; You et al., 2022).
To date, a lot of QTL affecting appearance quality of rice have been identified through linkage mapping and association study (Zhao et al., 2011; Singh et al., 2012; Zhang et al., 2013; Yang et al., 2014; Liu et al., 2015a; Qiu et al., 2015; Wang et al., 2017). Moreover, many genes associated with grain shape have been identified and cloned by linkage mapping and association study, such as GS2 (Hu et al., 2015), GS3 (Mao et al., 2010), GS5 (Li et al., 2011), GS6 (Sun et al., 2013), GS9 (Zhao et al., 2018), GW2 (Song et al., 2007), GW5 (Weng et al., 2008; Liu et al., 2017), GW8 (Wang et al., 2012), GW3 and GW6 (Guo et al., 2009), GW6a (Song et al., 2015), GIF1 (Wang et al., 2008), qSW5 (Shomura et al., 2008), qGL3 (Zhang et al., 2012), GL3.1 (Qi et al., 2012), GL7/GW7 (Wang et al., 2015a; Wang et al., 2015b), OsMAPK6 (Liu et al., 2015a), GLW7 (Si et al., 2016), and BG1 (Liu et al., 2015b). These cloned genes have provided considerable insight into the individual molecular basis of grain size and shape regulation. For grain chalkiness, only one gene, Chalk5 had been cloned (Li et al., 2014). One QTL, qPGWC-7 for PGWC was fine mapped to 44 kb region on chromosome 7 (Zhou et al., 2009), and one QTL cluster for chalkiness flanked by id4007289 and RM252 on chromosome 4 was detected by single environment analysis and joint mapping across nine environments (Zhao et al., 2016).
Genome-wide association analysis and linkage analysis (LA) are two mainstream methods for QTL mapping for complex quantitative traits. At present, most genes were cloned by linkage analysis, i.e., forward genetic cloning approach, which had the advantage of high localization accuracy. In addition, genetic populations used for LA were generally constructed by repeated hybridization and self-crossing of two or more materials. Therefore, LA involved only two or several alleles at the same locus, and parental material could only represent a small portion of the phenotypic variation associated with the species. With the development of sequencing technology, some genes related to grain weight and grain shape in rice, were excavated by genome-wide association study (GWAS) using natural germplasm populations, such as GW5 (Liu et al., 2017), OsLG3 (Yu et al., 2017) and GLW7 (Si et al., 2016). The natural germplasm populations used for association analysis were generally with extensive variation and there was no need to construct genetic segregation populations. It could simultaneously identify multiple alleles at the same locus and then applied the superior alleles directly to breeding practice. However, it was difficult to map the rare alleles as for that SNP of rare alleles were normally filtered out during GWAS.
Many QTL have been reported for yield and grain quality traits using various bi-parental and association mapping populations. However, few of the well characterized genes/QTL have been successfully used in breeding for enhanced trait performance. The main reasons are that the mapping populations used are generally separate from breeding populations, and the favourable alleles for molecular breeding can’t be easily mined in the population derived from bi-parents. Although association mapping using diversity panels can identify favourable alleles, it is difficult to directly be exploited in breeding because most of the accessions had poor performance in many important agronomic traits. As a matter of fact, multi-parent mapping populations such as multi-parent advanced generation inter-cross (MAGIC) (Cavanagh et al., 2008) and nested association mapping (NAM) (Yu et al., 2006) populations have been developed for many crops, which are considered as an ideal integration of QTL mapping and practical breeding. In view of the complementary advantages of association analysis and linkage analysis, mapping results were more reliable as for the positioning results of the two methods can be compared and verified each other. In this study, we performed LA and GWAS to detect QTL related to rice appearance quality using MAGIC populations developed by eight parents, to compare genetic background (GB) effect on QTL detection and efficacy of the two mapping approaches, and identify candidate genes for identified novel QTL. Our results will enhance the knowledge of the genetic basis of appearance quality and provide valuable information for improving appearance quality in rice breeding program.
Materials and methods
Plant materials
Eight elite indica (xian) parents, were selected based on genetic diversity to develop the three multi-parental RIL populations at the IRRI since 2008 (Meng et al., 2016). Four single crosses were made from the eight homozygous parents, denoted (A × B), (C × D), (E × F) and (G × H). Two four-way crosses were then generated from the four single crosses F1 plants, denoted (A × B) × (C × D) and (E × F) × (G × H), and advanced separately by single-seed descent (SSD) to produce two four-parental RIL populations (denoted DC1 and DC2). An eight-way cross was made by intercrossing 100 F1 plants of the four-way cross ABCD and 100 F1 plants of the four-way cross EFGH, denoted [(A × B) × (C × D)] × [(E × F) × (G × H)]. The eight-parental RIL population was produced by SSD from 1000 eight-way cross F1 plants (denoted 8way). Three multiple-parental RIL populations, including 368 lines of DC1, 374 lines of DC2 and 561 lines of 8way, were used for materials for trait investigation.
Field trial and phenotypic investigation
Field trials were conducted at Pingxiang (PX) (113.85°N, 27.6°E) of Jiangxi province and Shenzhen (SZ) (22.6°E, 114.07°N) of Guangdong province both in 2015 and 2016. The three RIL populations were planted in a randomized complete block design with two replications and 10 plants in a row for each replication. The plant spacing was 17 cm between individual plants and 20 cm within each row.
At maturity, eight uniform plants in the middle of each plot were bulk-harvested and air-dried for three months in the drying houses. Then, around 150 g seeds were dehulled in an electrical dehuller (model JLGJ45, China) and milled by a desk-top rice miller (JNMJ 6, China). All full head milled rice kernels of each accession were used to measure grain length (GL, mm), grain width (GW, mm), grain length-width ratio (GLWR), degree of endosperm chalkiness (DEC, %), percentage of grain with chalkiness (PGWC, %) using a rice grain appearance quality scanning machine (SC-E, Wanshen Technology Company, Hangzhou, China). The average trait value of each accession was used in data analyses (Supplementary Table S1).
Genotyping
Genotyping of the three MAGIC populations were reported by Meng et al. (2017). Specifically, genomic DNA for SNP genotyping was isolated from fresh leaf samples of 5-week-old seedlings using a modified cetyltrimethylammonium bromide (CTAB) method (Murray and Thompson, 1980). Genotyping was performed using a customized rice 56 K SNP array containing 56,897 SNP screened from the 3 K Rice Genome Project (3K RGP, 2014). Those SNPs with missing rate over 20% and minor allele frequency (MAF) less than 5% were removed. Finally, 28529 high-quality SNPs were selected and used for genetic diversity analysis, GWAS and linkage analysis (LA) for the three populations in this study.
Analysis of genetic diversity
A total of 28529 SNP markers were used to assess the genetic diversity of the DC1, DC2, 8-way, DC1_parents, DC2_parents, and 8way_parents by estimating minor allele frequency (MAF), expected heterozygosity (He), and polymorphism information content (PIC) using plink V1.90 (Purcell et al., 2007).
Genome-wide association study
We performed a GWAS to identify the SNPs significantly associated with all measured traits of the three single-populations (DC1, DC2 and 8way), using the selected SNPs and the mean trait values of the accessions. In order to analyze effect of genetic background (GB) on QTL mapping by GWAS and further to improve resolution of QTL mapping, we combined different single-population, including DC12 (DC1+DC2), DC18 (DC1+8way), DC28 (DC2+8way) and DC128 (DC1+DC2+8way) to expand the population size and performed GWAS using the selected SNPs and the mean trait values. In this study, the model of mixed linear (MLM), PCA + K, was used in the association analysis. And we performed GWAS by the software GAPIT (Lipka et al., 2012). After GWAS, the important SNPs affecting the measured traits were claimed when the test statistics reached P <1.0 × 10⁻⁴ in at least two environments or two traits.
Genetic linkage analysis
The linkage maps of three populations were constructed by GAPL V1.2 (Qu et al., 2020). QTL mapping of the five traits were conducted separately in DC1, DC2 and 8way by using ICIM with the PLQ function in GAPL V1.2 (Zhang et al., 2019), the scanning step was set at 0.1 cM. Probabilities of adding and removing variables in stepwise regression were set at 0.001 and 0.002, respectively. A 1000-permutation test was performed to establish a LOD threshold of 3.0 at a 95% confidence level.
Candidate gene identification for the important QTL
Based on the mapping results of GWAS and LA, the QTL simultaneously detected by the two methods were used as important QTL for searching candidate gene affecting the measured traits. Besides, stable QTL, identified at least two environment or two populations by GWAS or LA, were also used as important QTL for candidate gene analysis.
Gene-based association analysis was carried out to detect candidate genes for important QTL. The following steps were conducted to identify candidate genes for important QTL identified. We, firstly, found the SNP inside genes which located in the region of 100 kb each side of the peak SNP. The genotype manipulation was done in the same way as described above. Then, the high-quality SNPs inside of these regions were used to perform gene-based association analysis through MLM using the PCA and K. Thirdly, SNPs associated with a P-value of <0.05 were considered significant, and the genes in which the SNP was located was inferred as candidate genes affecting the measured traits. Fourthly, haplotype analysis was carried out in 731 accessions selected from the 3K (3K RGP, 2014) with grain quality data collected in Shenzhen (SZ) and Sanya (SY) in 2015 for each of the candidate genes in each important QTL region using all non-synonymous SNPs located inside of the gene CDS region. Finally, candidate genes were determined by testing the significant differences among major haplotypes (containing more than 10 samples) for each important QTL through ANOVA.
Results
Genetic diversity
The results of genetic diversity were summarized in Table 1 for the three populations (DC1, DC2 and 8way) and their parents. The average MAF of the three MAGIC populations were all greater than 0.1, suggesting the MAGIC populations had much better balance in allele frequencies. As expected, there were more polymorphic markers in the 8way population than in DC1 and DC2. The He of the 8way population was higher than the other two populations. The DC1 and DC2 had similar He and PIC, which were slightly lower than those in 8way population. The average He and PIC of the DC1 and DC2 were very similar to those of their parent populations, and those of the 8way were larger than those of 8way_parents, indicating the good quality of these three MAGIC populations.
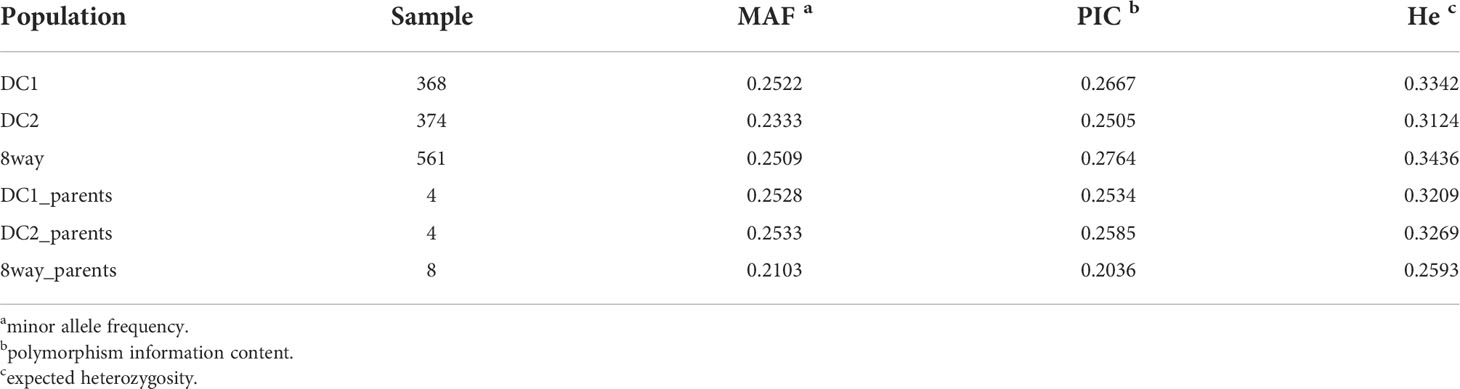
Table 1 Genetic diversity statistics of the DC1, DC2, 8way and their parental line populations.
Phenotypic variations and correlations
The rice panel used in this study showed wide variations for all the measured traits and most traits appeared to be normally distributed (Figure 1). Significant variations among different environments were observed for DEC and PGWC, but not for GL, GW and GLWR, and the three multi-parental RIL populations showed consistent performances (Figure 1), indicating DEC and PGWC were easily influenced by environment. Among them, three lines, L1352, L1422 and L1692 were selected with largest GLWR (4.18) and had higher average appearance quality with the PGWC (DEC) of 14.21% (3.58%), 17.33% (5.43%), and 11.74% (4.74%) in four environments respectively. Besides, another three lines, L1660, L1716 and L1745 were selected with lowest PGWC (<10%) and DEC (<3%) and relatively large averaged GLWR with 3.65, 3.54 and 3.96 in four environments, respectively (Supplementary Table S2).
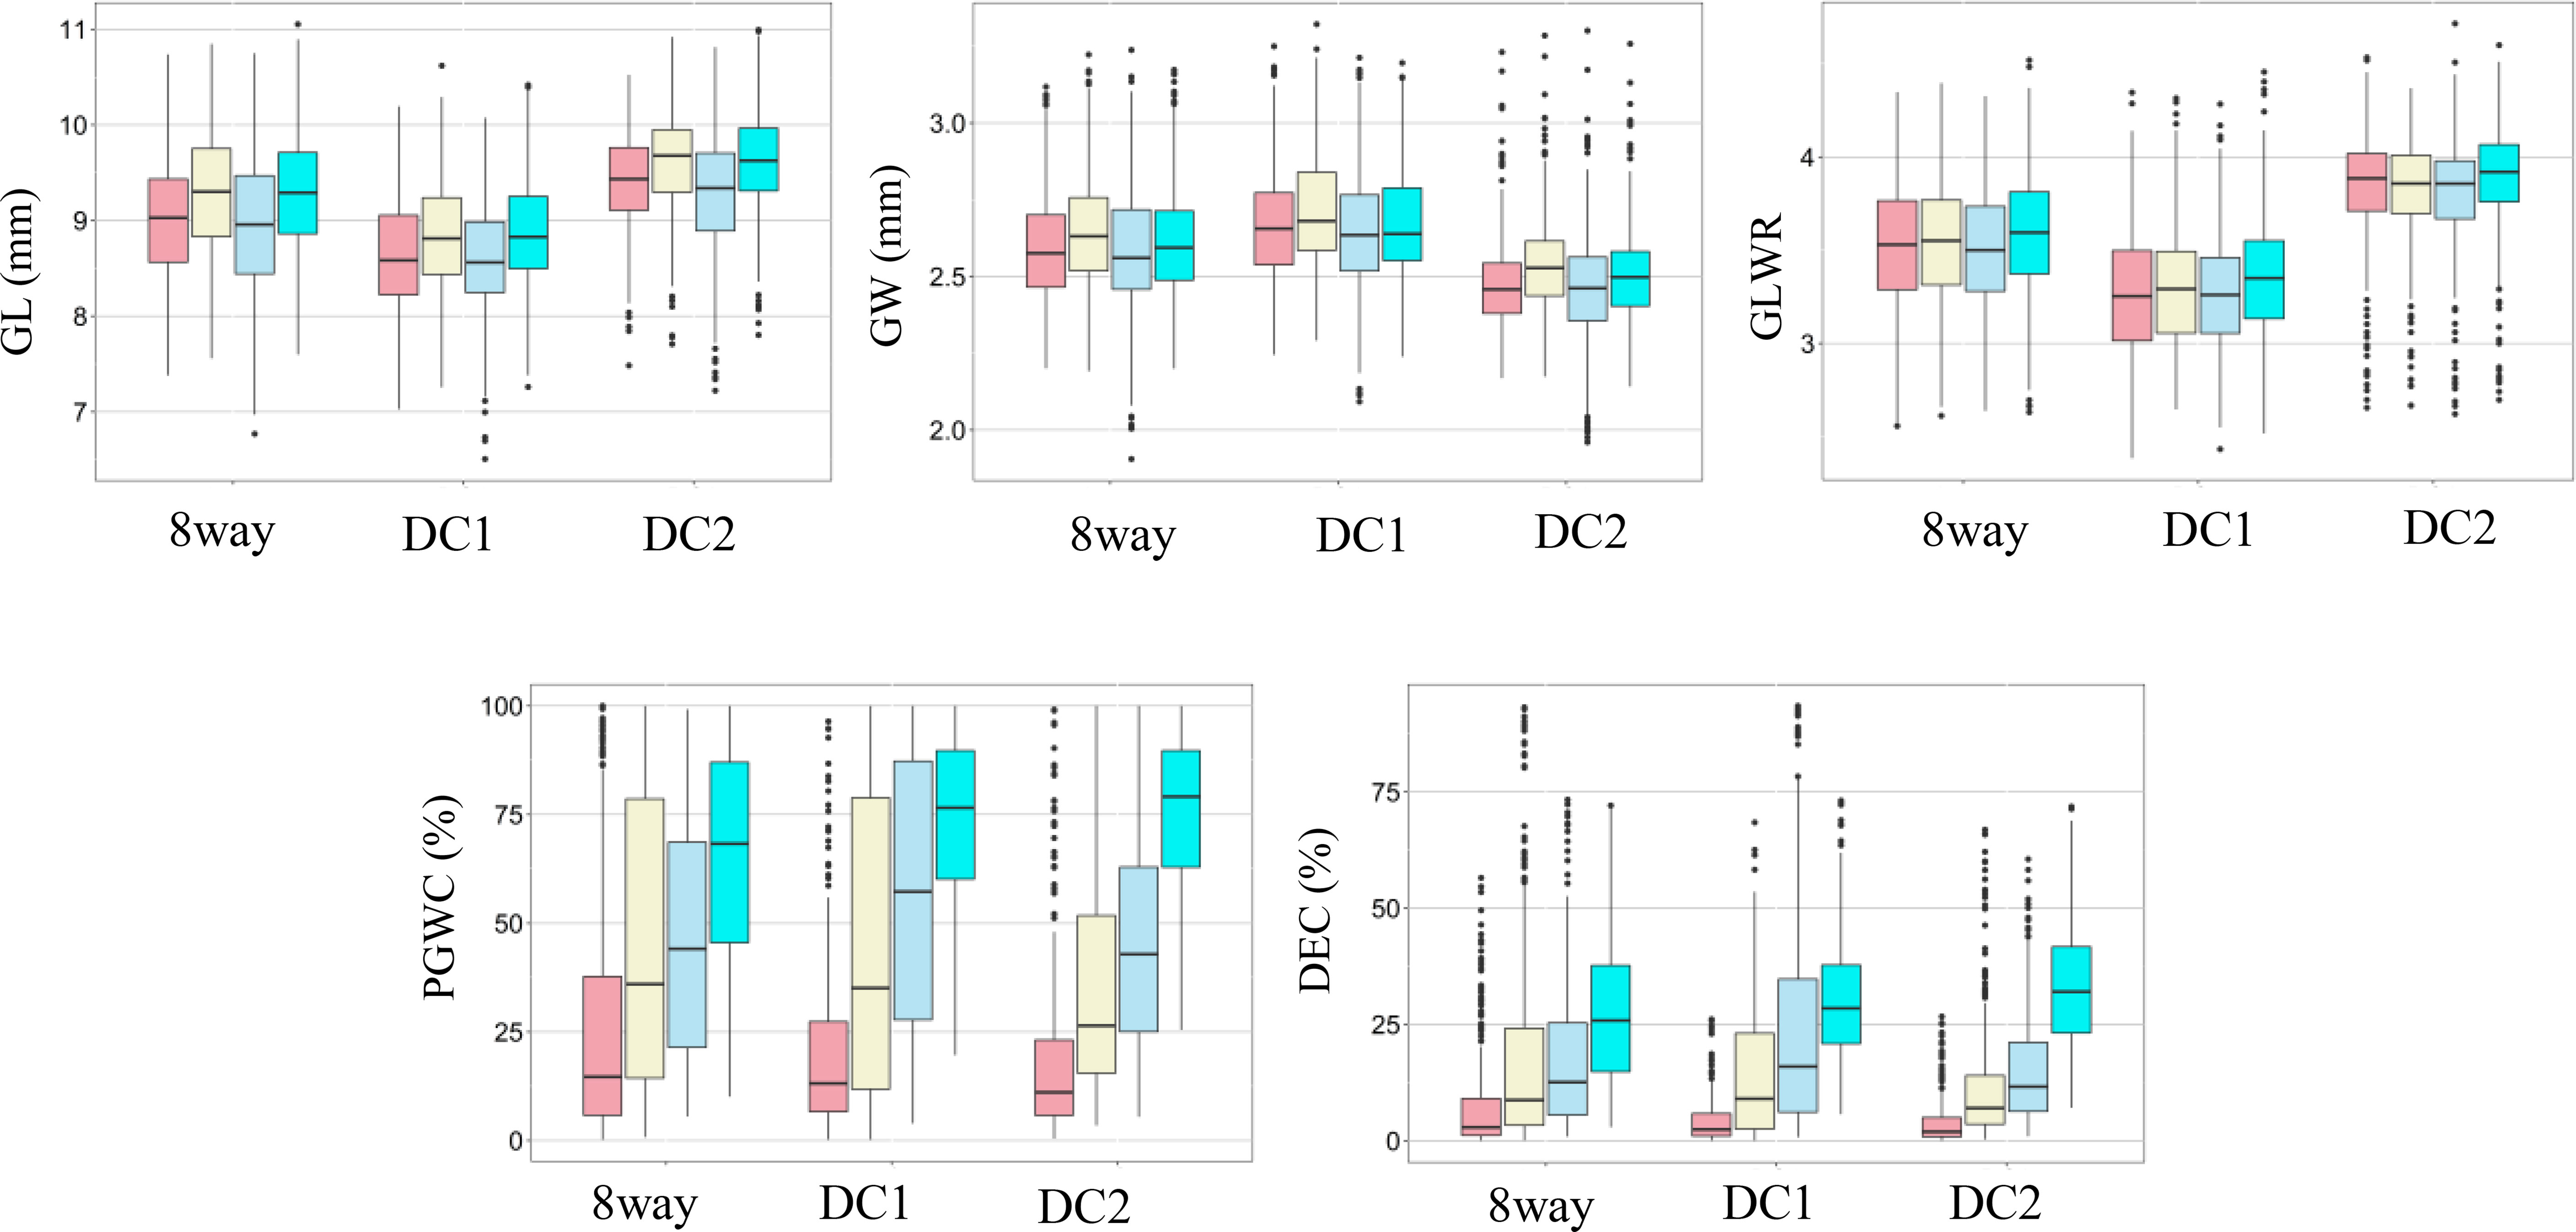
Figure 1 Box plots of five rice grain shape and appearance quality traits in two environments and years. GL, Grain length; GW, Grain width; GLWR, Grain length to width ratio; DEC, Degree of endosperm chalkiness; PGWC, Percentage of grains with chalkiness. Light pink, light yellow, light blue and cyan colors indicate 2015 in PX, 2015 in SZ, 2016 in PX and 2016 in SZ, respectively.
The phenotype pairwise correlations between the measured traits were similar in all four environments and three populations (Figure 2). As expected, GLWR showed significantly positive correlations with GL, but negative correlations with GW. Significantly positive correlations were observed between DEC and PGWC. GW showed significantly positive correlations with PGWC and DEC in all three populations in SZ. While in PX, GW only showed positive correlations with PGWC and DEC in DC1 and 8way populations in 2015. There were strong positive correlations between 2015 and 2016 for all measured traits in the three populations.
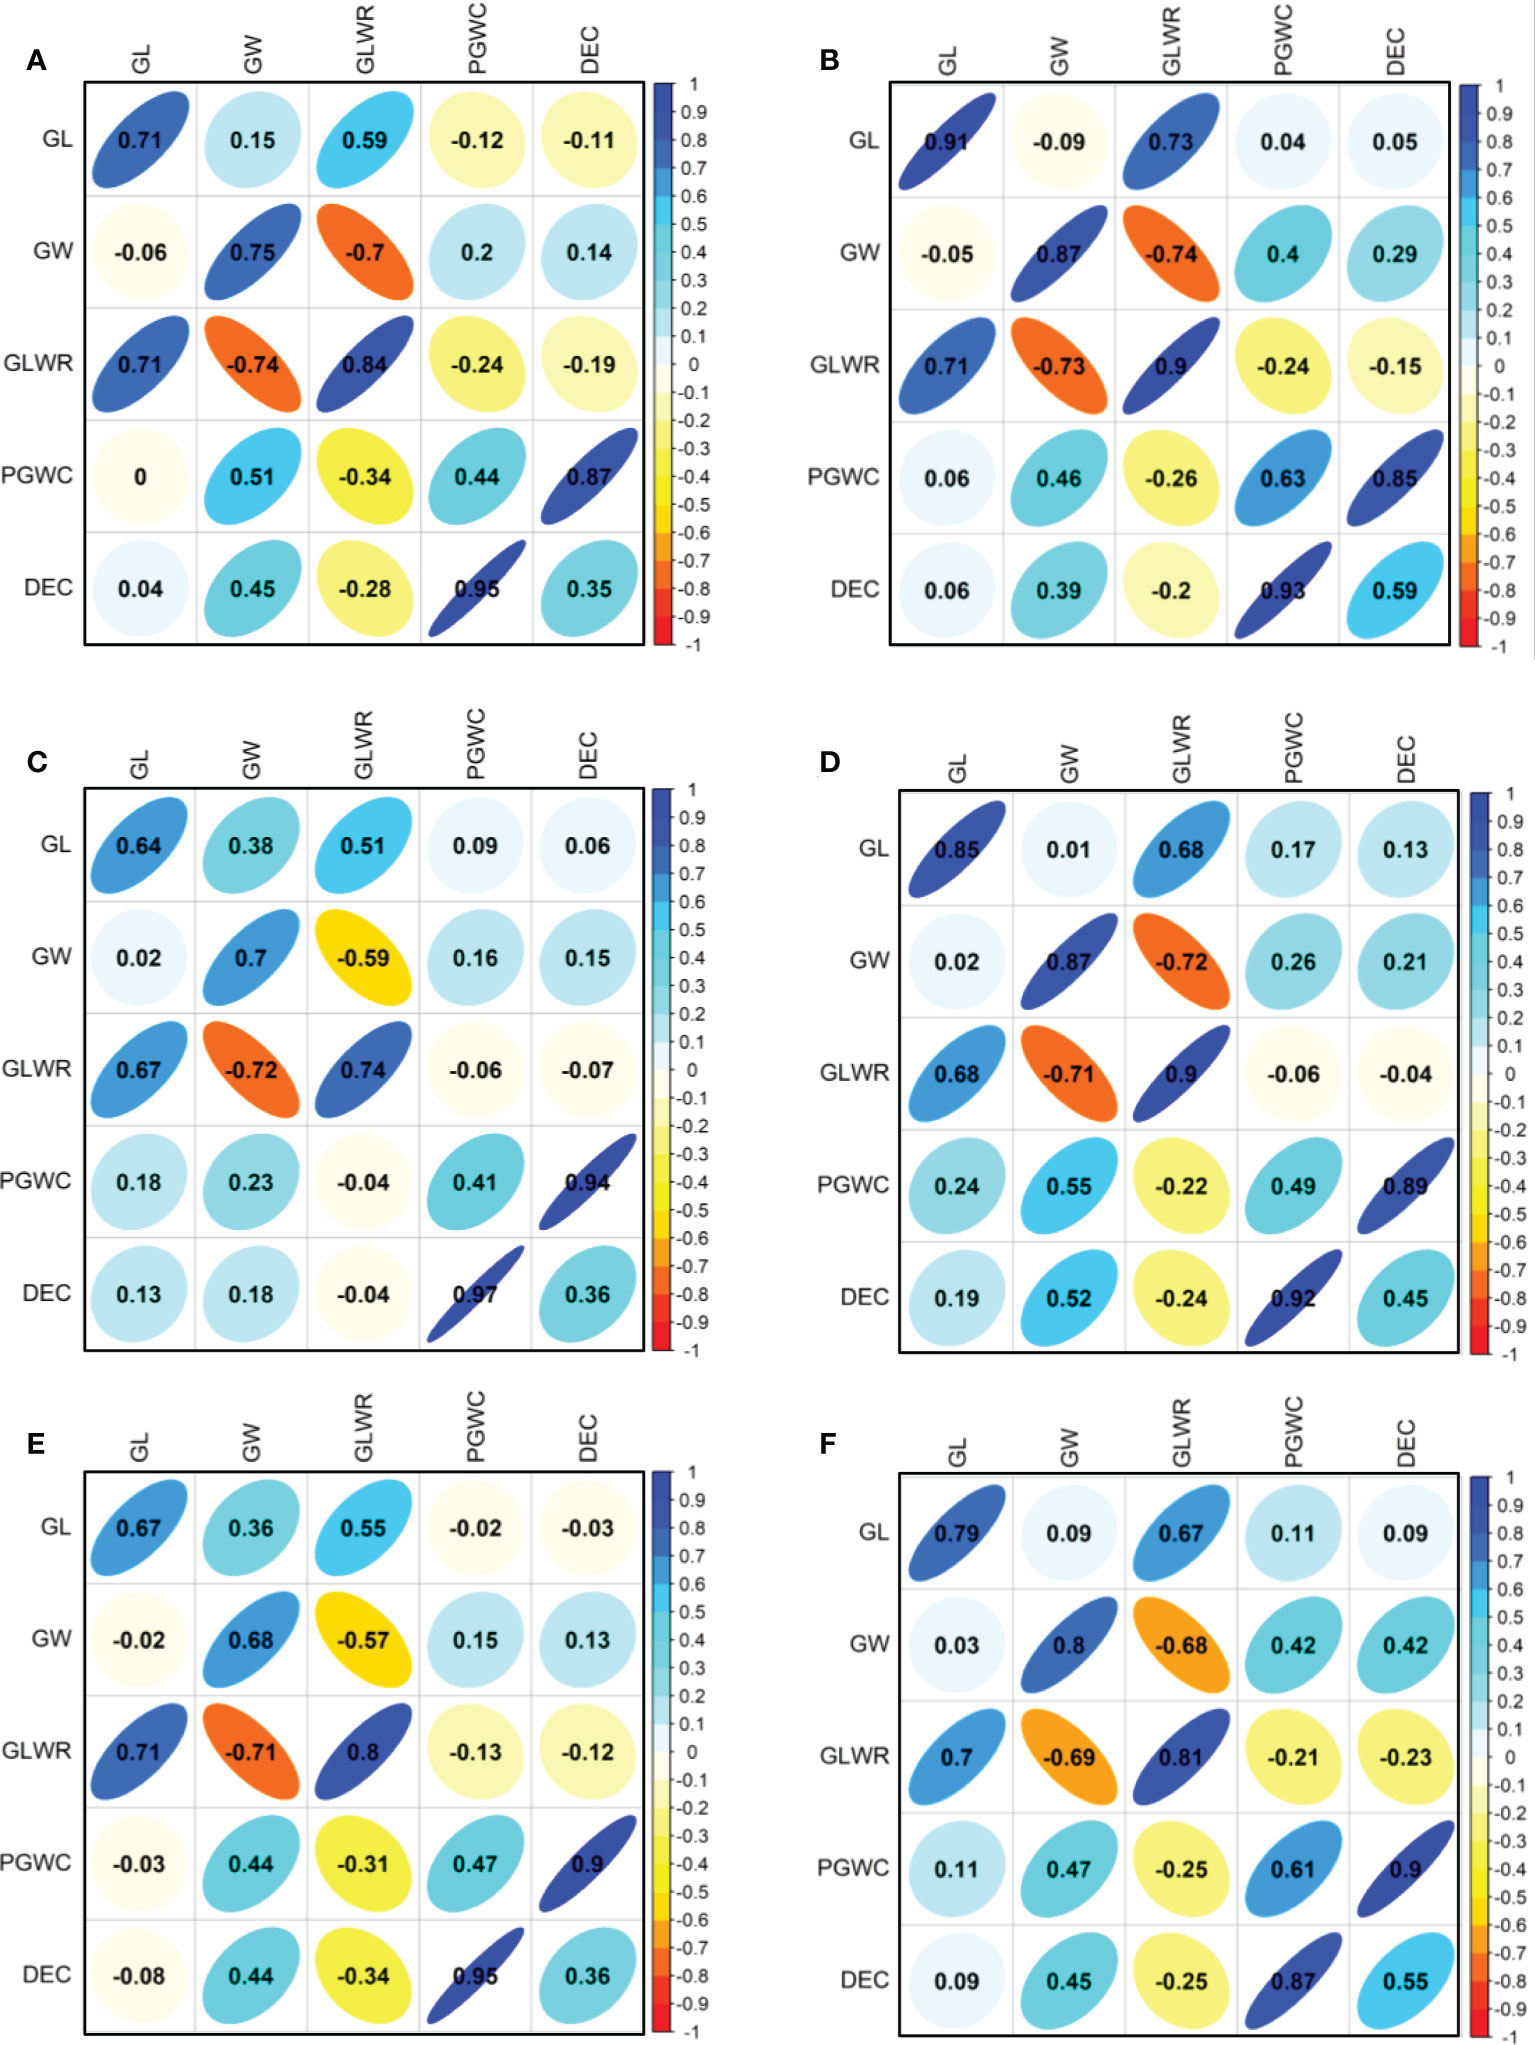
Figure 2 Correlations between five evaluated traits in 2015 (lower triangular) and 2016 (upper triangular). (A, B) Represent DC1 population in PX and SZ, respectively; (C, D) Represent DC2 population in PX and SZ, respectively; (E, F) Represent 8way population in PX and SZ, respectively. The values on principal diagonal indicated correlations between 2015 and 2016. The values were correlation coefficients (r). The areas and colors of ellipses showed the absolute value of corresponding r. Right and left oblique ellipses indicated positive and negative correlations, respectively.
QTL detection by GWAS
Basic statistics of markers
Total of 28529 SNPs was used in each of the three RIL populations (DC1, DC2 and 8way) in this study. The whole-genome size was 374.82 Mb with the average spacing 13.14 kb between two adjacent SNPs in each population. The size of chromosome varied from 22.69 Mb for chromosome 9 to 43.95 Mb for chromosome 1 and the average marker spacing ranged from 11.36 kb for chromosome 1 to 16.37 kb for chromosome 12 (Table 2).
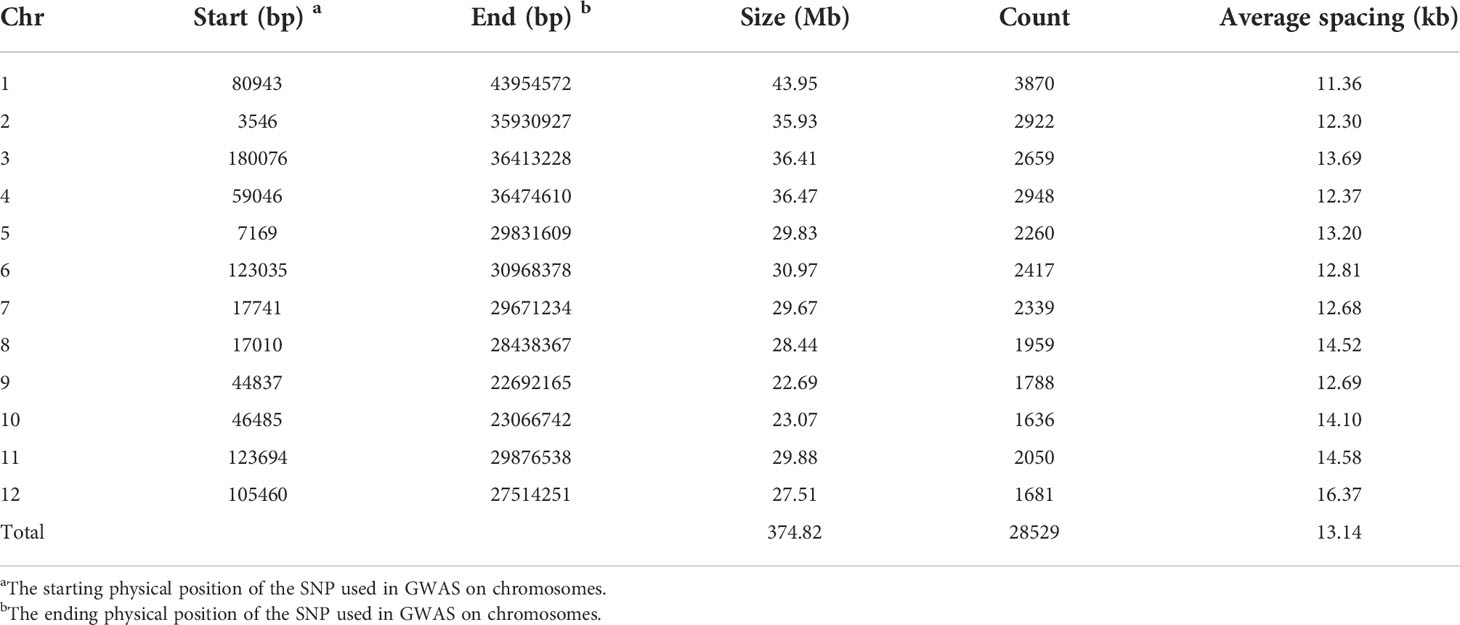
Table 2 Distributions of markers used in GWAS on chromosomes.
Population structure
There was no obvious clustering based on the principal component analysis and kinship analysis, suggesting that only one group or no obvious population structure in the all three populations (Figure 3), which might be due to random recombination in the segregation generations during establishment of population.
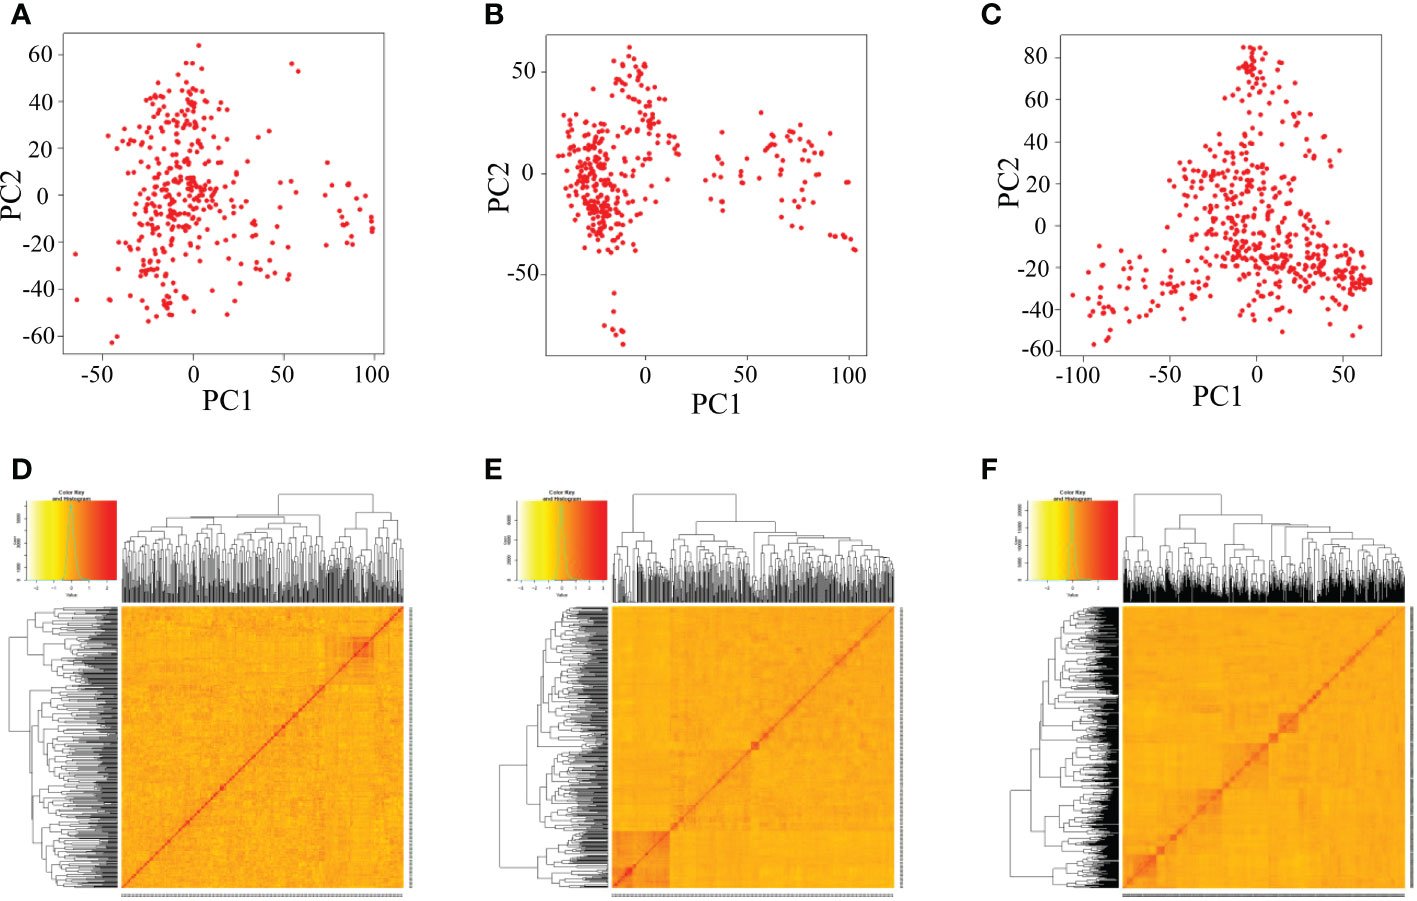
Figure 3 Analysis of the population structure of three populations by GAPIT. (A–C) Indicate the PCA plots of DC1, DC2 and 8way, respectively; (D–F) indicate the kinship matrix of DC1, DC2 and 8way, respectively.
QTL identified by GWAS
A total of 22 QTL for five traits were identified in the three single populations (DC1, DC2 and 8way) and four combined populations (DC12, DC18, DC28 and DC128), ranging from three QTL for GLWR to six QTL for DEC (Supplementary Table S3). Among them, 15 QTL were detected in at least two populations and three QTL (AqGL3b, AqGLWR3a, AqPGWC6b) were detected in the all seven populations.
For GL, four QTL were detected on chromosomes 3 and 7 (Supplementary Table S3). Among them, AqGL3a was only detected on chromosomes 3 in single population DC2. AqGL3b was detected on chromosomes 3 in the three single populations (DC1, DC2 and 8way) and four combined populations (DC12, DC18, DC28 and DC128). AqGL3c was detected on chromosomes 3 in all populations except for DC2. AqGL7 was mapped on chromosomes 7 in populations DC2, DC28 and DC128.
Four QTL for GW were detected on chromosomes 1, 2, and 5 (Supplementary Table S3). AqGW1 and AqGW2 were detected in 8way and DC128, respectively. AqGW5a was detected on chromosome 5 in the all populations except for DC2. AqGW5b was detected on chromosome 5 in DC2 and 8way.
Three QTL for GLWR were detected on chromosomes 3 and 5 (Supplementary Table S3). AqGLWR3a was detected on chromosome 3 in the all seven populations. AqGLWR3b was detected on chromosome 3 in the all populations except for DC2 and DC12. AqGLWR5 was detected on chromosome 5 in the all populations except for DC2.
For DEC, a total of six QTL were detected on chromosomes 2, 5, 6 and 8 (Supplementary Table S3). Among them, AqDEC2, AqDEC6c and AqDEC8 were only detected in DC1, DC1 and DC2, respectively. AqDEC5 was detected on chromosomes 5 in the all populations except for DC2. AqDEC6a was detected on chromosomes 6 in populations 8way, DC12 and DC28. AqDEC6b was detected on chromosomes 6 in all populations except for DC2.
For PGWC, five QTL were mapped on chromosomes 5, 6, 7 and 8 (Supplementary Table S3). Among them, AqPGWC8 was only detected in DC2. AqPGWC5 was detected on chromosome 5 in all populations except for DC2. AqPGWC6a and AqPGWC7 were detected in 8way and DC28, and DC28 and DC128, respectively. AqPGWC6b was detected on chromosomes 6 in all three single and four combined populations.
QTL analysis by genetic linkage maps
In order to compare QTL mapping by GWAS, QTL mapping of the five traits were conducted separately in DC1, DC2 and 8way by using ICIM with the PLQ function in GAPL V1.2. A total of 42 QTL were detected in the three populations, including 16, 19 and 16 QTL in DC1, DC2 and 8way, respectively (Supplementary Table S4).
A total of 16 QTL for the five traits were detected on chromosomes 1, 3, 4, 5, 6, 8, 9 and 11 in DC1 in four environments, including four QTL for GL, two for GW, five for GLWR, two for DEC and three for PGWC (Supplementary Table S4). Among them, GqGL3a and GqGLWR3b were mapped together on chromosome 3 in all four environments, and explained the average phenotypic variances of 19.66% and 10.07%, respectively. GqGW5a, GqGLWR5, GqDEC5a, and GqPGWC5a were identified in the same region on chromosome 5 at least three environments, and explained the average phenotypic variances of 34.07%, 21.06%, 6.70%, and 11.87%, respectively. GqDEC6 and GqPGWC6 were mapped together on chromosome 6 with average PVE of 7.14% and 15.95%, respectively. GqGL1a and GqGLWR9 were detected for GL and GLWR under three environments, and averagely accounted for phenotypic variances of 4.29% and 4.03%, respectively.
A total of 19 QTL were detected in DC2 on all chromosomes except 5, 6 and 10, including three for GW and four for each of GW, GLWR, DEC and PGWC (Supplementary Table S4). GqGL3a, GqGW2b, GqGLWR3b and GqPGWC1a were detected in all four environments with the average phenotypic variances of 10.00%, 5.43%, 6.00%, and 4.23%, respectively. Moreover, GqGL3a and GqGLWR3b were simultaneously identified on chromosome 3. GqGL2a, GqGLWR4 and GqDEC12 were detected in three environments with the average phenotypic variances of 7.48%, 5.12%, and 3.95%, respectively. Moreover, GqGW8 and GqGLWR8 were mapped together on chromosome 8 in three environments with average phenotypic variances of 6.59% and 11.70%, respectively.
In 8way, a total of 16 QTL were identified on chromosomes from 1 to 6, including three for GL, one for GW, five for GLWR, three for DEC and four for PGWC (Supplementary Table S4). Specifically, GqGL3a was only identified for GL in all four environments with average phenotypic variance of 6.00%. GqGL3b and GqGLWR3b were identified for GL and GLWR in three environments with average phenotypic variances of 6.93% and 4.43%, respectively. In addition, GqGL1b and GqGLWR1, GqGL3b and GqGLWR3c, GqGW5 and GqGLWR5, GqDEC5b and GqPGWC5c, GqDEC5c and GqPGWC5b, and GqDEC6 and GqPGWC6 were mapped together on chromosomes 1, 3, 5, 5, 5, 6, respectively.
Effect of GB and population size on QTL mapping
Among 20 QTL identified for five traits by GWAS in DC1, DC2 and 8way, 10 QTL (AqGL3b, AqGLWR3a, AqPGWC6b, AqDEC5, AqDEC6b, AqGL3c, AqGLWR3b, AqGLWR5, AqGW5a and AqPGWC5) were detected both in DC1 and 8way, four QTL (AqGL3b, AqGLWR3a, AqPGWC6b and AqGW5b) were detected both in DC2 and 8way, and three QTL (AqGL3b, AqGLWR3a and AqPGWC6b) were detected in all the three single populations (DC1, DC2 and 8way), but no QTL was mapped together in DC1 and DC2. These mainly resulted from different GB in different populations. The GB of DC1 and DC2 was partially the same as that of 8way, while that of DC1 and DC2 were completely different. These results indicated that GB could affect the mapping results, and it was easier to map the common QTL in similar GB.
Among 42 QTL detected for the five traits by LA in the three populations, GqGL3a and GqGLWR3b were detected in DC1, DC2 and 8way, four QTL (GqDEC6, GqGLWR5, GqGW5a and GqPGWC6) were detected both in DC1 and 8way, and GqGLWR4 was only detected in both DC2 and 8way. There was no QTL simultaneously detected both in DC1 and DC2. These results confirmed that GB could affect the mapping results as indicated by GWAS.
In order to further reveal the effect of population size on mapping results, we combined different single populations to expand the population size and performed GWAS for the five traits using the same set of SNPs and the mean trait values. A total of 10, 10, 14, and 13 QTL were identified in DC12, DC18, DC28 and DC128, respectively. The number of QTL mapped in the single population was comparable to those mapped in the merged populations. And the QTL intervals were similar for those QTL commonly detected in single and combined populations. It was indicated that GWAS can’t obviously improve mapping results using the merged populations which were derived from relative larger single cross populations.
Candidate gene analysis of important QTL
QTL simultaneously detected by GWAS and LA, including AqGL3b, AqGL3c, AqGL7, AqGW5a, AqGLWR3a, AqGLWR3b, AqGLWR5, AqDEC5, AqPGWC5, AqDEC6b, and AqPGWC6b could be used as important QTL for excavating candidate genes associated with rice appearance quality. Besides, AqDEC6a, AqPGWC6a and AqPGWC7 stably detected in different environments and populations by GWAS were also included in candidate gene analysis. Among the important QTL, AqGL3b and AqGLWR3a were coincided with cloned gene GS3 for grain size in rice (Mao et al., 2010). The QTL cluster (AqGW5a, AqGLWR5, AqDEC5 and AqPGWC5) was coincided with the cloned gene GW5 (Weng et al., 2008). Two QTL (AqDEC6b and AqPGWC6b) were coincided with the cloned gene GS6 (Sun et al., 2013). So, AqGL3c/AqGLWR3b, AqDEC6a/AqPGWC6a, AqGL7, and AqPGWC7 were considered as newly identified QTL for rice appearance quality in this study, and would be used for further candidate gene analysis and favourable gene mining.
Gene-based association analysis of AqGL3c/AqGLWR3b for two traits (GL and GLWR) were conducted in combined-population DC128 through MLM using the PCA and K. A total of four significant SNPs was identified within the region from 21.35 Mb to 21.80 Mb on chromosome 3, and these significant SNPs fell on four genes (Os03g0586300, Os03g0586700, Os03g0588100 and Os03g0588800) (Figure 4). Haplotype analysis indicated that all the four genes showed significant differences in GL and GLWR among haplotypes in 3K, suggesting the four genes could be candidate genes for GL and GLWR.
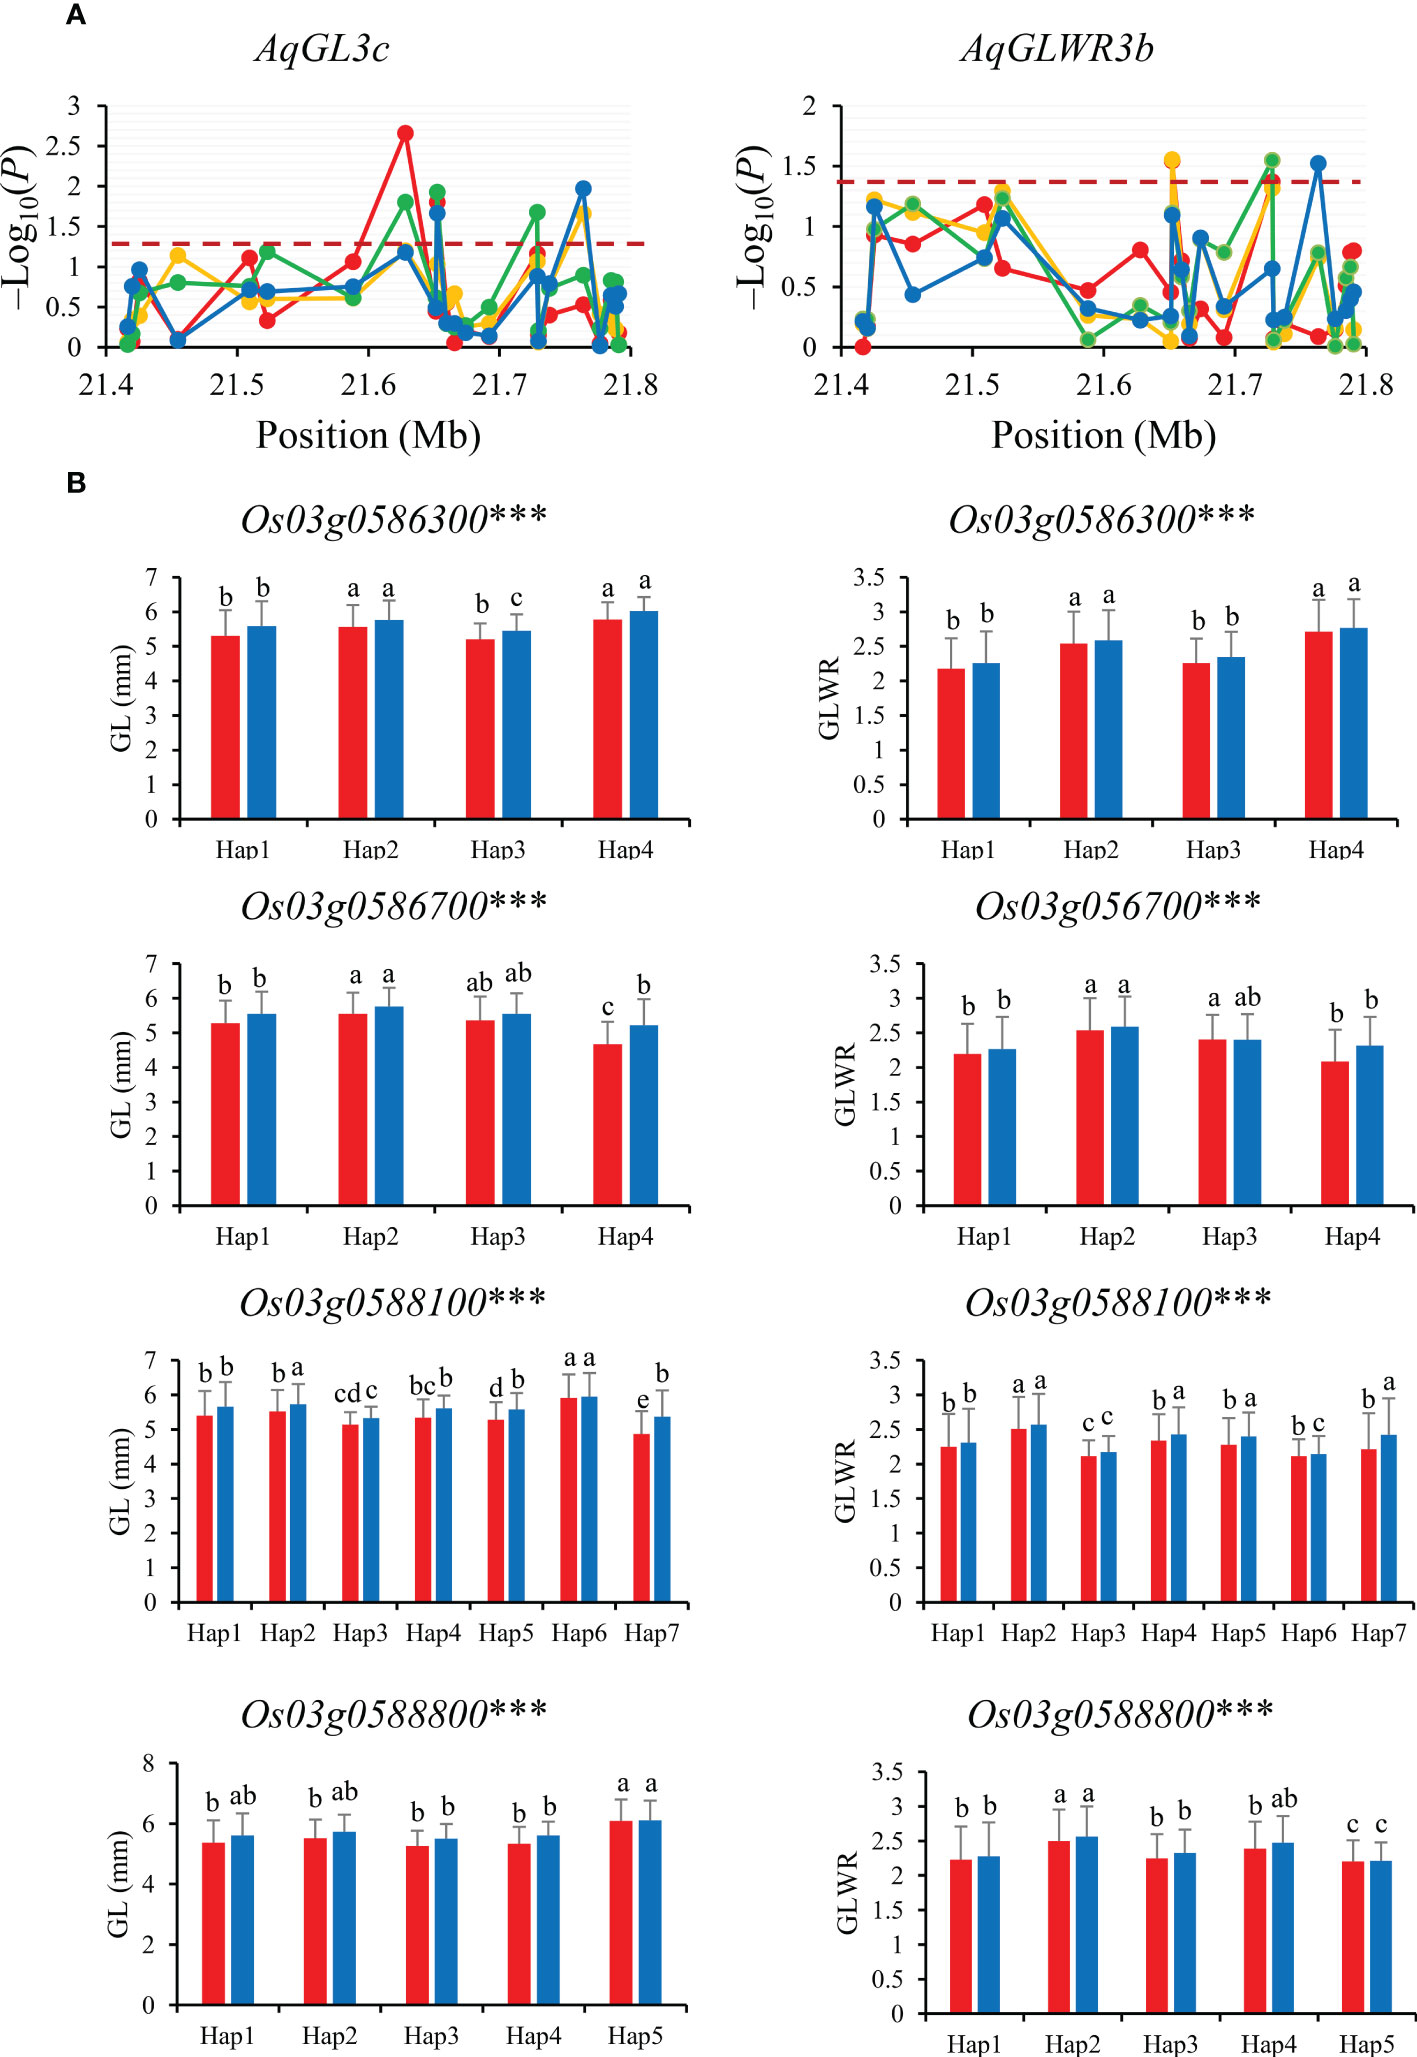
Figure 4 Gene-based association analysis (A) and haplotypes analysis of candidate genes (B) of AqGL3c/AqGLWR3b. Dash line showed the threshold to determine significant SNP. The *** suggested significance of ANOVA at p < 0.001. The letter on histogram (A–E) indicated multiple comparisons result at the significant level 0.05. Red, orange, green and blue color of lines indicated 15_PX, 16_PX, 15_SZ and 16_SZ environments, respectively. The red and blue color of the histogram indicated SY and SZ in 2015, respectively.
Similarly, gene-based association analysis of AqGL7 for GL was conducted in combined-population DC128 through MLM using the PCA and K. Total of seven significant SNPs were tested and six candidate genes (Os07g0666600, Os07g0666900, Os07g0668300, Os07g0670300, Os07g0670701 and Os07g0671700) were identified based on the significant SNPs (Figure 5). Of them, only four genes (Os07g0666600, Os07g0666900, Os07g0670300, and Os07g0671700) showed significant differences in GL among different haplotypes in 3K, and were inferred as candidate genes for GL.
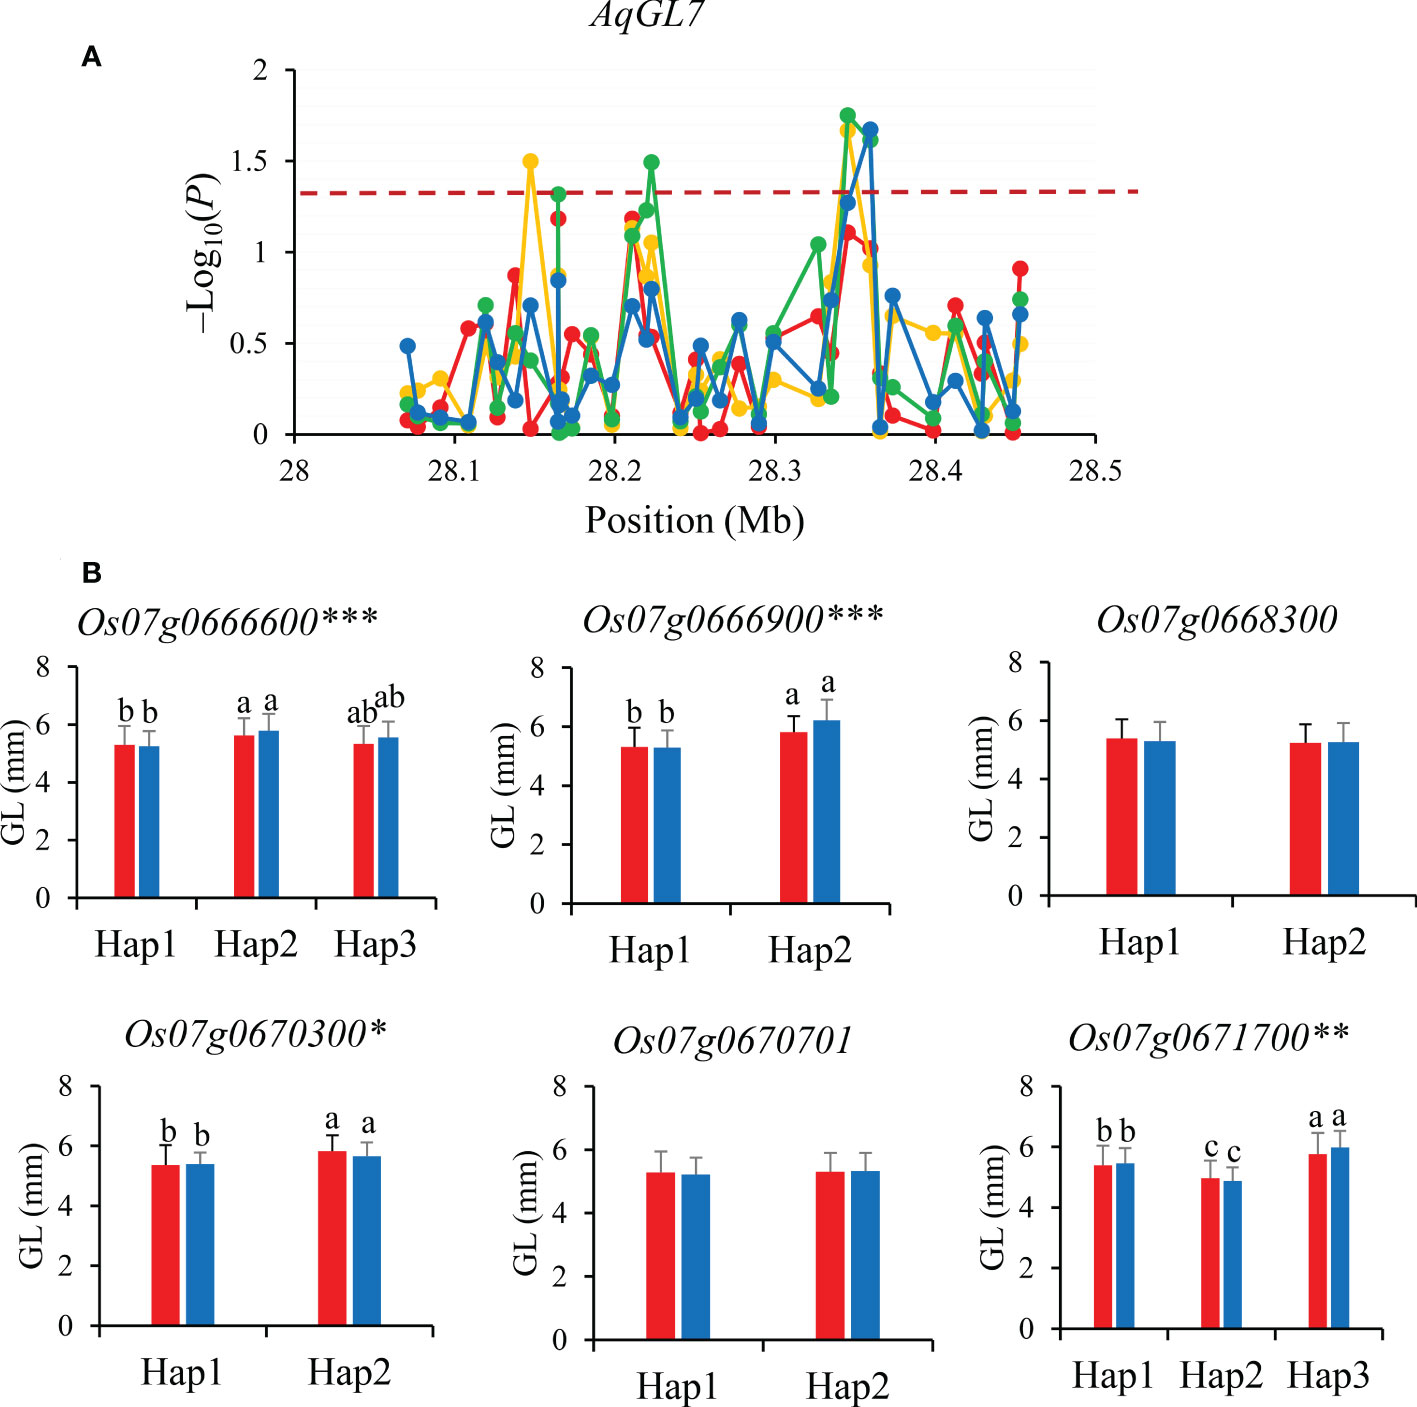
Figure 5 Gene-based association analysis (A) and haplotypes analysis of candidate genes (B) of AqGL7. Dash line showed the threshold to determine significant SNP. The *, ** and *** suggested significance of ANOVA at p < 0.05, p < 0.01 and p < 0.001, respectively. The letter on histogram (a, b and c) indicated multiple comparisons result at the significant level 0.05. Red, orange, green and blue color of lines indicated 15_PX, 16_PX, 15_SZ and 16_SZ environments, respectively. The red and blue color of the histogram indicated SY and SZ in 2015, respectively.
AqDEC6a and AqPGWC6a were mapped in 0−0.68 Mb for DEC and PGWC on chromosomes 6. A total of nine significant SNPs for DEC and seven significant SNPs for PGWC were identified within this region and four of them were significantly associated with both DEC and PGWC (Figure 6A). Then, the 12 genes (Os06g0102300, Os06g0103500, Os06g0103800, Os06g0104900, Os06g0105400, Os06g0105800, Os06g0107750, Os06g0111400, Os06g0111800, Os06g0102600, Os06g0103600 and Os06g0107432) were performed haplotype analysis to detected the candidate genes affecting DEC and PGWC in 8way. Among them, six genes (Os06g0102300, Os06g0103500, Os06g0103800, Os06g0105400, Os06g0111800 and Os06g0103600) showed significant differences in both DEC and PGWC among different haplotypes in 3K, thus they could be inferred as candidate genes for DEC and PGWC (Figure 6B).
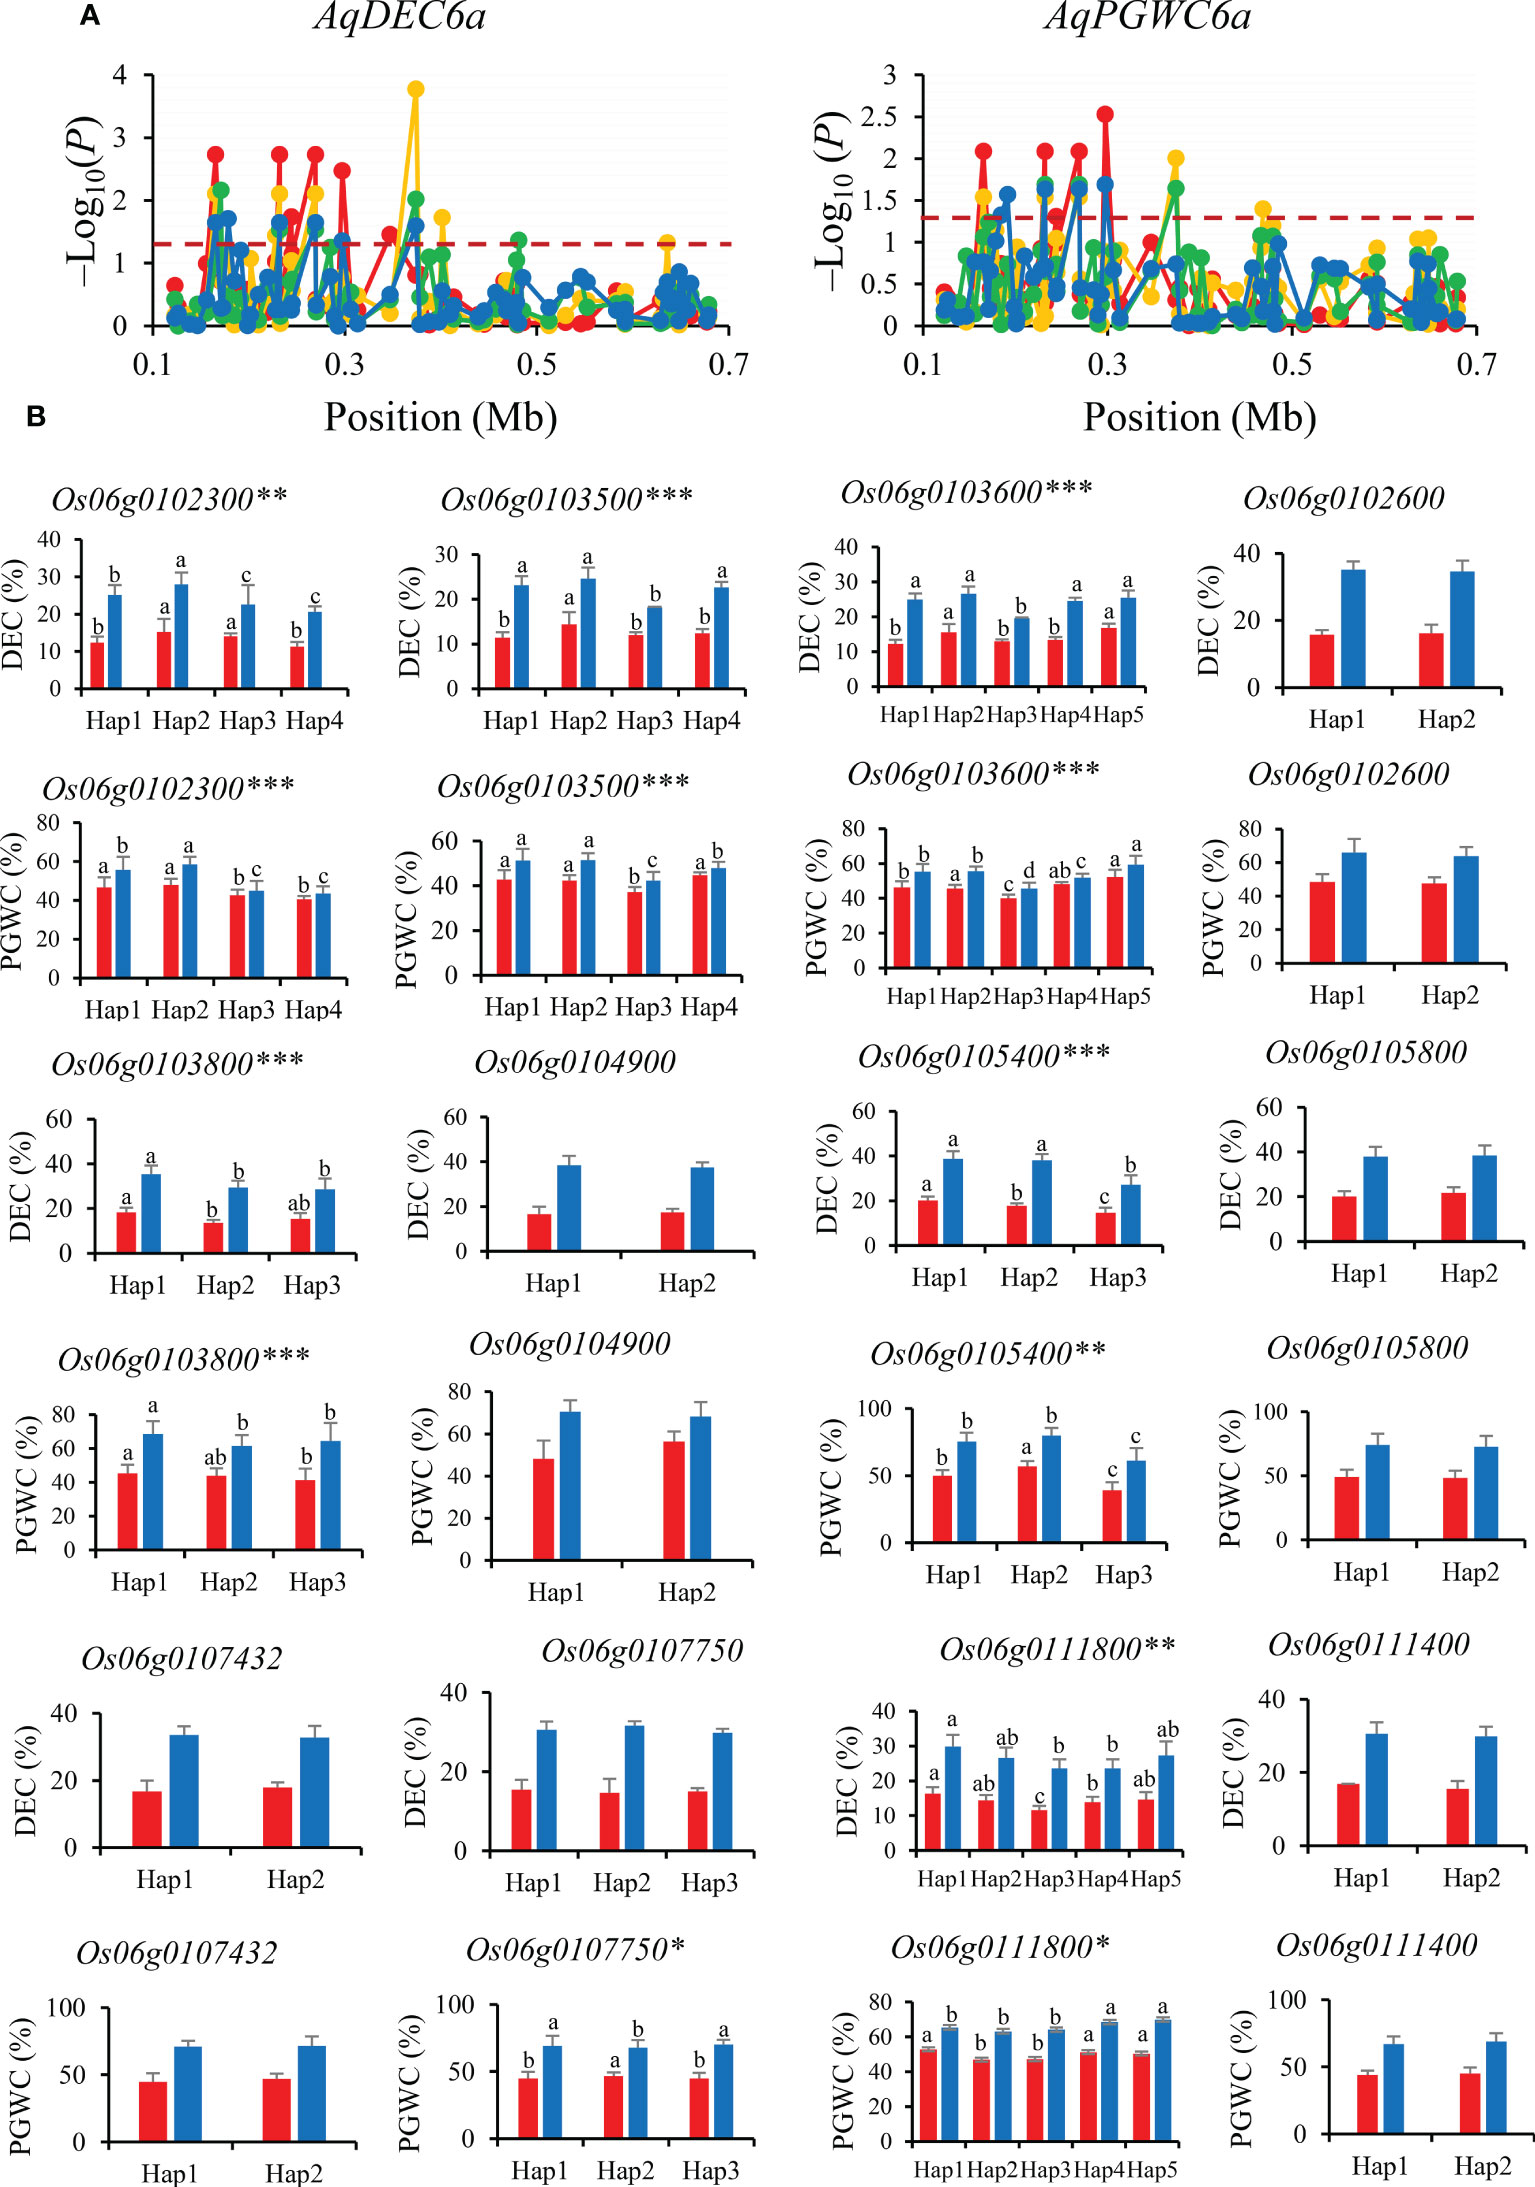
Figure 6 Gene-based association analysis (A) and haplotypes analysis of candidate genes (B) of AqDEC6a/AqPGWC6a. Dash line showed the threshold to determine significant SNP. The *, ** and *** suggested significance of ANOVA at p < 0.05, p < 0.01 and p < 0.001, respectively. The letter on histogram (A–D) indicated multiple comparisons result at the significant level 0.05. Red, orange, green and blue color of lines indicated 15_PX, 16_PX, 15_SZ and 16_SZ environments, respectively. The red and blue color of the histogram indicated SY and SZ in 2015, respectively.
For AqPGWC7, however, there was no differences among different haplotypes for PGWC through gene-based association and haplotype analyses.
Discussion
Phenotypic variation of appearance quality of rice in MAGIC populations
In general, grain appearance was mainly determined by grain shape (GL, GW and GLWR) and chalkiness (DEC and PGWC). These traits showed extensive genetic variation and varied according to MAGIC populations (DC1, DC2 and 8way) with different GBs, suggesting that phenotypic variation largely depended on the parents and their recombination in MAGIC populations. Rice grain type has high heritability and was mainly affected by genotype (Zhao et al., 2022). However, chalkiness was caused by the deposition of starch and storage proteins in the endosperm, which was controlled by a complex genetic mechanism and sensitive to environment (Ishimaru et al., 2020; Liu et al., 2022). In this study, grain shape (GL, GW and GLWR) showed consistent performances across the four environments (15_PX, 15_SZ, 16_PX and 16_SZ), while appearance quality traits (DEC and PGWC) showed great differences according to environments. These results were consistent with previous studies (Ishimaru et al., 2020; Liu et al., 2022; Zhao et al., 2022).
Based on correlation analysis between different traits, DEC and PGWC showed consistently significantly positive correlations with GW but no significant correlation with GL (Figure 2), suggesting that there was no inevitable effect of GL on chalkiness (Zhao et al., 2022). QTL mapping for grain shape-related traits or chalkiness was often delimited to the same QTL cluster (Gong et al., 2017), suggesting that there might be a close relationship between grain shape and chalkiness (Zhao et al., 2016). In our study, AqGW2 and AqGW5a for GW were mapped in the same regions with AqDEC2 for DEC in the region of 31.39−32.20 Mb on chromosome 2, and AqDEC5 for DEC and AqPGWC5 for PGWC5 in the region of 5.16−5.56 Mb on chromosome 5, respectively, while there was no any QTL for GL mapped together with that for DEC and PGWC. These results suggested that chalkiness could be ameliorated by regulating GW.
Comparisons of QTL detected in this study with previously reported cloned genes
Among the 22 QTL associated with the five grain appearance quality-related traits detected by GWAS, 10 QTL covered or were adjacent to previously reported cloned genes in rice (Supplementary Table S3). For example, AqGL3b for GL and AqGLWR3a for GLWR, which was detected in the region of 16.47–17.24 Mb on chromosome 3 in all seven populations except for 8way, were mapped together with the previously reported gene GS3 for grain length and weight (Mao et al., 2010). AqDEC6b influencing DEC in the region 1.50–2.19 Mb and AqPGWC6b influencing PGWC in the region 1.54–2.19 Mb on chromosome 6 were co-located with GS6, a gene increasing grain width and weight significantly by a premature stop at the t348 position in the coding sequence (CDS) (Sun et al., 2013). The QTL cluster in the region of 5.16−5.62 Mb on chromosome 5, including AqGW5a, AqGLWR5, AqDEC5 and AqPGWC5, was co-located with the previously reported gene GW5, which significantly affected grain width and weight of rice (Liu et al., 2017). AqGW2 for GW and AqDEC2 for DEC mapped in the region of 31.39−32.20 Mb on chromosome 2 in DC128 and DC1, respectively, were co-located with qTGW2 regulating grain width and weight by natural variation in the promoter (Ruan et al., 2020).
Among the 43 QTL associated with the five grain appearance quality-related traits detected by LA, eight QTL covered or were adjacent to previously reported cloned genes in rice (Supplementary Table S4). GqGL3a for GL and GqGLWR3b for GLWR detected in the region of 14.22−17.94 Mb on chromosomes 3 were co-located with GS3 (Mao et al., 2010). GqGW5a, GqGLWR5, GqDEC5a and GqPGWC5a for multiple grain shape and appearance traits detected in the region of 0.59−1.68 Mb on chromosome 5 were mapped together with the previously reported gene GW5 (Liu et al., 2017). GqDEC6 for DEC and GqPGWC6 for PGWC detected in 0.59−1.69 Mb on chromosome 6 were co-located with the previously cloned gene GS6 (Sun et al., 2013). Allelic correspondences of the above QTL influencing the grain appearance quality-related traits identified in this study with previously reported genes will need to be further verified by fine mapping and QTL cloning.
Influence of GB and population size on QTL mapping
GB had strong effect on QTL mapping of complex quantitative traits (Moncada et al., 2001; Septiningsih et al., 2003; Xie et al., 2006), even in reciprocal introgression line populations which were derived from two parents and shared partial common genome (Mei et al., 2006; Cheng et al., 2012; Wang et al., 2013). In this study, different common QTL were detected by GWAS and LA in DC1 and 8way, DC2 and 8way, and DC1, DC2 and 8way. There was also no any QTL simultaneously detected by the two mapping approaches both in DC1 and DC2. The GB of DC1 and DC2 were completely different but partially the same as that of 8way. These results further confirmed that GB largely affect the mapping results, and it seems easier to map the common QTL in populations with similar GB.
Total of 12, eight and 14 QTL were averagely identified for the five grain-shape and appearance traits by GWAS in DC1, DC2 and 8way, respectively. It was indicated that eight-way population is more powerful than two four-way populations, consistent with the expectation that progeny generated from multiple parents offers an advantage in that more QTL can be detected. However, there were QTL that were not detected using the 8-way population were detected using the DC1 (i.e., AqDEC2 and AqDEC6c), DC2 (i.e., AqGL3a and AqPGWC8). When only the QTL corresponding to known genes were considered, the QTL undetected by the 8-way population is the AqDEC2 co-located with reported gene qTGW2 for the DC1 population. The more parents involved in developing a population, the lower frequencies of different alleles are usually presented, thus resulting in reduced power for detecting QTL with small effects.
Combining different single population to expand the population size for mapping QTL by GWAS, we found that the number of QTL for grain appearance quality mapped in the single population was comparable to that in the merged population. DC12 population was derived from different parents allows detecting QTL that are segregating only in one of the populations and as a result are not detectable in the other population. Furthermore, when a single population reaches a certain size (~400), continuing to expand the population size by combining different populations such as DC18, DC28 and DC128, which share some partial common parents, didn’t also necessarily improve the effectiveness of mapping results. Obviously, if all the parents were used to develop a single population, much higher power for QTL mapping would be achieved.
QTL mapping efficacy of the two mapping methods
Total of 12, 8 and 14, and 16, 19 and 16 QTL for the five traits were identified by GWAS and LA in DC1, DC2 and 8way, respectively. Clearly, the number of QTL detected by LA was more than that detected by GWAS. The background (noise) control adopted in ICIM can effectively reduce the sampling variance by controlling the effects of QTL located on other intervals and chromosomes, thus will increase the power of QTL mapping (Zhang et al., 2019). Among them, 8, 3 and 7 QTL were simultaneously detected by GWAS and LA in the same regions in DC1, DC2 and 8way, respectively. The average phenotypic variance explained by above commonly detected QTL was 11.03%, significantly higher than that of other QTL with the average PVE 4.84%, ranging from 0.57% for GqDEC1 in 15_PX in DC2 to 15.31% for GqGLWR in 16_PX in DC2. These results indicated that GWAS mainly identified QTL with relatively large effect, while LA could identify more QTL with small effect in addition to QTL with large effect.
At present, most genes cloned by forward genetics were initially mapped by LA, and then further fine-mapped by identifying more recombinants in the target region. This method had the advantage of high localization accuracy. GWAS is based on linkage disequilibrium, and uses single nucleotide polymorphisms (SNP) in the genome as molecular genetic markers to conduct correlation analysis at the genome-wide level to map genes. It can detect multiple alleles at the same locus simultaneously. Population genetic structure and allele frequencies could lead to false-positive association results. In addition, SNP data might be filtered out when association analysis was performed for some rare alleles which probably affect important phenotypes (Tao et al., 2018). Furthermore, association analysis could only map large interval around significant SNPs according to the LD decay distance. Considering characteristics of the two mapping methods, joint mapping of QTL by GWAS and LA can identify more reliable QTL. To date, great progress had been made in rice gene cloning using a combination of GWAS and LA, such as OsSPL13 (Si et al., 2016), bsr-d1 (Li et al., 2017), and RH8 (Li and Li, 2016).
Candidate gene identification for important QTL
Through gene-based association analysis and haplotype analysis, 14 candidate genes were identified for newly identified QTL, AqGL3c/AqGLWR3b, AqDEC6a/AqPGWC6a, and AqGL7 affecting grain appearance quality-related traits. The most likely candidate genes were further inferred by gene annotation and the expression pattern of candidate genes for each QTL using the RNA-seq database from MBKBASE.
GL is coordinately regulated by cell expansion and cell proliferation that involve in multiple signaling pathways and biological processes (Li et al., 2018). Among four candidate genes for AqGL3c/AqGLWR3b, Os03g0586700, highly expressed in milk and mature stage of rice grain, encodes a protein tyrosine phosphatase-like protein, which participated in the regulation of cell proliferation and differentiation (Bellec et al., 2002) (Supplementary Figure S1A), suggesting that Os03g0586700 is the most likely candidate gene and worthy of further verification by gene-editing or transgenic approach.
Among the four genes of AqDEC6a and AqPGWC6a, Os06g0102300 (OsPCS2) encodes chelating peptide synthase and has two variably cleaved transcripts, OsPCS2a and OsPCS2b, which has unconventional premature stop codons (Das et al., 2017). OsPCS2a and OsPCS2b were expressed in roots, stems and developing seeds (Supplementary Figure S1B). Os06g0111800 was expressed in grain endosperm and encodes a cellulose synthase-like D protein, which was involved in cell wall and vascular bundle formation that influences photosynthesis (Yin et al., 2011; Flexas et al., 2021) (Supplementary Figure S1B). Therefore, Os06g0111800 and Os06g0102300 are inferred as most likely candidate genes affecting DEC and PGWC.
Among eight candidate genes for AqGL7, Os07g0666600 encodes a kinase interacting family protein. The orthologous of Os07g0666600 in Arabidopsis is cytoskeleton proteins NETWORKED 3A/C that functions as cell morphology modulators as well as scaffolds to recruit other components, and ultimately regulates cell size (Hussey et al., 2006; Wang et al., 2014) (Supplementary Figure S1C). The degree of chalkiness is highly related to the “source-sink” in rice. So, Os07g0666600 is inferred as a most likely candidate gene affecting GL.
For the candidate gene Os03g0586700, Hap2 was the dominant haplotype with higher GL and GLWR (Figure 4). Haplotype analysis of Os07g0666600 revealed that Hap2 was associated with significantly larger GL than Hap1 both in SZ and SY (Figure 5). Hap4 of Os06g0102300 had lower DEC and PGWC both in SZ and SY, suggesting that Hap4 was the dominant haplotype to improve chalky quality in rice (Figure 6). For Os06g0111800, Hap3 was the dominant haplotype to improve chalky quality in rice (Figure 6). These dominant haplotypes could be used in molecular breeding of rice to improve the grain appearance quality of rice.
Implication for breeding of high appearance grain quality
Through comprehensive comparisons of QTL detected by GWAS and LA in this study, seven important QTL including AqGL3b/AqGLWR3a (GS3), AqGL3c/AqGLWR3b, AqGW5a/AqGLWR5/AqDEC5/AqPGWC5 (GW5), AqDEC6a/AqPGWC6a, AqDEC6b/AqPGWC6b (GS6), AqGL7 and AqPGWC7 were stably detected for grain appearance quality-related traits across four environments. GW was found to positively correlate with chalkiness traits (DEC and PGWC) in this study and in the previous studies (Li et al., 2014; Qiu et al., 2015; Zhao et al., 2015; Zhou et al., 2015). So, QTL cluster of AqGW5a/AqGLWR5/AqDEC5/AqPGWC5 affecting both grain shape (GW and GLWR) and chalkiness traits (DEC and PGWC) could be used for improvement of appearance quality by reducing GW or enlarging GLWR. In general, slender grain with large GLWR tends to have good grain appearance quality (McKenzie and Rutger, 1983). High grain appearance quality could be also realized by combining AqGL3c/AqGLWR3b affecting GLWR and GL with AqDEC6a/AqPGWC6a or AqDEC6b/AqPGWC6b for DEC and PGWC to get a perfect combination of grain type and appearance quality.
In the present study, two groups of lines were selected to have good performance of GLWR and DEC/PGWC. Group 1 including L1352, L1422 and L1692 were selected based on largest GLWR (4.18) and relatively low DEC (3.58%−4.74%)/PGWC (11.74%−17.33%) from the three single MAGIC populations, and group 2 including L1660, L1716 and L1745 were selected based on lowest DEC (2.10%−2.73%)/PGWC (9.29%−9.35%) and relatively large GLWR (3.54−3.96) (Supplementary Table S2). The selected lines have different patterns of favourable alleles at all seven important QTL except AqGL3b/AqGLWR3a and AqDEC6a/AqPGWC6a for grain appearance quality-related traits. We can further improve appearance quality by pyramiding non-allelic favourable alleles distributing on different chromosomes. For example, DEC and PGWC can be further improved by making L1352 or L1442 crossed with L1660 or L1671 to pyramid three favourable alleles at AqDEC6b/AqPGWC6b, AqGL7 and AqPGWC7, or making L1352 or L1442 crossed with L1745 to pyramid two favourable alleles at AqGL7 and AqPGWC7 by following QTL designed pyramiding strategy. Of course, these eight lines could be directly used as donor parents to improve grain appearance quality of elite rice variety with poor appearance quality by marker-assisted selection.
Conclusions
A total of 22 QTL were identified for five traits in DC1, DC2 and 8way, and four combined populations (DC12, DC18, DC28 and DC128) by GWAS, and 42 QTL were identified in the three single populations by LA. GB had strong effect on QTL mapping both for GWAS and LA. The 8way population was more powerful for QTL mapping than the DC1, DC2 and various combined populations. Compared with GWAS, LA can identify more QTL with minor-effect besides large-effect QTL. Among 11 QTL simultaneously detected by the two methods, eight QTL corresponded to known genes, and four QTL (AqGL7, AqGL3c/AqGLWR3b, AqDEC6a/AqPGWC6a, and AqPGWC7) were considered as novel QTL and their candidate genes were inferred. Based on distribution of non-allelic favourable alleles for appearance quality among promising lines in the three MAGIC populations, it is feasible to further enhance appearance quality by pyramiding different favourable alleles using QTL-designed-pyramiding strategy.
Data availability statement
The original contributions presented in the study are included in the article/Supplementary Material. Further inquiries can be directed to the corresponding authors.
Author contributions
HC, KC, CS, SZ, JT and JL performed the experiments. LZ and HC drafted the manuscript. LZ and PQ did data analysis. JX and HH designed the experiments and revised the manuscript. All authors contributed to the article and approved the submitted version.
Funding
This work was founded by the Key Research and Development Project of Hainan Province (ZDYF2021XDNY128), the Agricultural Science and Technology Innovation Program and the Cooperation and Innovation Mission (CAAS-ZDXT202001), and Supported by the earmarked fund for China Agriculture Research System (CARS)-01.
Acknowledgments
We gratefully thank Drs Guoyou Ye and Xiangqian Zhao for providing the seeds of MAGIC populations.
Conflict of interest
The authors declare that the research was conducted in the absence of any commercial or financial relationships that could be construed as a potential conflict of interest.
Publisher’s note
All claims expressed in this article are solely those of the authors and do not necessarily represent those of their affiliated organizations, or those of the publisher, the editors and the reviewers. Any product that may be evaluated in this article, or claim that may be made by its manufacturer, is not guaranteed or endorsed by the publisher.
Supplementary material
The Supplementary Material for this article can be found online at: https://www.frontiersin.org/articles/10.3389/fpls.2022.1074106/full#supplementary-material
References
Bellec, Y., Harrar, Y., Butaeye, C., Darnet, S., Bellini, C., Faure, J. D. (2002). Pasticcino2 is a protein tyrosine phosphatase-like involved in cell proliferation and differentiation in arabidopsis. Plant J. 32 (5), 713–722. doi: 10.1046/j.1365-313x.2002.01456.x
Cavanagh, C., Morell, M., Mackay, I., Powell, W. (2008). From mutations to MAGIC: resources for gene discovery, validation and delivery in crop plants. Curr. Opin. Plant Biol. 11 (2), 215–221. doi: 10.1016/j.pbi.2008.01.002
Cheng, L. R., Wang, Y., Meng, L. J., Hu, X., Cui, Y. R., Sun, Y., et al. (2012). Identification of salt-tolerant QTLs with strong genetic background effect using two sets of reciprocal introgression lines in rice. Genome. 55(1), 45–55. doi: 10.1139/g11-075
Das, N., Bhattacharya, S., Bhattacharyya, S., Maiti, M. K. (2017). Identification of alternatively spliced transcripts of rice phytochelatin synthase 2 gene OsPCS2 involved in mitigation of cadmium and arsenic stresses. Plant Mol. Biol. 94 (1-2), 167–183. doi: 10.1007/s11103-017-0600-1
Flexas, J., Clemente-Moreno, M. J., Bota, J., Brodribb, T. J., Gago, J., Mizo, K. Y., et al. (2021). Cell wall thickness and composition are involved in photosynthetic limitation. J. Exp. Bot. 72 (11), 3971–3986. doi: 10.1093/jxb/erab144
Gong, J. Y., Miao, J. S., Zhao, Y., Zhao, Q., Feng, Q., Zhan, Q. L., et al. (2017). Dissecting the genetic basis of grain shape and chalkiness traits in hybrid rice using multiple collaborative populations. Mol. Plant 10, 10. doi: 10.1016/j.molp.2017.07.014
Guo, L., Ma, L., Jiang, H., Zeng, D., Hu, J., Wu, L., et al. (2009). Genetic analysis and fine mapping of two genes for grain shape and weight in rice. J. Integr. Plant Biol. 51, 45–51. doi: 10.1111/j.1744-7909.2008.00793.x
Hussey, P. J., Ketelaar, T., Deeks, M. J. (2006). Control of the actin cytoskeleton in plant cell growth. Annu. Rev. Plant Biol. 57, 109–125. doi: 10.1146/annurev.arplant.57.032905.105206
Hu, J., Wang, Y., Fang, Y., Zeng, L., Xu, J., Yu, H., et al. (2015). A rare allele of GS2 enhances grain size and grain yield in rice. Mol. Plant 8(10), 1455–1465. doi: 10.1016/j.molp.2015.07.002
Ishimaru, T., Miyazaki, M., Shigemitsu, T., Nakata, M., Masumura, T. (2020). Effect of high temperature stress during ripening on the accumulation of key storage compounds among Japanese highly palatable rice cultivars. J. Cereal Sci. 95, 103018. doi: 10.1016/j.jcs.2020.103018
Li, Y., Fan, C., Xing, Y., Jiang, Y., Luo, L., Sun, L., et al. (2011). Natural variation in GS5 plays an important role in regulating grain size and yield in rice. Nat. Genet. 43 (12), 1266–1269. doi: 10.1038/ng.977
Li, Y., Fan, C., Xing, Y., Yun, P., Luo, L., Yan, B., et al. (2014). Chalk5 encodes a vacuolar h + -translocating pyrophosphatase influencing grain chalkiness in rice. Nat. Genet. 46 (4), 398–404. doi: 10.1038/ng.2923
Li, N., Li, Y. (2016). Signaling pathways of seed size control in plants. Curr. Opin. Plant Biol. 33, 23–32. doi: 10.1016/j.pbi.2016.05.008
Lipka, A. E., Tian, F., Wang, Q., Peiffer, J., Li, M., Bradbury, P. J., et al. (2012). GAPIT: genome association and prediction nintegrated tool. Bioinformatics 28, 2397–2399. doi: 10.1093/bioinformatics/bts444
Liu, J., Chen, J., Zheng, X., Wu, F., Lin, Q., Heng, Y., et al. (2017). GW5 acts in the brassinosteroid signalling pathway to regulate grain width and weight in rice. Nat. Plants. 3, 17043. doi: 10.1038/nplants.2017.43
Liu, S. Y., Lei, H., Dong, S. J., Chen, H. Q., Zhu, X. D., Jiang, J. E., et al. (2015a). OsMAPK6, a mitogen-activated protein kinase, influences rice grain size and biomass OsMAPK6, a mitogen-activated protein kinase, influences rice grain size and biomass production. Plant J. 4 (84), 672–681. doi: 10.1111/tpj.13025
Liu, L. C., Tong, H. N., Xiao, Y. H., Che, R. H., Xu, F., Hui, B., et al. (2015b). Activation of Big Grain1 significantly improves grain size by regulating auxin transport in rice. Proc. Natl. Acad. Sci. U.S.A. 112 (35), 11102. doi: 10.1073/pnas.1512748112
Liu, J. X., Wu, M. W., Liu, C.-M. (2022). Cereal endosperms: development and storage product accumulation. Plant Biol. 73, 255–291. doi: 10.1146/annurev-arplant-070221-024405
Li, N., Xu, R., Duan, P., Li, Y. (2018). Control of grain size in rice. Plant Reprod. 31 (3), 237–251. doi: 10.1007/s00497-018-0333-6
Li, W., Zhu, Z., Chern, M., Yin, J., Yang, C., Ran, L., et al. (2017). A natural allele of a transcription factor in rice confers broad-spectrum blast resistance. Cell 170 (1), 114–126. doi: 10.1016/j.cell.2017.06.008
Mao, H., Sun, S., Yao, J., Wang, C., Yu, S., Xu, C., et al. (2010). Linking differential domain functions of the GS3 protein to natural variation of grain size in rice. Proc. Natl. Acad. Sci. U.S.A. 107, 19579–19584. doi: 10.1073/pnas.1014419107
McKenzie, K. S., Rutger, J. N. (1983). Genetic analysis of amy- lose content, alkali spreading score, and grain dimensions in rice. Crop Sci. 23, 306–313. doi: 10.2135/cropsci1983.0011183X002300020031x
Mei, H. W., Xu, J. L., Li, Z. K., Luo, L. J. (2006). QTLs influencing panicle size detected in two reciprocal introgressive line (IL) populations in rice (Oryza sativa L.). Theor. Appl. Genet. 112(4), 648–656. doi: 10.1007/s00122-005-0167-0
Meng, L., Guo, L., Ponce, K., Zhao, X., Ye, G. (2016). Characterization of three indica rice multiparent advanced generation intercross (MAGIC) populations for quantitative trait loci identification. Plant Genome 9 (2), 1–14. doi: 10.3835/plantgenome2015.10.0109
Meng, L., Wang, B., Zhao, X., Ponce, K., Qian, Q., Ye, G. (2017). Association mapping of ferrous, zinc, and aluminum tolerance at the seedling stage in indica rice using MAGIC populations. Front. Plant Sci. 8. doi: 10.3389/fpls.2017.01822
Moncada, P., Martinez, C. P., Borrero, J., Chatel, M., Gauch, H., Gui-maraes, E., et al. (2001). Quantitative trait loci for yield and yield components in an Oryza sativa × Oryza rufipogon BC2F2 population evaluated in an upland environment. Theor. Appl. Genet. 102, 41–52. doi: 10.1007/s001220051616
Murchie, E. H., Pinto, M., Horton, P. (2009). Agriculture and the new challenges for photosynthesis research. New Phytol. 181), 532–552. doi: 10.1111/j.1469-8137.2008.02705.x
Murray, M. G., Thompson, W. F. (1980). Rapid isolation of high molecular weight plant DNA. Nucl. Acids Res. 8 (19), 4321–4325. doi: 10.1093/nar/8.19.4321
Purcell, S., Neale, B., Todd-Brown, K., Thomas, L., Ferreira, M. A., Bender, D., et al. (2007). PLINK: a tool set for whole-genome association and population-based linkage analyses. Am. J. Hum. Genet. 81 (3), 559–575. doi: 10.1086/519795
Qi, P., Lin, Y. S., Song, X. J., Shen, J. B., Huang, W., Shan, J. X., et al. (2012). The novel quantitative trait locus GL3.1 controls rice grain size and yield by regulating cyclin-T1;3. Cell Res. 22, 1666–1680. doi: 10.1038/cr.2012.151
Qiu, X., Pang, Y., Yuan, Z., Xing, D., Xu, J., Dingkuhn, M., et al. (2015). Genome-wide association study of grain appearance and milling quality in a worldwide collection of indica rice germplasm. PloS One 10 (12), e0145577. doi: 10.1371/journal.pone.0145577
Qu, P., Shi, J., Chen, T., Chen, K., Shen, C. C., Wang, J. K., et al. (2020). Construction and integration of genetic linkage maps from three multi-parent advanced generation inter-cross populations in rice. Rice 13 (1), 13. doi: 10.1186/s12284-020-0373-z
Ruan, B., Shang, L. G., Zhang, B., Hu, J., Wang, Y. X., Lin, H., et al. (2020). Natural variation in the promoter of TGW2 determines grain width and weight in rice. New Phytologist. 227 (2), 629–640. doi: 10.1111/nph.16540
Septiningsih, E. M., Prasetiyono, J., Lubis, E., Tai, T. H., Tjubaryat, T., Moeljopawiro, S., et al. (2003). Identification of quantitative trait loci for yield and yield components in an advanced backcross population derived from the Oryza sativa variety IR64 and the wild relative O. rufipogon. Theor. Appl. Genet. 107, 1419–1432. doi: 10.1007/s00122-003-1373-2
Shomura, A., Izawa, T., Ebana, K., Ebitani, T., Kanegae, H., Konishi, S. (2008). Deletion in a gene associated with grain size increased yields during rice domestication. Nat. Genet. 40 (8), 1023–1028. doi: 10.1038/ng.169
Si, L., Chen, J., Huang, X., Gong, H., Luo, J., Hou, Q., et al. (2016). OsSPL13 controls grain size in cultivated rice. Nat. Genet. 48 (4), 447–456. doi: 10.1038/ng.3518
Singh, R., Singh, A. K., Sharma, T. R., Singh, A., Singh, N. K. (2012). Fine mapping of grain length QTLs on chromosomes 1 and 7 in basmati rice (Oryza sativa l.). J. Plant Biochem. Biotechnol. 21 (2), 157–166. doi: 10.1007/s13562-011-0080-3
Song, X. J., Huang, W., Shi, M., Zhu, M. Z., Lin, H. X. (2007). A QTL for rice grain width and weight encodes a previously unknown RING-type E3 ubiquitin ligase. Nat. Genet. 39 (5), 623–630. doi: 10.1038/ng2014
Song, X. J., Kuroha, T., Ayano, M., Furuta, T., Nagai, K., Komeda, N., et al. (2015). Rare allele of a previously unidentified histone H4 acetyltransferase enhances grain weight, yield, and plant biomass in rice. Proc. Natl. Acad. Sci. U.S.A. 112 (1), 76. doi: 10.1073/pnas.1421127112
Sun, L., Li, X., Fu, Y., Zhu, Z. F., Tan, L. B., Liu, F. X., et al. (2013). GS6, a member of the GRAS gene family, negatively regulates grain size in rice. J. Integr. Plant Biol. 55 (10), 938–949. doi: 10.1111/jipb.12062
Tao, Y., Niu, Y., Wang, Y., Chen, T., Naveed, S., Zhang, J., et al. (2018). Genome-wide. association mapping of aluminum toxicity tolerance and fine mapping of a candidate gene for Nrat1 in rice. PloS One 13 (6), e0198589. doi: 10.1371/journal.pone.0198589
Wang, P., Hawkins, T. J., Richardson, C., Cummins, I., Deeks, M. J., Sparkes, I., et al. (2014). The plant cytoskeleton, NET3C, and VAP27 mediate the link between the plasma membrane and endoplasmic reticulum. Curr. Biol. 24 (12), 1397–1405. doi: 10.1016/j.cub.2014.05.003
Wang, S., Li, S., Liu, Q., Wu, K., Zhang, J. Q., Wang, S, et al. (2015a). The OsSPL16-GW7 regulatory module determines grain shape and simultaneously improves rice yield and grain quality. Nat. Genet. 47 (8), 949. doi: 10.1038/ng.3352
Wang, X., Pang, Y., Wang, C., Chen, K., Zhu, Y., Shen, C., et al. (2017). New candidate genes affecting rice grain appearance and milling quality detected by genome-wide and gene-based association analyses. Front. Plant Sci. 7, 1998. doi: 10.3389/fpls.2016.01998
Wang, E., Wang, J., Zhu, X., Hao, W., Wang, L. Y., Li, Q., et al. (2008). Control of rice grain-filling and yield by a gene with a potential signature of domestication. Nate Genet. 40 (11), 1370–1374. doi: 10.1038/ng.220
Wang, S., Wu, K., Yuan, Q., Liu, X. Y., Liu, Z. B., Lin, X. Y., et al. (2012). Control of grain size, shape and quality by OsSPL16 in rice. Nat. Genet. 44 (8), 950–954. doi: 10.1038/ng.2327
Wang, Y., Xiong, G., Hu, J., Liang, L., Yu, H., Xu, J., et al. (2015b). Copy number variation at the GL7 locus contributes to grain size diversity in rice. Nat. Genet. 47 (8), 944–948. doi: 10.1038/ng.3346
Wang, Y., Zang, J. P., Sun, Y., Ali, J., Xu, J. L., Li, Z. K. (2013). Background-independent quantitative trait loci for drought tolerance identified using advanced backcross introgression lines in rice. Crop Science. 53(2):430–441. doi: 10.2135/cropsci2012.06.0361
Weng, J., Gu, S., Wan, X., Gao, H., Guo, T., Su, N., et al. (2008). Isolation and initial characterization of GW5, a major QTL associated with rice grain width and weight. Cell Res. 18 (12), 11. doi: 10.1038/cr.2008.307
Xie, X. B., Song, M. H., Jin, F., Ahn, S. N., Suh, J. P., Hwang, H. G., et al. (2006). Fine. mapping of a grain weight quantitative trait locus on rice chromosome 8 using near-isogenic lines derived from a cross between Oryza sativa and Oryza rufipogon. Theor. Appl. Genet. 113, 885–894. doi: 10.1007/s00122-006-0348-5
Yang, W., Guo, Z., Huang, C., Duan, L. F., Chen, G., Jiang, N., et al. (2014). Combining high-throughput phenotyping and genome-wide association studies to reveal natural genetic variation in rice. Nat. Commun. 5, 5087. doi: 10.1038/ncomms6087
Yin, L., Verhertbruggen, Y., Oikawa, A., Manisseri, C., Knierim, B., Prak, L., et al.(2011). The cooperative activities of CSLD2, CSLD3, and CSLD5 are required for normal arabidopsis development. Mol. Plant 4(6), 1024–1037. doi: 10.1093/mp/ssr026
You, H., Sundus., Z., Zhang, F., Zhu, S. B., Chen, K., Shen, C. C., et al. (2022). Genetic mechanism of heterosis for rice milling and appearance quality in an elite rice hybrid. Crop J (online). doi: 10.1016/j.cj.2022.05.001
Yu, J., Pressoir, G., Briggs, H., Bi, I., Yamasaki, M., Doebley, J., et al. (2006). A unified mixed-model method for association mapping that accounts for multiple levels of relatedness. Nat. Genet. 38(2), 203–208. doi: 10.1038/ng1702
Yu, J., Xiong, H., Zhu, X., Zhang, H., Li, H., Miao, J., et al. (2017). OsLG3 contributing to rice grain length and yield was mined by ho-LAMap. BMC Biol. 15 (1), 28. doi: 10.1186/s12915-017-0365-7
Zhang, L., Lei, M., Wang, J. (2019). Linkage analysis and integrated software GAPL for pure-line populations derived from four-way and eight-way crosses. Crop J. 7 (3), 11. doi: 10.1016/j.cj.2018.10.006
Zhang, W., Sun, P., He, Q., Shu, F., Wang, J., Deng, H., et al. (2013). Fine mapping of GS2, a dominant gene for big grain rice. Crop J. 1, 160–165. doi: 10.1016/j.cj.2013.10.003
Zhang, X., Wang, J., Huang, J., Lan, H., Wang, C., Yin, C., et al. (2012). Rare allele of OsPPKL1 associated with grain length causes extra-large grain and a significant yield increase in rice. Proc. Natl. Acad. Sci. U S A. 109 (52), 21534–21539. doi: 10.1073/pnas.1219776110
Zhao, X., Daygon, V., McNally, K., Hamilto, R., Xie, F., Reinke, R., et al. (2016). Identification of stable QTLs causing chalk in rice grains in nine environments. Theor. Appl. Genet. 129, 141–153. doi: 10.1007/s00122-015-2616-8
Zhao, D. S., Li, Q. F., Zhang, C. Q., Zhang, C., Yang, Q., Pan, L.-X., et al. (2018). GS9 acts as a transcriptional activator to regulate rice grain shape and appearance quality. Nat. Commun. 9, 1240. doi: 10.1038/s41467-018-03616-y
Zhao, K., Tung, C. W., Eizenga, G., Wright, M., Ali, M., Price, A., et al. (2011). Genome-wide association mapping reveals a rich genetic architecture of complex traits in Oryza sativa. Nat. Commun. 2, 467. doi: 10.1038/ncomms1467
Zhao, D., Zhang, C., Li, Q., Liu, Q. (2022). Genetic control of grain appearance quality in rice. Biotechnol. Adv. 60, 108014. doi: 10.1016/j.biotechadv.2022.108014
Zhao, X., Zhou, L., Ponce, K., Ye, G. (2015). The usefulness of known genes/qtls for grain quality traits in an indica population of diverse breeding lines tested using association analysis. Rice 8 (1), 29. doi: 10.1186/s12284-015-0064-3
Zhou, L., Chen, L., Jiang, L., Zhang, W., Liu, L., Liu, X., et al. (2009). Fine mapping of the grain chalkiness QTL qPGWC-7 in rice (Oryza sativa l.). Theor. Appl. Genet. 118 (3), 581–590. doi: 10.1007/s00122-008-0922-0
Keywords: grain appearance quality, genome-wide association study (GWAS), linkage analysis (LA), quantitative trait locus/loci (QTL), designed QTL pyramiding
Citation: Chen H, Zhai L, Chen K, Shen C, Zhu S, Qu P, Tang J, Liu J, He H and Xu J (2022) Genetic background- and environment-independent QTL and candidate gene identification of appearance quality in three MAGIC populations of rice. Front. Plant Sci. 13:1074106. doi: 10.3389/fpls.2022.1074106
Received: 19 October 2022; Accepted: 28 October 2022;
Published: 11 November 2022.
Edited by:
Jun Fang, Key Laboratory of Soybean Molecular Design and Breeding (CAS), ChinaReviewed by:
Quan Xu, Shenyang Agricultural University, ChinaWenhao Yan, Huazhong Agricultural University, China
Changquan Zhang, Yangzhou University, China
Copyright © 2022 Chen, Zhai, Chen, Shen, Zhu, Qu, Tang, Liu, He and Xu. This is an open-access article distributed under the terms of the Creative Commons Attribution License (CC BY). The use, distribution or reproduction in other forums is permitted, provided the original author(s) and the copyright owner(s) are credited and that the original publication in this journal is cited, in accordance with accepted academic practice. No use, distribution or reproduction is permitted which does not comply with these terms.
*Correspondence: Haohua He, aGhodWE2NEAxNjMuY29t; Jianlong Xu, eHVqaWFubG9uZ0BjYWFzLmNu
†These authors have contributed equally to this work