 Ting Yang1,2,3†
 Sunil Kumar Sahu1,2*†
 Lingxiao Yang4
 Yang Liu1,2
 Weixue Mu1,2
 Xin Liu1,2
 Mikael Lenz Strube3
 Huan Liu1,2,5
 Bojian Zhong4*
- 1Beijing Genomics Institute Shenzhen, Yantian Beishan Industrial Zone, Shenzhen, China
- 2State Key Laboratory of Agricultural Genomics, Beijing Genomics Institute Shenzhen, Shenzhen, China
- 3Department of Biotechnology and Biomedicine, Technical University of Denmark, Lyngby, Denmark
- 4College of Life Sciences, Nanjing Normal University, Nanjing, China
- 5Department of Biology, University of Copenhagen, Copenhagen, Denmark
The plastid organelle is essential for many vital cellular processes and the growth and development of plants. The availability of a large number of complete plastid genomes could be effectively utilized to understand the evolution of the plastid genomes and phylogenetic relationships among plants. We comprehensively analyzed the plastid genomes of Viridiplantae comprising 3,654 taxa from 298 families and 111 orders and compared the genomic organizations in their plastid genomic DNA among major clades, which include gene gain/loss, gene copy number, GC content, and gene blocks. We discovered that some important genes that exhibit similar functions likely formed gene blocks, such as the psb family presumably showing co-occurrence and forming gene blocks in Viridiplantae. The inverted repeats (IRs) in plastid genomes have doubled in size across land plants, and their GC content is substantially higher than non-IR genes. By employing three different data sets [all nucleotide positions (nt123), only the first and second codon positions (nt12), and amino acids (AA)], our phylogenomic analyses revealed Chlorokybales + Mesostigmatales as the earliest-branching lineage of streptophytes. Hornworts, mosses, and liverworts forming a monophylum were identified as the sister lineage of tracheophytes. Based on nt12 and AA data sets, monocots, Chloranthales and magnoliids are successive sister lineages to the eudicots + Ceratophyllales clade. The comprehensive taxon sampling and analysis of different data sets from plastid genomes recovered well-supported relationships of green plants, thereby contributing to resolving some long-standing uncertainties in the plant phylogeny.
Introduction
Chloroplasts are the defining organelle of the plant lineage, essential for photosynthesis, lipid metabolism, and innumerable other cellular processes related to plant growth, development, and stress response. Since the endosymbiotic origin of plastids, gene transfer from the plastid genome (plastome) to the nucleus is a continuous process (Matsuo et al., 2005; Eckardt, 2006). Therefore, phylogenetic trees based on a few plastid genes may lead to incongruence. However, plastid genomic DNA (ptDNA) is conserved in gene content (Wicke et al., 2011). The conserved plastid gene blocks could be explained by large-scale gene transfers in an ancestral lineage, among others. For instance, the presence of gene blocks such as psbB/T/N/H could be considered as an indication of monophyly of streptophytes (Lee and Manhart, 2002; Howe et al., 2008).
Plastid DNA of green plants (Viridiplantae) normally exhibits a conserved genome structure, which contains two copies of an inverted repeat (IR) separating a small single-copy (SSC) region from the large single-copy region (LSC). The plastome sizes of photosynthetic land plants normally range from 107 (Cathaya argyrophylla, Pinaceae) (Lin et al., 2010) to 218 kb (Pelargonium, Geraniaceae) (Chumley et al., 2006). However, some angiosperm lineages may have extreme variations in their genome size (Wicke and Naumann, 2018; Chen et al., 2020; Lyko and Wicke, 2021; Li et al., 2022). For instance, the plastid genomes of parasitic plants such as Pilostyles spp. or Prosopanche americana (Hydnoraceae) are only around 12 and 28 kb, respectively (Bellot et al., 2016; Arias-Agudelo et al., 2019; Jost et al., 2020). In contrast, the plastid genomes of the chlorophyte Floydiella (Chaetopeltidaceae) is 520 kb in length (Brouard et al., 2010). The sizes of plastic genomes (ptDNA) have been compared within many clades (Xu et al., 2015; Xiao-Ming et al., 2017). Many factors are known to cause plastome size variation, which includes (a) variations of intergenic regions, and intron lengths (Maul et al., 2002; Simpson and Stern, 2002), (b) IR region variation (Chumley et al., 2006; Brázda et al., 2018), and (c) gene loss (Braukmann et al., 2013; Chen et al., 2020; Jost et al., 2020). An IR analysis of all green plants showed that shorter IRs are frequently found in bryophytes followed by chlorophytes, while Polypodiopsida with the lowest frequencies (Brázda et al., 2018). However, in Papilionoideae, Pinaceae, and cupressophytes, the IRs are nearly lost or missing (Wu et al., 2011; Lin et al., 2012; Xu et al., 2015), with at least two independent regains of IRs following a previous loss (Choi et al., 2019; Qu et al., 2019). Gene content variation contributes to the plastome size variation only to a smaller extent, with an exception of heterotrophic algae and parasitic flowering plants, which have partially or completely lost their photosynthetic ability (Wicke and Naumann, 2018; Lyko and Wicke, 2021).
To understand the origin and relationships of green plants, the phylogenetic analyses have been widely performed based on nuclear (e.g., Wickett et al., 2014; One Thousand Plant Transcriptomes Initiative, 2019), mitochondrial (Liu et al., 2014), and plastid loci (Nickrent et al., 2000; Burleigh and Mathews, 2004; Li et al., 2019, 2022; Sousa et al., 2020). The phylogenetic relationship among chlorophytes has been reviewed recently (Leliaert et al., 2011, 2012; Lemieux et al., 2016; Fang et al., 2017; Li et al., 2020). However, the relationships among core chlorophyte clades (Chlorodendrophyceae, Ulvophyceae, Trebouxiophyceae, and Chlorophyceae) require further analyses (Li et al., 2021b). Large-scale transcriptome data resolved topological uncertainty within ferns and bryophytes (Pryer et al., 2004; Shaw and Renzaglia, 2004; Shen et al., 2017; Puttick et al., 2018; Sousa et al., 2020). Lu et al. (2014) used two nuclear genes and performed near-complete sampling of extant gymnosperms genera and found that cycads are the basal-most lineage of gymnosperms rather than a sister group to Ginkgoaceae (Lu et al., 2014). Burleigh and Mathews (2004) used four nuclear loci, five chloroplast loci, and four mitochondrial loci from 31 genera to resolve the seed plant tree of life (Burleigh and Mathews, 2004). Another group used 61 plastid genes from 45 taxa to reconstruct the phylogenetic order among basal angiosperms (Moore et al., 2007). A nearly complete set of plastid protein-coding sequences based on 360 species of the green plants (Gitzendanner et al., 2018) and 1,879 taxa representing all the major subclades across green plant have been reported (Ruhfel et al., 2014). Likewise, the large-scale phylogenomic study using 1,342 transcriptomes that represent 1,124 species has been performed across green plants (One Thousand Plant Transcriptomes Initiative, 2019). Despite the expanded taxon sampling and comprehensive plastome data set, relationships among the five major clades of Mesangiospermae remain elusive (Li et al., 2021a).
Next-generation sequencing technologies have contributed to complete plastid genomes of plants. Until January 2021, over 3,823 complete plastid genome sequences have been published in the National Center for Biotechnology Information (NCBI) organelle genome database. This large amount of complete ptDNA data can be effectively utilized to understand the evolution of plastid genomes and infer phylogenetic relationships among plants. By employing these large-scale data, we aimed to understand (i) the overview of the plastome architecture in Viridiplantae following the split from chlorophytes, and phylogenetic relationships mainly focusing on core chlorophytes, ferns and bryophytes, Mesangiospermae (comprising magnoliids, Chloranthales, monocots, Ceratophyllum, and eudicots) based on nt12, nt123, AA of plastid protein-coding genes, (ii) how the gene order (positional arrangement) is shaped along the Viridiplantae, (iii) what forces could underly the formation and uneven size distribution of IRs in Viridiplantae, and (iv) whether an increased taxon sampling helps to resolve phylogenetic relationships and topological conflicts in Viridiplantae. To answer these questions, we analyzed plastid genome data from 3,654 taxa, 298 families, 111 orders of Viridiplantae and compared the genomic organizations in their ptDNAs, which include gene gains/losses, gene copy number variation, GC content, and plastid gene blocks. We also covered a wide range of green plant species to infer plastid data-based phylogenetic trees and compared to previously phylogenomic analyses. The analyses based on wide coverage in taxon sampling allowed us to gain new insights into evolutionary dynamics and the phylogeny of Viridiplantae.
Results and Discussion
The Genome Size and Gene Organization in Plastid Genomes
In this study, the complete plastid genomes (ptDNA) of 3,654 taxa (available as of Jan 2019), which represent 298 families, and 111 orders of Viridiplantae were selected, comprising chlorophytes (70), charophytes (12), liverworts (6), mosses (8), hornworts (2), lycophytes (5), ferns (85), gymnosperms (202), and angiosperms (3,264) (Supplementary Table 1). The size of ptDNA ranged from 521,168 to 71,666 bp. Liverworts, mosses, and gymnosperms displayed the smallest average genome size, which was 118.26, 129.08, and 127.53 kb, respectively, whereas chlorophytes had the largest genome size variation with an average genome size of 156.23 kb (Figure 1).
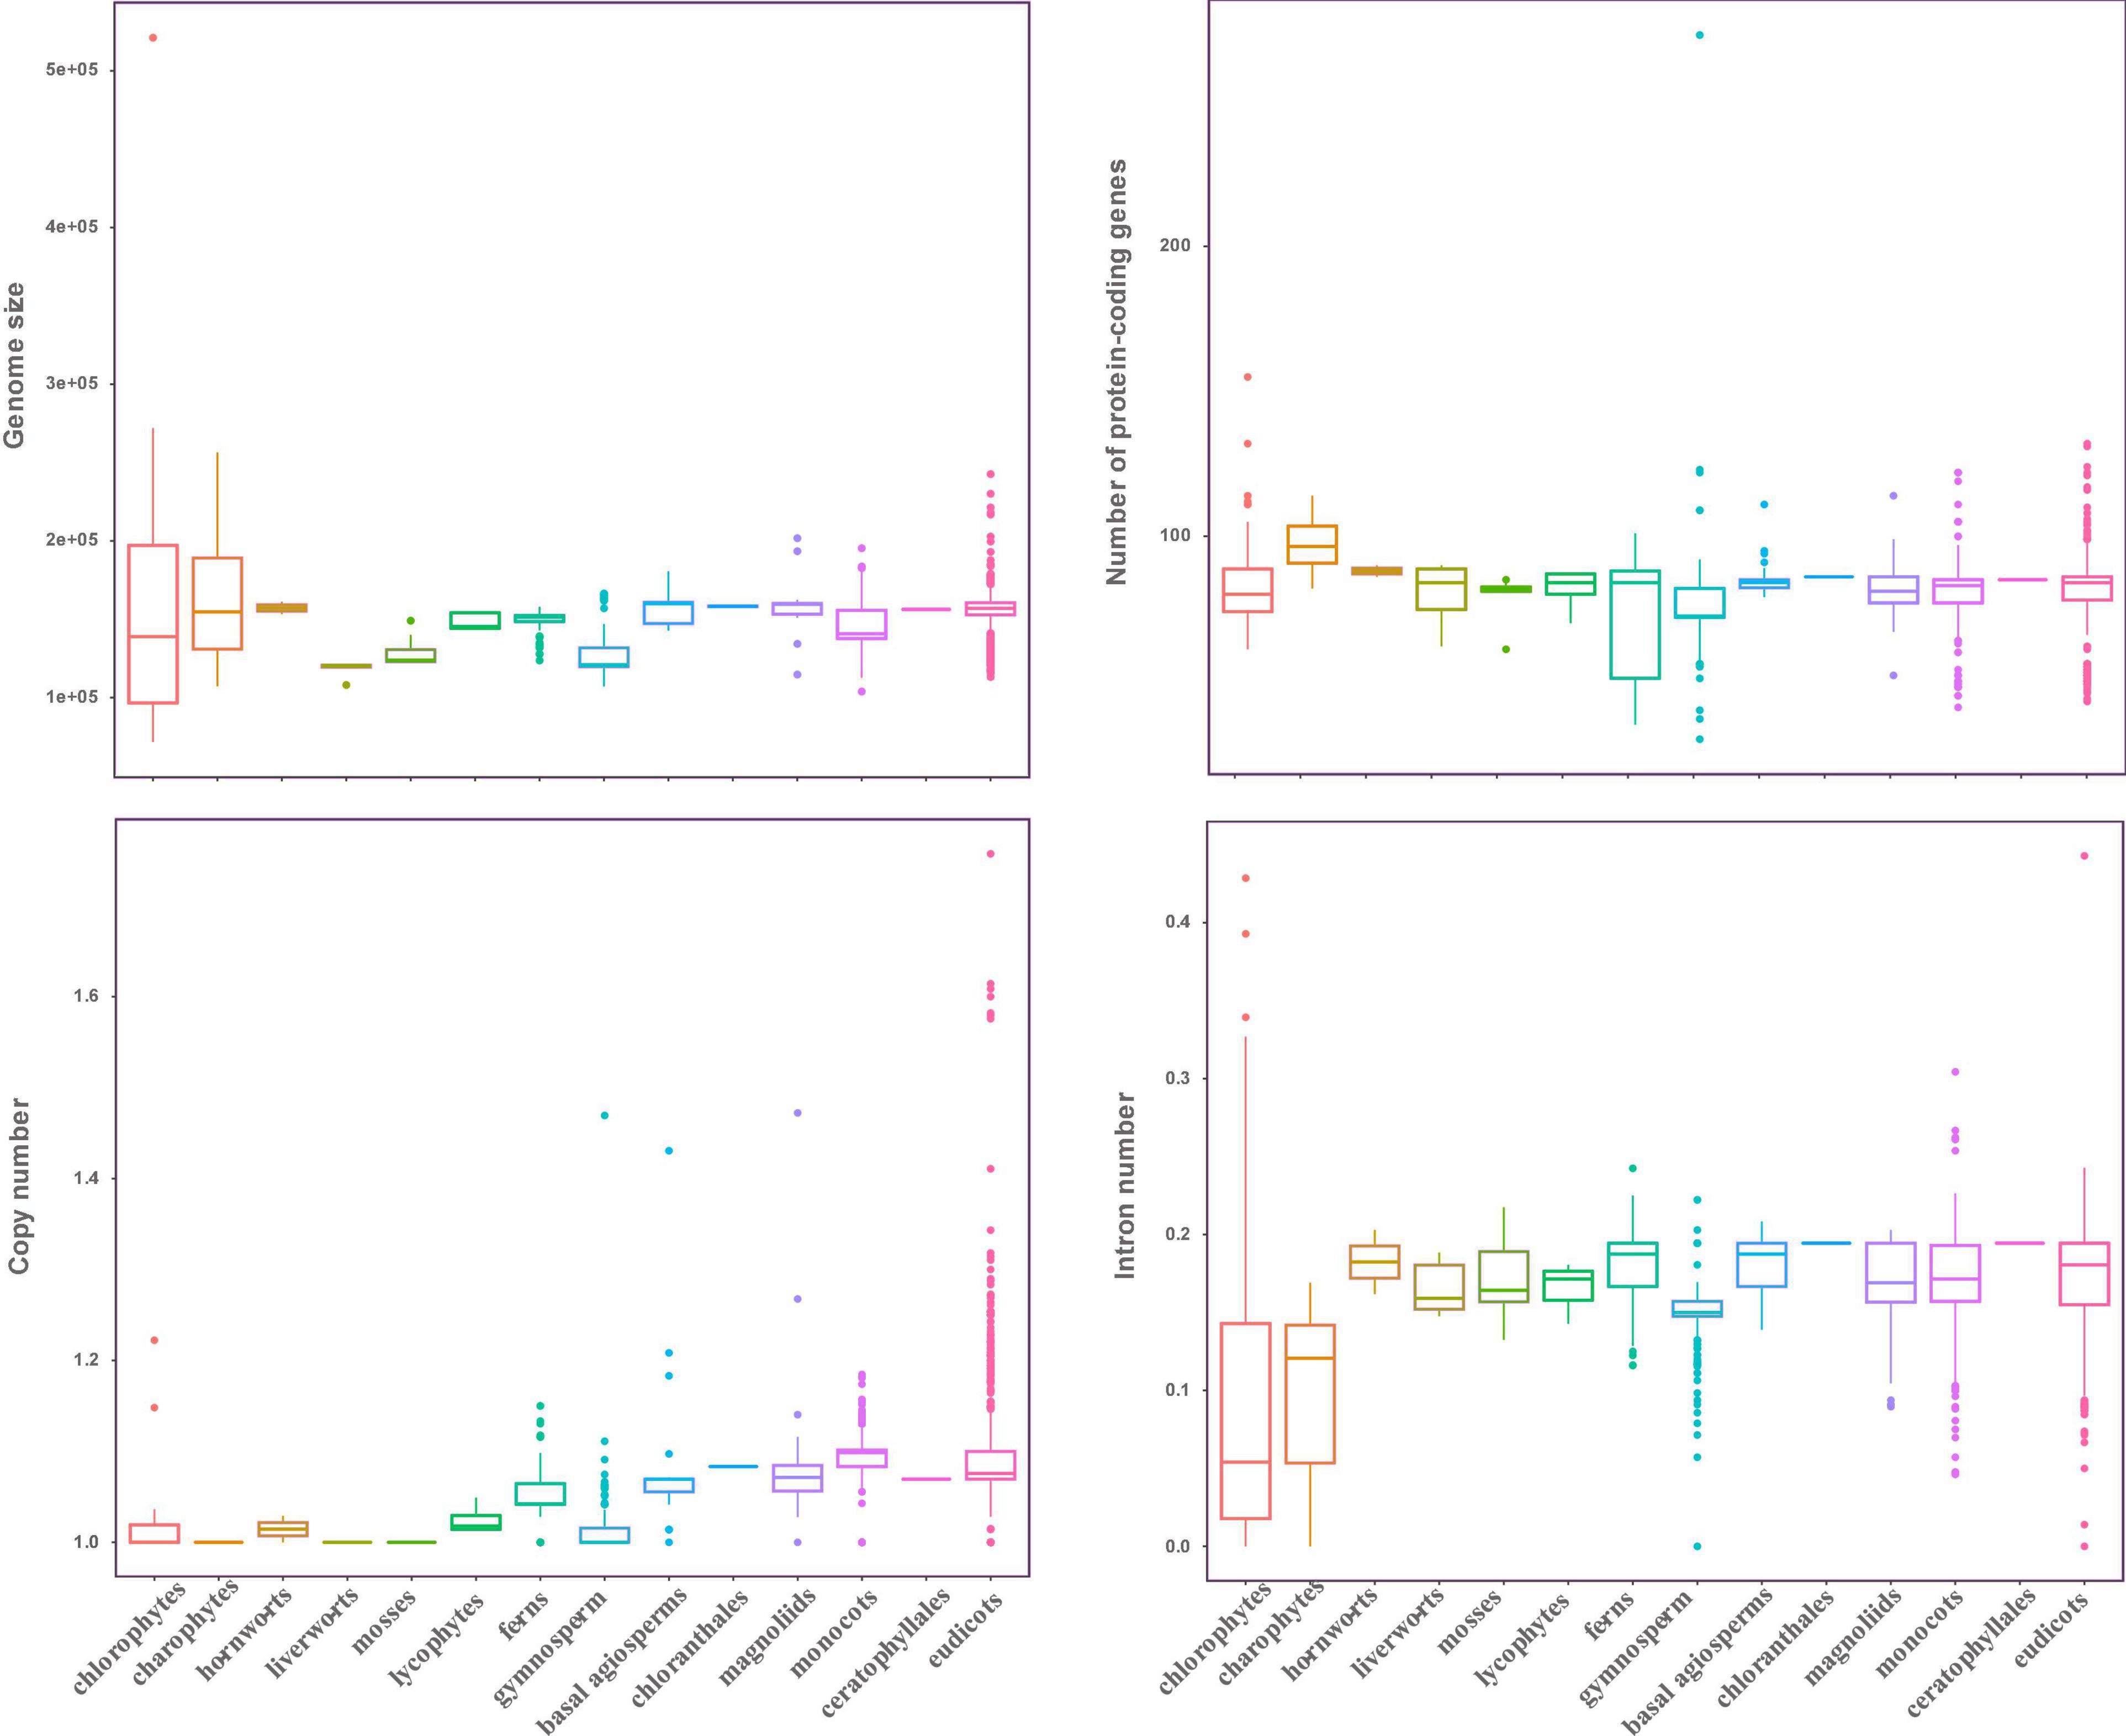
Figure 1. Characteristic features of plastid genomes. The genome size, protein-coding genes number, gene copy number, and intron number in Viridiplantae. Boxplots represent minimum, median, and maximum values.
Even though plastid genome sizes show large variation, gene numbers are rather conserved comprising 120–130 genes. We recovered 72 protein-coding genes from all the sequenced ptDNA (seven genes: ndhF, psaA, psaB, rpoB, rpoC1, rpoC2, and ycf2 were not included in this study, refer to section “Materials and Methods”), and to investigate the status of gene content in the Viridiplantae, we calculated the average gene number in every order to investigate the status of gene content in the Viridiplantae. The overview of the genes is presented in Supplementary Figure 1. We found that most of the protein-coding genes normally present as a single copy. Most of the chlorophytes, the gymnosperm order Gnetales and Pinales, and the eudicot Santalales harbor no genes corresponding to the ndh family. All angiosperms have ndh genes and possess two copies of rps12, rpl2, rps7, and rpl23, as well as ndhB. Similarly, the number of introns in ptDNA of Viridiplantae is generally conserved (Figure 1). Most of the genes lacked introns with the exception among several ribosomal proteins and photosynthesis genes (Supplementary Table 1). The genes that include atpF, ndhA, ndhB, petB, petD, rpl16, rps12, rps16, and ycf3 possessed one intron in most of Streptophyta. The intron number of clpP gene showed a high divergence, with 2,327 species having two introns and more than 100 species having 3–4 introns. But no intron was found in clpP among chlorophytes, gymnosperms (except Ginkgoales and Cycadales), and Poaceae of monocots.
The GC bias is widely discovered in the plastid genomes (e.g., Ruhfel et al., 2014; Chen et al., 2021). In this study, we constructed different data sets to calculate the GC content between 14 major clades of Viridiplantae (Figure 2). Specifically, we used five sets of 72 protein-coding genes, from which we carried over the first base (GC1), the second base (GC2), and the third base (GC3) of codon and subjected them with a ntNo3rd (GC12) for the GC content analysis. The total GC content ranged from 34.0 to 42.2% in chlorophytes, 36.8–39.7% in charophytes, 36.7–42.5% in bryophytes, 41.1–56.8% in lycophytes, 37.5–45.4% in fern, around 41.0% in gymnosperms, and 39.9–41.4% in angiosperms (Figure 2A). There was a non-significant difference in GC content among seed plant, despite the fact that lycophytes had a significantly greater GC content. Many plastid genomes have revealed that the GC content at each base of the codon is different and GC1 > GC2 > GC3 (e.g., Kim et al., 2014; Zhang et al., 2016). According to the results of the GC content analyses, the GC3 had significantly lower values for all 14 clades, with particularly low values for charophytes, chlorophytes, and bryophytes (Figure 2B). The previous analyses have shown that genes in the conserved order tend to evolve more slowly and with a higher proportion of GC than genes in the non-conserved order in bacteria (Papanikolaou et al., 2009). The psb family are important plastid genes which encode photosystem II proteins. In our study, we found that psbB-psbT-psbN-psbH always appeared in one cluster, and each gene had a consistent GC content throughout the 14 clades (Supplementary Figure 2). The average GC content for the psbB-psbT-psbN-psbH gene family was 42.04%, whereas the average GC content for the non-conserved psb family (psbA, psbI, psbK, and psbL) was only 33.81%. Not only the order of gene conservation can affect the GC content, but also the selection and recombination shaped it. For instance, GC content is known to increase rapidly in recombination hotspots (Meunier and Duret, 2004; Marsolier-Kergoat and Yeramian, 2009; Sundararajan et al., 2016). The previous studies have also shown that genes relocated to IRs tend to gain high GC content (Wu and Chaw, 2015; Li et al., 2016). Therefore, we compared the GC content changes in five genes (rps19, rps2, rpl23, rps7, and ndhB), which underwent twofold expansion in the IRs. A number of five genes were classified as “in-IRs” when found in IR regions, whereas the others were classified as “out-IRs” when they are absent in IR regions. With the exception of rps19, we observed a significant variation in GC content and also made an interesting observation that genes that were transported into IRs are likely to have higher GC content than genes that were not transported into IRs (Figure 2D).
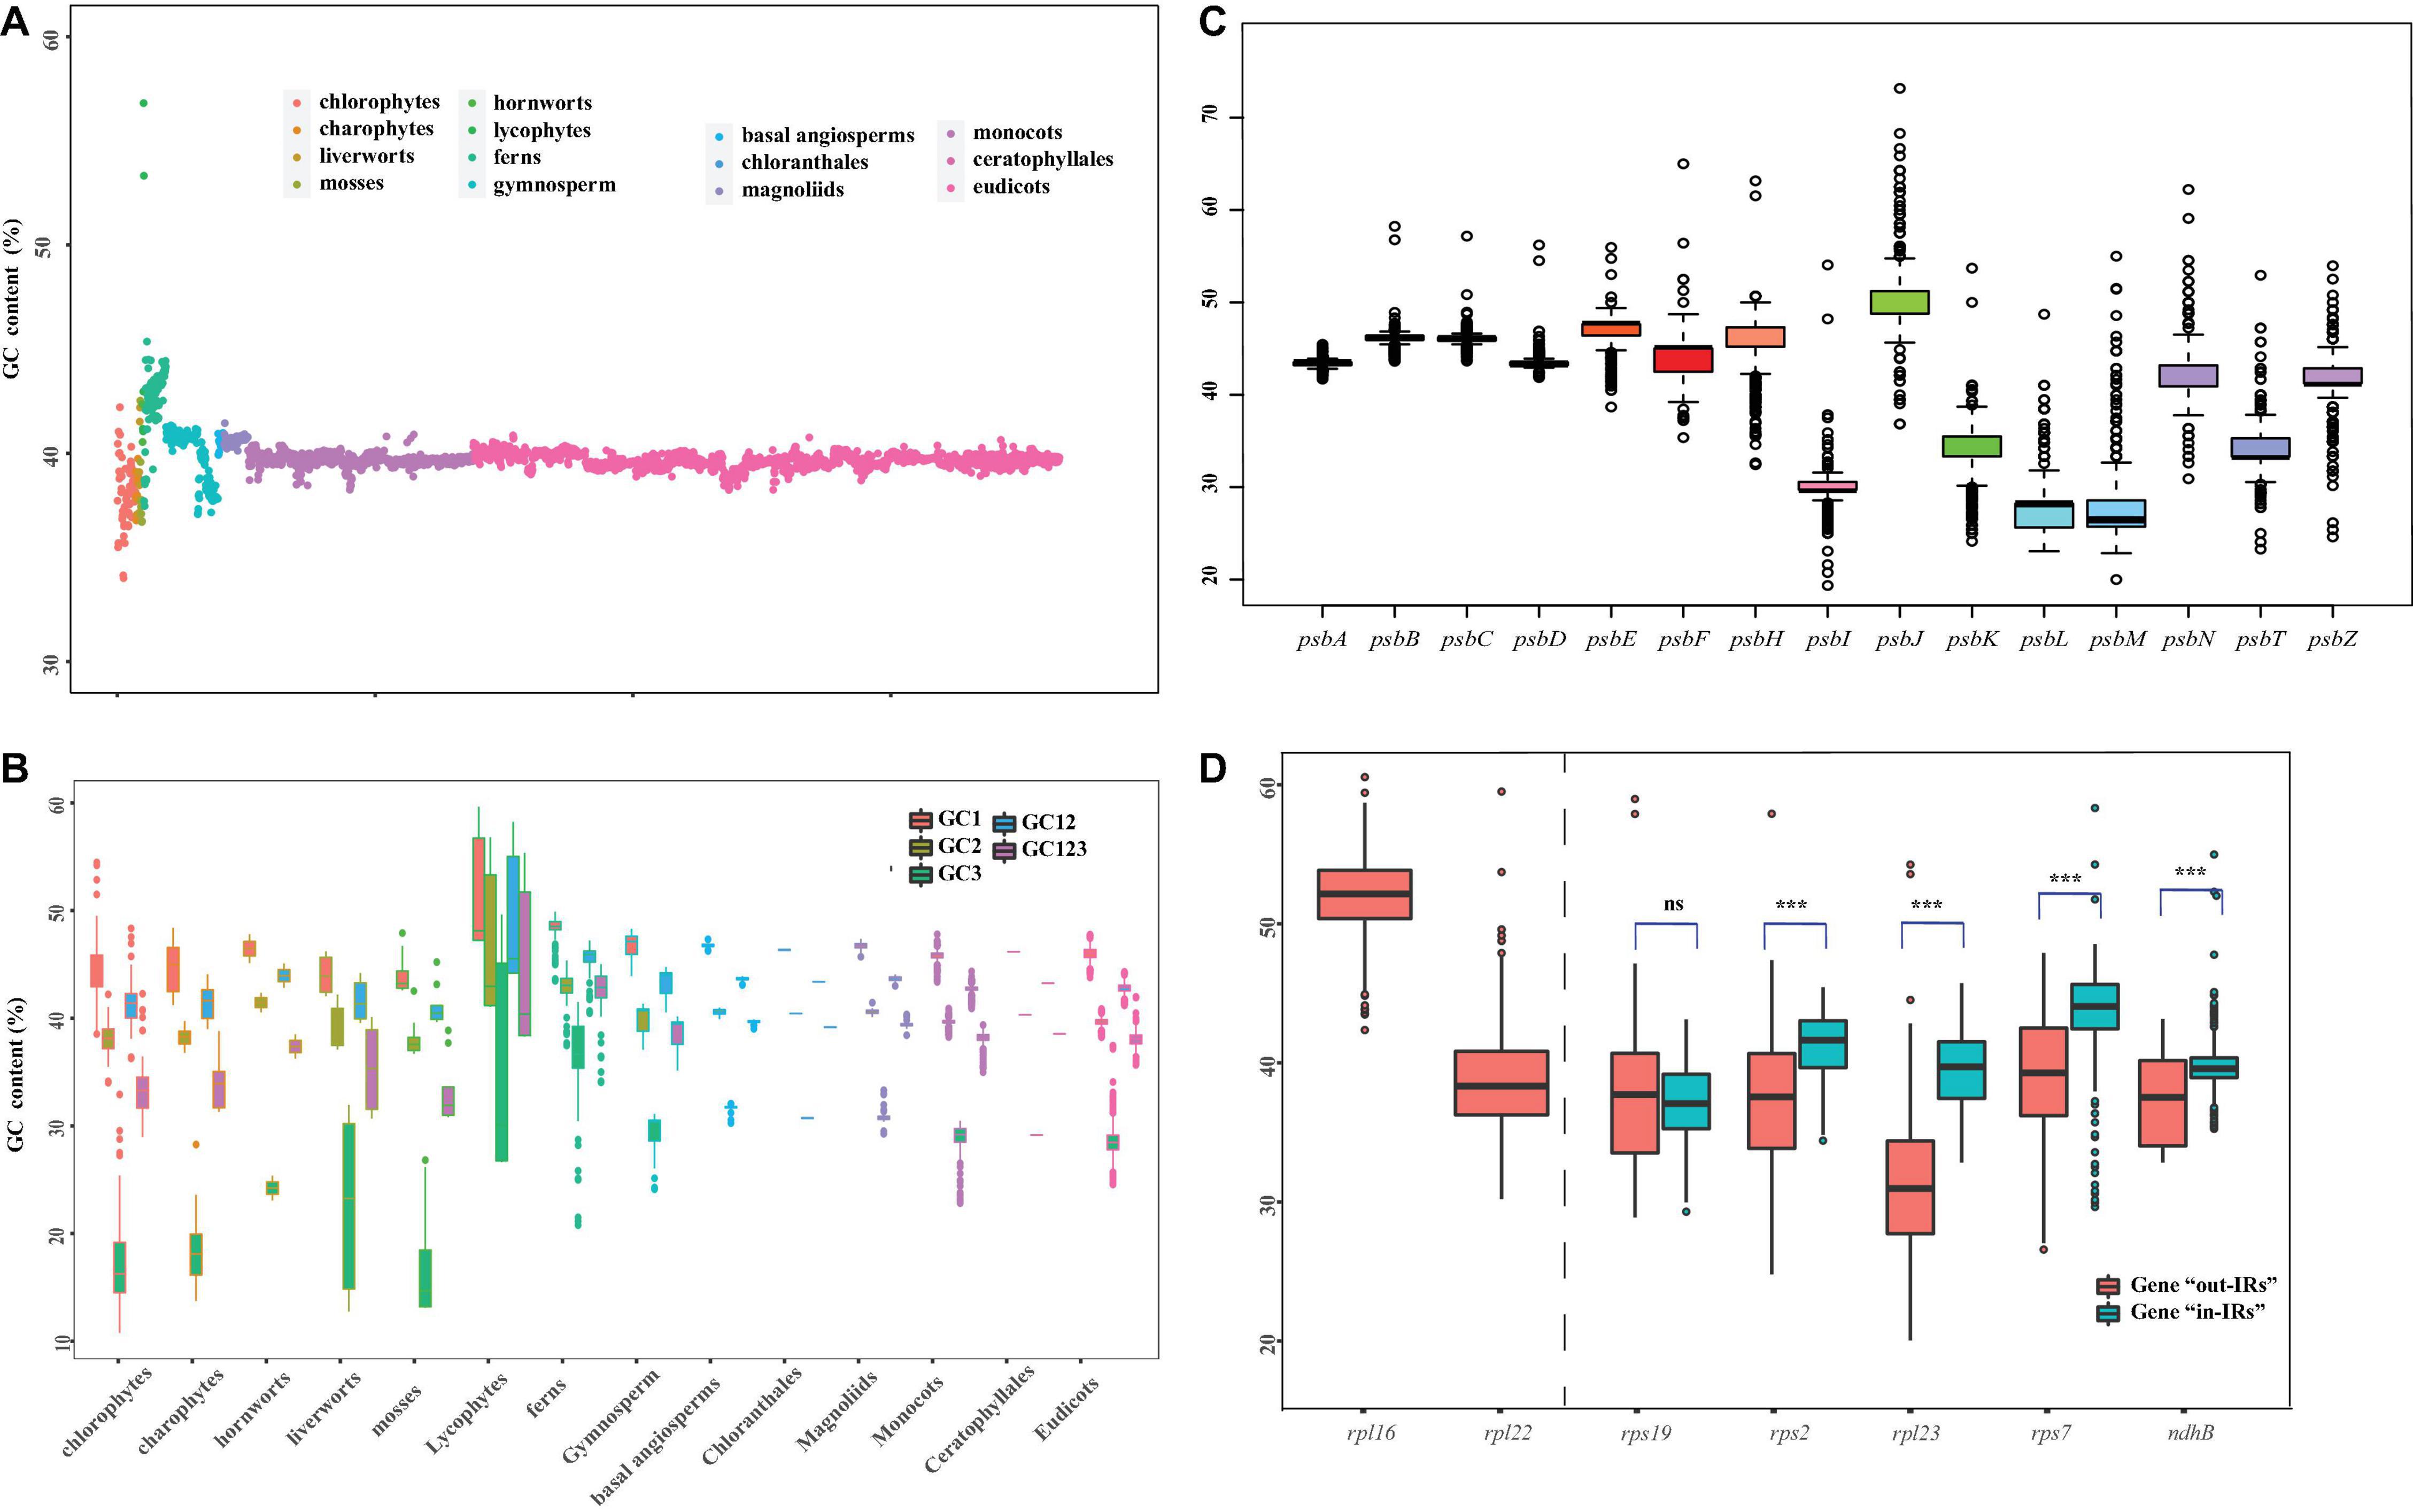
Figure 2. Overview of GC content in Viridiplantae. (A) GC content variation among the 14 major lineages of Viridiplantae. (B) GC content variation based on five sets of 72 protein-coding genes represented by first base (GC1), the second base (GC2), the third base (GC3) of codon, along with GC123 and GC12. (C) GC content variation in psb family genes. (D) GC content variation of five genes located in IR and non-IR region. Boxplots represent minimum, median, and maximum of GC content. Asterisks (*) represent the significant difference from respective genes using Student’s t-test (***p < 0.001); ns = not significant.
Gene Loss/Gain in Plastid Genomes and Dynamic Evolution of Inverted Repeat in Green Plants
Although the genetic content and number of protein-coding genes are generally conserved in the plastid genomes, gene gains and losses have been reported in the previous analyses (Gao et al., 2010; Wicke et al., 2011; Mohanta et al., 2020).
The functional role of ndh genes is intimately connected with the adaptability of terrestrial plants and photosynthesis (Papanikolaou et al., 2009; Martín and Sabater, 2010). In this study, ndh genes were found to be lost in at least 300 species. The ndh genes are absent in all plastid DNAs of chlorophytes except Palmophyllales and Pyramimonadales. With the exception of Pinaceae, Gnetales, Erodium, and most Orchidaceae, the plastid DNAs of Streptophyta contain the ndh genes. However, in Campanulaceae, Ericaceae, and Fabaceae, ndh genes were found to be duplicated. At the same time, except ndh gene family, petN, matK, rpl22, rpl33, rps15, and rps16 were lost in chlorophytes. We found that some genes are more likely to be lost in some streptophytes. For example, infA was absent in 1,825 taxa, and it was more frequently observed among angiosperms, especially in eudicots; ycf1 and accD were missing in more than 800 taxa in angiosperms, especially in monocots; rpl22, rps16, ycf1, ycf4, and infA are widely absent in Fabaceae (Supplementary Table 1). Genes lost from the plastid genome may have moved to the nuclear or been replaced by related proteins, such as infA (Millen et al., 2001), rpl22, and rps16 (Keller et al., 2017), but some are predicted to be indispensable under favorable conditions, such as ndh genes (Ruhlman et al., 2015).
The plastid genomes display a quadripartite structure and carry two identical copies of a large IR in all green plants. Some researchers believed that a pair of large IR could stabilize the plastid genome against major structural rearrangements (Strauss et al., 1988; Wu and Chaw, 2014). IRs in green algae showed large fluctuation in size from 6.8 to 45.5 kb and sustained losses in major groups of green algal. For example, Ulva (Liu and Melton, 2021), Bryopsidales (Cremen et al., 2018), and Chlorellales (Turmel et al., 2009) lack the IR regions. Some members of Ulvophyceae and Ulvales do have IRs which encode the rRNA, but gene contents and gene orders showed greater diversity. Even though the quadripartite structure shows a high degree of conservation in land plants, but the boundaries of IRs changed significantly in the land plants. The acquisitions of genes by IR expansions have repeatedly been documented (e.g., Wang et al., 2008; Zhu et al., 2016). During land plant evolution, the expansion of IRs from the SC regions has occurred at least two times (Waltari and Edwards, 2002). IRs normally contain tRNAs and rRNAs, but we did not annotate tRNA and rRNAs; instead, we mainly focused on six coding genes (rps19, rpl2, rpl23, ndhB, rps7, and rps12) which were widely present in the IRs of angiosperms (Supplementary Table 2). Across land plants, the terminal IR gene (IRA) adjacent to the LSC region was observed to be highly conserved (psbB-psbT-psbN-psbH-petB-petD-rpoA-rps11-rpl36-infA-rps8-rpl14-rpl16-rps3-rpl22) (Supplementary Figure 3). ndhB-rps7-rps12 and rps19-rpl2-rpl23-ndhB-rps7-rps12 were newly acquired in IRs of seed plants and angiosperms, respectively. The rps19-rpl2-rpl23 were conserved in the green plants, but ndhB-rps7-rps12 showed greater variation. With some duplications, ndhB/rps7/rps12 in some hornworts exist at the end of LSC and are connected with IRB. In lycophytes, the IR region showed a minor expansion, where ndhB, rps7, and rps12 were expanded to IRs (the first-time expansion). Notably, for the first time, the exon 2 of rps12; rps7, ndhB; rps7, and exons 2–3 of rps12 and ndhF were added to the IRs of Huperzia, Isoetes, and Selaginella, respectively (Wolf et al., 2005; Mower et al., 2019). Based on the structural evolution of Lycopodiaceae plastome and the position of ndhB, rps7, and rps12, we hypothesized that the IR expansion was associated with structural inversion and duplication of ndhB, rps7, and rps12 near IRB, followed by the inversion into junction between the highly conserved IRA region. In ferns, except rps19-rpl2-rpl23-ndhB-rps7-rps12 block in Marattiales, most orders have ndhB-rps12-rps7-psbA-ycf1 block, which is near the IR regions. In angiosperms, almost all the flowering plants exhibited IR expansion and gained two copies of rps19, rpl2, rpl23, ndhB, rps7, and rps12 (the second-time expansion), especially in Nymphaeales, about nine to 20 genes in LSC expanded into the IRA compared to Amborellales and then were duplicated in the IRB region.
Gene Conservation and Gene Blocks
It is well known that the structure of plastid genomes is conserved and the order (positional arrangement) of genes is relatively consistent in land plants. This opens up the possibility of reconstructing insertions, deletions, and inversions during the evolution of green plants. In this study, 72 protein-coding genes were ordered according to the annotated position. In Arabidopsis thaliana, block analysis has been done based on chloroplast transcriptome expression, and the chloroplast genes are grouped into eight subblocks (Geimer et al., 2008). To calculate the blocks’ frequency in Streptophyta, we first removed the samples that showed similar gene content at the order level and finally obtained 1,517 ptDNA. The blocks’ frequencies are listed in Supplementary Table 3. We found that the classes exhibiting similar functions likely formed gene blocks, with ATP synthase, Phytosystem, and Cytochrome as well as Ribosomal block appearing more than one time with high frequency. Based on the functional categories, there were three major gene blocks. The frequency of ATP synthase block: atpA-atpF-atpH-atpI was 74% and atpE-atpB was 82%; in Phytosystem and Cytochrome: petA-psbJ-psbL-psbF-psbE-petL-petG was 80%, psbB-psbT-psbN-psbH-petB-petD was 85%; and in Ribosomal: rps8-rpl14-rpl16-rps3 was 83%, rpl33-rps18-rpl20 was 82%, and rpoA_rps11_rpl36 was 85%. In monocots and eudicots, we observed three photosystem gene blocks with high frequency: psbM/D/C/Z [60%], psbJ/L/F/E [85%], and psbB/T/N/H [88%]. PsbJ/L/F/E and psbB/T/N/H were nearly conserved in all the green plants and putatively formed blocks: psbB/T/N/H-petB-petD-rpoA-rps11-rpl36 [78%], psbJ/L/F/E-petL-petG-psaJ-rpl33-rps18-rpl20 [76%] in Streptophyta. Interestingly, in A. thaliana, psbB/T/N/H-petB-petD and rps3-rpl22-rps19-rps2-rps23 show similar gene expression pattern, which is quite different from rpoA-rps11-rpl36-rps8-rpl14-rpl16 under various biological conditions (Geimer et al., 2008). However, psbM/D/C/Z block showed the highest variability in Viridiplantae. PsbD and psbC genes encode the D2 and CP43 proteins of the photosystem II complex, and they are generally co-transcribed (Adachi et al., 2011). Similarly, psbM is highly light-sensitive and plays an important role in such conditions; in fact, the knockout of psbM leads to a significant decrease in the activity of photosystem II (Umate et al., 2007). In chlorophytes, psbD/C/Z, psbZ/M, and psbD/C were found to be widely distributed, but in charophytes, only psbD/C/Z block exists. Later in bryophytes, psbZ/C/D and psbM were connected by ATP synthase: atpA/F/H/I. For ferns and horsetails clade, the block of psbM/D/C/Z was formed. In Cycadales, complete psbM/D/C/Z blocks were retained, but psbM and psbD/C/Z were separated in Pinales. In Poaceae, atpA/F/H/I-rps2-petN-psbM was especially inverted, which leads to the production of larger block psbK/I/M/D/C/Z.
Except for gene blocks for specific classes that exhibit similar functions, there were several large blocks having more than one functional category genes that exhibit different frequencies. The largest block: (atpA-atpF-atpH-atpI) - (rps2-petN-psbM) -(psbD-psbC-psbZ) - (rps14-ycf3-rps4) [51%]- (ndbJ-ndhK-ndhC-atpE-atpB-rbcL) [70%] -accD-psaI-(ycf4-cemA-petA-psbJ-psbL-psbF-psbE-petL-petG-psaJ-rpl33-rps18-rpl20) [69%]- (psbB-psbT-psbN-psbH-petB-petD-rpoA-rps11-rpl36) [78%] was found with high frequency in Streptophyta (numbers in [] are the block frequency). In Streptophyta, the block: (psbB-psbT-psbN-psbH-petB-petD) [85%] -(rpoA-rps11-rpl36) [85%]-infA-(rps8-rpl14-rpl16-rps3-rpl22-rps19-rps2-rps23) [61%] widely existed and was located near IR regions. Parts of this block are the S10–spc–alpha operon locus that first appeared in eubacteria (Coenye and Vandamme, 2005). The S10-spc regions in the Euglena and glaucophyte plastids contained rpl23-rpl2-rps19-rpl22-rps3-rpl16-rps17-rpl14-rpl5-rps8 (Figueroa-Martinez et al., 2019), which were identical to that in the E. coli operons (Clark, 2013). Even in prokaryotic genomes (Coenye and Vandamme, 2005), this location in ptDNA might be derived from these prokaryotes to Viridiplantae.
Congruence and Conflict in Phylogenetic Trees
To conduct the phylogenetic analysis, the concatenated alignment of three data sets for the 72 genes from 3,654 species was used with six Rhodophyta as outgroups. There were a total of 44,187 positions for the matrix containing all codon positions (nt123), 29,458 positions for the matrix containing all but the third codon positions (nt12), and 14,724 amino acid (AA) positions. We used two programs: IQ-TREE and RAxML to construct the phylogenetic tree, but they both produced exactly the same topology (Supplementary Figure 10), so we only used IQ-TREE to illustrate our results (Figure 3 and Supplementary Table 4). However, when we compared the phylogenetic clades using all the three data matrices (nt12, nt123, and AA) together, the phylogenetic discordance was observed for Chlorophyceae, Ceratophyllales, magnoliids, lycophytes, and bryophytes. The topologies are summarized in Figures 4, 5, and the details of the phylogenetic trees are provided in Supplementary Figures 4–8.
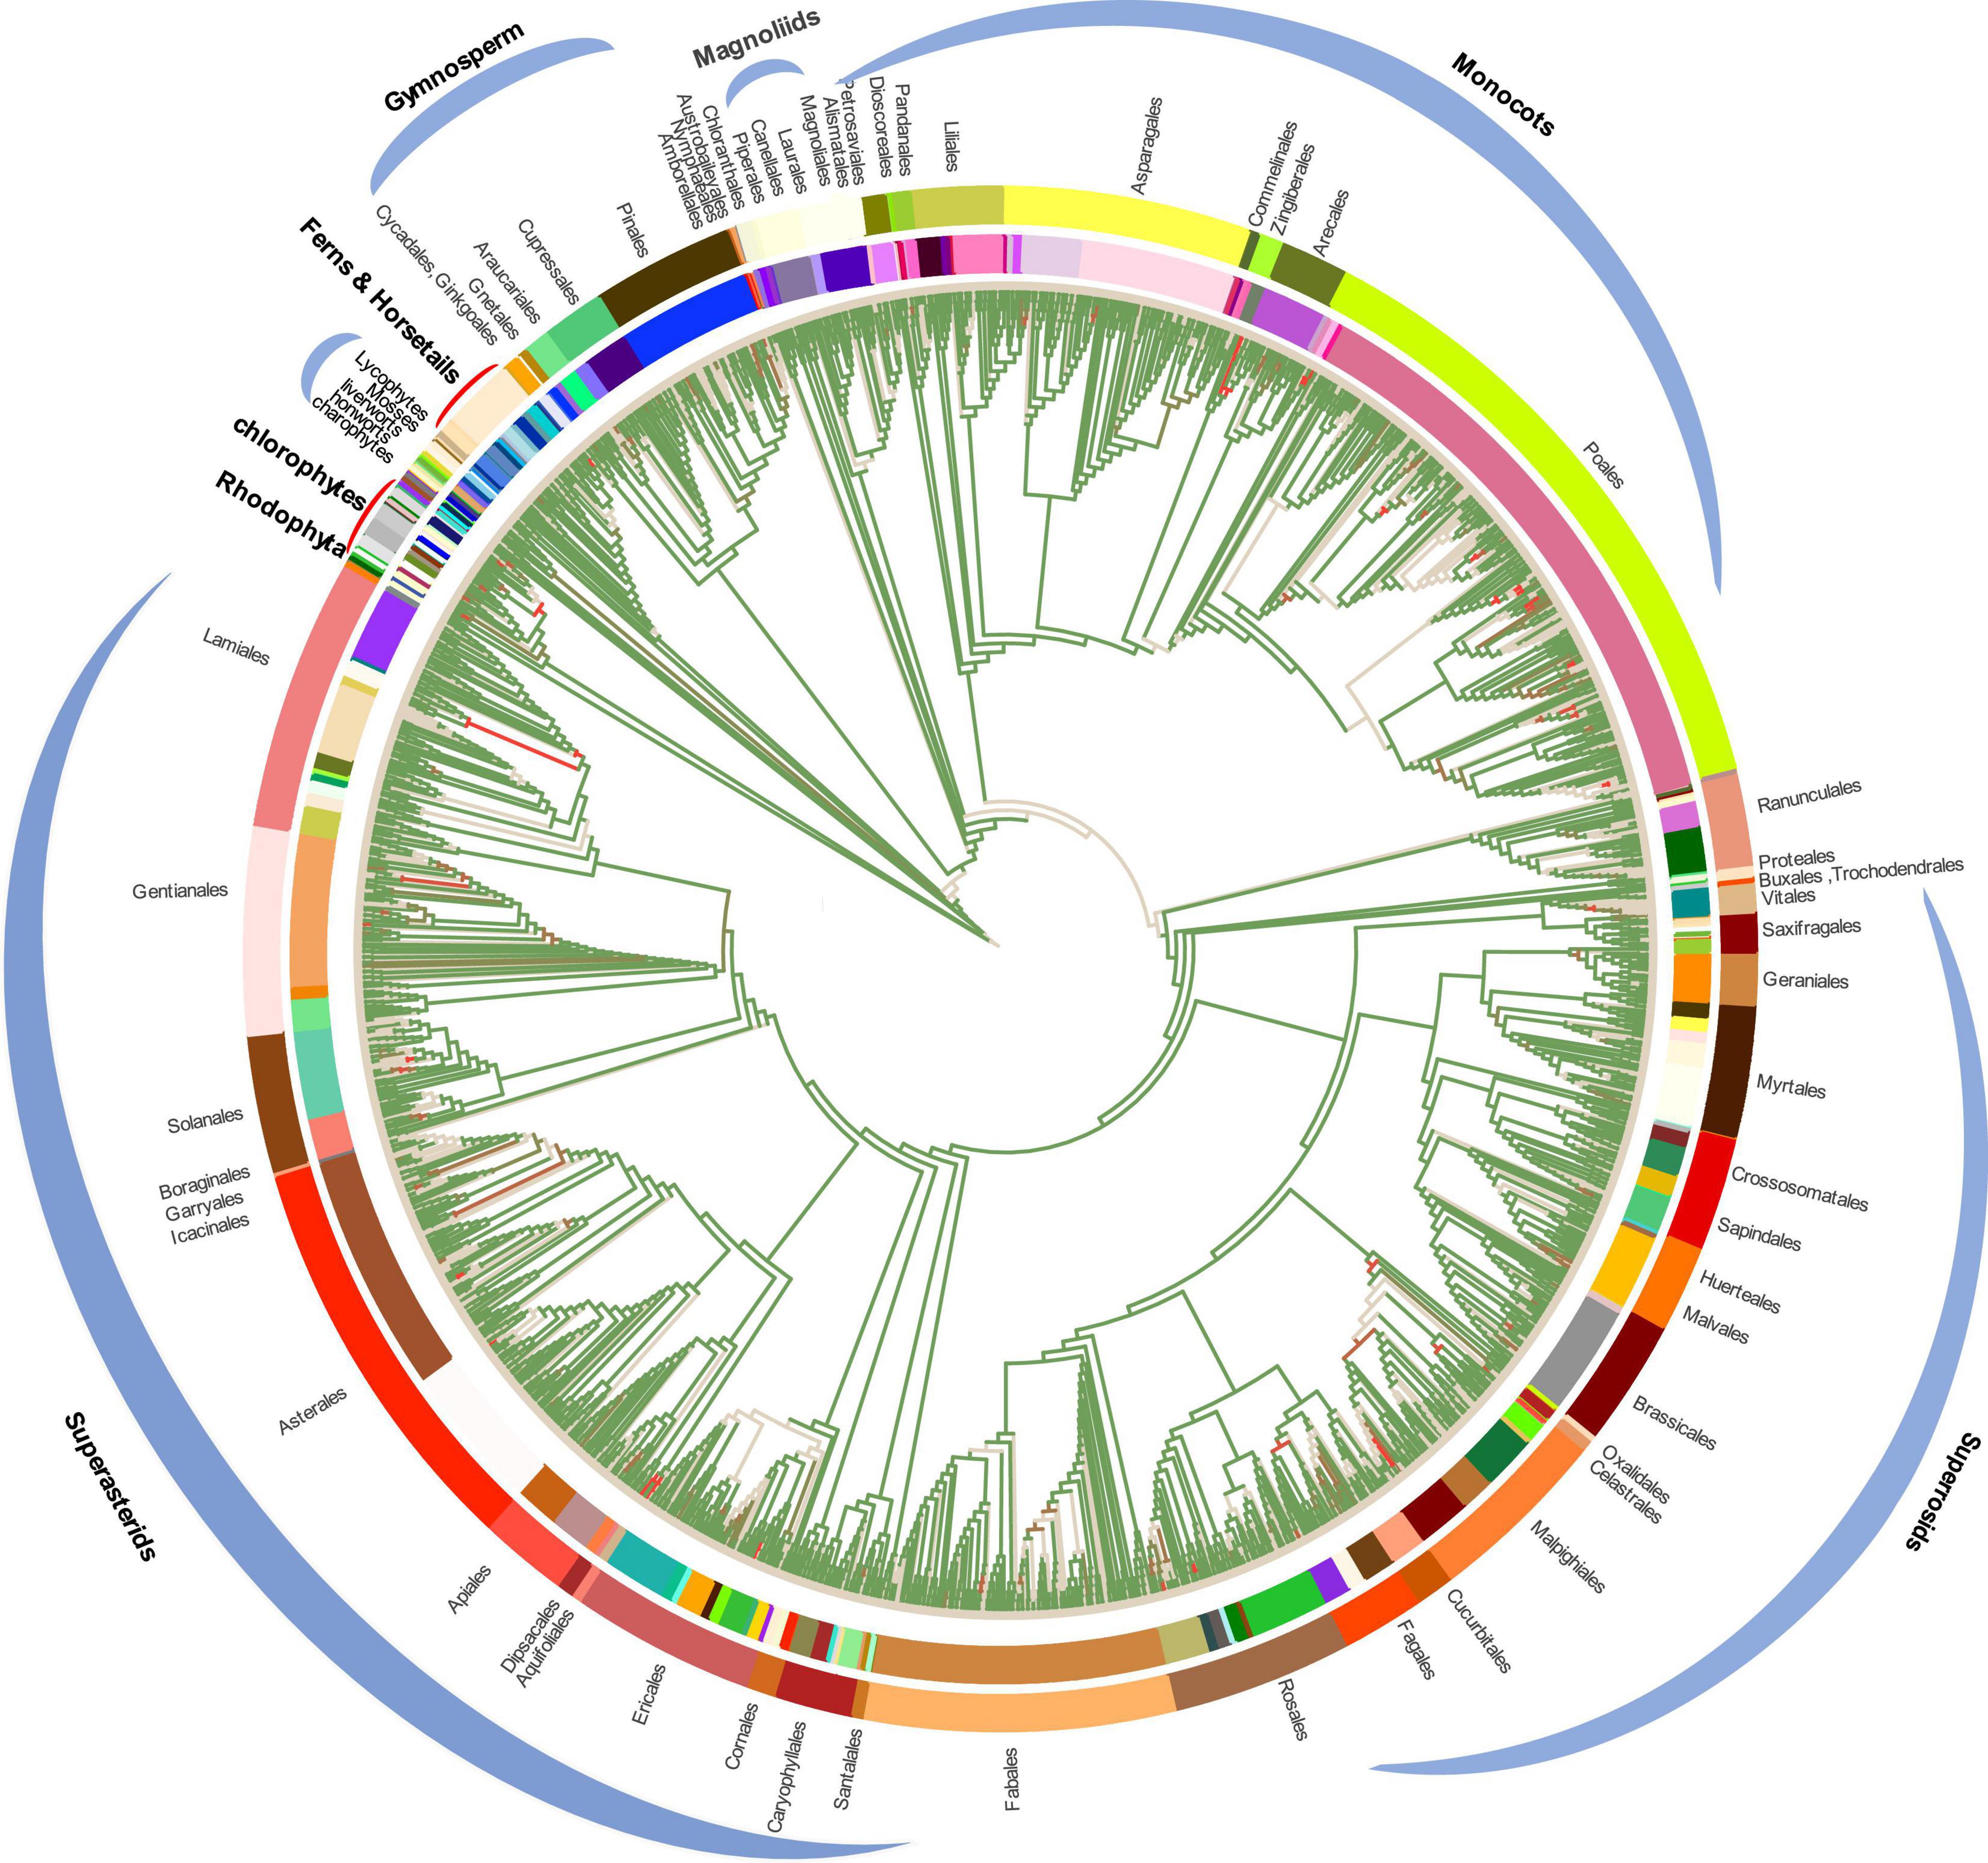
Figure 3. Plastid phylogenomic tree inferred based on the matrix nt12 of 72 protein-coding genes of 3,654 green plants and six Rhodophyta using IQTREE. The colors in the internal circle indicate different families whereas the colors in the external circle indicate different orders (Further details can be found in Supplementary Figure 11). The green branches represent the branch with more than 95% UFboot.
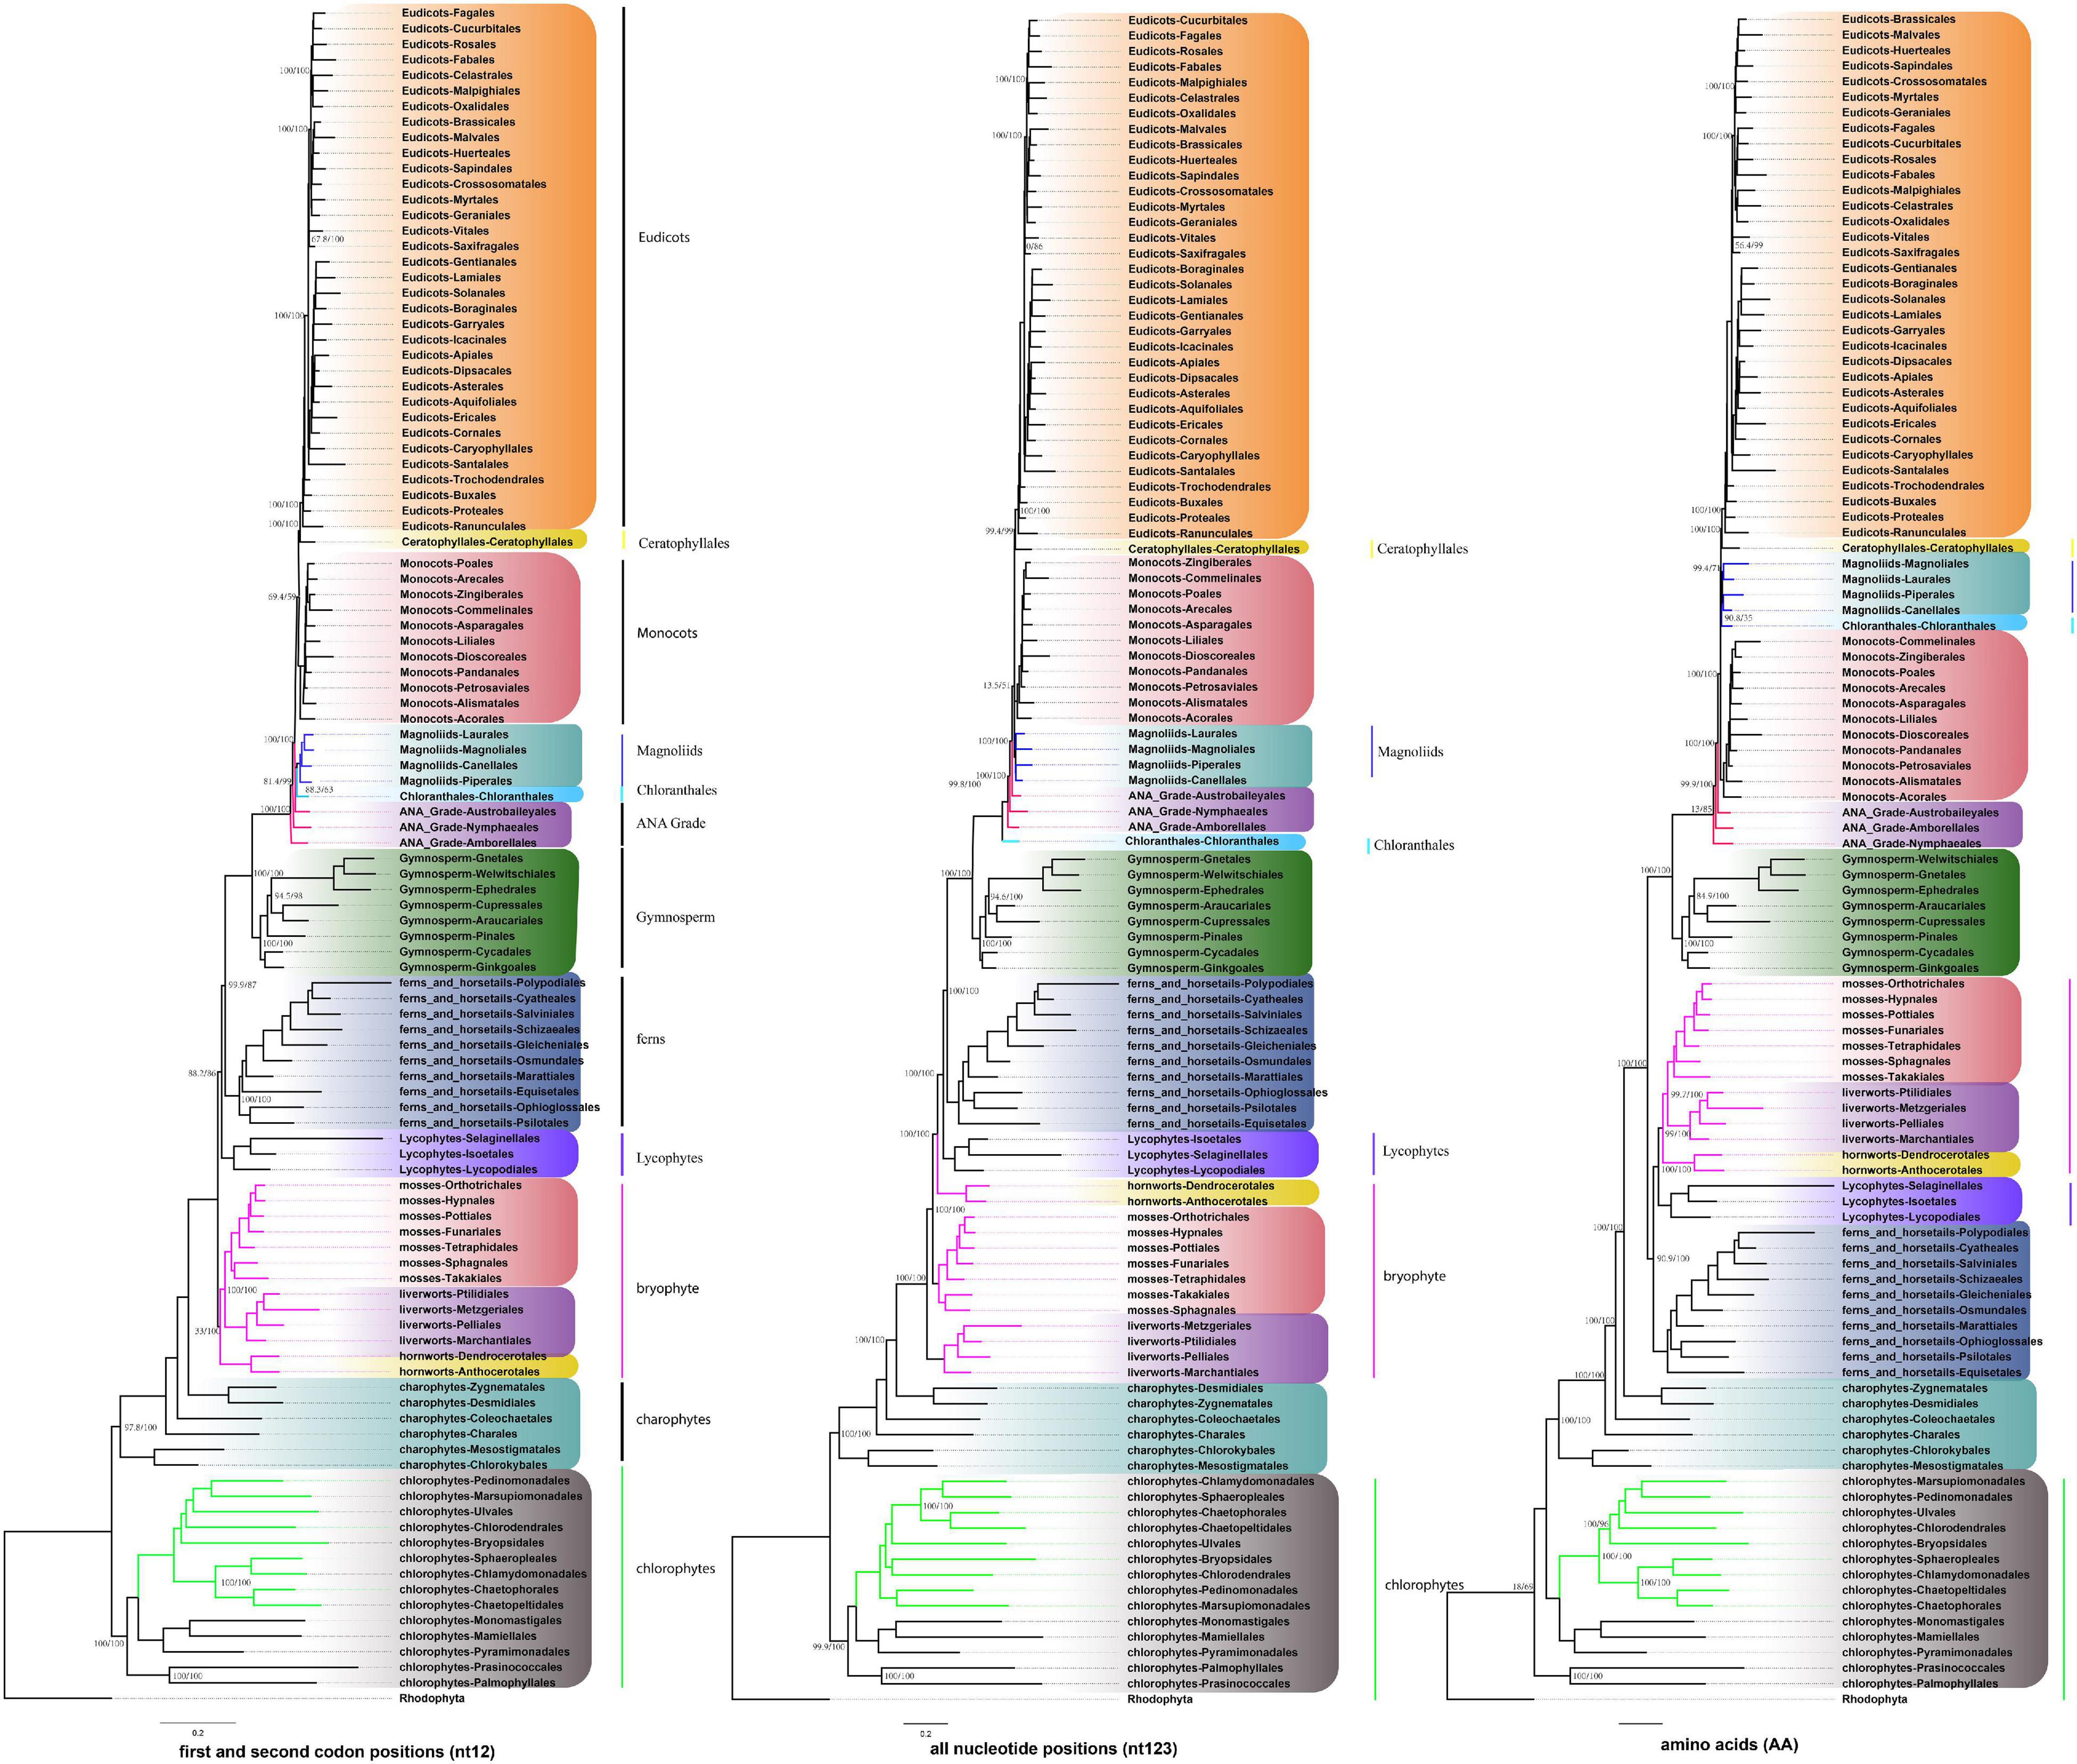
Figure 4. Summary of the phylogenomic tree based on three data sets (nt12, nt123, and AA) of 72 plastid protein-coding genes of 3,654 green plants and six Rhodophyta using IQTREE. The colored branch and vertical lines (on the right side of the tree) represent the clade with conflicting phylogenetic placements based on three data sets. Totally, 631 taxa were obtained by selecting one to three representatives from each family and at least one taxon for the families with fewer taxon sampling, and the tree is represented at the order level in the figure.
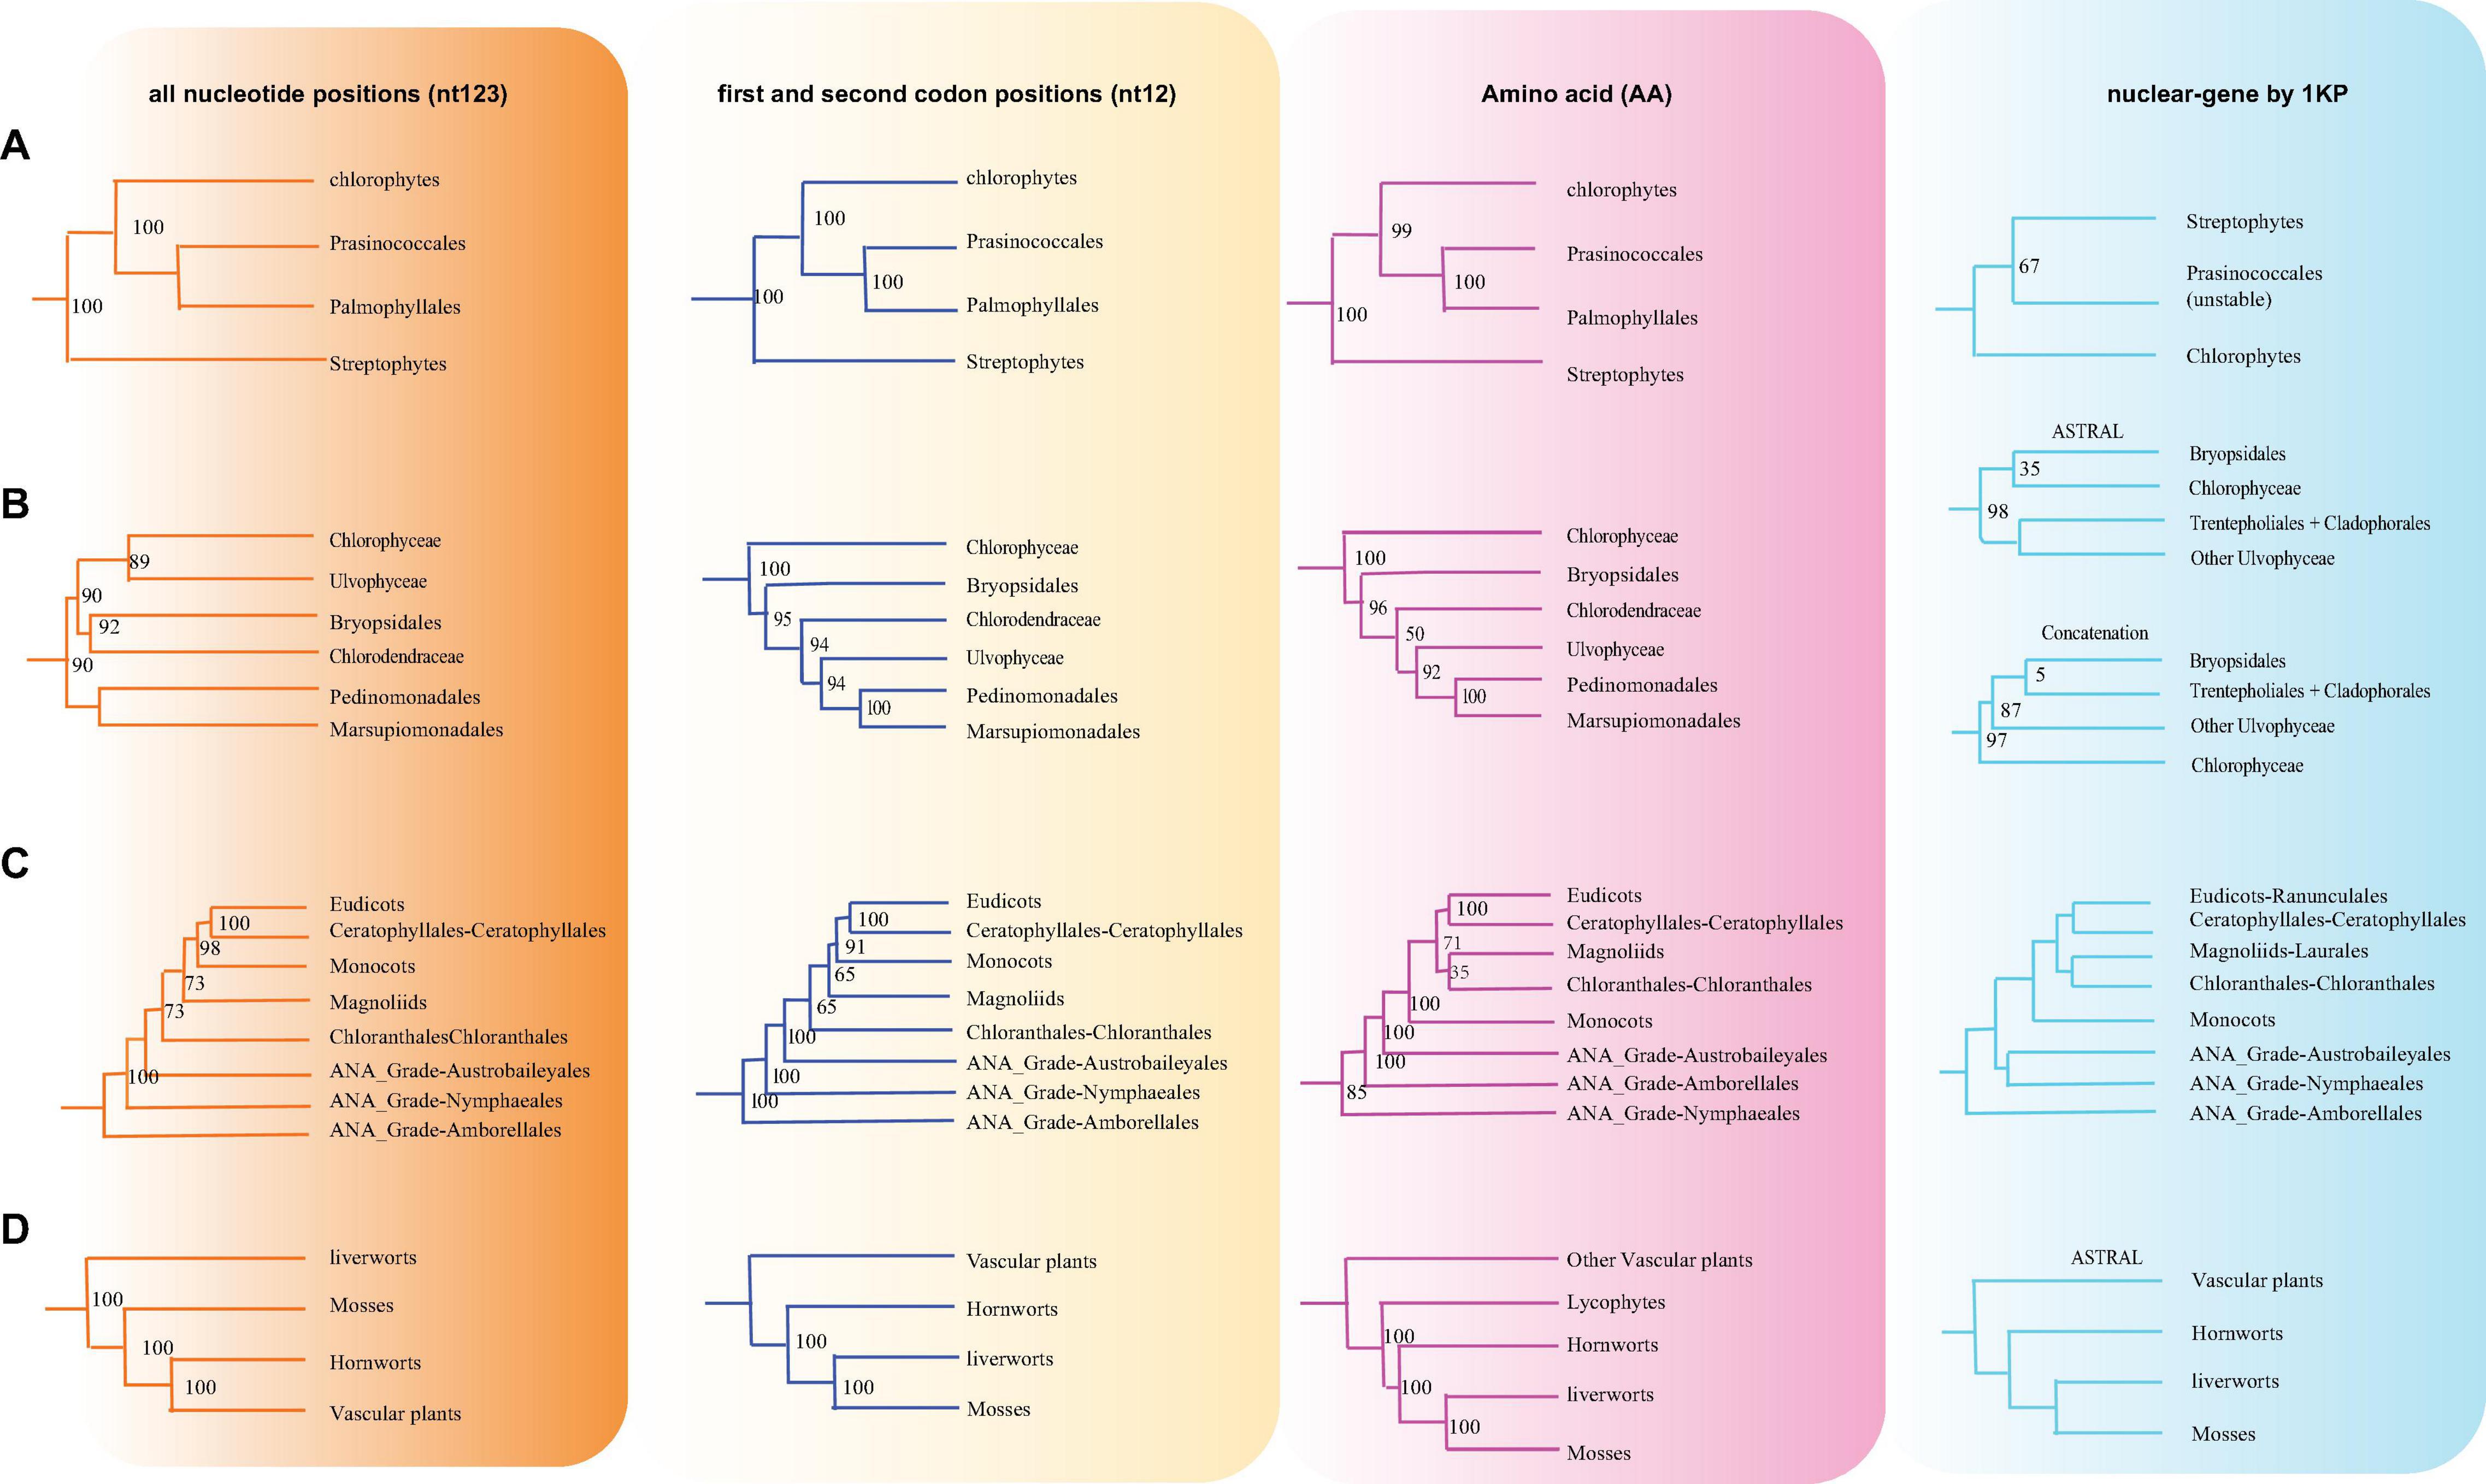
Figure 5. Various branching orders for the phylogenetically discordant relationships. (A) Early Viridiplantae diversification, (B) early diversification of green algae, (C) the lineages of angiosperms, (D) early embryophyte diversification. The summarized topology is based on three data sets (nt12, nt123, and AA) of 72 protein-coding genes of 3,654 green plants and six Rhodophyta using IQTREE, including 1KP data set (nuclear gene-based).
There are two previous plastid-based phylogenetic analyses by Ruhfel et al. (2014) and Gitzendanner et al. (2018) where they used 360 and 1,879 taxa to study the green plants, respectively. In yet another study, by constructing a phylogenetic tree based on 80 genes along with 62 fossil calibration data, Li et al. (2019) predicted that the origin of crown angiosperms occurred in Upper Triassic, whereas other major angiosperms appeared during the Jurassic and Lower Cretaceous period. Recently, Li et al. (2021a) used 4,660 taxa comprising 433 families that nearly include all currently recognized families to produce a reliable relationship of flowering plants. Moreover, chloroplast genes have been extensively utilized to resolve taxonomical controversies of several plant lineages (Pryer et al., 2004; Sahu et al., 2015, 2016; Shen et al., 2017; Li et al., 2019, 2022; One Thousand Plant Transcriptomes Initiative, 2019). Although most topologies of our phylogenetic trees were consistent, there were some differences with the previous reports. For some debated clades, the phylogenetic trees were incongruent based on nt12, nt123, AA, and nuclear data set. The summary of the similarities and conflicts in topologies derived from these four data sets are presented in Figure 5 and Supplementary Table 4.
All the phyla of green plants except charophytes was recovered as monophyletic. Within chlorophytes, the matrix nt12, nt123, and AA supported that Palmophyllales and Prasinococcales are the earliest-diverging lineage of the green plants (UFboot = 100%) (Figure 5A). Chlorophyceae is monophyletic and Ulvophyceae is a non-monophyletic group based on the matrix nt12, nt123, and AA. The matrix nt123 placed the Chlorophyceae as sister to other Ulvophyceae. The ASTRAL trees by both 1 KP (One Thousand Plant Transcriptomes Initiative, 2019), and Li et al. (2021b) supported the Chlorophyceae as sister to Ulvophyceae II (Bryopsidales) (Figure 5B). During the evolution of Streptophyta, charophyte lineages formed a paraphyletic assemblage with the land plants. Chlorokybales + Mesostigmatales are the earliest-branching lineage, and a clade of Zygnematales + Desmidiales is the sister group to the land plants, which is similar to the previous analyses, which includes the results from 1 KP (one thousand plant transcriptomes) project (Leliaert et al., 2012; Lemieux et al., 2016; Li et al., 2020).
Within Euphyllophyta, in the matrix nt12 and nt123, a well-supported Monilophyta was found to be a sister to Spermatophyta (UFboot = 100%), but the matrix AA indicated that Monilophyta is sister to bryophytes (UFboot = 100%). Within Monilophyta, matrix nt12 supported Ophioglossales as the earliest-diverging lineage (UFboot = 100%), while matrix nt123 supported Equisetales as the earliest branch (UFboot = 100%). A recent analysis of non-synonymous nucleotide data and translated amino acid data from 83 chloroplast genes across 30 taxa suggests that bryophytes are monophyletic (Sousa et al., 2020). Based on the AA analysis, Gitzendanner et al. (2018) recovered bryophyte clade as monophyletic. In our matrix AA analysis, we found bryophyte + lycophytes as sister to ferns (UFboot = 100%). With matrix nt123, hornworts, mosses, and liverworts were identified as the successive sister lineages of tracheophytes (UFboot = 100%). With matrix nt12, bryophytes were identified as monophyletic and positioned as sister to the vascular plants (Figure 5D), whereas 1KP also recovered extant bryophyte as monophyletic as per ASTRAL analysis based on the nuclear genes.
Both of these topologies were well supported by the previous research (Nickrent et al., 2000; Sugiura et al., 2004). It should be noted that the third codon position likely has a much faster rate of evolution and has reached the saturation level causing the variations in the phylogenetic tree (Simmons et al., 2006).
Within Spermatophyta, gymnosperms were designated as sister to angiosperms. Moreover, within gymnosperms, the subclades were well supported in all three data sets. The Cycadales + Ginkgoales clades were identified as sisters to the rest of the gymnosperms. The Gnetales, Welwitschiales along with Ephedrales, formed a clade (UFboot = 100%), which are sisters to the clade comprising Cupressales and Araucariales were not congruent with nuclear gene trees. In the 1KP project, the supermatrix of 410 single-copy nuclear gene family supports Gnetales as sister to Pinales, while coalescent analyses strongly support Gnetales sister to conifers (Araucariales, Cupressales and Pinales) (One Thousand Plant Transcriptomes Initiative, 2019).
Within angiosperms, in matrix nt12 and nt123, the Amborellales were recovered as the sister to all other angiosperms, followed by Nymphaeales. Nevertheless, Nymphaeales were placed as sisters to the remaining angiosperms based on the matrix AA (UFboot = 85%). Magnoliids were placed outside of the monocots in matrix nt123 and nt12 (UFboot = 100%), but based on the maxtrix AA, magnoliids and Chloranthales formed a sister clade to Ceratophyllales + eudicot (Figure 5C), which was consistent with the previous analyses (Guo et al., 2021). However, when we combined the data set from the study of Gitzendanner et al. (2018) with our AA sequences, magnoliids moved outside of the monocots (UFboot = 95%). Ruhfel et al. (2014) recovered Ceratophyllales as sister to the monocots using matrix nt12 with low support (BS = 52%). It should be noted that these discrepancies in tree topologies can be also attributable to biological phenomena like incomplete lineage sorting (ILS) and hybridization, as well as methodological challenges such as incorrect substitution model selection (Sousa et al., 2020; Yang et al., 2020; Guo et al., 2021). The relationship between COM clade supported Oxalidales as sister to Celastrales + Malpighiales. The major subclades were typically well supported in monocots and eudicots, but the position of Vitales, Gentianales, Petrosaviales, and Arecales remained uncertain. To further verify our phylogenetic analysis, the amino acid data from the study of Gitzendanner et al. (2018) were included, and the results showed that the species belonging to the same orders clustered together, and the topology of the major clade was consistent with the matrix nt12 (Supplementary Figure 9).
Conclusion
By performing a large-scale comparative analysis of 3,654 plastid genomes, we attempted to understand the evolution of plastome structure and gene content of green plants and revisited some long-standing uncertainties in green plant phylogeny. The structure of plastid genomes was mostly consistent in green plants and formed several gene blocks except in chlorophytes. We discovered that classes with similar functions likely constituted gene blocks. Some major genes such as the psb family probably coexisted in Viridiplantae and formed gene blocks. IR genes have doubled in size across terrestrial plants, and their GC content is substantially higher than that of non-IR genes. Regarding the green plant tree of life, more extensive taxon sampling indeed increased the phylogenetic resolution for some controversial clades. Our phylogenomic analyses have shown Chlorokybales + Mesostigmatales as the earliest branching lineages of streptophytes, and Zygnematales + Desmidiales were identified as the sister group of the embryophytes. In general, for some controversial clades that are deep within green plants, such as, bryophytes, dense taxon sampling did not improve phylogenetic accuracy anymore. Thus, to resolve the controversial deep-level clades, simply an increased taxon sampling may not be necessary or enough. In addition, plastid genome analysis alone seems unlikely to solve the relationship of these controversial clades (Ceratophyllales/Chloranthales). Using large numbers of nuclear genes or selecting the nuclear genes with stronger phylogenetic signals may help to answer these deep-level questions in the future studies.
Materials and Methods
Taxon Sampling
We sampled 3,654 species including 3,648 representatives of green plants from 111 orders, 298 families, and six species of Rhodophyta as outgroups. The core chlorophyte clades, ferns and bryophytes, Mesangiospermae (comprising magnoliids, Chloranthales, monocots, Ceratophyllum, and Eudicots) were mainly focused in this study. We source our data from 3,246 published green plants plastid genomes from GenBank (as of January 18, 2019) and 731 previously generated plastomes from Ruili Botanical Garden (Liu et al., 2019). For multiple plastomes of the same taxon, we chose the plastome with a circular structure and a complete plastid genome. To make sure the high-quality data sets, we removed any species that had more than 50% gene missing in the same family. A total of six poorly annotated species (Monoraphidium neglectum, CM002678; Nothoceros aenigmaticus, NC-020259; Nymphaea ampla, NC-035680; Allium sativum, NC-031829; Bambusa oldhamii, NC-012927, and Potentilla micrantha, HG931056) were subjected to re-annotation with GeneWise v2.4.1 (Birney and Durbin, 2000). The complete list and the detailed information of 3,654 plastid genomes are provided in Supplementary Table 1.
Sequence Alignment
DNA sequences of protein-coding genes were extracted from each genome sequence according to the annotation files. Each protein-coding gene was processed individually with TranslatorX (Abascal et al., 2010) using MAFFT v7.310 (Katoh et al., 2002) to align the amino acid sequences and generated the corresponding nucleotide alignments, while poorly aligned positions were trimmed by TrimAl v1.1 (Capella-Gutiérrez et al., 2009) with the gappyout option. A total of seven genes: ndhF, psaA, psaB, rpoB, rpoC1, rpoC2, and ycf2 had no information regarding gene annotation (Liu et al., 2019), and the genes with more than 50% missing alignment position were excluded from phylogenetic reconstruction. Both nucleotide and amino acid alignments of protein-coding genes were used for subsequent phylogenetic analyses.
Phylogeny and Gene Block Analyses
To evaluate the utility of the phylogenetic software, maximum likelihood (ML) analyses were both performed with IQ-TREE v1.6.10 (Nguyen et al., 2014) and RAxML v8.2.4 (Stamatakis, 2014). The best substitution models were identified based on the corrected Akaike information criterion (AICc) using ModelFinder embedded in IQ-TREE, and with 5,000 ultrafast bootstrap (UFboot) replicates, together with GTR + F + R10 model for nucleotide sequences and JTT + F + R10 model for amino acid sequences.1 ML analysis was also conducted using RAxML under the GTRCAT model for nucleotide and PROTGAMMAWAG model for amino acids, and the 100 bootstrap replicates were set to test the reliability of each node for RAxML.
The concatenated alignment comprising of 72 nucleotide genes was generated at the nucleotide level, and ML analyses were carried out using IQ-TREE with 5,000 UFboot replicates, together with GTR + F + R10 model. The coalescent analyses of 72 nucleotide genes were also preformatted and compared with the tree from concatenation analyses. Each gene tree was constructed using IQ-TREE with 5,000 UFboot replicates, but with best substitution model which was calculated by ModelFinder embedded in IQ-TREE. Based on the AICc, the species tree was detected from 72 gene trees by ASTRAL v4.11.1 (Mirarab et al., 2014).
To further evaluate the backbone relationships of the green plant’s phylogeny, we assembled a smaller subset of 631 taxa derived from the complete taxon sampling. These 631 taxa were obtained by selecting one to three representatives from each family and at least one taxon for the families with fewer taxon sampling. The sequences of protein-coding genes were aligned and trimmed as above. ML analyses were only conducted with IQ-TREE under the partitioning scheme. The optimal partitioning schemes and best-fitting models of each scheme were determined with PartitionFinder v2 (Lanfear et al., 2012) based on AICc, and separate partitioning by gene was defined as the default.
To verify the topologies of the phylogenetic tree, the amino acid sequences of 72 genes of 1,901 samples in former research (Gitzendanner et al., 2018) were downloaded to analyze along with our data using the IQ-TREE. The Tree_doctor v1.3 (Hubisz et al., 2011) was used to obtain the simplified trees at order levels. The species of Rhodophyta was set as outgroups to re-root the result, and the iTOL2 was used for data visualization.
Gene Block and Frequency Analyses
Based on transcript expression levels of plastid genes in Arabidopsis, the plastid genes are classified into eight clusters (Geimer et al., 2008). Although, the clustered genes likely belong to the same functional categories, whether these genes are also in the same position along the genome remains elusive. Therefore, we chose 1,517 complete ptDNA, compared the gene order in the same region of the ptDNA, and calculated the block frequency (Supplementary Table 3).
Data Availability Statement
The original contributions presented in the study are included in the article/Supplementary Material, further inquiries can be directed to the corresponding author/s.
Author Contributions
BZ and HL: conceptualization. SS and WM: data curation. TY, SS, and WM: formal analysis. XL and HL: funding acquisition and project administration. TY: investigation and visualization. TY and SS: methodology and writing—original draft. MS, BZ, and HL: supervision. TY, SS, YL, LY, MS, BZ, and HL: writing, reviewing, and editing. All authors contributed to the article and approved the submitted version.
Funding
This work was supported by the National Key R&D Program of China (No. 2019YFC1711000), the National Natural Science Foundation of China (Nos. 32122010 and 31970229), the Shenzhen Municipal Government of China (No. JCYJ20170817145512476), the Guangdong Provincial Key Laboratory of Genome Read and Write (No. 2017B030301011), the NMPA Key Laboratory for the Rapid Testing Technology of Drugs, Collection of crop genetic resources research and application, BGI-Shenzhen, Shenzhen 518120, China (No. 2011A091000047), and Key Laboratory of Genomics, Ministry of Agriculture, BGI-Shenzhen, Shenzhen 518120, China, and Collaborative Innovation Center for Modern Crop Production co-sponsored by Province and Ministry. This study was a part of the 10KP project (https://db.cngb.org/10kp/). This work was also supported by China National GeneBank (CNGB; https://www.cngb.org/).
Conflict of Interest
TY, SS, YL, WM, XL, and HL were employed by the company Beijing Genomics Institute (BGI-Shenzhen).
The remaining authors declare that the research was conducted in the absence of any commercial or financial relationships that could be construed as a potential conflict of interest.
Publisher’s Note
All claims expressed in this article are solely those of the authors and do not necessarily represent those of their affiliated organizations, or those of the publisher, the editors and the reviewers. Any product that may be evaluated in this article, or claim that may be made by its manufacturer, is not guaranteed or endorsed by the publisher.
Acknowledgments
We sincerely thank Susann Wicke for her helpful suggestions and inputs on an earlier draft of the manuscript.
Supplementary Material
The Supplementary Material for this article can be found online at: https://www.frontiersin.org/articles/10.3389/fpls.2022.808156/full#supplementary-material
Supplementary Figure 1 | The gene constitution in the green plants. In the heat map, the data are displayed in a grid where each row represents order and each column represents average gene number in the order.
Supplementary Figure 2 | Overview of GC content in psb family.
Supplementary Figure 3 | Coding genes in IRs in Streptophyta. Coding genes in IRs and upstream are shown in blue and yellow, respectively.
Supplementary Figure 4 | Chloroplast phylogenomic tree based on the matrix nt123 of 72 protein-coding genes of 3,654 green plants and six Rhodophyta using IQTREE. The colors on the internal circle indicate different families, while the colors on the external circle indicate different orders.
Supplementary Figure 5 | Chloroplast phylogenomic tree based on the matrix aa of 72 protein-coding genes of 3,654 green plants and six Rhodophyta using IQTREE. The colors on the internal circle indicate different families while the colors on the external circle indicate different orders.
Supplementary Figure 6 | Chloroplast phylogenomic tree based on the matrix nt12 of 72 protein-coding genes of 3,654 green plants using RaXML. The colors on the internal circle indicate different families while the colors on the external circle indicate different orders.
Supplementary Figure 7 | Chloroplast phylogenomic tree based on the matrix nt123 of 72 protein-coding genes of 3,654 green plants using RaXML. The colors in the internal circle indicate different families while the colors in the external circle indicate different orders.
Supplementary Figure 8 | Chloroplast phylogenomic tree based on the matrix aa of 72 protein-coding genes of 3,654 green plants and 1,901 species in the former research using IQTREE. The colors on the internal circle indicate different families while the colors on the external circle indicate different orders.
Supplementary Figure 9 | Summary of the phylogenomic tree based on matrix aa of 72 protein-coding genes of 3,654 green plants and 1,901 species obtained from earlier reports using IQTREE.
Supplementary Table 1 | The detailed information and characters of the species used in this study, including species information (species name, genus, family, order, data source), genome size, GC content, gene number, and intron number.
Supplementary Table 2 | The conserved gene order among Streptophyta. Different colors represent different genes.
Supplementary Table 3 | The gene blocks frequency in Streptophyta. The first column represents the gene block, and the second column is the number of times the gene block was observed in 1,517 ptDNA.
Supplementary Table 4 | Description of hexadecimal colors is used in Supplementary Figures 6–8.
Footnotes
References
Abascal, F., Zardoya, R., and Telford, M. J. (2010). TranslatorX: multiple alignment of nucleotide sequences guided by amino acid translations. Nucleic Acids Res. 38, W7–W13. doi: 10.1093/nar/gkq291
Adachi, Y., Kuroda, H., Yukawa, Y., and Sugiura, M. (2011). Translation of partially overlapping psbD-psbC mRNAs in chloroplasts: the role of 5′-processing and translational coupling. Nucleic Acids Res. 40, 3152–3158. doi: 10.1093/nar/gkr1185
Arias-Agudelo, L. M., González, F., Isaza, J. P., Alzate, J. F., and Pabón-Mora, N. (2019). Plastome reduction and gene content in New World Pilostyles (Apodanthaceae) unveils high similarities to African and Australian congeners. Mol. Phylogen. Evol. 135, 193–202. doi: 10.1016/j.ympev.2019.03.014
Bellot, S., Renner, S. S., and Evolution. (2016). The plastomes of two species in the endoparasite genus Pilostyles (Apodanthaceae) each retain just five or six possibly functional genes. Genome Biol. 8, 189–201. doi: 10.1093/gbe/evv251
Birney, E., and Durbin, R. (2000). Using GeneWise in the Drosophila annotation experiment. Genome Res. 10, 547–548. doi: 10.1101/gr.10.4.547
Braukmann, T., Kuzmina, M., and Stefanović, S. (2013). Plastid genome evolution across the genus Cuscuta (Convolvulaceae): two clades within subgenus Grammica exhibit extensive gene loss. J. Exp. Bot. 64, 977–989. doi: 10.1093/jxb/ers391
Brázda, V., Lýsek, J., Bartas, M., and Fojta, M. (2018). Complex Analyses of Short Inverted Repeats in All Sequenced Chloroplast DNAs. BioMed Res. Int. 2018, 1–10. doi: 10.1155/2018/1097018
Brouard, J.-S., Otis, C., Lemieux, C., and Turmel, M. (2010). The exceptionally large chloroplast genome of the green alga Floydiella terrestris illuminates the evolutionary history of the Chlorophyceae. Genome Biol. Evol. 2, 240–256. doi: 10.1093/gbe/evq014
Burleigh, J. G., and Mathews, S. (2004). Phylogenetic signal in nucleotide data from seed plants: implications for resolving the seed plant tree of life. Am. J. Bot. 91, 1599–1613. doi: 10.3732/ajb.91.10.1599
Capella-Gutiérrez, S., Silla-Martínez, J. M., and Gabaldón, T. (2009). trimAl: a tool for automated alignment trimming in large-scale phylogenetic analyses. Bioinformatics 25, 1972–1973. doi: 10.1093/bioinformatics/btp348
Chen, S., Zhang, H., Wang, X., Zhang, Y., Ruan, G., and Ma, J. (2021). Analysis of Codon Usage Bias in the chloroplast genome of Helianthus annuus J-01. IOP Conf. Series 792:012009. doi: 10.1088/1755-1315/792/1/012009
Chen, X., Fang, D., Wu, C., Liu, B., Liu, Y., Sahu, S. K., et al. (2020). Comparative plastome analysis of root-and stem-feeding parasites of Santalales untangle the footprints of feeding mode and lifestyle transitions. Genome Biol. Evol. 12, 3663–3676. doi: 10.1093/gbe/evz271
Choi, I.-S., Jansen, R., and Ruhlman, T. (2019). Lost and found: return of the inverted repeat in the legume clade defined by its absence. Genome Biol. Evol. 11, 1321–1333. doi: 10.1093/gbe/evz076
Chumley, T. W., Palmer, J. D., Mower, J. P., Fourcade, H. M., Calie, P. J., Boore, J. L., et al. (2006). The complete chloroplast genome sequence of Pelargonium× hortorum: organization and evolution of the largest and most highly rearranged chloroplast genome of land plants. Mol. Biol. Evol. 23, 2175–2190. doi: 10.1093/molbev/msl089
Clark, M. S. (2013). Plant molecular biology—a laboratory manual. Berlin: Springer Science & Business Media.
Coenye, T., and Vandamme, P. (2005). Organisation of the S10, spc and alpha ribosomal protein gene clusters in prokaryotic genomes. FEMS Microbiol. Lett. 242, 117–126. doi: 10.1016/j.femsle.2004.10.050
Cremen, M. C. M., Leliaert, F., Marcelino, V. R., and Verbruggen, H. (2018). Large diversity of nonstandard genes and dynamic evolution of chloroplast genomes in siphonous green algae (Bryopsidales, Chlorophyta). Genome Biol. 10, 1048–1061. doi: 10.1093/gbe/evy063
Eckardt, N. A. (2006). Genomic Hopscotch: Gene Transfer from Plastid to Nucleus. Plant Cell 18, 2865–2867. doi: 10.1105/tpc.106.049031
Fang, L., Leliaert, F., Zhang, Z.-H., Penny, D., and Zhong, B.-J. (2017). Evolution of the Chlorophyta: insights from chloroplast phylogenomic analyses. J. Syst. Evol. 55, 322–332. doi: 10.1111/jse.12248
Figueroa-Martinez, F., Jackson, C., and Reyes-Prieto, A. (2019). Plastid genomes from diverse glaucophyte genera reveal a largely conserved gene content and limited architectural diversity. Genome Biol. Evol. 11, 174–188. doi: 10.1093/gbe/evy268
Gao, L., Su, Y. J., and Wang, T. (2010). Plastid genome sequencing, comparative genomics, and phylogenomics: current status and prospects. J. Syst. Evol. 48, 77–93. doi: 10.1111/j.1759-6831.2010.00071.x
Geimer, S., Meurer, J., and Cho, W. K. (2008). Cluster Analysis and Comparison of Various Chloroplast Transcriptomes and Genes in Arabidopsis thaliana. DNA Res. 16, 31–44. doi: 10.1093/dnares/dsn031
Gitzendanner, M. A., Soltis, P. S., Wong, G. K. S., Ruhfel, B. R., and Soltis, D. E. (2018). Plastid phylogenomic analysis of green plants: a billion years of evolutionary history. Am. J. Bot. 105, 291–301. doi: 10.1002/ajb2.1048
Guo, X., Fang, D., Sahu, S. K., Yang, S., Guang, X., Folk, R., et al. (2021). Chloranthus genome provides insights into the early diversification of angiosperms. Nat. Commun. 12:6930. doi: 10.1038/s41467-021-26922-4
Howe, C. J., Barbrook, A., Nisbet, R., Lockhart, P., and Larkum, A. (2008). The origin of plastids. Philos. Transact. Royal Soc. London B 363, 2675–2685.
Hubisz, M. J., Pollard, K. S., and Siepel, A. (2011). PHAST and RPHAST: phylogenetic analysis with space/time models. Brief. Bioinform. 12, 41–51. doi: 10.1093/bib/bbq072
Jost, M., Naumann, J., Rocamundi, N., Cocucci, A. A., and Wanke, S. (2020). The first plastid genome of the Holoparasitic genus Prosopanche (Hydnoraceae). Plants 9:306. doi: 10.3390/plants9030306
Katoh, K., Misawa, K., Kuma, K., and Miyata, T. (2002). MAFFT: a novel method for rapid multiple sequence alignment based on fast Fourier transform. Nucleic Acids Res. 30, 3059–3066. doi: 10.1093/nar/gkf436
Keller, J., Rousseau-Gueutin, M., Martin, G. E., Morice, J., Boutte, J., Coissac, E., et al. (2017). The evolutionary fate of the chloroplast and nuclear rps16 genes as revealed through the sequencing and comparative analyses of four novel legume chloroplast genomes from Lupinus. DNA Res. 24, 343–358. doi: 10.1093/dnares/dsx006
Kim, H. T., Chung, M. G., and Kim, K.-J. (2014). Chloroplast genome evolution in early diverged leptosporangiate ferns. Molecules 37:372. doi: 10.14348/molcells.2014.2296
Lanfear, R., Calcott, B., Ho, S. Y., and Guindon, S. (2012). PartitionFinder: combined selection of partitioning schemes and substitution models for phylogenetic analyses. Mol. Biol. Evol. 29, 1695–1701. doi: 10.1093/molbev/mss020
Lee, J.-H., and Manhart, J. R. (2002). Four embryophyte introns and psbB operon indicate Chlorokybus as a basal streptophyte lineage. Algae 17, 53–58. doi: 10.4490/algae.2002.17.1.053
One Thousand Plant Transcriptomes Initiative (2019). One thousand plant transcriptomes and the phylogenomics of green plants. Nature 574, 679–685. doi: 10.1038/s41586-019-1693-2
Leliaert, F., Smith, D. R., Moreau, H., Herron, M. D., Verbruggen, H., Delwiche, C. F., et al. (2012). Phylogeny and molecular evolution of the green algae. Crit. Rev. Plant Sci. 31, 1–46.
Leliaert, F., Verbruggen, H., and Zechman, F. W. (2011). Into the deep: new discoveries at the base of the green plant phylogeny. Bioessays 33, 683–692. doi: 10.1002/bies.201100035
Lemieux, C., Otis, C., and Turmel, M. (2016). Comparative chloroplast genome analyses of streptophyte green algae uncover major structural alterations in the Klebsormidiophyceae, Coleochaetophyceae and Zygnematophyceae. Front. Plant Sci. 7:697. doi: 10.3389/fpls.2016.00697
Li, F.-W., Kuo, L.-Y., Pryer, K. M., Rothfels, C. and Evolution. (2016). Genes translocated into the plastid inverted repeat show decelerated substitution rates and elevated GC content. Genome Biol. 8, 2452–2458. doi: 10.1093/gbe/evw167
Li, H.-T., Luo, Y., Gan, L., Ma, P.-F., Gao, L.-M., Yang, J.-B., et al. (2021a). Plastid phylogenomic insights into relationships of all flowering plant families. BMC Biol. 19:232. doi: 10.1186/s12915-021-01166-2
Li, X., Hou, Z., Xu, C., Shi, X., Yang, L., Lewis, L. A., et al. (2021b). Large Phylogenomic Data sets Reveal Deep Relationships and Trait Evolution in Chlorophyte Green Algae. Genome Biol. Evol. 13:evab101. doi: 10.1093/gbe/evab101
Li, H.-T., Yi, T.-S., Gao, L.-M., Ma, P.-F., Zhang, T., Yang, J.-B., et al. (2019). Origin of angiosperms and the puzzle of the Jurassic gap. Nat. Plants 5, 461–470. doi: 10.1038/s41477-019-0421-0
Li, L., Chen, X., Fang, D., Dong, S., Guo, X., Li, N., et al. (2022). Genomes shed light on the evolution of Begonia, a mega-diverse genus. New Phytol. 234, 295–310. doi: 10.1111/nph.17949
Li, L., Wang, S., Wang, H., Sahu, S. K., Marin, B., Li, H., et al. (2020). The genome of Prasinoderma coloniale unveils the existence of a third phylum within green plants. Nat. Ecol. Evol. 4, 1220–1231. doi: 10.1038/s41559-020-1221-7
Lin, C.-P., Huang, J.-P., Wu, C.-S., Hsu, C.-Y., and Chaw, S.-M. (2010). Comparative chloroplast genomics reveals the evolution of Pinaceae genera and subfamilies. Genome Biol. Evol. 2, 504–517. doi: 10.1093/gbe/evq036
Lin, C.-P., Wu, C.-S., Huang, Y.-Y., and Chaw, S.-M. (2012). The complete chloroplast genome of Ginkgo biloba reveals the mechanism of inverted repeat contraction. Genome Biol. Evol. 4, 374–381. doi: 10.1093/gbe/evs021
Liu, F., and Melton, J. T. III (2021). Chloroplast Genomes of the Green-Tide Forming Alga Ulva compressa: Comparative Chloroplast Genomics in the Genus Ulva (Ulvophyceae, Chlorophyta). Front. Marin. Sci. 8:668542. doi: 10.3389/fmars.2021.668542
Liu, H., Wei, J., Yang, T., Mu, W., Song, B., Yang, T., et al. (2019). Molecular digitization of a botanical garden: high-depth whole-genome sequencing of 689 vascular plant species from the Ruili Botanical Garden. Gigascience 8:giz007. doi: 10.1093/gigascience/giz007
Liu, Y., Cox, C. J., Wang, W., and Goffinet, B. (2014). Mitochondrial phylogenomics of early land plants: mitigating the effects of saturation, compositional heterogeneity, and codon-usage bias. Syst. Biol. 63, 862–878. doi: 10.1093/sysbio/syu049
Lu, Y., Ran, J.-H., Guo, D.-M., Yang, Z.-Y., and Wang, X.-Q. (2014). Phylogeny and divergence times of gymnosperms inferred from single-copy nuclear genes. PLoS One 9:e107679. doi: 10.1371/journal.pone.0107679
Lyko, P., and Wicke, S. (2021). Genomic reconfiguration in parasitic plants involves considerable gene losses alongside global genome size inflation and gene births. Plant Physiol. 186, 1412–1423. doi: 10.1093/plphys/kiab192
Marsolier-Kergoat, M.-C., and Yeramian, E. (2009). GC content and recombination: reassessing the causal effects for the Saccharomyces cerevisiae genome. Genetics 183, 31–38. doi: 10.1534/genetics.109.105049
Martín, M., and Sabater, B. (2010). Plastid ndh genes in plant evolution. Plant Physiol. Biochem. 48, 636–645. doi: 10.1016/j.plaphy.2010.04.009
Matsuo, M., Ito, Y., Yamauchi, R., and Obokata, J. (2005). The rice nuclear genome continuously integrates, shuffles, and eliminates the chloroplast genome to cause chloroplast–nuclear DNA flux. Plant Cell 17, 665–675. doi: 10.1105/tpc.104.027706
Maul, J. E., Lilly, J. W., Cui, L., Miller, W., Harris, E. H., and Stern, D. B. (2002). The Chlamydomonas reinhardtii plastid chromosome: islands of genes in a sea of repeats. Plant Cell 14, 2659–2679. doi: 10.1105/tpc.006155
Meunier, J., and Duret, L. (2004). Recombination drives the evolution of GC-content in the human genome. Mol. Biol. Evol. 21, 984–990. doi: 10.1093/molbev/msh070
Millen, R. S., Olmstead, R. G., Adams, K. L., Palmer, J. D., Lao, N. T., Heggie, L., et al. (2001). Many parallel losses of infA from chloroplast DNA during angiosperm evolution with multiple independent transfers to the nucleus. Plant Cell 13, 645–658. doi: 10.1105/tpc.13.3.645
Mirarab, S., Reaz, R., Bayzid, M. S., Zimmermann, T., Swenson, M. S., and Warnow, T. (2014). ASTRAL: genome-scale coalescent-based species tree estimation. Bioinformatics 30, i541–i548. doi: 10.1093/bioinformatics/btu462
Mohanta, T. K., Mishra, A. K., Khan, A., Hashem, A., Abd_Allah, E. F., and Al-Harrasi, A. (2020). Gene loss and evolution of the plastome. Genes 11:1133 doi: 10.3390/genes11101133
Moore, M. J., Bell, C. D., Soltis, P. S., and Soltis, D. E. (2007). Using plastid genome-scale data to resolve enigmatic relationships among basal angiosperms. Proc. Natl. Acad. Sci. 104, 19363–19368. doi: 10.1073/pnas.0708072104
Mower, J. P., Ma, P. F., Grewe, F., Taylor, A., Michael, T. P., VanBuren, R., et al. (2019). Lycophyte plastid genomics: extreme variation in GC, gene and intron content and multiple inversions between a direct and inverted orientation of the rRNA repeat. New Phytol. 222, 1061–1075. doi: 10.1111/nph.15650
Nguyen, L.-T., Schmidt, H. A., von Haeseler, A., and Minh, B. Q. (2014). IQ-TREE: a fast and effective stochastic algorithm for estimating maximum-likelihood phylogenies. Mol. Biol. Evol. 32, 268–274. doi: 10.1093/molbev/msu300
Nickrent, D. L., Parkinson, C. L., Palmer, J. D., and Duff, R. J. (2000). Multigene phylogeny of land plants with special reference to bryophytes and the earliest land plants. Mol. Biol. Evol. 17, 1885–1895. doi: 10.1093/oxfordjournals.molbev.a026290
Papanikolaou, N., Trachana, K., Theodosiou, T., Promponas, V. J., and Iliopoulos, I. (2009). Gene socialization: gene order, GC content and gene silencing in Salmonella. BMC Genom. 10:597. doi: 10.1186/1471-2164-10-597
Pryer, K. M., Schuettpelz, E., Wolf, P. G., Schneider, H., Smith, A. R., and Cranfill, R. (2004). Phylogeny and evolution of ferns (monilophytes) with a focus on the early leptosporangiate divergences. Am. J. Bot. 91, 1582–1598. doi: 10.3732/ajb.91.10.1582
Puttick, M. N., Morris, J. L., Williams, T. A., Cox, C. J., Edwards, D., Kenrick, P., et al. (2018). The interrelationships of land plants and the nature of the ancestral embryophyte. Curr. Biol. 28, 733.e–745.e. doi: 10.1016/j.cub.2018.01.063
Qu, X.-J., Fan, S.-J., Wicke, S., and Yi, T.-S. (2019). Plastome reduction in the only parasitic gymnosperm Parasitaxus is due to losses of photosynthesis but not housekeeping genes and apparently involves the secondary gain of a large inverted repeat. Genome Biol. Evol. 11, 2789–2796. doi: 10.1093/gbe/evz187
Ruhfel, B. R., Gitzendanner, M. A., Soltis, P. S., Soltis, D. E., and Burleigh, J. G. (2014). From algae to angiosperms–inferring the phylogeny of green plants (Viridiplantae) from 360 plastid genomes. BMC Evol. Biol. 14:23. doi: 10.1186/1471-2148-14-23
Ruhlman, T. A., Chang, W.-J., Chen, J. J., Huang, Y.-T., Chan, M.-T., Zhang, J., et al. (2015). NDH expression marks major transitions in plant evolution and reveals coordinate intracellular gene loss. BMC Plant Biol. 15:100. doi: 10.1186/s12870-015-0484-7
Sahu, S. K., Singh, R., and Kathiresan, K. (2015). Deciphering the taxonomical controversies of Rhizophora hybrids using AFLP, plastid and nuclear markers. Aqu. Bot. 125, 48–56. doi: 10.1016/j.aquabot.2015.05.002
Sahu, S. K., Singh, R., and Kathiresan, K. (2016). Multi-gene phylogenetic analysis reveals the multiple origin and evolution of mangrove physiological traits through exaptation. Estuarine Coast. Shelf Sci. 183, 41–51. doi: 10.1016/j.ecss.2016.10.021
Shaw, J., and Renzaglia, K. (2004). Phylogeny and diversification of bryophytes. Am. J. Bot. 91, 1557–1581. doi: 10.3732/ajb.91.10.1557
Shen, H., Jin, D., Shu, J.-P., Zhou, X.-L., Lei, M., Wei, R., et al. (2017). Large-scale phylogenomic analysis resolves a backbone phylogeny in ferns. Gigascience 7:gix116. doi: 10.1093/gigascience/gix116
Simmons, M. P., Zhang, L.-B., Webb, C. T., and Reeves, A. (2006). How can third codon positions outperform first and second codon positions in phylogenetic inference? An empirical example from the seed plants. Syst. Biol. 55, 245–258. doi: 10.1080/10635150500481473
Simpson, C. L., and Stern, D. B. (2002). The treasure trove of algal chloroplast genomes. Surprises in architecture and gene content, and their functional implications. Plant Physiol. 129, 957–966. doi: 10.1104/pp.010908
Sousa, F., Civáň, P., Foster, P. G., and Cox, C. J. (2020). The chloroplast land plant phylogeny: analyses employing better-fitting tree-and site-heterogeneous composition models. Front. plant Sci. 11:1062. doi: 10.3389/fpls.2020.01062
Stamatakis, A. (2014). RAxML version 8: a tool for phylogenetic analysis and post-analysis of large phylogenies. Bioinformatics 30, 1312–1313. doi: 10.1093/bioinformatics/btu033
Strauss, S. H., Palmer, J. D., Howe, G. T., and Doerksen, A. H. (1988). Chloroplast genomes of two conifers lack a large inverted repeat and are extensively rearranged. Proc. Natl. Acad. Sci. 85, 3898–3902. doi: 10.1073/pnas.85.11.3898
Sugiura, C., Yamaguchi, K., Yoshinaga, K., Ueda, K., Yamada, K., Sugita, M., et al. (2004). Chloroplast Phylogeny Indicates that Bryophytes Are Monophyletic. Mol. Biol. Evol. 21, 1813–1819. doi: 10.1093/molbev/msh203
Sundararajan, A., Dukowic-Schulze, S., Kwicklis, M., Engstrom, K., Garcia, N., Oviedo, O. J., et al. (2016). Gene evolutionary trajectories and GC patterns driven by recombination in Zea mays. Front. Plant Sci. 7:1433. doi: 10.3389/fpls.2016.01433
Turmel, M., Otis, C., and Lemieux, C. (2009). The chloroplast genomes of the green algae Pedinomonas minor, Parachlorella kessleri, and Oocystis solitaria reveal a shared ancestry between the Pedinomonadales and Chlorellales. Mol. Biol. Evol. 26, 2317–2331. doi: 10.1093/molbev/msp138
Umate, P., Schwenkert, S., Karbat, I., Dal Bosco, C., Mlcòchová, L., Volz, S., et al. (2007). Deletion of PsbM in tobacco alters the QB site properties and the electron flow within photosystem II. J. Biol. Chem. 282, 9758–9767. doi: 10.1074/jbc.m608117200
Waltari, E., and Edwards, S. V. (2002). Evolutionary dynamics of intron size, genome size, and physiological correlates in archosaurs. Am. Natural. 160, 539–552. doi: 10.1086/342079
Wang, R.-J., Cheng, C.-L., Chang, C.-C., Wu, C.-L., Su, T.-M., and Chaw, S.-M. (2008). Dynamics and evolution of the inverted repeat-large single copy junctions in the chloroplast genomes of monocots. BMC Evol. Biol. 8:36. doi: 10.1186/1471-2148-8-36
Wicke, S., and Naumann, J. (2018). Molecular evolution of plastid genomes in parasitic flowering plants. Adv. Bot. Res. 85, 315–347. doi: 10.1016/bs.abr.2017.11.014
Wicke, S., Schneeweiss, G. M., Müller, K. F., and Quandt, D. (2011). The evolution of the plastid chromosome in land plants: gene content, gene order, gene function. Plant Mol. Biol. 76, 273–297. doi: 10.1007/s11103-011-9762-4
Wickett, N. J., Mirarab, S., Nguyen, N., Warnow, T., Carpenter, E., Matasci, N., et al. (2014). Phylotranscriptomic analysis of the origin and early diversification of land plants. Proc. Natl. Acad. Sci. 111, E4859–E4868. doi: 10.1073/pnas.1323926111
Wolf, P. G., Karol, K. G., Mandoli, D. F., Kuehl, J., Arumuganathan, K., Ellis, M. W., et al. (2005). The first complete chloroplast genome sequence of a lycophyte, Huperzia lucidula (Lycopodiaceae). Gene 350, 117–128. doi: 10.1016/j.gene.2005.01.018
Wu, C. S., and Chaw, S. M. (2014). Highly rearranged and size-variable chloroplast genomes in conifers II clade (cupressophytes): evolution towards shorter intergenic spacers. Plant Biotechnol. J. 12, 344–353. doi: 10.1111/pbi.12141
Wu, C.-S., and Chaw, S.-M. (2015). Evolutionary stasis in cycad plastomes and the first case of plastome GC-biased gene conversion. Genome Biol. Evol. 7, 2000–2009. doi: 10.1093/gbe/evv125
Wu, C.-S., Wang, Y.-N., Hsu, C.-Y., Lin, C.-P., and Chaw, S.-M. (2011). Loss of different inverted repeat copies from the chloroplast genomes of Pinaceae and cupressophytes and influence of heterotachy on the evaluation of gymnosperm phylogeny. Genome Biol. Evol. 3, 1284–1295. doi: 10.1093/gbe/evr095
Xiao-Ming, Z., Junrui, W., Li, F., Sha, L., Hongbo, P., Lan, Q., et al. (2017). Inferring the evolutionary mechanism of the chloroplast genome size by comparing whole-chloroplast genome sequences in seed plants. Sci. Rep. 7:1555. doi: 10.1038/s41598-017-01518-5
Xu, J.-H., Liu, Q., Hu, W., Wang, T., Xue, Q., and Messing, J. (2015). Dynamics of chloroplast genomes in green plants. Genomics 106, 221–231. doi: 10.1016/j.ygeno.2015.07.004
Yang, L., Su, D., Chang, X., Foster, C. S., Sun, L., Huang, C.-H., et al. (2020). Phylogenomic insights into deep phylogeny of angiosperms based on broad nuclear gene sampling. Plant Commun. 1:100027. doi: 10.1016/j.xplc.2020.100027
Zhang, D., Li, K., Gao, J., Liu, Y., and Gao, L.-Z. (2016). The complete plastid genome sequence of the wild rice Zizania latifolia and comparative chloroplast genomics of the rice tribe Oryzeae, Poaceae. Front. Ecol. Evol. 4:88. doi: 10.3389/fevo.2016.00088
Keywords: plastid genome, phylogenetics, Viridiplantae, inverted repeats, gene blocks
Citation: Yang T, Sahu SK, Yang L, Liu Y, Mu W, Liu X, Strube ML, Liu H and Zhong B (2022) Comparative Analyses of 3,654 Plastid Genomes Unravel Insights Into Evolutionary Dynamics and Phylogenetic Discordance of Green Plants. Front. Plant Sci. 13:808156. doi: 10.3389/fpls.2022.808156
Received: 03 November 2021; Accepted: 07 March 2022;
Published: 11 April 2022.
Edited by:
Stefan Wanke, Technical University Dresden, GermanyReviewed by:
Juan Carlos Villarreal A., Laval University, CanadaShiou Yih Lee, INTI International University, Malaysia
Wei Lun Ng, Xiamen University Malaysia, Malaysia
Copyright © 2022 Yang, Sahu, Yang, Liu, Mu, Liu, Strube, Liu and Zhong. This is an open-access article distributed under the terms of the Creative Commons Attribution License (CC BY). The use, distribution or reproduction in other forums is permitted, provided the original author(s) and the copyright owner(s) are credited and that the original publication in this journal is cited, in accordance with accepted academic practice. No use, distribution or reproduction is permitted which does not comply with these terms.
*Correspondence: Sunil Kumar Sahu, c3VuaWxrdW1hcnNhaHVAZ2Vub21pY3MuY24=; Bojian Zhong, Ymp6aG9uZ0BnbWFpbC5jb20=
†These authors have contributed equally to this work