 Fengmao Yang
 Lei Cai1,2†
- 1Yunnan Key Laboratory for Integrative Conservation of Plant Species With Extremely Small Populations, Kunming Institute of Botany, Chinese Academy of Sciences, Kunming, China
- 2Key Laboratory for Plant Diversity and Biogeography of East Asia, Kunming Institute of Botany, Chinese Academy of Sciences, Kunming, China
- 3University of the Chinese Academy of Sciences, Beijing, China
Elucidating the genetic background of threatened species is fundamental to their management and conservation, and investigating the demographic history of these species is helpful in the determination of the threats facing them. The woody species of the genus Magnolia (Magnoliaceae) have high economic, scientific and ecological values. Although nearly half of all Magnolia species have been evaluated as threatened, to date there has been no population genetic study employing Next Generation Sequencing (NGS) technology in this genus. In the present study, we investigate the conservation genomics of Magnolia fistulosa, a threatened species endemic to the limestone area along the Sino-Vietnamese border, using a double digest restriction-site-associated DNA-sequencing (ddRAD-seq) approach. To increase the reliability of our statistical inferences, we employed two approaches, Stacks and ipyrad, for SNP calling. A total of 15,272 and 18,960, respectively, putatively neutral SNPs were generated by Stacks and ipyrad. Relatively high genetic diversity and large population divergence were detected in M. fistulosa. Although higher absolute values were calculated using the ipyrad data set, the two data sets showed the same trends in genetic diversity (π, He), population differentiation (FST) and inbreeding coefficients (FIS). A change in the effective population size of M. fistulosa within the last 1 Ma was detected, including a population decline about 0.5–0.8 Ma ago, a bottleneck event about 0.2–0.3 Ma ago, population fluctuations during the last glacial stage, and the recovery of effective population size after the last glacial maximum. Our findings not only lay the foundation for the future conservation of this species, but also provide new insights into the evolutionary history of the genus Magnolia in southeastern Yunnan, China.
Introduction
Endangered species, especially those with extremely small populations, often face a high risk of extinction under climatic fluctuations and anthropogenic disturbance (Bijlsma and Loeschcke, 2012; Ralls et al., 2018). In addition to reproduction difficulties as a result of low number of individuals (Kéry et al., 2000), small populations can be subject to genetic drift, which can erode genetic diversity and lead to rapidly increasing genetic divergence between populations in the long term (Willi et al., 2007; Haag et al., 2010). Loss of genetic diversity may reduce population persistence and the evolutionary potential of species, and high genetic differentiation may lead to outbreeding depression (Elam, 1993; Spielman et al., 2004; Bomblies and Weigel, 2007).
Plant Species with Extremely Small Populations (PSESP) is a conservation concept referring to plant species with small remaining populations (<5,000 individuals), restricted habitat, exposure to serious human disturbance, and at high risk of extinction (Ma et al., 2013; Sun et al., 2019a; Yang et al., 2020). Indeed, PSESP are the most critically endangered of all species and urgently need protection (Cai et al., 2019; Crane, 2020; Li et al., 2020). The protection and maintenance (both in situ and ex situ) of different evolutionarily significant units identified in threatened species will maximize their evolutionary potential to handle environmental change (Funk et al., 2012). Therefore, investigation of the genetic background and population structure of PSESPs is fundamental to their conservation and management (Liu et al., 2020; Yang et al., 2020; Ma et al., 2021a,b).
Advances in sequencing technology, especially reduced-representation genome sequencing, have allowed us to obtain thousands of genetic markers relatively easily (Allendorf et al., 2010), making it possible to answer many evolutionary questions and guide conservation (Andrews et al., 2016; Beichman et al., 2018). Restriction-Site Associated DNA sequencing (RAD-seq) technology is one of the most promising technologies in conservation genetics, as it is capable of producing an abundance of genetic markers with or without a reference genome in an economical way (Andrews et al., 2016). RAD-seq has a huge advantage over simple sequence repeats (SSR) data, in that the resolution of data sets is increased, no prior genetic information is needed and the inference of demographic history provided is thought to be more accurate (Jeffries et al., 2016; Lemopoulos et al., 2019). Compared with traditional RAD-seq, double digest RAD sequencing (ddRAD-seq) further improves efficiency and robustness while minimizing cost (Peterson et al., 2012). However, several studies have shown that the choice of pipeline used for the analysis may have a significant impact on the accuracy of the results (Qi et al., 2015; Torkamaneh et al., 2016; Boukteb et al., 2021). To improve the reliability of the results, multi-method analyses can be adopted to process data using different technical routes (Qi et al., 2015; Boukteb et al., 2021).
The genus Magnolia belongs to the family Magnoliaceae and is well known for its basal position in the flowering plants (The Angiosperm Phylogeny Group et al., 2016). The genus is mainly distributed throughout the temperate and tropical regions of Southeast Asia, the Antilles and Central and South America, and more than 300 species have been described to date (Law et al., 1995; Azuma et al., 2001; Law, 2004; Cires et al., 2013). China is the center of diversity for Magnolia, and is home to more than 160 Magnolia species, including the largest number of threatened Magnolia species of any country in the world (Law, 2004; Cires et al., 2013). Magnolia species are valued for their timber, culinary use, and their ornamental and medicinal applications (Cires et al., 2013), and overexploitation for these purposes has contributed to declines in the populations of many Magnolia species. Furthermore, strong human disturbance poses a huge threat to the survival of Magnolia. On the global scale, half of the Magnolia species are considered threatened, nevertheless, the conservation status of nearly a third of all Magnolia species remains unassessed (Rivers et al., 2016). Of the 160 Magnolia species found in China, 76 are considered to be threatened in the Threatened Species List of China’s Higher Plants (Qin et al., 2017). Because of the urgent conservation action required for many Magnolia species, there is much research focusing on the population genetic and demographic histories of threatened Magnolia (Isagi et al., 2007; Cires et al., 2013; Budd et al., 2015; Tamaki et al., 2019; Hernández et al., 2020). However, to date we know of no studies adopting a RAD-seq approach to study conservation genetics in Magnolia.
Magnolia fistulosa (Finet & Gagnepain) Dandy is an evergreen shrub with broad oval leaves and extremely aromatic flowers (Figure 1B). It is a threatened species and is endemic to the Sino-Vietnamese border (Xia, 2006; Deng, 2019). M. fistulosa was evaluated as Vulnerable in the Threatened Species List of China’s Higher Plants (Qin et al., 2017), however, in the Red List of Magnoliaceae (Rivers et al., 2016), it was evaluated as Data Deficient. M. fistulosa was also classified as a provincial PSESP in the Planning Outline of Rescuing and Conserving Yunnan’s PSESP (2010–2020) in 2010 by The Yunnan Provincial Government (Sun, 2013; Sun et al., 2019b). M. fistulosa is a tropical rain-forest plant (Figure 1A), and these forests also provide a refuge for other PSESPs, including M. lucida, Hopea chinensis (Dipterocarpaceae) and Cycas dolichophylla (Cycadaceae; Zheng et al., 2016; Sun et al., 2019b). During the course of our field investigations, we found a total of 245 mature M. fistulosa individuals in southeastern Yunnan. The pollinator of Magnolia fistulosa is Fruhstorferia anthracina (Rutelidae), a large (4 cm long) species of beetle. The main distribution of M. fistulosa was found to be in Hekou and Maguan Counties, while small numbers of disjunct individuals were also found in Gejiu and Jinping Counties. Throughout the range of M. fistulosa, there are varying degrees of human disturbance, such as crop planting and road construction (Figure 1C), with the threats facing the Jinping location being the worst. In Jinping County, only four individuals were found in remaining patches of forest and surrounded by rubber plantations. To date, there has been no research into the conservation genetics of M. fistulosa. Investigation of the population structure and genetic diversity of M. fistulosa would illustrate which factors might have shaped its PSESP status. Furthermore, the study would provide an example for the study of the demographic history of plants from southeastern Yunnan, and would, at the same time, lay the foundations of the conservation and management of M. fistulosa.
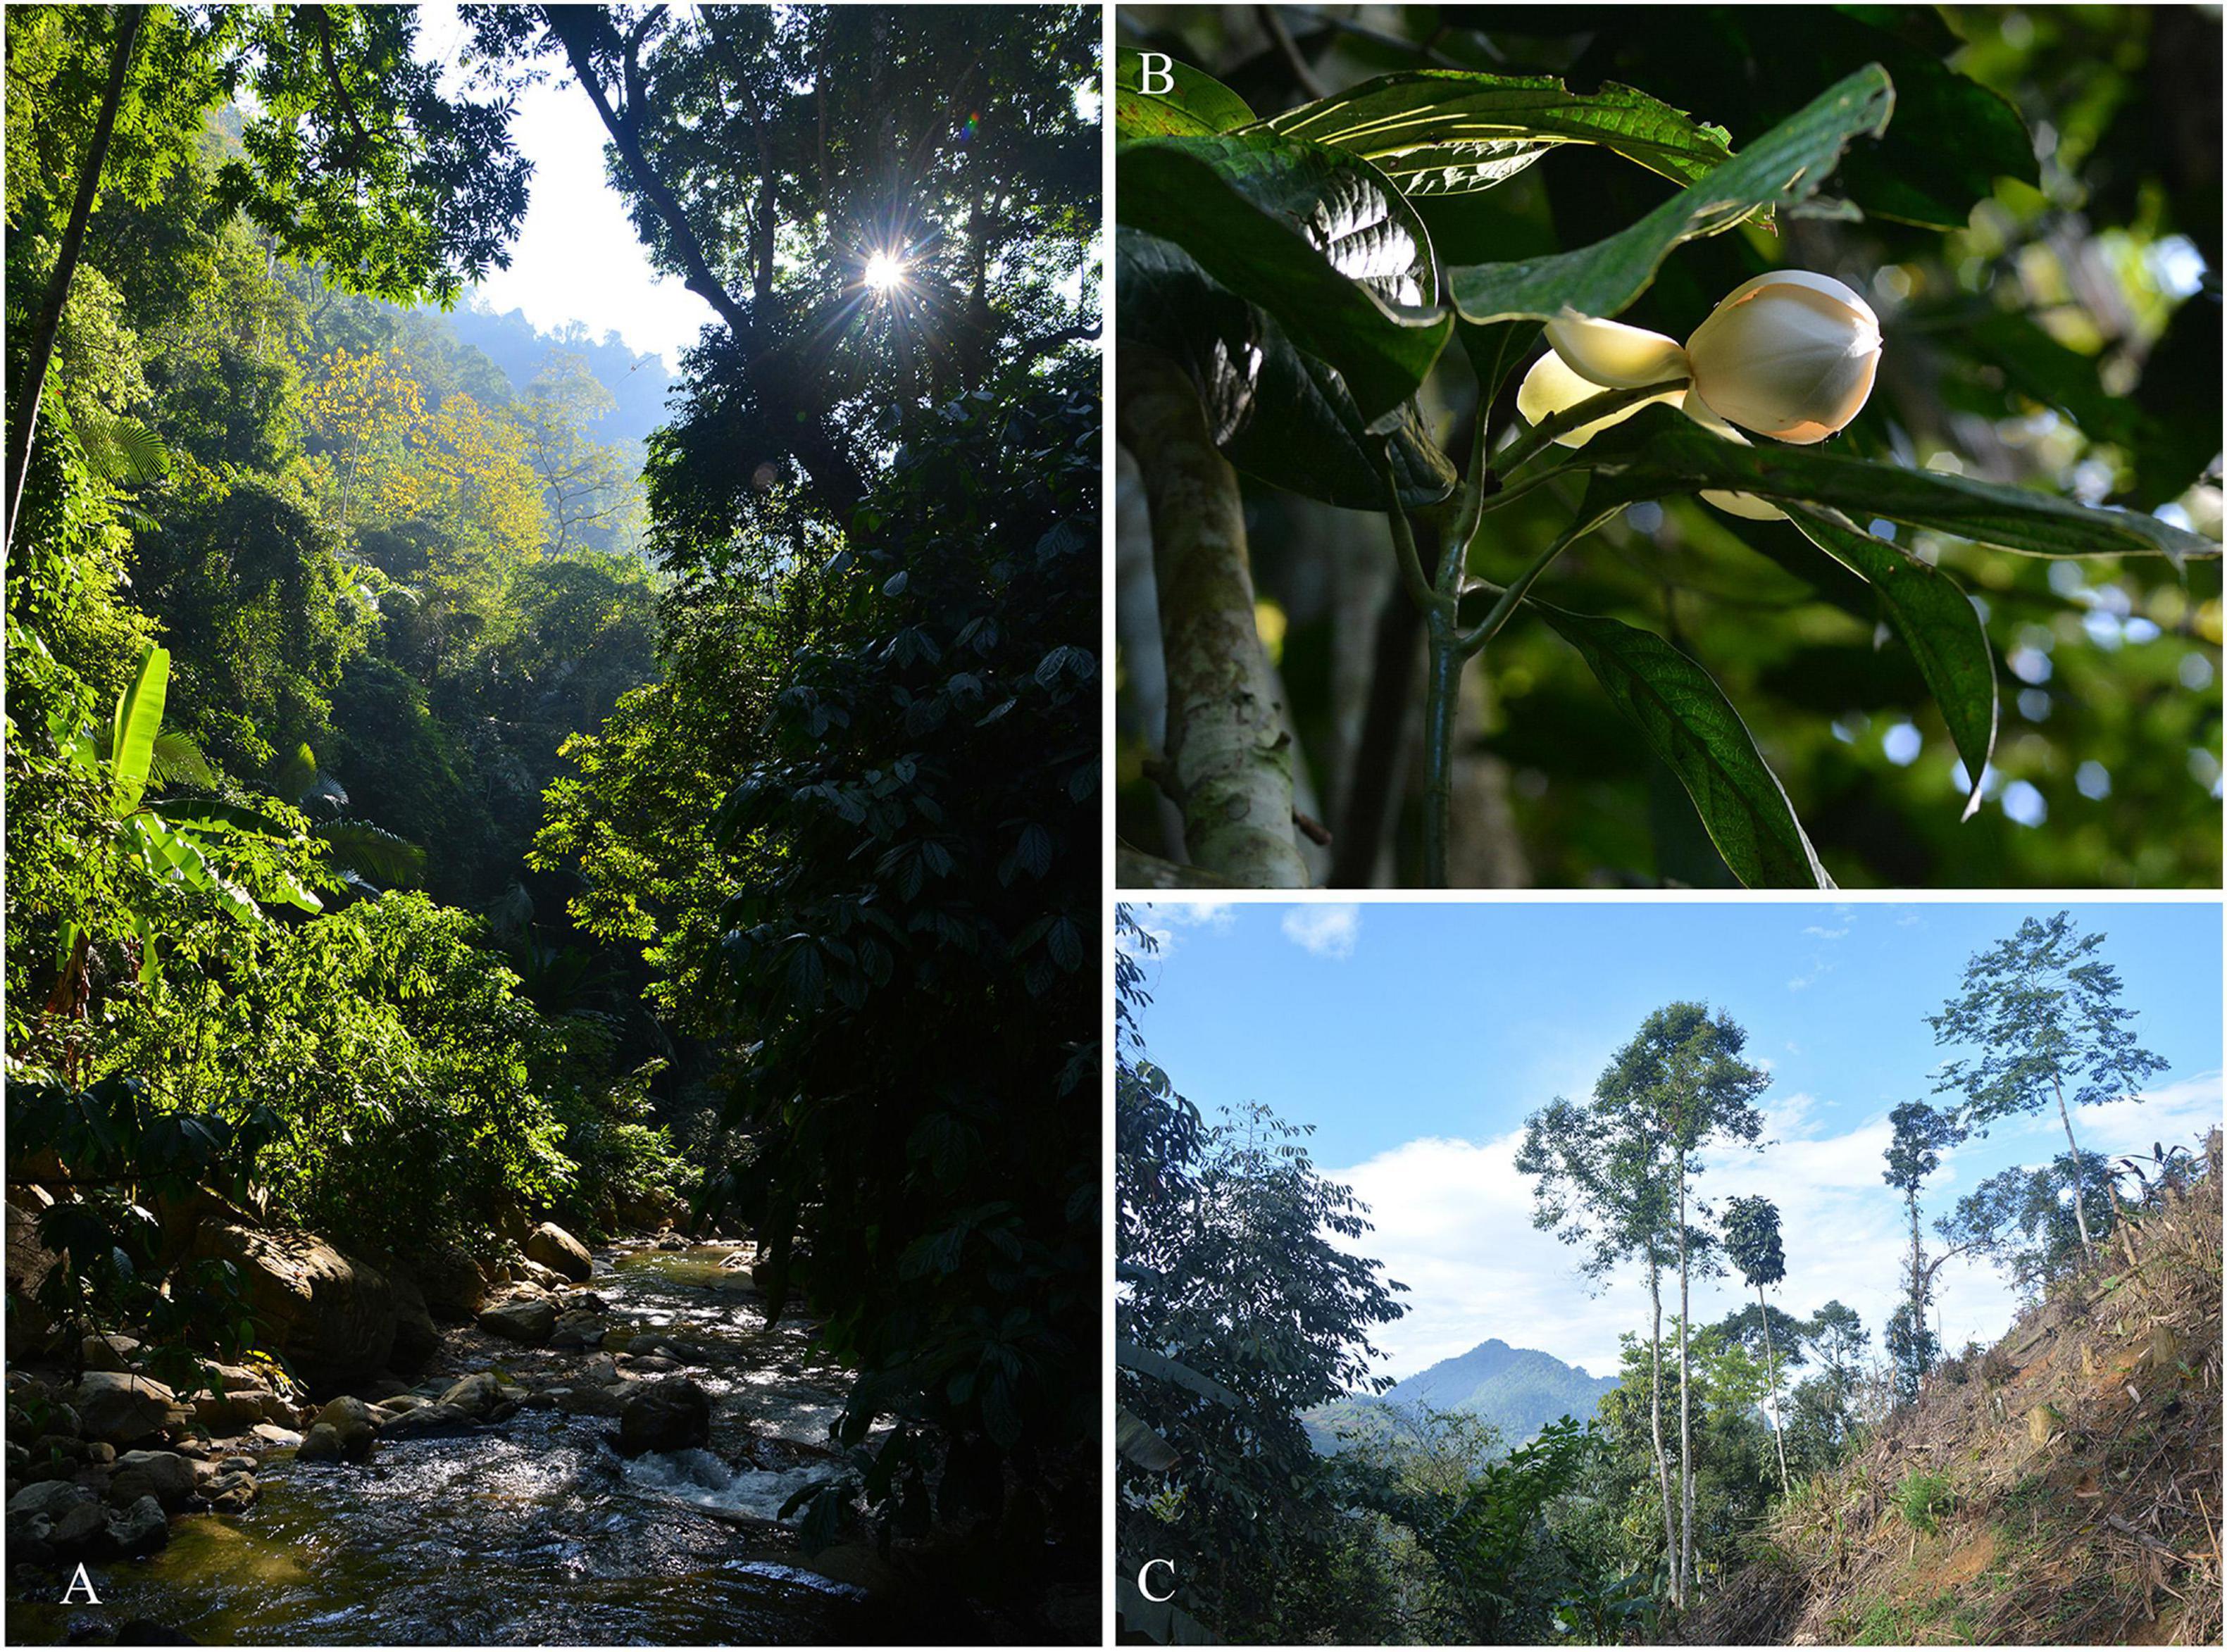
Figure 1. (A) The habitant of Magnolia fistulosa in QSH (Qingshui River, Gejiu). (B) The flower of M. fistulosa. (C) Habitat destruction of M. fistulosa in LB (Longbao Village, Hekou).
In this study, we use two different pipelines to process the sequence data generated from the double digested restriction site-associated DNA sequencing (ddRAD-seq) from Magnolia fistulosa taken from seven sampling locations. The genome of Magnolia sinica (BioProject ID PRJNA774088) was adopted as reference genome to improve the quantity and quality of the SNPs makers. In this study, we reveal the genetic threats currently faced by M. fistulosa and lay the foundation for the future conservation and management of this species. We aim to (1) explore the population structure of M. fistulosa and infer the levels and direction of gene flow among populations; (2) estimate the genetic diversity and contemporary effective population size of each population; and (3) infer the demographic history of M. fistulosa and its potential association with climatic fluctuations.
Materials and Methods
Sampling, DNA Extraction and Sequencing
We sampled a total of 93 Magnolia fistulosa individuals from seven sampling locations (MCP, BSH, CEN, JYZ, LB, QSH, and QCP; Figure 2A), and, with the exception of Jinping County (four individuals), 12–16 individuals were sampled from each sampling location. The distance between each sample is at least 20 m. Sampling locations of M. fistulosa covered every location in China where this species is known to occur.
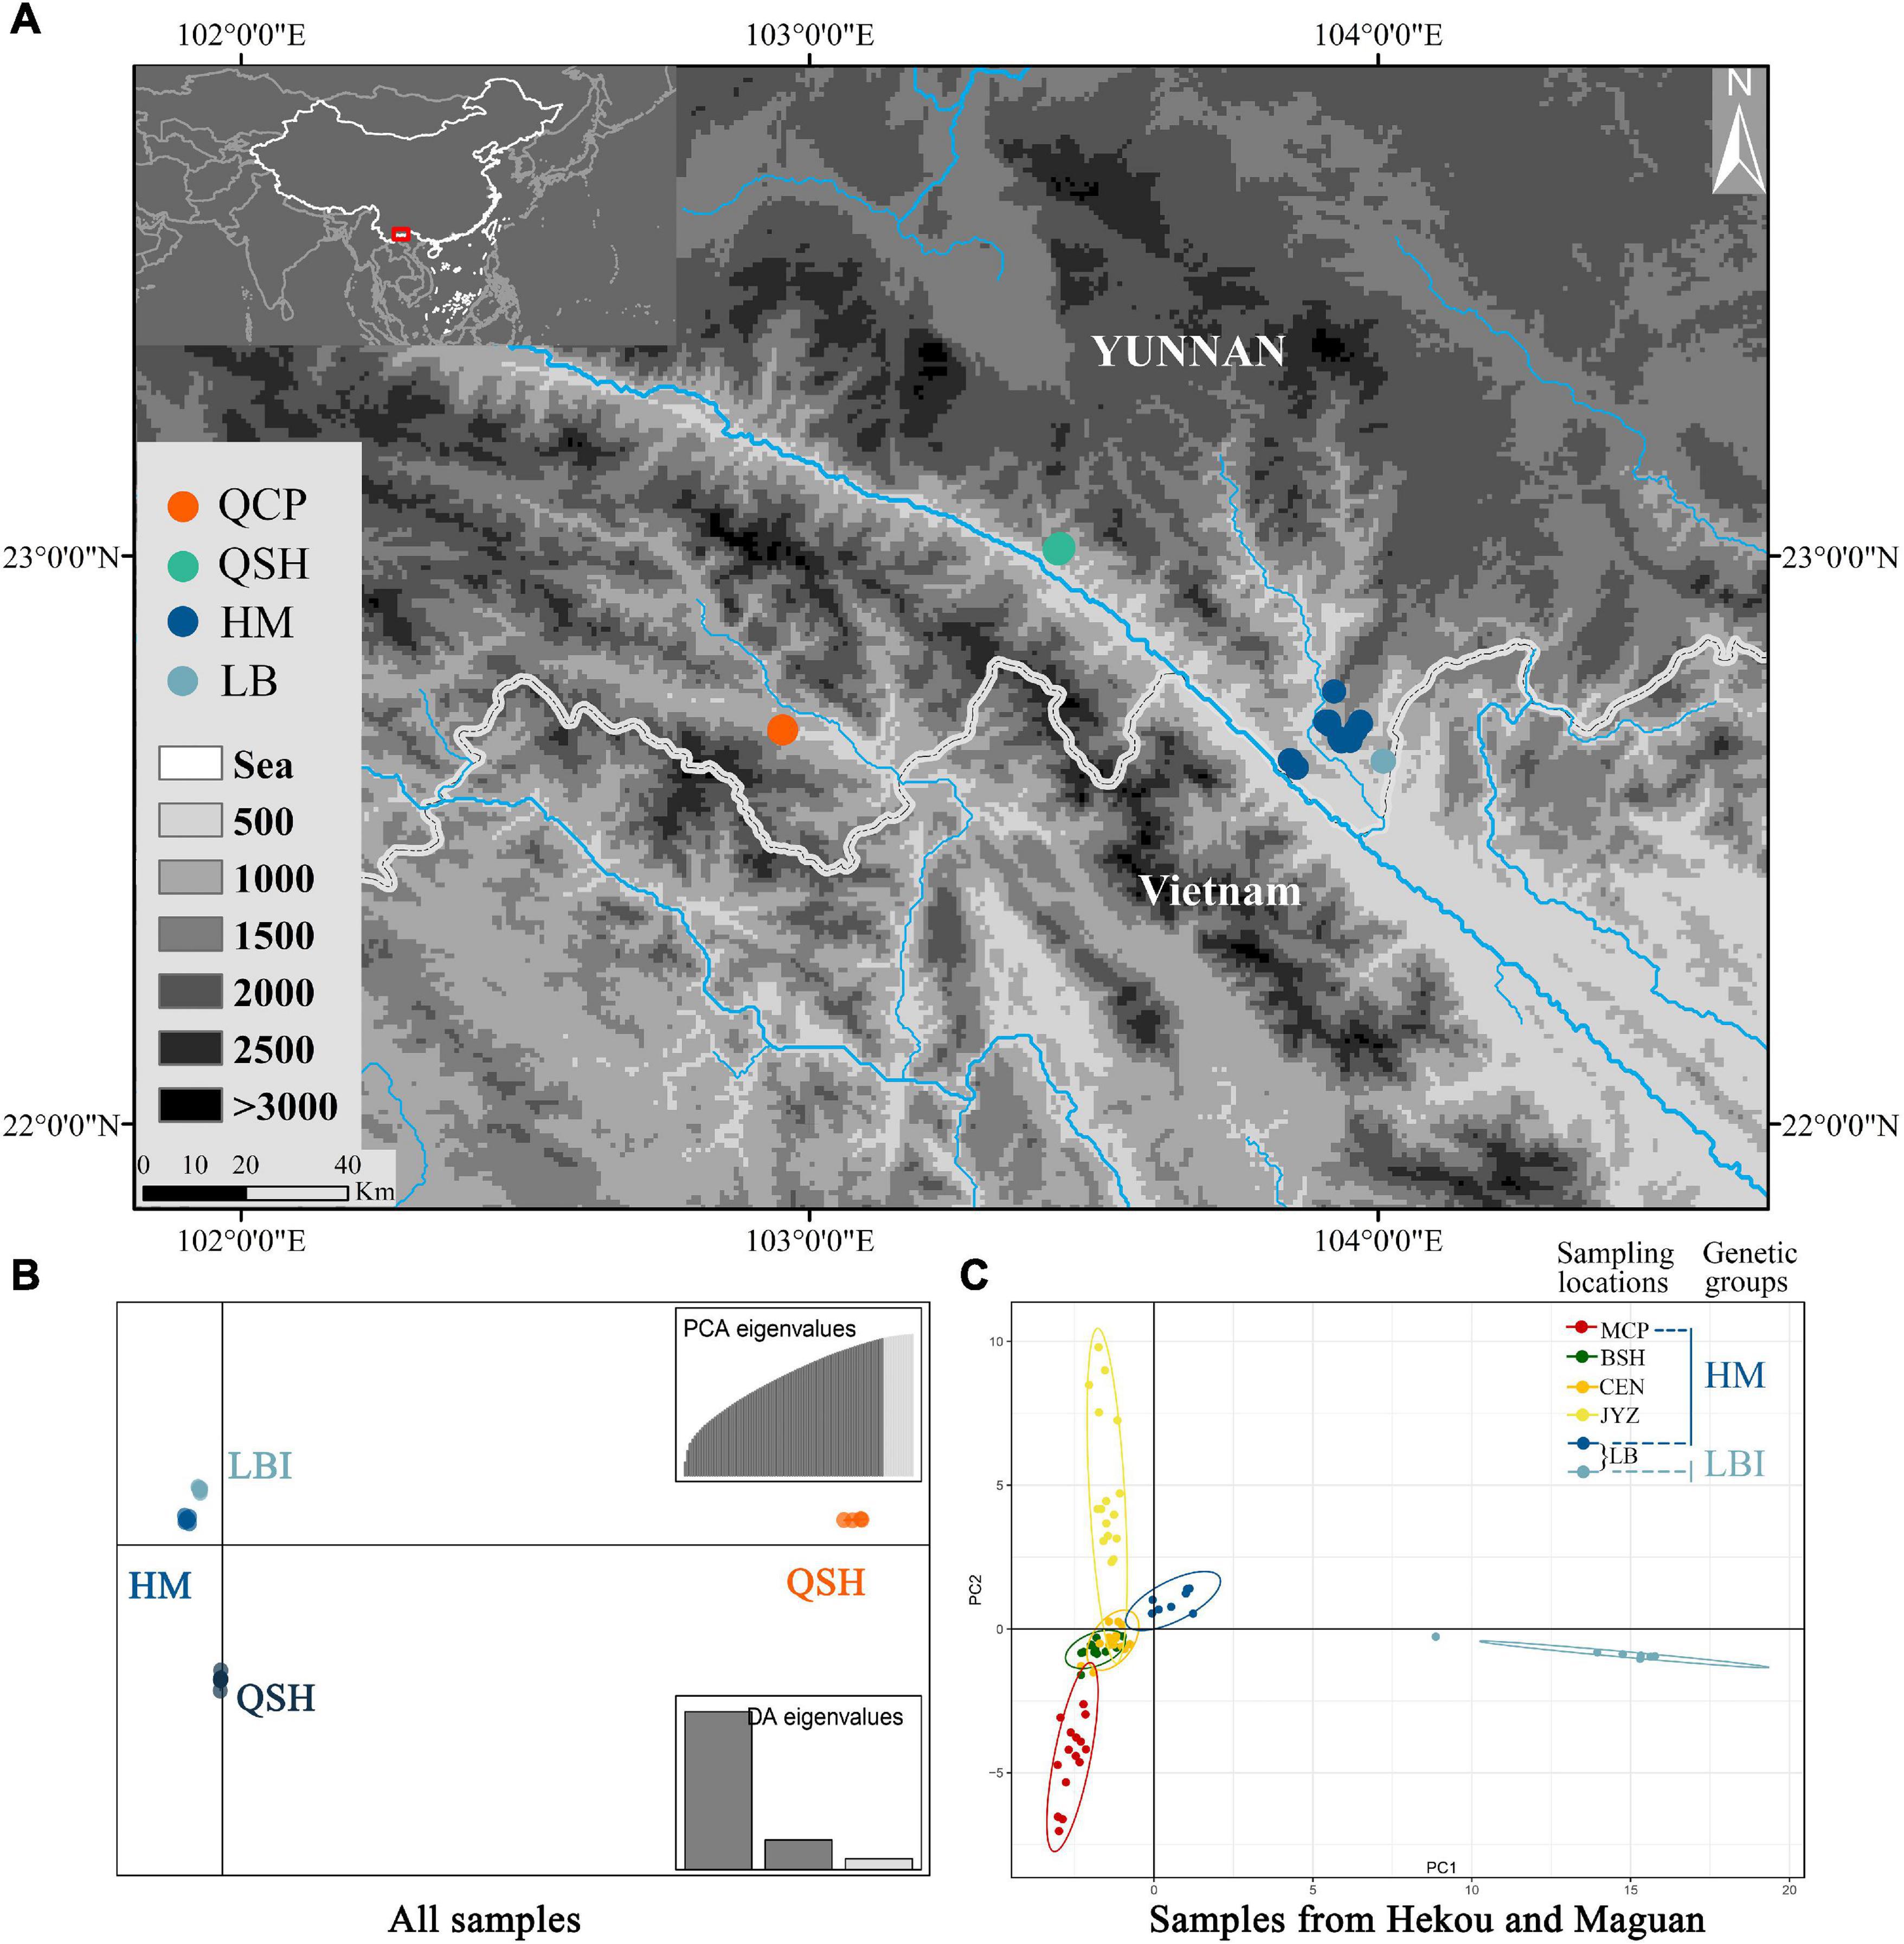
Figure 2. (A) Map of all sampling locations; HM represents the sampling locations of MCP, BSH, CEN and JYZ. (B) DAPC results from the Stacks data set with all populations and (C) PCA results from the Stacks data set with samples from Hekou and Maguan: HM and LBI are two genetic groups divided by DAPC analysis using samples from Hekou and Maguan.
Total DNA was extracted from silica gel-dried leaf tissues using a CTAB method (Doyle and Doyle, 1990). The quantity and quality of each sample was tested using agarose gel (Omega Bio-Tek, Norcross, GA, United States) electrophoresis and on a fluorometer (qubit3.0, Thermo Fisher Scientific, Waltham, MA, United States). Each qualified DNA sample was standardized to the same volume (10 μl) and quantity of DNA (200 μg). A 10 μl pre-mixed double enzyme (EcoRI and MseI; New England Biolabs, Ipswich, MA, United States) digestion solution was added to each sample. Samples were then placed in a PCR machine (Takara PCR Thermal Cycler Dice, Takara Bio Inc., Shiga, Japan) for 8 h at 37°C, followed by 20 min at 65°C, with a final incubation step at 12°C. The digested fragments were detected using agarose gel electrophoresis. Digested fragments were ligated to EcoRI and MseI adapters containing sample specific barcodes using a PCR machine with the following conditions: 16°C for 8 h, 65°C for 20 min, and 12°C for final incubation. Barcoded samples were separated by size (350–500 bp) using an agarose gel. To meet the concentration requirements for sequencing, each library was then amplified using a PCR machine with the following conditions: 98°C for 2 min, followed by 25 cycles for 98°C for 15 s, 56°C for 15 s and 72°C for 15 s; and 72°C for 5 min. The paired-end sequencing was performed on an Illumina Hiseq X-Ten platform (Illumina Inc., San Diego, CA, United States).
Processing of Next Generation Sequencing Data
Reference genomes were used to improve the accuracy of SNP calling. Three assembled genomes at chromosome-level, Magnolia sinica (BioProject ID PRJNA774088), M. officinalis (Yin et al., 2021) and M. biondii (Dong et al., 2021) were compared. To process reduced-representation genome sequencing data into SNP genotypes, two pipelines are commonly used. We adopted both of these to cross-validate our results from the population genetic statistics and population structure analyses.
The Stacks v2.55 pipeline (Catchen et al., 2013; Rochette and Catchen, 2017) was employed to process the reads generated by ddRAD-seq. The raw data was filtered and demultiplexed using process_radtags with the len_limit set to 140 bp to trim low-quality reads, and retain_header -t was set to 135. We used BWA v07.17 (Li and Durbin, 2009) to make an index for the three reference genomes and used BWA-MEM with the default parameters to map the filtered reads to the three reference genomes separately. The mapping rates for each sample to each of the three genomes were calculated using -flagstat in SAMtools v1.7 (Li et al., 2009; Danecek et al., 2021), and the genome with highest mapping rates was chosen to process the later steps. We used gstacks to identify SNPs within the meta population at each locus, and then to genotype each sample at each identified SNP. The populations module in the Stacks pipeline was used to call and filter the SNPs. To reduce the missing rate of SNP matrix, we used the filtering parameter −r = 0.8, in which not less than 80% of individuals in a population were required to possess a locus. The threshold parameters –min-maf = 0.01 was set to improve the accuracy of the model based population structure analyses (Linck and Battey, 2019). To exclude closely linked loci and to keep only the first SNP per ddRAD-seq locus, we used -write-single-snp. Finally, we only keep the SNPs mapped to the chromosomes.
We also used the ipyrad v.0.9.81 pipeline (Eaton and Overcast, 2020) to process the SNP calling task. Filtered by process_radtags in the Stacks pipeline, clean reads were then processed with the following parameters in ipyrad: min depth for statistical base calling = 6, minimum taxon coverage = 75, max heterozygous sites per locus = 0.3. Using the same filtering criteria as in the Stacks pipeline, the SNPs were then filtered using VCFtools v0.1.16 (Danecek et al., 2011) using the following criteria: max missing rate > 0.8, minor allele frequency (MAF) > 0.01, only one SNP per locus kept.
Tajima’s D (Tajima, 1989) was calculated in VCFtools with 20,000 bp window sizes and 95% confidence limit to test all the loci for neutrality. We also detected selected SNP loci using “FST outlier” tests in BayeScan v2.1 (Foll and Gaggiotti, 2008), with a q-value lower than 1%. After filtering the SNP loci potentially under selection, putatively neutral sites were adopted to process the following analyses. We used VCFtools to find cross-validated SNPs shared by the two putatively neutral SNP data sets. Research suggests that SNPs called by more than one pipeline are typically accurate (Torkamaneh et al., 2016). PGDSpider v 2.1.1.5 (Lischer and Excoffier, 2011) was used for format conversion.
Population Structure and Genetic Diversity
Population structure was inferred using Discriminant Analysis of Principal Components (DAPC), Principal Components Analysis (PCA) and Bayesian clustering. DAPC analysis was conducted using the R package “adegenet” (Jombart and Ahmed, 2011). The function find.clusters() in “adegenet” was used to find the de novo population structure and the optimal number of PCs. PCA analysis was also conducted using “adegenet,” both for all samples and for samples in Hekou and Maguan. Bayesian clustering was performed using Admixture (Alexander et al., 2009). To determine the optimal value of K, we tested numbers of clusters from two to seven, with the optimal number of clusters estimated via the lowest cross-validation error rate. We used the package “Pophelper” (Francis, 2017) in R v3.6.3 (R Core Team, 2018) to visualize the Admixture results. Recent gene flow among sampling locations was evaluated using the Bayesian inference approach BayesAss (Wilson and Rannala, 2003) as implemented in the BA3SNP program (Mussmann et al., 2019), with 1.0 × 10⁷ iterations, a burn-in of 1.0 × 10⁶ steps and a sampling frequency of 1,000. The cross-validated SNP data sets were used to improve the accuracy of evaluation. Adjustments were made in the two parameters -a and -f to make the acceptance rates for allele frequencies and inbreeding coefficients between 20 and 60% (Mussmann et al., 2019). AMOVA analysis was carried out in Arlequin v3.5 (Excoffier and Lischer, 2010) to quantify the genetic difference among and within the genetic groups inferred by the population structure analyses. To test for the presence of isolation-by-distance (IBD), we performed Mantel tests using the R package “ade4” (Dray and Dufour, 2007) with 10,000 permutations.
The nucleotide diversity (π), expected heterozygosity (He), observed heterozygosity (Ho), fixation index (FST) and inbreeding coefficient (FIS) were calculated at each sampling location and genetic group using the populations module in the Stacks pipeline. Contemporary effective population size (Ne) for each sampling location and each genetic group (sample size = n) was estimated using the linkage disequilibrium method in NeEstimator V2 (Do et al., 2014) with the minor allele frequency cutoff set within the following interval: 1/(2n) ≤ PCRIT ≤ 1/n (Waples and Do, 2010).
Inference of Demographic History
We used Stairway plot 2 (Liu and Fu, 2020) to infer the demographic history of Magnolia fistulosa under a mutation rate of 4e-9 per locus per year (referring to M. sinica, unpublished data) and a generation time of 10 years, which was estimated from the cultivation records in Kunming Botanic Garden and Gulinqing Nature Reserve. We generated Site Frequency Spectra (SFS) for all samples and for each genetic group inferred from the population structure analyses. Controlling overfitting is important in the inference of demographic history (Liu and Fu, 2020), and we therefore generated both unfolded and folded SFS for M. fistulosa using the functions doSaf and realSFS in the ANGSD v 0.921 (Korneliussen et al., 2014) with the recommended filtering parameters -minMapQ 30 -minQ 20 and taking the genome of M. sinica as the ancestral state.
Results
Processing of Sequence Data
A total of 425 million reads were produced for all samples. After filtering out low quality reads and reads without RAD-tags, 412 million reads remained for processing (Supplementary Table 1). The sequencing depth of samples ranged from 4.2× (BP4) to 12.71× (BSH2), with a mean coverage of 7.49× (Supplementary Table 1). After filtering, each individual was mapped to three reference genomes. The average mapping rate to Magnolia sinica was 86.00%, which outperformed M. officinalis (84.77%) and M. biondii (84.93%) (Supplementary Table 2). M. sinica was therefore chosen for use in the analysis pipelines.
Using the reference-based analysis in the Stacks pipeline, we produced 15,274 SNPs (Stacks data set). The missing rates in the Stacks data set ranged from 0 to 30.8%, with a mean missing rate of 5.5% (Supplementary Table 3). Using the reference assembly method in the ipyrad pipeline, we produced 18,963 SNPs (ipyrad data set). The missing rate in the ipyrad data set ranged from 2.2 to 54.3%, with a mean missing rate of 14.2% (Supplementary Table 3). Compared to the Stacks pipeline, ipyrad generated more SNPs, however, the ipyrad data set had a higher average missing rate.
Tajima’s D statistic showed that no selected sites were present in either of the two data sets, while BayeScan detected two SNPs in each data set under positive selection and a single SNP under balancing selection in the ipyrad data set. After filtering, 15,272 and 18,960 putatively neutral SNPs were retained in the Stacks and ipyrad data sets, respectively (Supplementary Figure 1). After comparison, a total of 1,612 SNPs cross-validated by both data sets were found.
Population Structure and Genetic Diversity
Discriminant Analysis of Principal Components analysis supported the presence of four genetic groups (Figure 2B and Supplementary Figure 2), with samples from QCP, QSH, and 7 of the individuals from LB each clustering in its own group (QCP, QSH, and LBI, respectively), and all the other individuals (sampling locations MCP, BSH, CEN, JYZ, and LBE, representing another 8 individuals from LB) forming one group (HM; Figure 2B). We also conducted DAPC analysis to find de novo clusters within the samples only from Hekou and Maguan, and found LBI was separated from HM (Supplementary Figures 3, 4). The conclusions of the PCA were congruent to those of DAPC, as they also indicated that LBI was strongly separated from other samples in Hekou and Maguan (HM; Figure 2C and Supplementary Figure 4).
Bayesian clustering analysis was performed in Admixture. The two best two values of K, as indicated by CV error values, were 3 and 5 in the Stacks data set and 3 and 4 in the ipyrad data set (Supplementary Figure 5). Under K = 3, groups inferred from the Stacks data set and the ipyrad data set were congruent with the exception of LBI: whereas in the Stacks data set, LBI was joined with QCP in one genetic group (Figure 3A), in the ipyrad data set, it grouped with other samples from Hekou and Maguan (MCP, BSH, CEN, JYZ, and LBE; Figure 3C). In the K = 5 scenario from the Stacks data set (Figure 3B), the samples from Hekou and Maguan were further divided into three clusters, one including samples from MCP, BSH, and CEN, and the other two jointly including samples from LB and JYZ. In the K = 4 scenario from the ipyrad data set (Figure 3D) the samples from Hekou and Maguan were divided into two clusters, but in contrast to results from the Stacks data set JYZ was joined with MCP, BSH, and CEN in one cluster. Admixture analysis within the samples from Hekou and Maguan showed that the best number of clusters in both data sets was one (Supplementary Figures 5C,D). BayesAss analysis suggested that recent gene flow (over the last 1–3 generations) among sampling locations showed gene flow from JYZ to two genetic groups in LB, and gene flow from CEN to BSH and LBE (Table 1 and Supplementary Table 4). The Mantel test of geographical distance and genetic differentiation indicated that IBD is an important factor for the divergence of Magnolia fistulosa (R2 = 0.41, P < 1e-2 and R2 = 0.44, P < 1e-2 in two data sets; Supplementary Figure 6).
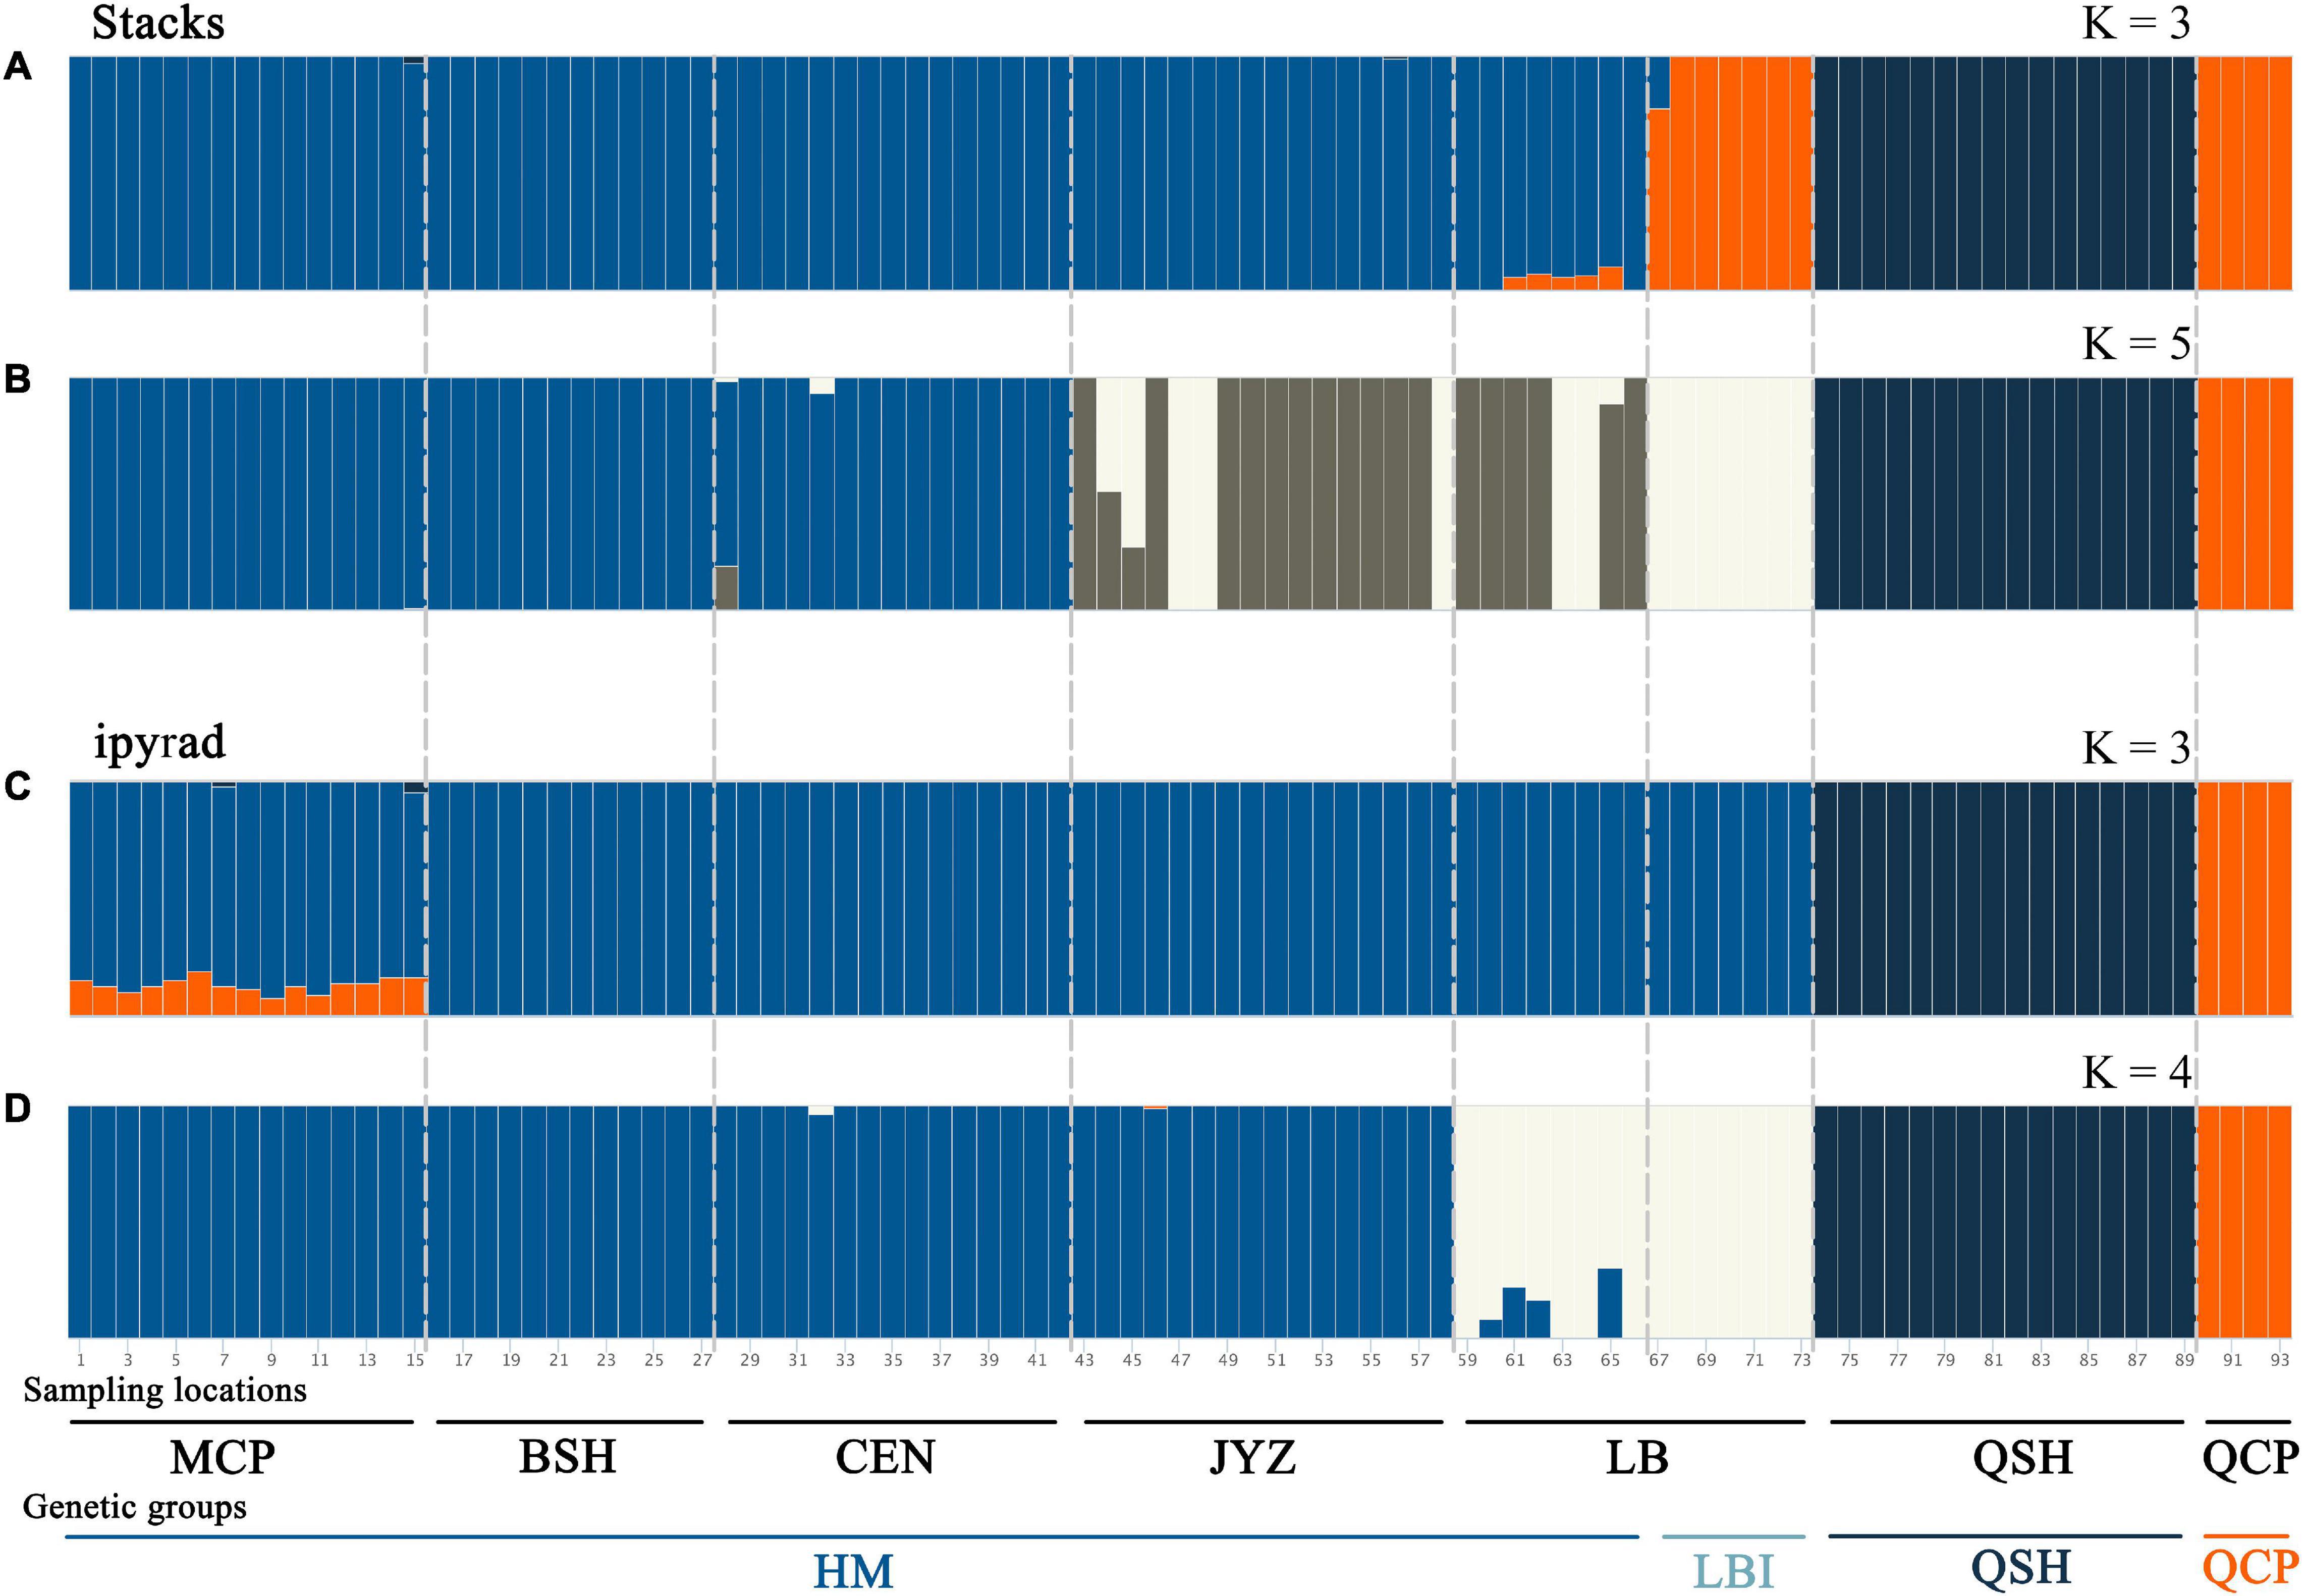
Figure 3. Population structure of Magnolia fistulosa inferred by two data sets. Admixture results with (A) K = 3 and (B) K = 5 in the Stacks data set, (C) K = 3 and (D) K = 4 in the ipyrad data set. The two lines represent each sampling location and the genetic cluster divided by DAPC and PCA analyses.
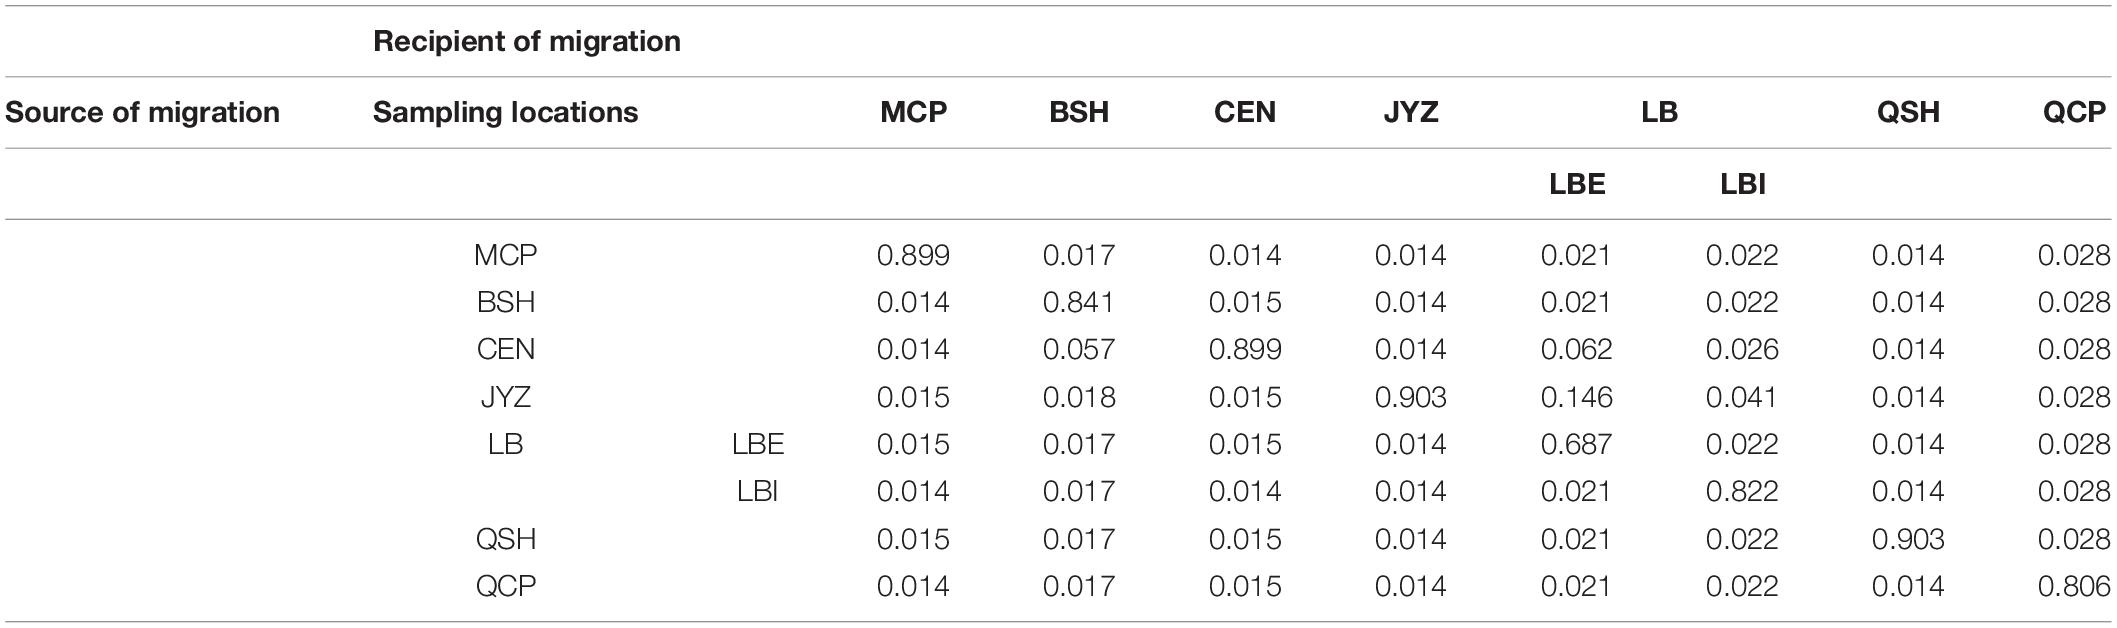
Table 1. Recent migration rates between each sampling location and the two genetic groups in LB using the cross-validated SNPs from the Stacks data set.
The fixation index (FST) showed that the genetic differences among samples in Hekou and Maguan were relatively small (FST < 0.15), while the genetic differences between QCP, QSH, and LBI were larger. QCP and LBI had the highest FST values, which were calculated to be 0.359 and 0.469 in the Stacks and ipyrad data sets, respectively (Table 2). AMOVA analysis revealed that 27.08 and 26.82% of the genetic variation was distributed between four genetic groups (HM, LBI, QSH, and QCP; Supplementary Table 5).
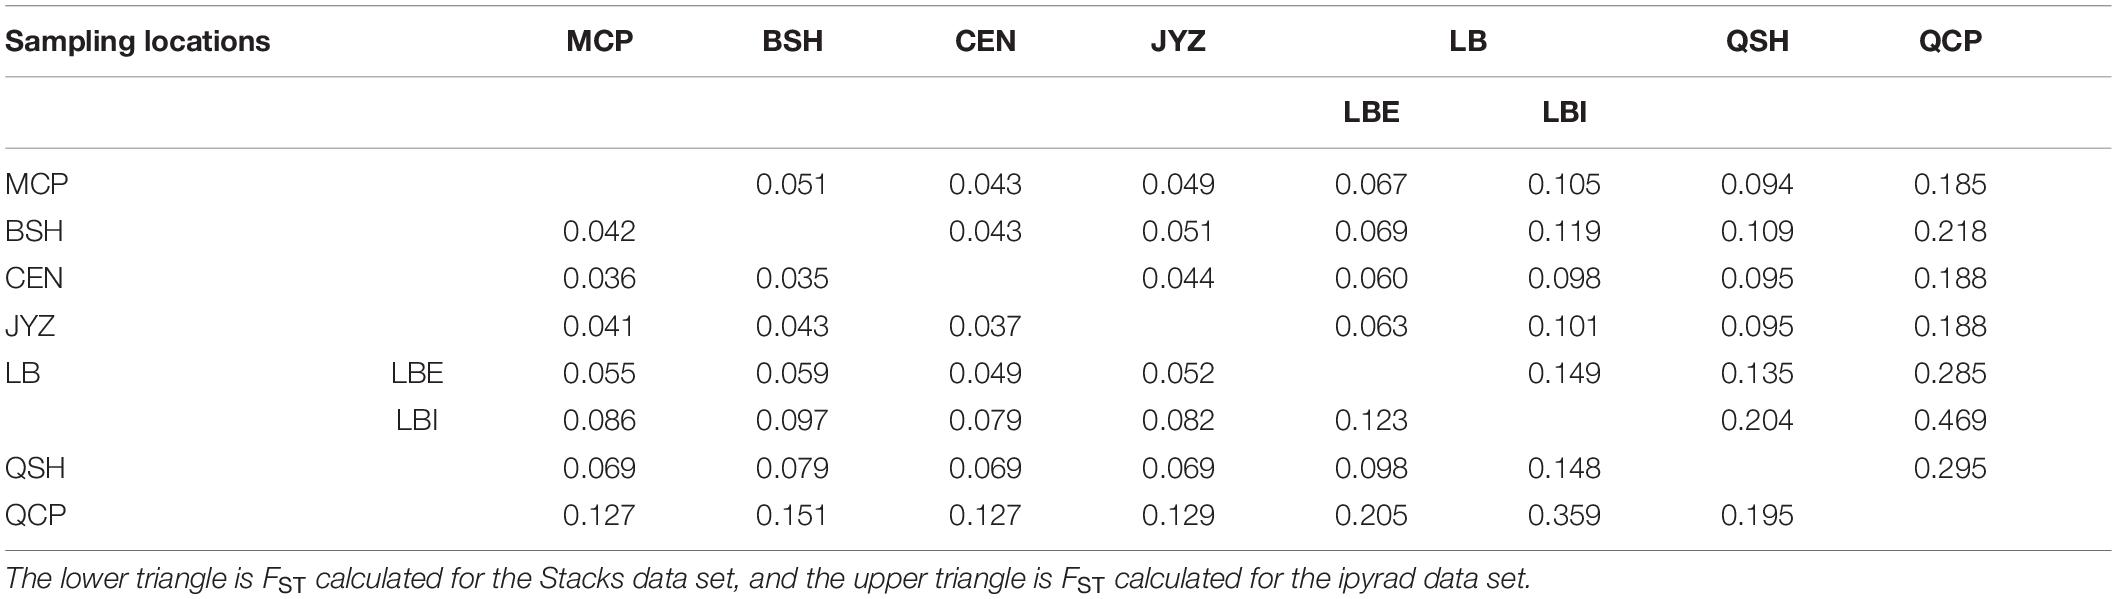
Table 2. Genetic differentiation coefficient (FST) between each sampling location and the two genetic groups in LB.
The two data sets showed the same trends in all population genetic statistics, however, the ipyrad data set had higher absolute values than the Stacks data set (Table 3). From the Stacks data set, π ranged from 0.030 (QCP) to 0.067 (MCP), and was 0.072 at the species level. In the ipyrad data set, π ranged from 0.041 (QCP) to 0.084 (MCP) and was 0.097 at the species level. The HM genetic group exhibited the highest nucleotide diversity in both data sets (0.068 and 0.089 in the Stacks and ipyrad data sets, respectively). Ho and He ranged from 0.034 (QCP) to 0.055 (LB) and from 0.027 (QCP) to 0.064 (MCP), respectively, in the Stacks data set, and from 0.048 (QCP) to 0.065 (MCP) and from 0.035 (QCP) to 0.081 (MCP), respectively, in the ipyrad data set. The values of the inbreeding coefficients (FIS) were negative in QCP and LBI (Table 3). The genetic summary statistics calculated using the cross-validated SNPs (1,612 SNPs) data sets were basically identical and were in the middle of the values from the Stacks and ipyrad data sets (15,272 and 18,960 SNPs) individually (Supplementary Tables 6, 7).
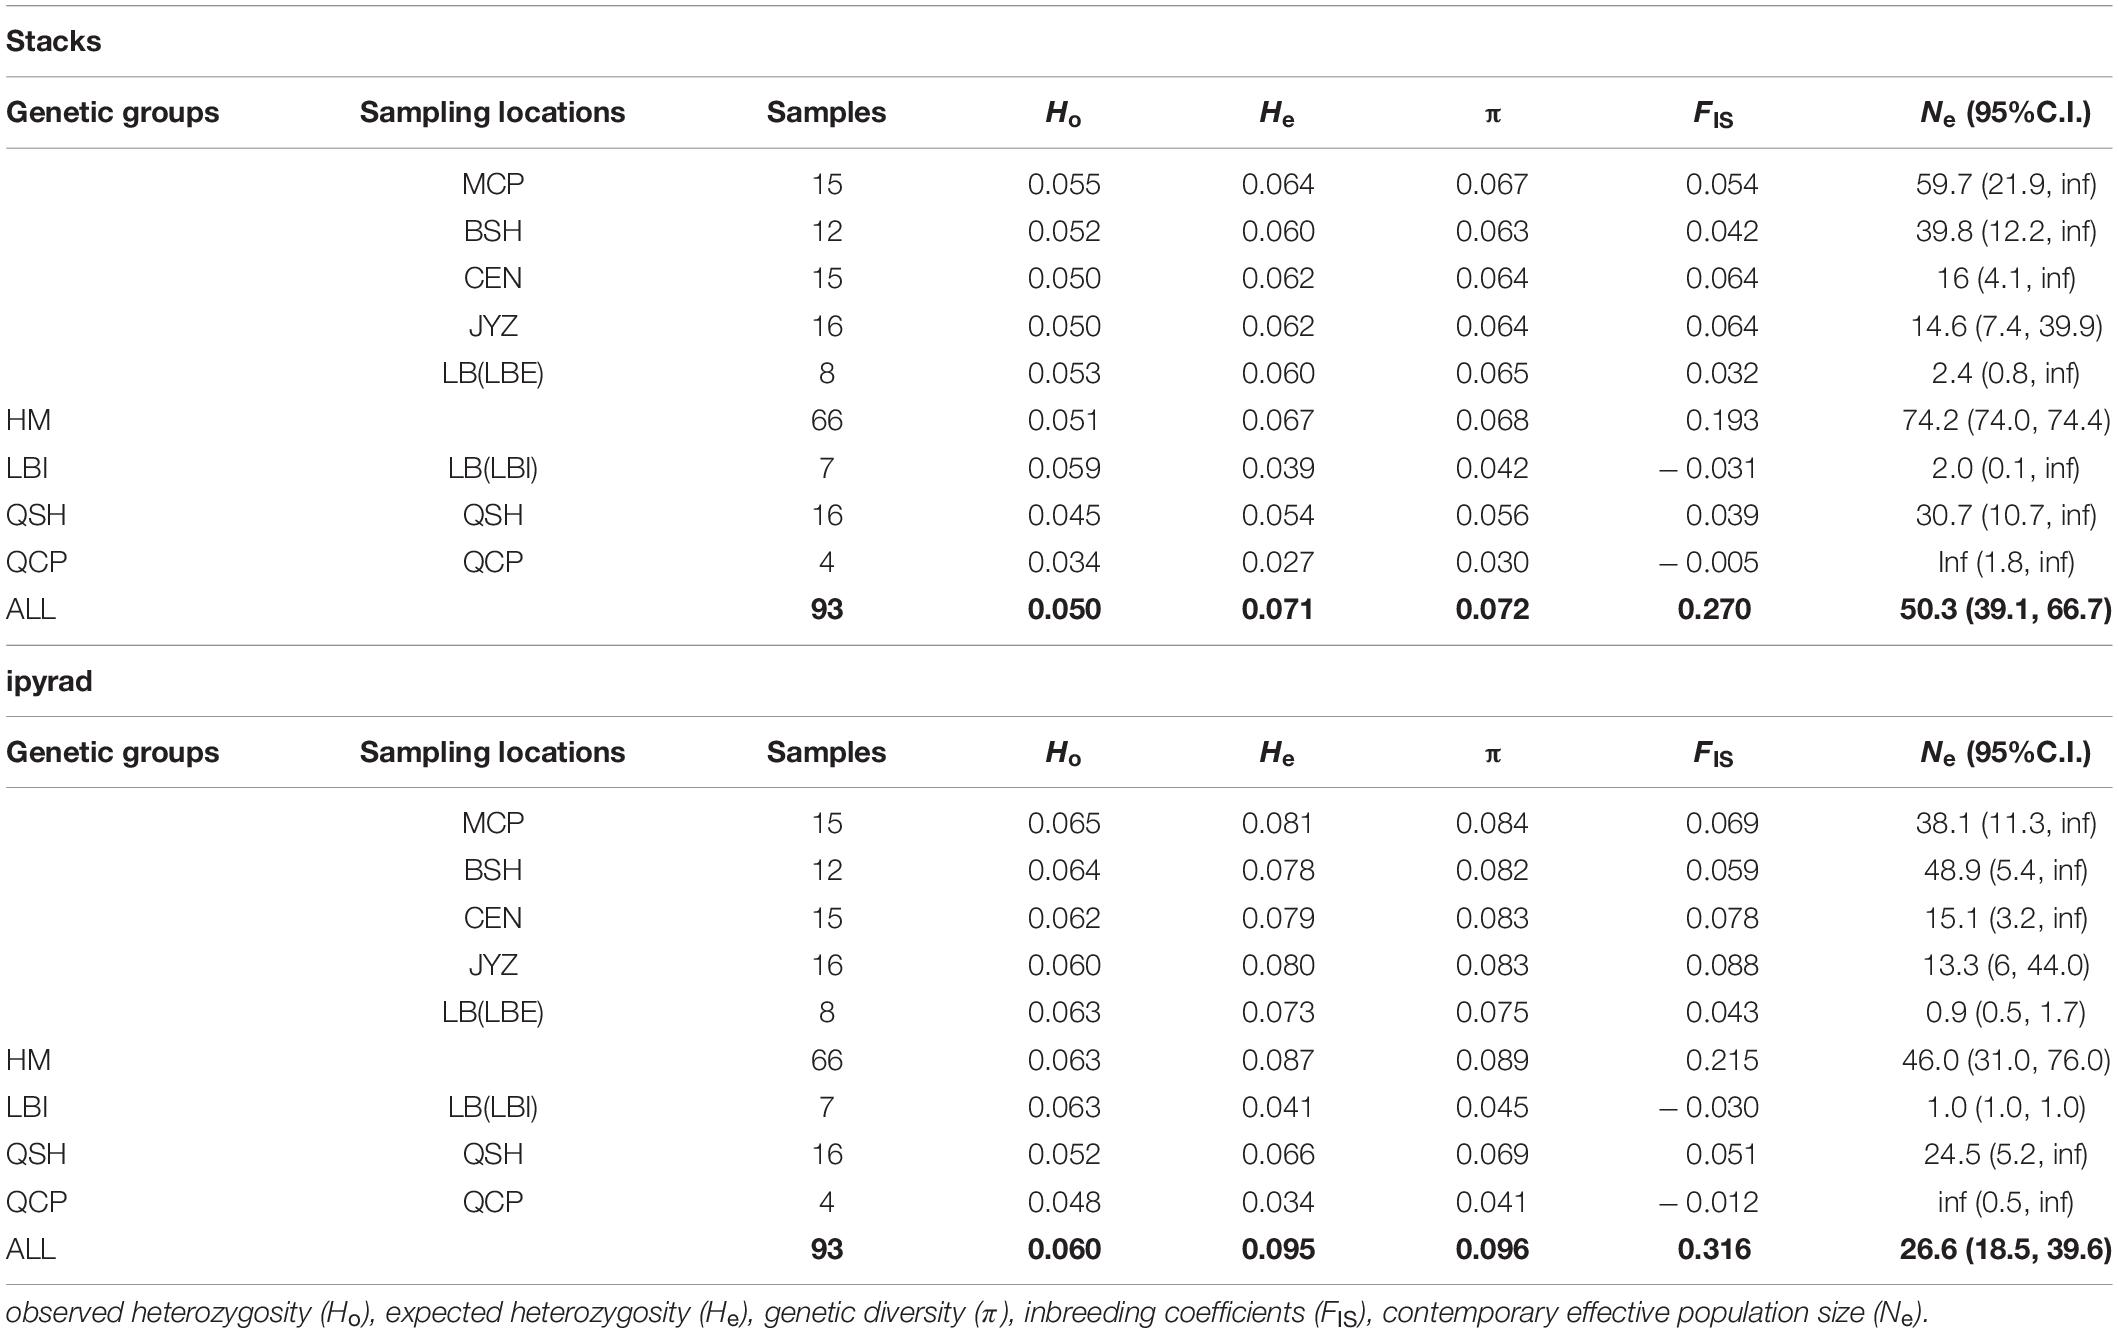
Table 3. Summary of genetic diversity and effective population size calculated from two data sets (Stacks data set, ipyrad data set).
Apart from QCP, where no reliable Ne estimates could be obtained (infinite effective population size) the Ne estimated by NeEstimator V2 in the other five sampling locations and two genetic groups in LB ranged from 2.0 (LBI) to 59.7 (MCP) in the Stacks data set and from 0.9 (LBI) to 48.9 (BSH) in the ipyrad data set (Table 3).
Inference of Demographic History
Because the very low number of samples in QCP and LBI did not allow accurate inference of demographic history, demographic history was only inferred for all samples, for the HM genetic group and for the QSH genetic group. The demographic history inferred from unfolded SFS was associated with narrower confidence intervals than that inferred from folded SFS (Figure 4 and Supplementary Figure 7). Fluctuations in the effective population size indicated that both populations had experienced three population declines. The earliest decline occurred about 0.5–0.8 Ma ago, the second occurred 0.2–0.3 Ma ago (Figure 4B). During the last glacial stage, the HM genetic group underwent a fluctuation in the effective population size 0.02–0.03 Ma ago, as revealed by unfolded SFS (Figure 4B). In contrast, the folded SFS did not suggest that there was any severe population decline during the last glacial stage (Figure 4A). QSH underwent a bottleneck event in 0.01–0.03 Ma ago, revealed by both folded and unfolded SFS analyses (Figures 4A,B).
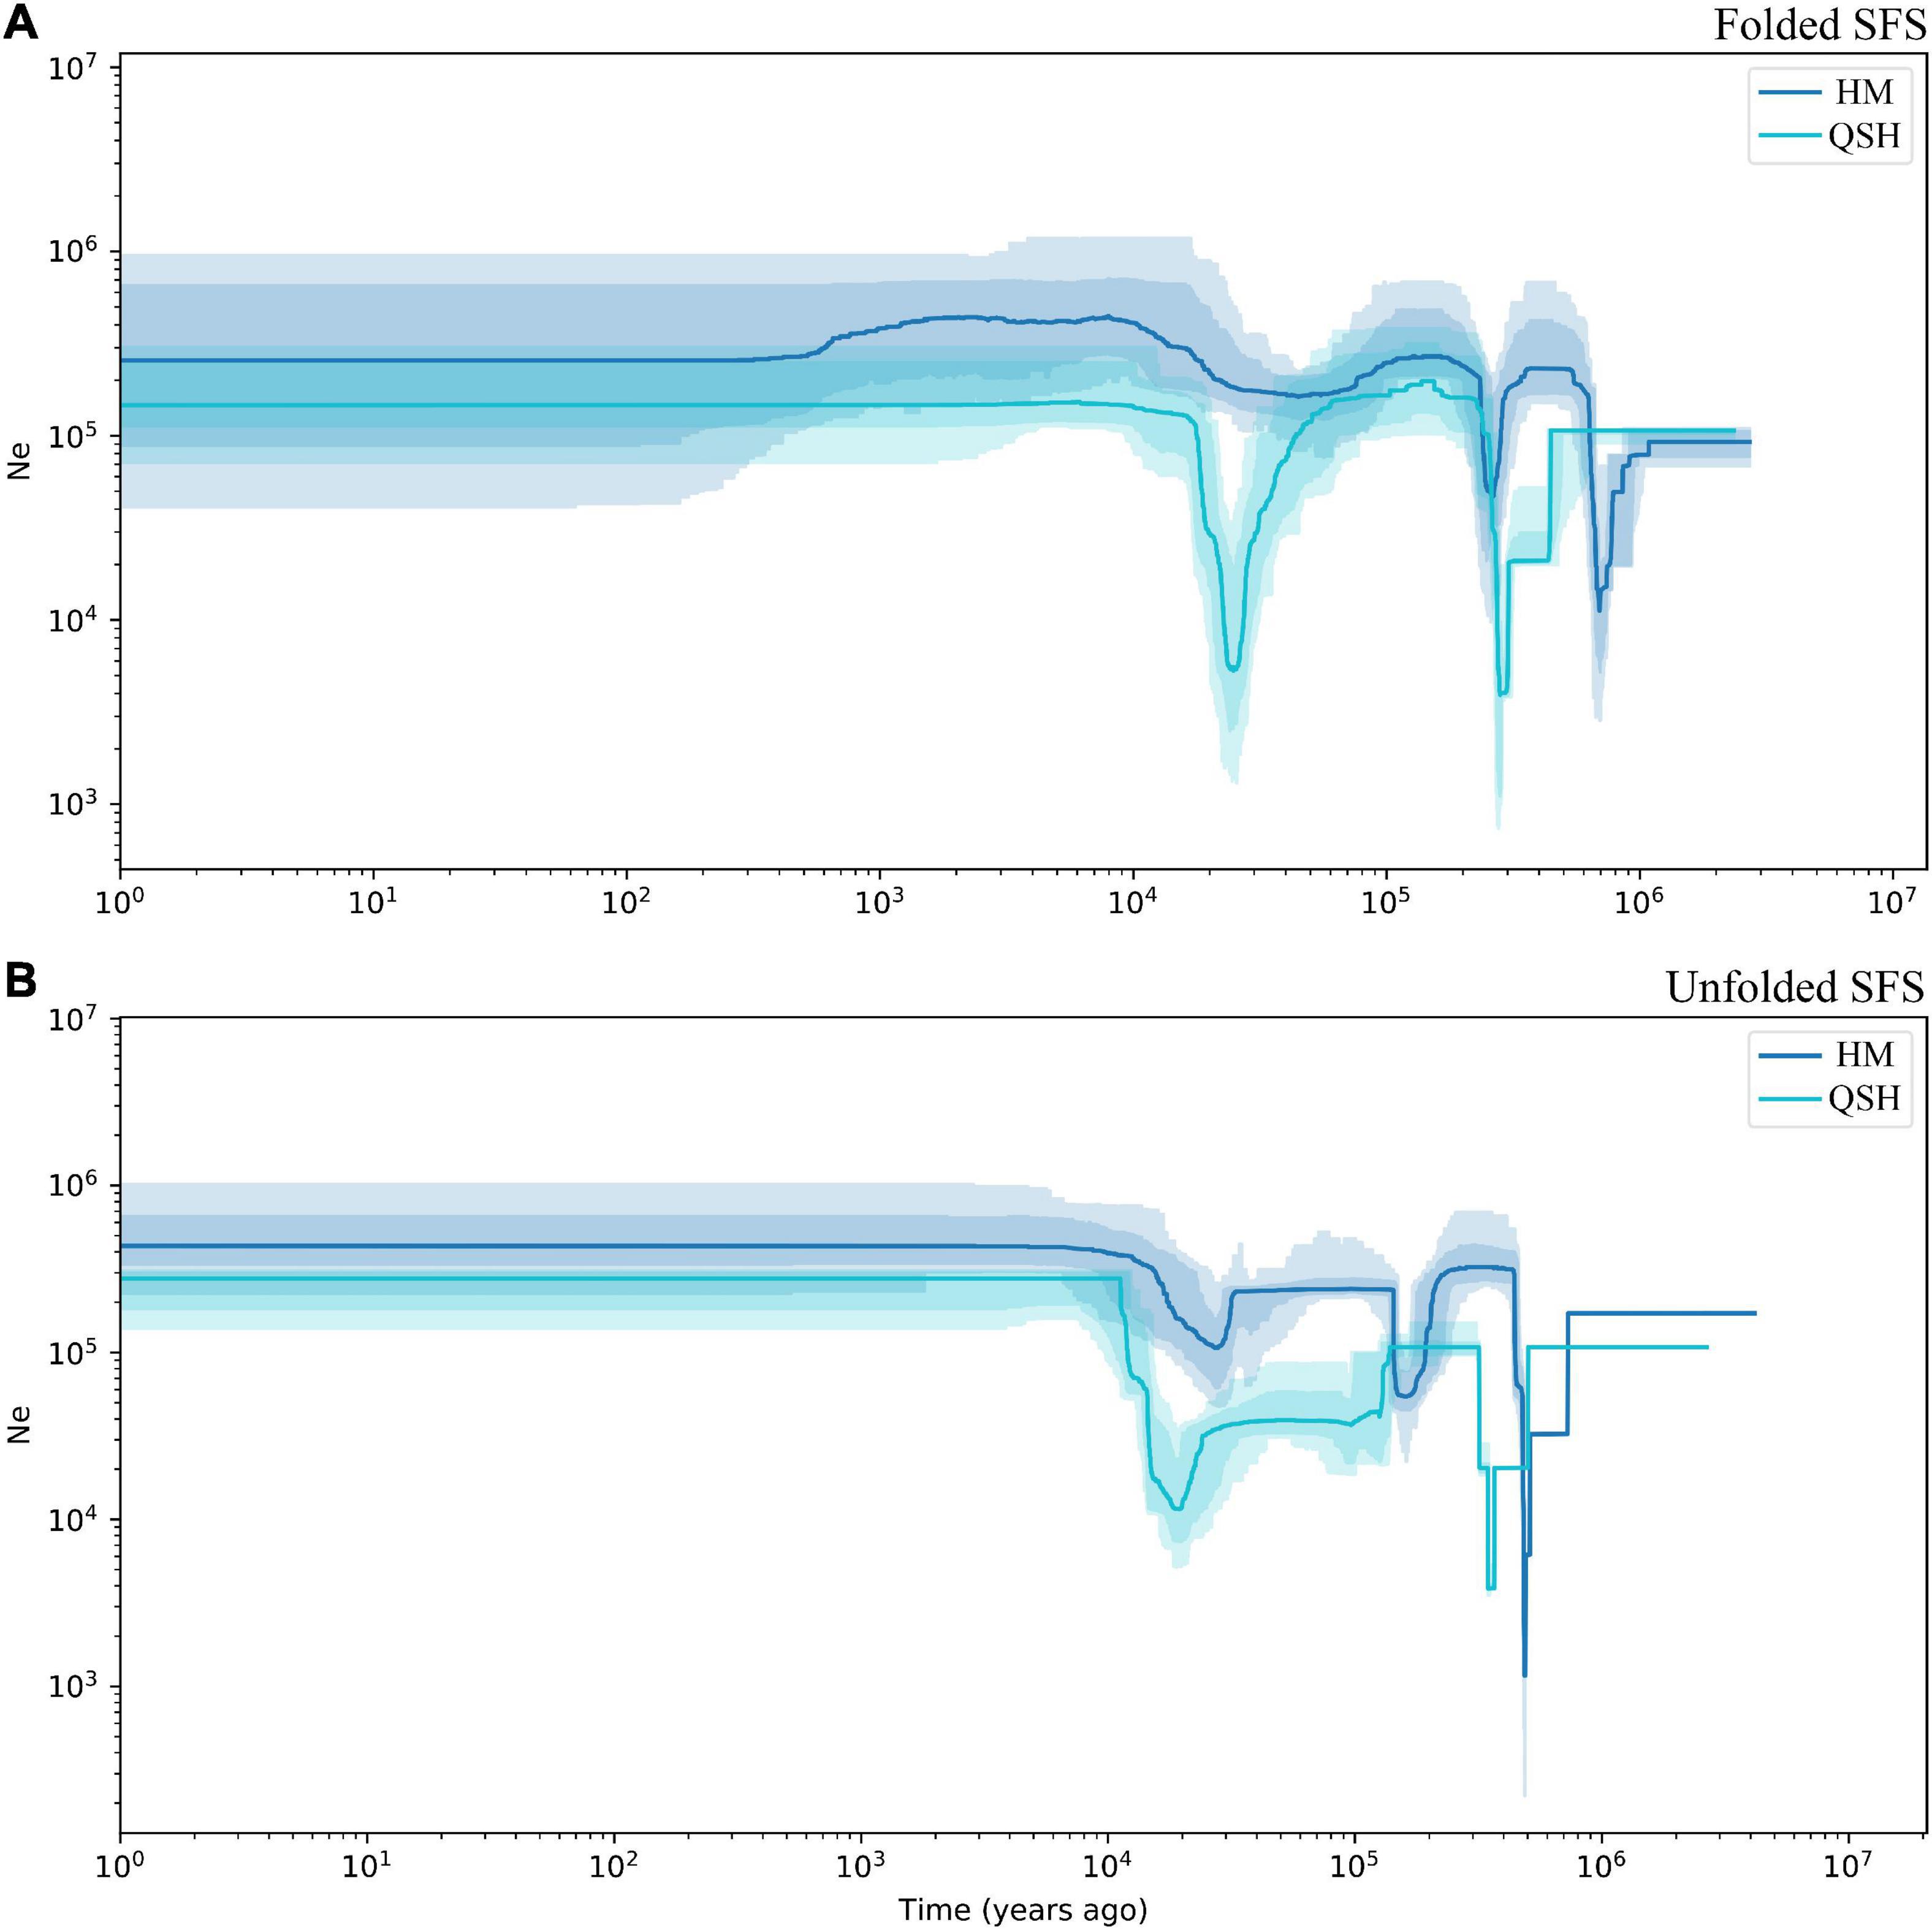
Figure 4. Demographic history of Magnolia fistulosa inferred by Stairway plot2. HM and QSH were inferenced with (A) folded SFS and (B) unfolded SFS. The 95% confidence interval for the estimated effective population size is shown by light color.
Discussion
Comparison of the Stacks and Ipyrad Pipelines
The use of different analysis tools can verify the reliability of results (Qi et al., 2015; Boukteb et al., 2021), and the adoption of a reference genome is known to greatly improve the performance of RAD-seq technologies (Torkamaneh et al., 2016). Given that several genomes in the Magnoliaceae were available (BioProject ID PRJNA774088, Dong et al., 2021; Yin et al., 2021), we adopted a reference guided approach to process the population genetics of Magnolia fistulosa using both the Stacks and ipyrad pipelines. Although we used the same parameters and filtering criteria, the SNP data set generated by the two pipelines differed in the number of SNPs called and in the average missing rate. Compared to the Stacks pipeline, the genetic statistics calculated by the ipyrad pipeline had higher absolute values. However, despite the differences in the data generated using the two pipelines, the same trends were found in the genetic statistics, population structure analyses and recent gene flow (Supplementary Figures 2–4, 6; Tables 1–3 and Supplementary Tables 5, 7). Groupings inferred via DAPC and PCA analysis are fundamentally the same (Supplementary Figures 2, 4). The Admixture analysis divided QCP and QSH from other samples in most scenarios (Supplementary Figures 8–11).
The choice of analysis method is known to have a large impact on the resulting genotypic information, and to affect the number and quality of the resulting genetic makers (Qi et al., 2015; Torkamaneh et al., 2016). Our results show that the results estimated by the two SNP data sets generated by the reference-based Stacks and ipyrad pipelines are not substantially different.
Population Structure
The elucidation of the genetic structure of threatened species is paramount to the identification of conservation units (Funk et al., 2012). In our study, QSH and QCP could be separated from other samples from Hekou and Maguan in all of the analyses. However, the samples from Hekou and Maguan showed more complex patterns of population structure. Conflict of population structure inferred using different methods and data sets may indicate the close genetic distances of the samples in Hekou and Maguan (Liu et al., 2020).
Pollen transportation by beetles in Magnolia has been proven to be specific, effective, and to make a significant contribution to the cross-pollination (Matsuki et al., 2008; Hernández-Vera et al., 2021). The seeds of M. fistulosa, like other Magnolia species, are consistent with bird dispersal syndromes (Lomascolo et al., 2008). The low genetic differentiation among individuals in Hekou and Maguan may have benefited from high gene flow facilitated by pollinators and seed dispersal in the past. However, BayesAss analysis revealed low recent gene flow between MCP, BSH, CEN, and JYZ, which may be a result of increased habitat fragmentation caused by the development of farmland in recent decades. Although we cannot say with certainty why the samples from LB comprise two genetic groups, we note that LB is near the Chinese-Vietnamese border, and we, therefore, assume that there are unsampled populations in Vietnam, which have the genetic background seen in LBI (Yang et al., 2015).
The Mantel test of geographic distance and genetic distance between the seven sampling locations indicated a significant pattern of IBD in Magnolia fistulosa (Supplementary Figure 6). Additionally, the terrain may also affect the gene flow of this species. The samples in Hekou and Maguan and QSH are found in the Red River valley, while the QCP is found on the other side of the Ailao Mountain, across a phytogeographic boundary known as the Tanaka-Kaiyong Line (Li and Li, 1997; Fan et al., 2013). Although the geographical distance between QSH and QCP is almost the same as that to the HM genetic group (60 km), the former has a greater genetic distance inferred by FST (Table 2).
Genetic Diversity
Small isolated populations often suffer from lower genetic diversity, due to inbreeding, genetic drift and reduced gene flow (Frankham, 2015; Ma et al., 2021b). The four genetic clusters observed in Magnolia fistulosa show differences in genetic diversity (Table 3). The HM genetic group, which is the biggest population of M. fistulosa, shows highest genetic diversity. QCP, on the contrary, which is the smallest population (four individuals), has the lowest genetic diversity. Although being geographically distant from the other populations, the genetic diversity of QSH was only slightly decreased compared to that of the HM genetic group.
MCP and BSH have relatively large contemporary Ne. MCP comprises more than 70 individuals of Magnolia fistulosa, which is the largest locality found to date. We only investigated 20 individuals in BSH, however, there is a further record of M. fistulosa in Bojia Village near BSH. Fewer than 20 mature individuals were found in QSH, which is close to the estimated Ne (30.7 and 24.5). Contemporary Ne is usually smaller than the real population size (Spies et al., 2020; Zhang et al., 2020), therefore, we believe that there are more, as yet undiscovered, individuals of M. fistulosa in QSH. The relatively large contemporary Ne may explain why the genetic diversity of QSH has not declined significantly (Reed and Frankham, 2003; Frankham et al., 2014). Extremely small contemporary Ne estimates in both of the two genetic clusters in LB may indicate that the number of individuals involved in reproduction in LB is quite small. The infinite estimates of Ne in the QCP may be due to sampling a limited number of individuals (Do et al., 2014).
Magnolia fistulosa has relatively high genetic diversity (calculated to be 0.072 and 0.096 using the Stacks and ipyrad data sets, respectively) compared to some endangered plants assessed using ddRAD-seq. For example, lower genetic diversity was found in Viola uliginosa (Violaceae; 0.0440; Lee et al., 2020), Rhododendron cyanocarpum (Ericaceae; 0.0702; Liu et al., 2020), Clermontia fauriei (Campanulaceae; 0.0014), and Cyanea pilosa (Campanulaceae; 0.0012; Jennings et al., 2016). Relatively high genetic diversity and large population differentiation has been found in other threatened Magnolia species, including M. odora (AFLP analysis, Huang and Zhuang, 2002) and M. grandis (ISSR analysis, Chen et al., 2010). The endangered status of these species is therefore likely to have been caused by recent population declines.
Demographic History of Magnolia fistulosa
Inferring the demographic history of endangered species is important for understanding the threats that face them (Yang et al., 2018; Ma et al., 2021b). Stairway plot 2 is a model-flexible method to infer demographic history, and uses SFS calculated from phased or unphased sequence data. As fragmented sequencing has limited influence on the generation of the SFS (Beichman et al., 2018), Stairway plot performs well in studies using RAD-seq technology (Cristofari et al., 2018; Sakaguchi et al., 2021).
The first population decline in Magnolia fistulosa is inferred to have occurred about 0.5–0.8 Ma years ago, possibly linked to the Naynayxungla glaciation (0.5–0.8 Ma) (Zheng et al., 2002). The Naynayxungla glaciation was the largest glaciation in the Qinghai-Tibet Plateau during the Middle Pleistocene, and population declines during this period have also been observed in other species in China (Yang et al., 2018; Ma et al., 2021c). A bottleneck in M. fistulosa also occurred at about 0.2–0.3 Ma years ago, which is consistent with the time of a high lateral moraine of the penultimate glacial period (316.27 ± 63.2 ka and 257.27 ± 51.4 ka), as dated by electron spin-resonance spectroscopy (Zheng et al., 2002). Temperature drops during this time (0.24–0.28 Ma) have been suggested by many studies (Zheng et al., 2002; Sun and An, 2005). During the last glacial period, the population decline about 0.02–0.03 Ma years ago may correspond to the Last Glacial Maximum (LGM) occurring 19.0–26.5 Ka years ago (Sun and An, 2005; Clark et al., 2009; Zhao et al., 2021).
Although the total Magnolia fistulosa population experienced multiple shrinkages in the past (Figure 4 and Supplementary Figure 7), it recovered to a considerably high level after the LGM, which may explain the high genetic diversity we observed. The stable population seen in the recent history may indicate that human disturbance is the most important threat, causing the low current population sizes and restricted distribution of this species.
Implications for the Conservation and Management of Magnolia fistulosa
Despite its small population sizes and narrow distribution, Magnolia fistulosa has relatively high genetic diversity and large population differentiation. Based on our findings, we recommend the following conservation management. (1) Ex situ conservation process should be carried out to ensure the long-term survival of M. fistulosa. Based on the results of our population structure inference, QSH and QCP represent unique genetic resources and should both be collected and protected. Within the samples in Hekou and Maguan, MCP, BSH, and CEN can be considered as one genetic cluster, but the samples from JYZ and LB should be collected separately. (2) Most individuals in the Hekou-Maguan and QSH are already under protection in the Daweishan National Nature Reserve and Gulinqing Provincial Nature Reserve, however, land development may have damaged the connectivity in this area, which is reflected in the low recent gene flow within samples from Hekou and Maguan. To prevent further restriction of gene flow, we recommend restoring some areas of farm land to forest in the Daweishan National Nature Reserve and Gulinqing Provincial Nature Reserve, especially along steams, which are particularly suitable habitats for M. fistulosa. (3) Despite the fact that we conducted several investigations, only four individuals were found in the QCP, and these were close together. To prevent further genetic recession, we recommend adopting artificial outcrossing and propagation in this population. Furthermore, because the location of this population does not belong to any nature reserve, we recommend establishing mini-reserves to implement rescue protection of the QCP population (Yang et al., 2020).
Data Availability Statement
The datasets presented in this study can be found in online repositories. The names of the repository/repositories and accession number(s) can be found below: www.ncbi.nlm.nih.gov/bioproject/PRJNA770186.
Author Contributions
WS developed the idea. FY and LC designed the experiment, interpreted the results, and wrote the manuscript. FY, LC, and ZD collected the leaf materials. FY performed the statistical analyses. WS and ZD acquired the funding. All authors read and approved the final manuscript.
Funding
This work was supported by the Science and Technology Basic Resources Investigation Program of China (Grant No. 2017FY100100), NSFC (National Natural Science Foundation of China) (Grant No. 32101407) and NSFC (National Natural Science Foundation of China) – Yunnan Joint Fund (Grant No. U1302262).
Conflict of Interest
The authors declare that the research was conducted in the absence of any commercial or financial relationships that could be construed as a potential conflict of interest.
Publisher’s Note
All claims expressed in this article are solely those of the authors and do not necessarily represent those of their affiliated organizations, or those of the publisher, the editors and the reviewers. Any product that may be evaluated in this article, or claim that may be made by its manufacturer, is not guaranteed or endorsed by the publisher.
Acknowledgments
We would like to thank Yang Liu, Xufang Chen, Pin Zhang, Guiliang Zhang, and Guoyun Li for help with sampling, and Yubing Zhou and Rengang Zhang for their help with data analysis.
Supplementary Material
The Supplementary Material for this article can be found online at: https://www.frontiersin.org/articles/10.3389/fpls.2022.811312/full#supplementary-material
References
Alexander, D. H., Novembre, J., and Lange, K. (2009). Fast model-based estimation of ancestry in unrelated individuals. Genome Res. 19, 1655–1664. doi: 10.1101/gr.094052.109
Allendorf, F. W., Hohenlohe, P. A., and Luikart, G. (2010). Genomics and the future of conservation genetics. Nat. Rev. Genet. 11, 697–709. doi: 10.1038/nrg2844
Andrews, K. R., Good, J. M., Miller, M. R., Luikart, G., and Hohenlohe, P. A. (2016). Harnessing the power of RADseq for ecological and evolutionary genomics. Nat. Rev. Genet. 17, 81–92. doi: 10.1038/nrg.2015.28
Azuma, H., García-Franco, J. G., Rico-Gray, V., and Thien, L. B. (2001). Molecular phylogeny of the magnoliaceae: the biogeography of tropical and temperate disjunctions. Am. J. Bot. 88, 2275–2285. doi: 10.2307/3558389
Beichman, A. C., Huerta-Sanchez, E., and Lohmueller, K. E. (2018). Using genomic data to infer historic population dynamics of nonmodel organisms. Annu. Rev. Ecol. Evol. Syst. 49, 433–456. doi: 10.1146/annurev-ecolsys-110617-062431
Bijlsma, R., and Loeschcke, V. (2012). Genetic erosion impedes adaptive responses to stressful environments. Evol. Appl. 5, 117–129. doi: 10.1111/j.1752-4571.2011.00214.x
Bomblies, K., and Weigel, D. (2007). Arabidopsis: a model genus for speciation. Curr. Opin. Genet. Dev. 17, 500–504. doi: 10.1016/j.gde.2007.09.006
Boukteb, A., Sakaguchi, S., Ichihashi, Y., Kharrat, M., Nagano, A. J., Shirasu, K., et al. (2021). Analysis of genetic diversity and population structure of Orobanche foetida populations from tunisia using RADseq. Front. Plant. Sci. 12:618245. doi: 10.3389/fpls.2021.618245
Budd, C., Zimmer, E., and Freeland, J. R. (2015). Conservation genetics of Magnolia acuminata, an endangered species in Canada: can genetic diversity be maintained in fragmented, peripheral populations? Conserv. Genet. 16, 1359–1373. doi: 10.1007/s10592-015-0746-9
Cai, L., Zhang, G. L., Xiang, J. Y., Dao, Z. L., and Sun, W. B. (2019). Rescuing Christensenia aesculifolia (marattiaceae), a plant species with an extremely small population in China. Oryx 53, 436–438. doi: 10.1017/s003060531800039x
Catchen, J., Hohenlohe, P. A., Bassham, S., Amores, A., and Cresko, W. A. (2013). Stacks: an analysis tool set for population genomics. Mol. Ecol. 22, 3124–3140. doi: 10.1111/mec.12354
Chen, S. Y., Han, Y., Wu, T., Fu, Y. B., Sima, Y. K., and Hao, J. B. (2010). Genetic diversity of endangered species Manglietia grandis detected by inter simple sequence repeat markers. J. Fujian Agric. For. Univ. 30, 56–60.
Cires, E., De Smet, Y., Cuesta, C., Goetghebeur, P., Sharrock, S., Gibbs, D., et al. (2013). Gap analyses to support ex situ conservation of genetic diversity in magnolia, a flagship group. Biodivers. Conserv. 22, 567–590. doi: 10.1007/s10531-013-0450-3
Clark, P. U., Dyke, A. S., Shakun, J. D., Carlson, A. E., Clark, J., Wohlfarth, B., et al. (2009). The Last Glacial Maximum. Science 325, 710–714. doi: 10.1126/science.1172873
R Core Team (2018). R: A Language and Environment for Statistical Computing. Vienna, Austria: R Foundation for Statistical Computing.
Crane, P. (2020). Conserving our global botanical heritage: the PSESP plant conservation program. Plant Divers. 42, 319–322. doi: 10.1016/j.pld.2020.06.007
Cristofari, R., Liu, X., Bonadonna, F., Cherel, Y., Pistorius, P., Le Maho, Y., et al. (2018). Climate-driven range shifts of the king penguin in a fragmented ecosystem. Nat. Clim. Chang. 8, 245–251. doi: 10.1038/s41558-018-0084-2
Danecek, P., Auton, A., Abecasis, G., Albers, C. A., Banks, E., DePristo, M. A., et al. (2011). The variant call format and VCFtools. Bioinformatics 27, 2156–2158. doi: 10.1093/bioinformatics/btr330
Danecek, P., Bonfield, J. K., Liddle, J., Marshall, J., Ohan, V., Pollard, M. O., et al. (2021). Twelve years of SAMtools and BCFtools. GigaScience 10:giab008. doi: 10.1093/gigascience/giab008
Deng, Y. F. (2019). (2679) Proposal to conserve the name Talauma fistulosa (Lirianthe fistulosa, Magnolia fistulosa) (magnoliaceae) with a conserved type. Taxon 68, 405–406. doi: 10.1002/tax.12041
Do, C., Waples, R. S., Peel, D., Macbeth, G. M., Tillett, B. J., and Ovenden, J. R. (2014). Ne estimator v2: re-implementation of software for the estimation of contemporary effective population size (Ne) from genetic data. Mol. Ecol. Resour. 14, 209–214. doi: 10.1111/1755-0998.12157
Dong, S. S., Liu, M., Liu, Y., Chen, F., Yang, T., Chen, L., et al. (2021). The genome of magnolia biondii pamp. provides insights into the evolution of magnoliales and biosynthesis of terpenoids. Hort. Res. 8:38. doi: 10.1038/s41438-021-00471-9
Dray, S., and Dufour, A. B. (2007). The ade4 package: implementing the duality diagram for ecologists. J. Stat. Softw. 22:i04. doi: 10.18637/jss.v022.i04
Eaton, D. A. R., and Overcast, I. (2020). ipyrad: interactive assembly and analysis of RADseq datasets. Bioinformatics 36, 2592–2594. doi: 10.1093/bioinformatics/btz966
Elam, E. (1993). Population genetic consequences of small population size: implications for plant conservation. Annu. Rev. Ecol. Evol. Syst. 24, 217–242. doi: 10.1146/annurev.es.24.110193.001245
Excoffier, L., and Lischer, H. E. (2010). Arlequin suite ver 3.5: a new series of programs to perform population genetics analyses under linux and windows. Mol. Ecol. Resour. 10, 564–567. doi: 10.1111/j.1755-0998.2010.02847.x
Fan, D. M., Yue, J. P., Nie, Z. L., Li, Z. M., Comes, H. P., and Sun, H. (2013). Phylogeography of Sophora davidii (leguminosae) across the ‘tanaka-kaiyong line’, an important phytogeographic boundary in southwest China. Mol. Ecol. 22, 4270–4288. doi: 10.1111/mec.12388
Foll, M., and Gaggiotti, O. (2008). A genome-scan method to identify selected loci appropriate for both dominant and codominant markers: a bayesian perspective. Genetics 180, 977–993. doi: 10.1534/genetics.108.092221
Francis, R. M. (2017). pophelper: an R package and web app to analyse and visualize population structure. Mol. Ecol. Resour. 17, 27–32. doi: 10.1111/1755-0998.12509
Frankham, R. (2015). Genetic rescue of small inbred populations: meta-analysis reveals large and consistent benefits of gene flow. Mol. Ecol. 24, 2610–2618. doi: 10.1111/mec.13139
Frankham, R., Bradshaw, C. J. A., and Brook, B. W. (2014). Genetics in conservation management: revised recommendations for the 50/500 rules, red list criteria and population viability analyses. Biol. Conserv. 170, 56–63. doi: 10.1016/j.biocon.2013.12.036
Funk, W. C., McKay, J. K., Hohenlohe, P. A., and Allendorf, F. W. (2012). Harnessing genomics for delineating conservation units. Trends Ecol. Evol. 27, 489–496. doi: 10.1016/j.tree.2012.05.012
Haag, T., Santos, A. S., Sana, D. A., Morato, R. G., Cullen, J. R., Crawshaw, J. R., et al. (2010). The effect of habitat fragmentation on the genetic structure of a top predator: loss of diversity and high differentiation among remnant populations of Atlantic forest jaguars (Panthera onca). Mol. Ecol. 19, 4906–4921. doi: 10.1111/j.1365-294X.2010.04856.x
Hernández, M., Palmarola, A., Veltjen, E., Asselman, P., Testé, E., Larridon, I., et al. (2020). Population structure and genetic diversity of Magnolia cubensis subsp. acunae (magnoliaceae): effects of habitat fragmentation and implications for conservation. Oryx 54, 451–459. doi: 10.1017/s003060531900053x
Hernández-Vera, G., Navarrete-Heredia, J. L., and Vázquez-García, J. A. (2021). Beetles as floral visitors in the magnoliaceae: an evolutionary perspective. Arthropod Plant Interact. 15, 273–283. doi: 10.1007/s11829-021-09819-3
Huang, J. X., and Zhuang, X. Y. (2002). Genetic diversity of the populations of Tsoongiodendron odorum. Acta Phytoecol. Sinic. 4, 413–419.
Isagi, Y., Tateno, R., Matsuki, Y., Hirao, A., Watanabe, S., and Shibata, M. (2007). Genetic and reproductive consequences of forest fragmentation for populations of magnolia obovata. Ecol. Res. 22, 382–389. doi: 10.1007/s11284-007-0360-5
Jeffries, D. L., Copp, G. H., Lawson Handley, L., Olsén, K. H., Sayer, C. D., and Hänfling, B. (2016). Comparing RADseq and microsatellites to infer complex phylogeographic patterns, an empirical perspective in the crucian carp, Carassius carassius, L. Mol. Ecol. 25, 2997–3018. doi: 10.1111/mec.13613
Jennings, H., Wallin, K., Brennan, J., Valle, A. D., Guzman, A., Hein, D., et al. (2016). Inbreeding, low genetic diversity, and spatial genetic structure in the endemic hawaiian lobeliads clermontia fauriei and cyanea pilosa ssp. longipedunculata. Conserv. Biol. 17, 497–502. doi: 10.1007/s10592-015-0785-2
Jombart, T., and Ahmed, I. (2011). adegenet 1.3-1: new tools for the analysis of genome-wide SNP data. Bioinformatics 27, 3070–3071. doi: 10.1093/bioinformatics/btr521
Kéry, M., Matthies, D., and Spillmann, H. H. (2000). Reduced fecundity and offspring performance in small populations of the declining grassland plants primula veris and gentiana lutea. J. Ecol. 88, 17–30. doi: 10.1046/j.1365-2745.2000.00422.x
Korneliussen, T. S., Albrechtsen, A., and Nielsen, R. (2014). ANGSD: analysis of next generation sequencing data. BMC Bioinform. 15:356. doi: 10.1186/s12859-014-0356-4
Law, Y. H., Xia, N. H., and Yang, H. Q. (1995). The origin, evolution and phytogeography of magnoliaceae. J. Trop. Subtrop. Bot. 3, 1–12.
Lee, K. M., Ranta, P., Saarikivi, J., Kutnar, L., Vreš, B., Dzhus, M., et al. (2020). Using genomic information for management planning of an endangered perennial, Viola uliginosa. Ecol. Evol. 10, 2638–2649. doi: 10.1002/ece3.6093
Lemopoulos, A., Prokkola, J. M., Uusi-Heikkila, S., Vasemagi, A., Huusko, A., Hyvarinen, P., et al. (2019). Comparing RADseq and microsatellites for estimating genetic diversity and relatedness - Implications for brown trout conservation. Ecol. Evol. 9, 2106–2120. doi: 10.1002/ece3.4905
Li, C. J., Chen, Y. L., Yang, F. M., Wang, D. S., Song, K., Yu, Z. X., et al. (2020). Population structure and regeneration dynamics of firmiana major, a dominant but endangered tree species. For. Ecol. Manag. 462:117993. doi: 10.1016/j.foreco.2020.117993
Li, H., and Durbin, R. (2009). Fast and accurate short read alignment with burrows-wheeler transform. Bioinformatics 25, 1754–1760. doi: 10.1093/bioinformatics/btp324
Li, H., Handsaker, B., Wysoker, A., Fennell, T., Ruan, J., Homer, N., et al. (2009). The sequence alignment/map format and SAMtools. Bioinformatics 25, 2078–2079. doi: 10.1093/bioinformatics/btp352
Li, X. W., and Li, J. (1997). The tanaka-kaiyong line — an important floristic line for the study of the flora of east asia. Ann. Mo. Bot. Gard. 84, 888–892. doi: 10.2307/2992033
Linck, E., and Battey, C. J. (2019). Minor allele frequency thresholds strongly affect population structure inference with genomic data sets. Mol. Ecol. Resour. 19, 639–647. doi: 10.1111/1755-0998.12995
Lischer, H. E. L., and Excoffier, L. (2011). PGDSpider: an automated data conversion tool for connecting population genetics and genomics programs. Bioinformatics 28, 298–299. doi: 10.1093/bioinformatics/btr642
Liu, D. T., Zhang, L., Wang, J. H., and Ma, Y. P. (2020). Conservation genomics of a threatened rhododendron: contrasting patterns of population structure revealed from neutral and selected SNPs. Front. Genet. 11:757. doi: 10.3389/fgene.2020.00757
Liu, X. M., and Fu, Y. X. (2020). Stairway plot 2: demographic history inference with folded SNP frequency spectra. Genome Biol. 21:280. doi: 10.1186/s13059-020-02196-9
Lomascolo, S. B., Speranza, P., and Kimball, R. T. (2008). Correlated evolution of fig size and color supports the dispersal syndromes hypothesis. Oecologia 156, 783–796. doi: 10.1007/s00442-008-1023-0
Ma, H., Liu, Y. B., Liu, D. T., Sun, W. B., Liu, X. F., Wan, Y. M., et al. (2021a). Chromosome-level genome assembly and population genetic analysis of a critically endangered rhododendron provide insights into its conservation. Plant J. 107, 1533–1545. doi: 10.1111/tpj.15399
Ma, Y. P., Chen, G., Edward Grumbine, R., Dao, Z. L., Sun, W. B., and Guo, H. J. (2013). Conserving plant species with extremely small populations (PSESP) in China. Biodivers. Conserv. 22, 803–809. doi: 10.1007/s10531-013-0434-3
Ma, Y. P., Liu, D. T., Wariss, H. M., Zhang, R. G., Tao, L. D., Milne, R. I., et al. (2021b). Demographic history and identification of threats revealed by population genomic analysis provide insights into conservation for an endangered maple. Mol. Ecol. 00, 1–13. doi: 10.1111/mec.16289
Ma, Y. P., Wariss, H. M., Liao, R. L., Zhang, R. G., Yun, Q. Z., Olmstead, R. G., et al. (2021c). Genome-wide analysis of butterfly bush (Buddleja alternifolia) in three uplands provides insights into biogeography, demography and speciation. New Phytol. 232, 1463–1476. doi: 10.1111/nph.17637
Matsuki, Y., Tateno, R., Shibata, M., and Isagi, Y. (2008). Pollination efficiencies of flower-visiting insects as determined by direct genetic analysis of pollen origin. Am. J. Bot. 95, 925–930. doi: 10.3732/ajb.0800036
Mussmann, S. M., Douglas, M. R., Chafin, T. K., and Douglas, M. E. (2019). BA3-SNPs: contemporary migration reconfigured in BayesAss for next-generation sequence data. Methods Ecol. Evol. 10, 1808–1813. doi: 10.1111/2041-210X.13252
Peterson, B. K., Weber, J. N., Kay, E. H., Fisher, H. S., and Hoekstra, H. E. (2012). Double digest RADseq: an inexpensive method for de novo SNP discovery and genotyping in model and non-model species. PLoS One 7:e37135. doi: 10.1371/journal.pone.0037135
Qi, Z. C., Yu, Y., Liu, X., Pais, A., Ranney, T., Whetten, R., et al. (2015). Phylogenomics of polyploid fothergilla (hamamelidaceae) by RAD-tag based GBS-insights into species origin and effects of software pipelines. J. Syst. Evol. 53, 432–447. doi: 10.1111/jse.12176
Qin, H. N., Yang, Y., Dong, S. Y., He, Q., Jia, Y., Zhao, L. N., et al. (2017). Threatened species list of China’s higher plants. Bio. Sci. 25, 696–744. doi: 10.17520/biods.2017144
Ralls, K., Ballou, J. D., Dudash, M. R., Eldridge, M. D. B., Fenster, C. B., Lacy, R. C., et al. (2018). Call for a paradigm shift in the genetic management of fragmented populations. Conserv. Lett. 11:12412. doi: 10.1111/conl.12412
Reed, D. H., and Frankham, R. (2003). Correlation between fitness and genetic diversity. Conserv. Biol. 17, 230–237. doi: 10.1046/j.1523-1739.2003.01236.x
Rivers, M., Beech, E., Murphy, L., and Oldfield, S. (2016). The Red List of Magnoliaceae - Revised and Extended. Richmond: Botanic Gardens Conservation International.
Rochette, N. C., and Catchen, J. M. (2017). Deriving genotypes from RAD-seq short-read data using stacks. Nat. Protoc. 12, 2640–2659. doi: 10.1038/nprot.2017.123
Sakaguchi, S., Asaoka, Y., Takahashi, D., Isagi, Y., Imai, R., Nagano, A. J., et al. (2021). Inferring historical survivals of climate relicts: the effects of climate changes, geography, and population-specific factors on herbaceous hydrangeas. Heredity 126, 615–629. doi: 10.1038/s41437-020-00396-4
Spielman, D., Brook, B. W., and Frankham, R. (2004). Most species are not driven to extinction before genetic factors impact them. Proc. Natl. Acad. Sci. U.S.A. 101, 15261–15264. doi: 10.1073/pnas.0403809101
Spies, I., Gruenthal, K. M., Drinan, D. P., Hollowed, A. B., Stevenson, D. E., Tarpey, C. M., et al. (2020). Genetic evidence of a northward range expansion in the eastern bering sea stock of pacific cod. Evol. Appl. 13, 362–375. doi: 10.1111/eva.12874
Sun, W. B. (2013). Conservation of Plant Species With Extremely Small Populations in Yunnan - Practice and Exploration. Kunming: Yunnan Science and Technology Press.
Sun, W. B., Ma, Y. P., and Blackmore, S. (2019a). How a new conservation action concept has accelerated plant conservation in China. Trends Plant Sci. 24, 4–6. doi: 10.1016/j.tplants.2018.10.009
Sun, W. B., Yang, J., and Dao, Z. L. (2019b). Study and Conservation of Plant Species with Extremely Small Populations (PSESP) in Yunnan Province, China. Beijing: Science Press.
Sun, Y. B., and An, Z. S. (2005). Late pliocene-pleistocene changes in mass accumulation rates of eolian deposits on the central Chinese loess plateau. J. Geophys. Res. 110:D23. doi: 10.1029/2005jd006064
Tajima, F. (1989). Statistical method for testing the neutral mutation hypothesis by DNA polymorphism. Genetics 123, 585–595. doi: 10.1093/genetics/123.3.585
Tamaki, I., Kawashima, N., Setsuko, S., Lee, J. H., Itaya, A., Yukitoshi, K., et al. (2019). Population genetic structure and demography of magnolia kobus: variety borealis is not supported genetically. J. Plant Res. 132, 741–758. doi: 10.1007/s10265-019-01134-6
The Angiosperm Phylogeny Group, Chase, M. W., Christenhusz, M. J. M., Fay, M. F., Byng, J. W., Judd, W. S., et al. (2016). An update of the angiosperm phylogeny group classification for the orders and families of flowering plants: APG IV. Bot. J. Linn. Soc. 181, 1–20. doi: 10.1111/boj.12385
Torkamaneh, D., Laroche, J., and Belzile, F. (2016). Genome-wide SNP calling from genotyping by sequencing (GBS) data: a comparison of seven pipelines and two sequencing technologies. PLoS One 11:e0161333. doi: 10.1371/journal.pone.0161333
Waples, R. S., and Do, C. (2010). Linkage disequilibrium estimates of contemporary ne using highly variable genetic markers: a largely untapped resource for applied conservation and evolution. Evol. Appl. 3, 244–262. doi: 10.1111/j.1752-4571.2009.00104.x
Willi, Y., Van Buskirk, J., Schmid, B., and Fischer, M. (2007). Genetic isolation of fragmented populations is exacerbated by drift and selection. J. Evol. Biol. 20, 534–542. doi: 10.1111/j.1420-9101.2006.01263.x
Wilson, G. A., and Rannala, B. (2003). Bayesian inference of recent migration rates using multilocus genotypes. Genetics 163, 1177–1191. doi: 10.1093/genetics/163.3.1177
Xia, N. H. (2006). A new lectotypification for Magnolia fistulosa (magnoliaceae). Novon 16, 436–438.
Yang, J., Cai, L., Liu, D. T., Chen, G., Gratzfeld, J., and Sun, W. B. (2020). China’s conservation program on plant species with extremely small populations (PSESP): progress and perspectives. Biol. Conserv. 244:108535. doi: 10.1016/j.biocon.2020.108535
Yang, J., Zhao, L. L., Yang, J. B., and Sun, W. B. (2015). Genetic diversity and conservation evaluation of a critically endangered endemic maple, acer yangbiense, analyzed using microsatellite markers. Biochem. Syst. Ecol. 60, 193–198. doi: 10.1016/j.bse.2015.04.027
Yang, Y. Z., Ma, T., Wang, Z. F., Lu, Z. Q., Li, Y., Fu, C. X., et al. (2018). Genomic effects of population collapse in a critically endangered ironwood tree Ostrya rehderiana. Nat. Commun. 9:5449. doi: 10.1038/s41467-018-07913-4
Yin, Y. P., Peng, F., Zhou, L. J., Yin, X. M., Chen, J. R., Zhong, H. J., et al. (2021). The chromosome-scale genome of Magnolia officinalis provides insight into the evolutionary position of magnoliids. iScience 24:102997. doi: 10.1016/j.isci.2021.102997
Zhang, X., Sun, Y., Landis, J. B., Zhang, J., Yang, L., Lin, N., et al. (2020). Genomic insights into adaptation to heterogeneous environments for the ancient relictual Circaeaster agrestis (circaeasteraceae, ranunculales). New Phytol. 228, 285–301. doi: 10.1111/nph.16669
Zhao, C., Rohling, E. J., Liu, Z. Y., Yang, X. Q., Zhang, E. L., Cheng, J., et al. (2021). Possible obliquity-forced warmth in southern Asia during the last glacial stage. Sci. Bull. 66, 1136–1145. doi: 10.1016/j.scib.2020.11.016
Zheng, B. X., Xu, Q. Q., and Shen, Y. P. (2002). The relationship between climate change and quaternary glacial cycles on the qinghai-tibetan plateau: review and speculation. Quat. Int. 9, 93–101. doi: 10.1016/S1040-6182(02)00054-X
Keywords: Magnolia fistulosa, ddRAD-seq, population genetic, demographic history, conservation management
Citation: Yang F, Cai L, Dao Z and Sun W (2022) Genomic Data Reveals Population Genetic and Demographic History of Magnolia fistulosa (Magnoliaceae), a Plant Species With Extremely Small Populations in Yunnan Province, China. Front. Plant Sci. 13:811312. doi: 10.3389/fpls.2022.811312
Received: 08 November 2021; Accepted: 13 January 2022;
Published: 17 February 2022.
Edited by:
Gerald Matthias Schneeweiss, University of Vienna, AustriaReviewed by:
Zhang Xue, Ningxia University, ChinaYessica Rico, Instituto de Ecología (INECOL), Mexico
Rhiannon Michele Peery, University of Alberta, Canada
Norma Flores-Estevez, Universidad Veracruzana, Mexico
Copyright © 2022 Yang, Cai, Dao and Sun. This is an open-access article distributed under the terms of the Creative Commons Attribution License (CC BY). The use, distribution or reproduction in other forums is permitted, provided the original author(s) and the copyright owner(s) are credited and that the original publication in this journal is cited, in accordance with accepted academic practice. No use, distribution or reproduction is permitted which does not comply with these terms.
*Correspondence: Weibang Sun, d2JzdW5AbWFpbC5raWIuYWMuY24=
†These authors have contributed equally to this work and share first authorship