 Minghui Zhang1†Junfeng Cao1†
 Tianxu Zhang2,3Tao Xu4Liyuan Yang1,5Xiaoyuan Li1Fengdan Ji1Yingxue Gao6
 Shahid Ali1,3
 Qingzhu Zhang2,3
 Jianhua Zhu7*
 Linan Xie1*
- 1Key Laboratory of Saline-Alkali Vegetation Ecology Restoration, Ministry of Education, College of Life Science, Northeast Forestry University, Harbin, China
- 2State Key Laboratory of Tree Genetics and Breeding, Northeast Forestry University, Harbin, China
- 3College of Life Science, Northeast Forestry University, Harbin, China
- 4The Editorial Board of Journal of Forestry Research, Northeast Forestry University, Harbin, China
- 5Laboratory Department, Qitaihe Center for Disease Control and Prevention, Qitaihe, China
- 6Shanghai Center for Plant Stress Biology and Center for Excellence in Molecular Plant Sciences, Chinese Academy of Sciences, Shanghai, China
- 7Department of Plant Science and Landscape Architecture, University of Maryland, College Park, College Park, MD, United States
Soybean (Glycine max) is a staple crop and a major source of vegetable protein and vegetable oil. The growth of soybean is dramatically inhibited by salt stress, especially by the excessive toxic Na+. Salt Overly Sensitive 1 (SOS1) is the only extensively characterized Na+ efflux transporter in multiple plant species so far. However, the role of GmSOS1 in soybean salt stress responses remains unclear. Herein, we created three gmsos1 mutants using the CRISPR-Cas9 system in soybean. We found a significant accumulation of Na+ in the roots of the gmsos1 mutants, resulting in the imbalance of Na+ and K+, which links to impaired Na+ efflux and increased K+ efflux in the roots of the gmsos1 mutants under salt stress. Compared to the wild type, our RNA-seq analysis revealed that the roots of the gmsos1-1 showed preferential up and downregulation of ion transporters under salt stress, supporting impaired stress detection or an inability to develop a comprehensive response to salinity in the gmsos1 mutants. Our findings indicate that the plasma membrane Na+/H+ exchanger GmSOS1 plays a critical role in soybean salt tolerance by maintaining Na+ homeostasis and provides evidence for molecular breeding to improve salt tolerance in soybean and other crops.
Introduction
Soybean (Glycine max) is an important economic crop for livestock feed, human consumption, and industrial production because it is a major source for protein processing and vegetable oils extraction (Graham and Vance, 2003). Growing soybean cultivars on infertile soil, such as saline and drought areas, is harmful to ensuring staple crop production and enhancing overall food output. Seed germination in soybean is vulnerable to salt stress, and the yield of soybean is substantially decreased if soil salinity reaches 5 deciSiemens per meter (dS/m; a unit of electrical conductivity). Soybean is classified as a moderately salt-tolerant plant (Phang et al., 2008). Salt tolerance is an important trait in soybean breeding, and having a comprehensive understanding of the molecular basis of salt tolerance is important for crop breeding.
Under salt stress, ion homeostasis is maintained by adjusting the acquisition and distribution of K+ and Na+ in plants (Wu et al., 2018; Isayenkov and Maathuis, 2019; Rubio et al., 2019). Excess amounts of Na+ are supplied to roots, the main toxic ion of salinity, leading to accumulation in the photosynthetic tissues, ionic imbalance, cellular toxicity, metabolic disturbance, and reduced productivity (Hasegawa et al., 2000; Munns and Tester, 2008). Plants possess a series of pathways to minimize the toxicity of Na+, including limiting Na+ absorption, enhancing Na+ exclusion, altering cellular ionic balance (especially Na+/K+ ratio), and dispersing Na+ in leaves (Zhu, 2002; Zhu et al., 2016; Ishikawa and Shabala, 2019).
The membrane transporters are involved in Na+ and K+ influx and efflux processes and control the homeostasis of Na+ and K+. The monovalent cation/proton antiporter (CPA) family is one key group of ion transporters. The CPA family can be divided into two subfamilies: CPA1, which consists of Na+/H+ exchangers (NHXs), and CPA2, which encompasses K+ efflux antiporters (KEAs) and cation/H+ exchangers (CHXs) (Aviv, 1993; Chanroj et al., 2012; Ye et al., 2013). Ion transporters are critical for ion homeostasis under salt stress, and they often function in a coordinated manner with other components in the salt stress response pathways. Protein kinases, such as calcineurin B-like (CBL)-interacting protein kinases (CIPKs) and calcium-dependent protein kinases (CDPKs), have been found to respond to salt stress and participate in the regulation of plant salt stress tolerance (Weinl and Kudla, 2009; Boudsocq and Sheen, 2013).
In Arabidopsis, the Na+/H+ antiporter SOS1/Na+-H+ exchanger 7 (NHX7), the serine/threonine protein kinase SOS2/CIPK24, and the calcium-binding protein SOS3/CBL4 compose the minimal functional module in the Salt-Overly-Sensitive (SOS) signaling pathway (Martínez-Atienza et al., 2007; Quintero et al., 2011). SOS1 works as a homodimer, with each monomer having 12 transmembrane domains at its N-terminal region and a long C-terminal region containing a cytosolic domain, a cyclic nucleotide (cNMP)-binding domain, and an auto-inhibitory domain (Núñez-Ramírez et al., 2012). Under normal conditions in the resting state of SOS1, the C-terminal auto-inhibitory domain interacts with the adjacent activation domain containing a putative cNMP-binding motif, which is essential for SOS1 function (Shi et al., 2000). The SOS1 is regulated by cyclic nucleotides, particularly, signaling molecules in plant’s response to salt and osmotic stress that drive environmental adaptability (Shabala et al., 2015; Świeżawska et al., 2018). The Ca2+-dependent SOS2 – SOS3 protein kinase complex phosphorylates a serine residue at the position of 1,138 in the SOS1 auto-inhibitory domain, releasing SOS1 from auto-inhibition and activating SOS1 during salt stress (Quintero et al., 2011).
The physiological roles of the relevant SOS1 genes have been widely investigated in plants in addition to Arabidopsis thaliana, including glycophyte, such as Oryza sativa (Razzaque et al., 2014), Solanum lycopersicum (Wang et al., 2021), Chrysanthemum morifolium (Gao et al., 2016), and Gossypium hirsutum (Chen et al., 2017), and halophytes, such as Thellungiella salsuginea (Oh et al., 2009), Chenopodium quinoa (Maughan et al., 2009), Salicornia brachiata (Yadav et al., 2012), and Sesuvium portulacastrum (Zhou et al., 2018). SOS1 exploits the H+ gradient to exclude Na+ from the cytosol by transporting Na+ into the extracellular space (Shi et al., 2000, 2002, 2003). A study on Oryza sativa Na+/H+ exchanger SOS1 further supports the role of SOS1 in exporting Na+ from the xylem parenchyma cells into the xylem vessels and thus promoting Na+ accumulation in the shoot for osmotic adjustment (Mahi et al., 2019). GmSOS1 from the domesticated soybean (Glycine max), its wild relative (Glycine soja), and both their hybrids conferred high salt tolerance in transgenic Arabidopsis and yeast mutants (Nie et al., 2015; Zhao et al., 2017). However, its role in soybean plants under salt stress has not yet been investigated.
Here, we report that the loss-of-function mutants of the soybean GmSOS1 created with the CRISPR/Cas9 approach display exceptional increased salt sensitivity that correlates with excessive Na+ intake and accumulation in roots and leaves. Under salt stress, we observed a dramatic reduction of K+ contents in roots of the gmsos1 mutant plants, while the salt-treated gmsos1 plants accumulated similar levels of K+ in leaves as the wild-type plants. The ratio of Na+/K+ is much higher in the gmsos1 mutants than in the wild-type plants under salt stress. Furthermore, the gmsos1 mutations decrease the ability of Na+ efflux in the root meristem zone. Gene expression profiling with RNA-seq analysis revealed that many genes are differentially expressed in the gmsos1 mutant plants under salt stress, and these genes encode proteins with diverse functions in cellular processes, including ion transport and response to abiotic stress. Our results demonstrate that SOS1 function is conserved in soybean and that the GmSOS1 is critical for salt tolerance in soybean.
Materials and Methods
Plant Materials and Salt Treatment
Seven soybean cultivars, namely, Williams 82 (W82), Jack, HeNong 85 (HN85), DongSheng 7 (DS7), HeiHe (HH43), DongNong 50 (DN50), and HeFeng 55 (HF55) were used in this study. All soybean materials used in this study were obtained from the Shanghai Center for Plant Stress Biology (CAS), Northeast Forestry University (NEFU), and Northeast Agricultural University (NEAU). Moderate size, disease-free, and intact seeds were planted in soil (native soil to vermiculite 2:1 ratio) at a temperature of 25°C under a 13 h light/11 h dark photoperiod for maturity. When cotyledons were fully grown (VE stage), seedlings were transferred to a hydroponic culture condition with a modified one-half-strength Hoagland nutrient solution [2.4 mM KNO3, 1.6 mM Ca(NO3)2, 0.2 mM KH2PO4, 0.8 mM MgSO4, 0.18 mM FeSO4, 0.1 mM Na2EDTA, 4.5 μM MnCl2, 23 μM H3BO3, 0.3 μM CuSO4, 1.5 μM ZnCl2, and 0.1 μM Na2MoO4] as previously described (López-Ráez et al., 2008) in a growth chamber for physiological measurements and assays.
The seedlings with uniform growth were selected and transferred to a culture box (a hard plastic rectangle-shaped container with black color to restrict growth of algae to house the one-half-strength Hoagland solution; see demonstration in Supplementary Figure 1) with varying concentrations of NaCl (0–200 mM NaCl) for salt stress treatments when the unifoliate leaves were fully expanded (VC stage). When the second trifoliolate leaf (V2 stage) in normal condition was fully opened, survival rate, plant height, fresh weight, and dry weight were recorded. At least 12 plants per genotype were used for salt tolerance analysis.
Measurement of Na+ and K+ Contents
To determine Na+ and K+ contents, the collected plant samples (at approximately the V2 stage) were rinsed three times with sterile water to remove any impurities. The dry weight of the samples was determined after dehydration in an oven at 65°C for 5 days and then ground to fine powder. The powder was placed in a 50 ml conical bottle to be digested with appropriate volume of the mixed acid (nitric acid: hydrogen peroxide = 4:1) overnight. The sample solution was digested in an electric digestion system until all samples were clear and transparent. Deionized water was added to the final volume of 50 ml. The Na+ and K+ contents were measured by an inductivity coupled plasma mass spectrometry (ICP-MS; NexION 350D; PerkinElmer, Shelton, CT, United States) coupled to an Apex desolation system and an SC-4 DX autosampler (Elemental Scientific Inc., Omaha, NE, United States).
Measurements of Net Na+ and K+ Fluxes
Net flux of Na+ was measured with the Non-invasive Microtest Technique (NMT, YoungerUSA, LLC, Amherst, MA, United States) and influxes software. For Na+ or K+ flux, seedlings at the VC stage were incubated in Hoagland medium supplemented with 160 mM NaCl for 24 h. Prior to the flux measurement, 10–20 mm lateral roots cut from the seedling were flushed with distilled water and soaked in the measuring solution [Na+: 0.1 mM CaCl2, 0.1 mM KCl, 0.5 mM NaCl, and 0.3 mM MES, adjusted pH to 6.0 with 1 M Tris-HCl (pH 8.8); K+: 0.1 mM KCl, 0.1 mM CaCl2, 0.1 mM MgCl2, 0.5 mM NaCl, 0.3 mM MES, and 0.2 mM Na2SO4, adjusted pH to 6.0 with 1 M Tris-HCl (pH 8.8)] for 10 min. Pre-pulled and salinized microsensors (4.5 ± 0.5 μm, XY- CGQ -01) were filled with a backfilling solution (Na+: 250 mM NaCl; K+: 100 mM KCl, pH 7.0) to a length of nearly 1.0 cm. Then, 50 μm columns of selective liquid ion-exchange cocktails (LIXs, Na+: XY-SJ-Na; H+: XY-SJ-H. Younger, United States) were filled from the tip. The microsensor was calibrated with 0.5 or 5 mM NaCl in calibration liquid (0.1 mM CaCl2, 0.1 mM KCl, 0.3 mM MES, pH 6.0) for measuring Na+ or K+ flux.
Ion fluxes were measured in the meristem zone of approximately 300 μm from the root tip. All the measurement results were exported using the JCal V3.3 (a free MS Excel spreadsheet1), and the consumables were provided by Xuyue (Beijing, China).
Quantitative Reverse Transcription PCR Analysis
Total RNA was extracted from different tissues with the Trizol Reagent (Invitrogen, Waltham, MA, United States). Reverse transcription was performed using a PrimeScript™ RT reagent kit with gDNA Eraser (Perfect Real-time) reverse transcription Kit (TaKaRa, Kusatsu, Shiga, Japan). All quantitative real-time PCR analyses were performed using LightCycler 480 SYBR Green I Master (Roche, Basel, Switzerland). The transcript level of specific genes was measured using the cycle threshold (Ct) 2–ΔΔCt method. The GmTubulin A gene was used as a reference gene (Klink et al., 2005; Wang et al., 2016). Primer sequences are listed in Supplementary Table 6.
sgRNA Design and CRISPR/Cas9 Vector Construction
The single guide RNA (sgRNA) sequence (SG2, Supplementary Table 6) was designed based on the sequence of soybean GmSOS1 gene (GLYMA.08G092000.1) downloaded from NCBI2. The U6 promoter from soybean and 35S promoter from cauliflower mosaic virus were used to drive sgRNA and Cas9 gene, respectively. A bar gene conferring resistance to glufosinate in the plasmid is used as the marker for selecting the transgenic plants. Both forward and reverse primers of sgRNAs were denatured before annealing reaction (slow cool-down process from 95 to 16°C at 0.1°C/s). Two microliters of the annealed product were used to ligate to the pCBSG04 vector at 25°C for 30 min, and the reaction system includes the following components: 1 μl 10× Buffer (New England Biolabs, Ipswich, MA, United States), 1 μl Bsal-digested pCBSG04 plasmid, 2 μl Annealed product (1/100), 0.5 μl T4 Ligase (NEB), 0.1 μl T4 PNK (NEB), and 5.4 μl ddH2O.
Plant Transformation and Screening for Mutated Plants
Two soybean cultivars, W82 and Jack, were utilized in the Agrobacterium-mediated tissue culture-based transformation. The transformation by Agrobacterium tumefaciens EHA105 (harboring the recombinant vector pCBSG04-GmU6: sgRNA-35S: Cas9) in soybean was previously described (Paz et al., 2004). All positive lines in T0 and T1 generations were confirmed by genotyping. After screening by 8 mg/L glufosinate, Genomic DNA was extracted by hexadecyltrimethylammonium bromide (CTAB) method from the glufosinate-resistant plants, and genomic fragments corresponding to sgRNA and Cas9 (primer: SOS1-F and SOS1-R, Supplementary Table 6) were amplified. The Cleaved Amplified Polymorphism Sequences (CAPS) marker was used to verify all the gmsos1 mutants.
Statistical Analysis
We used the R package and Excel to analyze the data in this study. Unless otherwise indicated, the Student’s t-test was used to compare the means at the level of p < 0.05 to find significant differences.
Sequence Analysis of GmSOS1
We used MEGA X to construct an evolutionary tree with full-length GmSOS1 and SOS1 proteins from another 21 plant species as described (Kumar et al., 2018). Multiple sequence alignment of GmSOS1 with AtSOS1 was performed with the DNAMAN software (version 5.0; Lynnon BioSoft, Canada).
RNA-Seq Analysis
Total RNA was extracted from different tissues of the wild type and gmsos1-1 plants with Trizol reagent (Invitrogen, Waltham, MA, United States). The concentration and quality of each RNA sample were determined on an Agilent 2100 Bioanalyzer (Agilent Technologies, Waldbronn, Germany), and 3 μg of total RNA from each sample were used for RNA-seq library construction. There are three biological replicates per genotype. Sequencing of the RNA-seq libraries was performed using the Illumina HiSeq 2500 platform (Illumina, San Diego, CA, United States). Approximately 4.0 Gb of clean data were generated per sample. We processed and analyzed the RNA-seq data following procedures as previously described (Sahraeian et al., 2017). Briefly, all low-quality (<Q30) paired-end reads were excluded, and the reads were trimmed using trimmomatic (vision 0.38). The trimmed reads were mapped to the soybean reference genome (Phytozome v2.1) using hisat2, and the stringtie was used to assemble expressed transcripts. We subsequently used DESeq2 to identify the differentially expressed genes (DEGs) with | log2(Fold change)| > 1 and adjusted the false discovery rate (FDR) < 0.01. AgriGo and R were used to perform the Gene Ontology (GO) analyses of the DEGs (Du et al., 2010), with FDR < 0.05 as a cutoff for significantly enriched GO terms.
Results
Williams 82 Shows Moderate Tolerance to Salt Stress
Williams 82 is the soybean cultivar which was sequenced to produce the reference genome sequence. To gain some insight on how soybean plants respond to salt stress, we used W82 in our experiment where in young seedlings were grown in a hydroponic condition. Seedlings at the vegetative cotyledon (VC) stage were transferred to Hoagland solutions and supplemented with various concentrations of NaCl (0, 120, 140, 150, and 160 mM). The seedlings were allowed to grow for an additional 8 days, a growth period during which seedlings without salt stress would transit from the VC stage to the second trifoliate (V2) stage (Figure 1A and Supplementary Figure 1). Compared with seedlings under control conditions, seedlings show reduced growth and development at low levels of salt stress and display severe growth retardation accompanied by wilting and, at times, death at high levels of salt stress (Figures 1A,B,E–H and Supplementary Figure 1). We used the ability of shoot apical meristem of the salt-treated seedlings to initiate new trifoliate leaves as a criterion to judge whether a seedling survives salt stress. It is obvious to notice that salt stress significantly reduces the survival rate of soybean seedlings (Figure 1B). It appears that approximately 50% of the seedlings can survive under 150 mM NaCl. Increasing amount of Na+ accumulated in roots and leaves of salt-treated Williams 82 seedlings and roots had substantially higher levels of Na+ than the leaves (Figure 1C). We also determined the ratio of Na+ and K+ (Na+/K+) in the W82 seedlings and found that Na+/K+ increases as the NaCl concentration rises. The Na+/K+ values are higher in leaves than roots when the seedlings are treated with 150 and 160 mM NaCl (Figure 1D). These results suggest that there is an internal mechanism to control Na+ ion distribution from roots to shoot tissues, such as leaves, to prevent the overaccumulation of this toxic ion in the shoots.
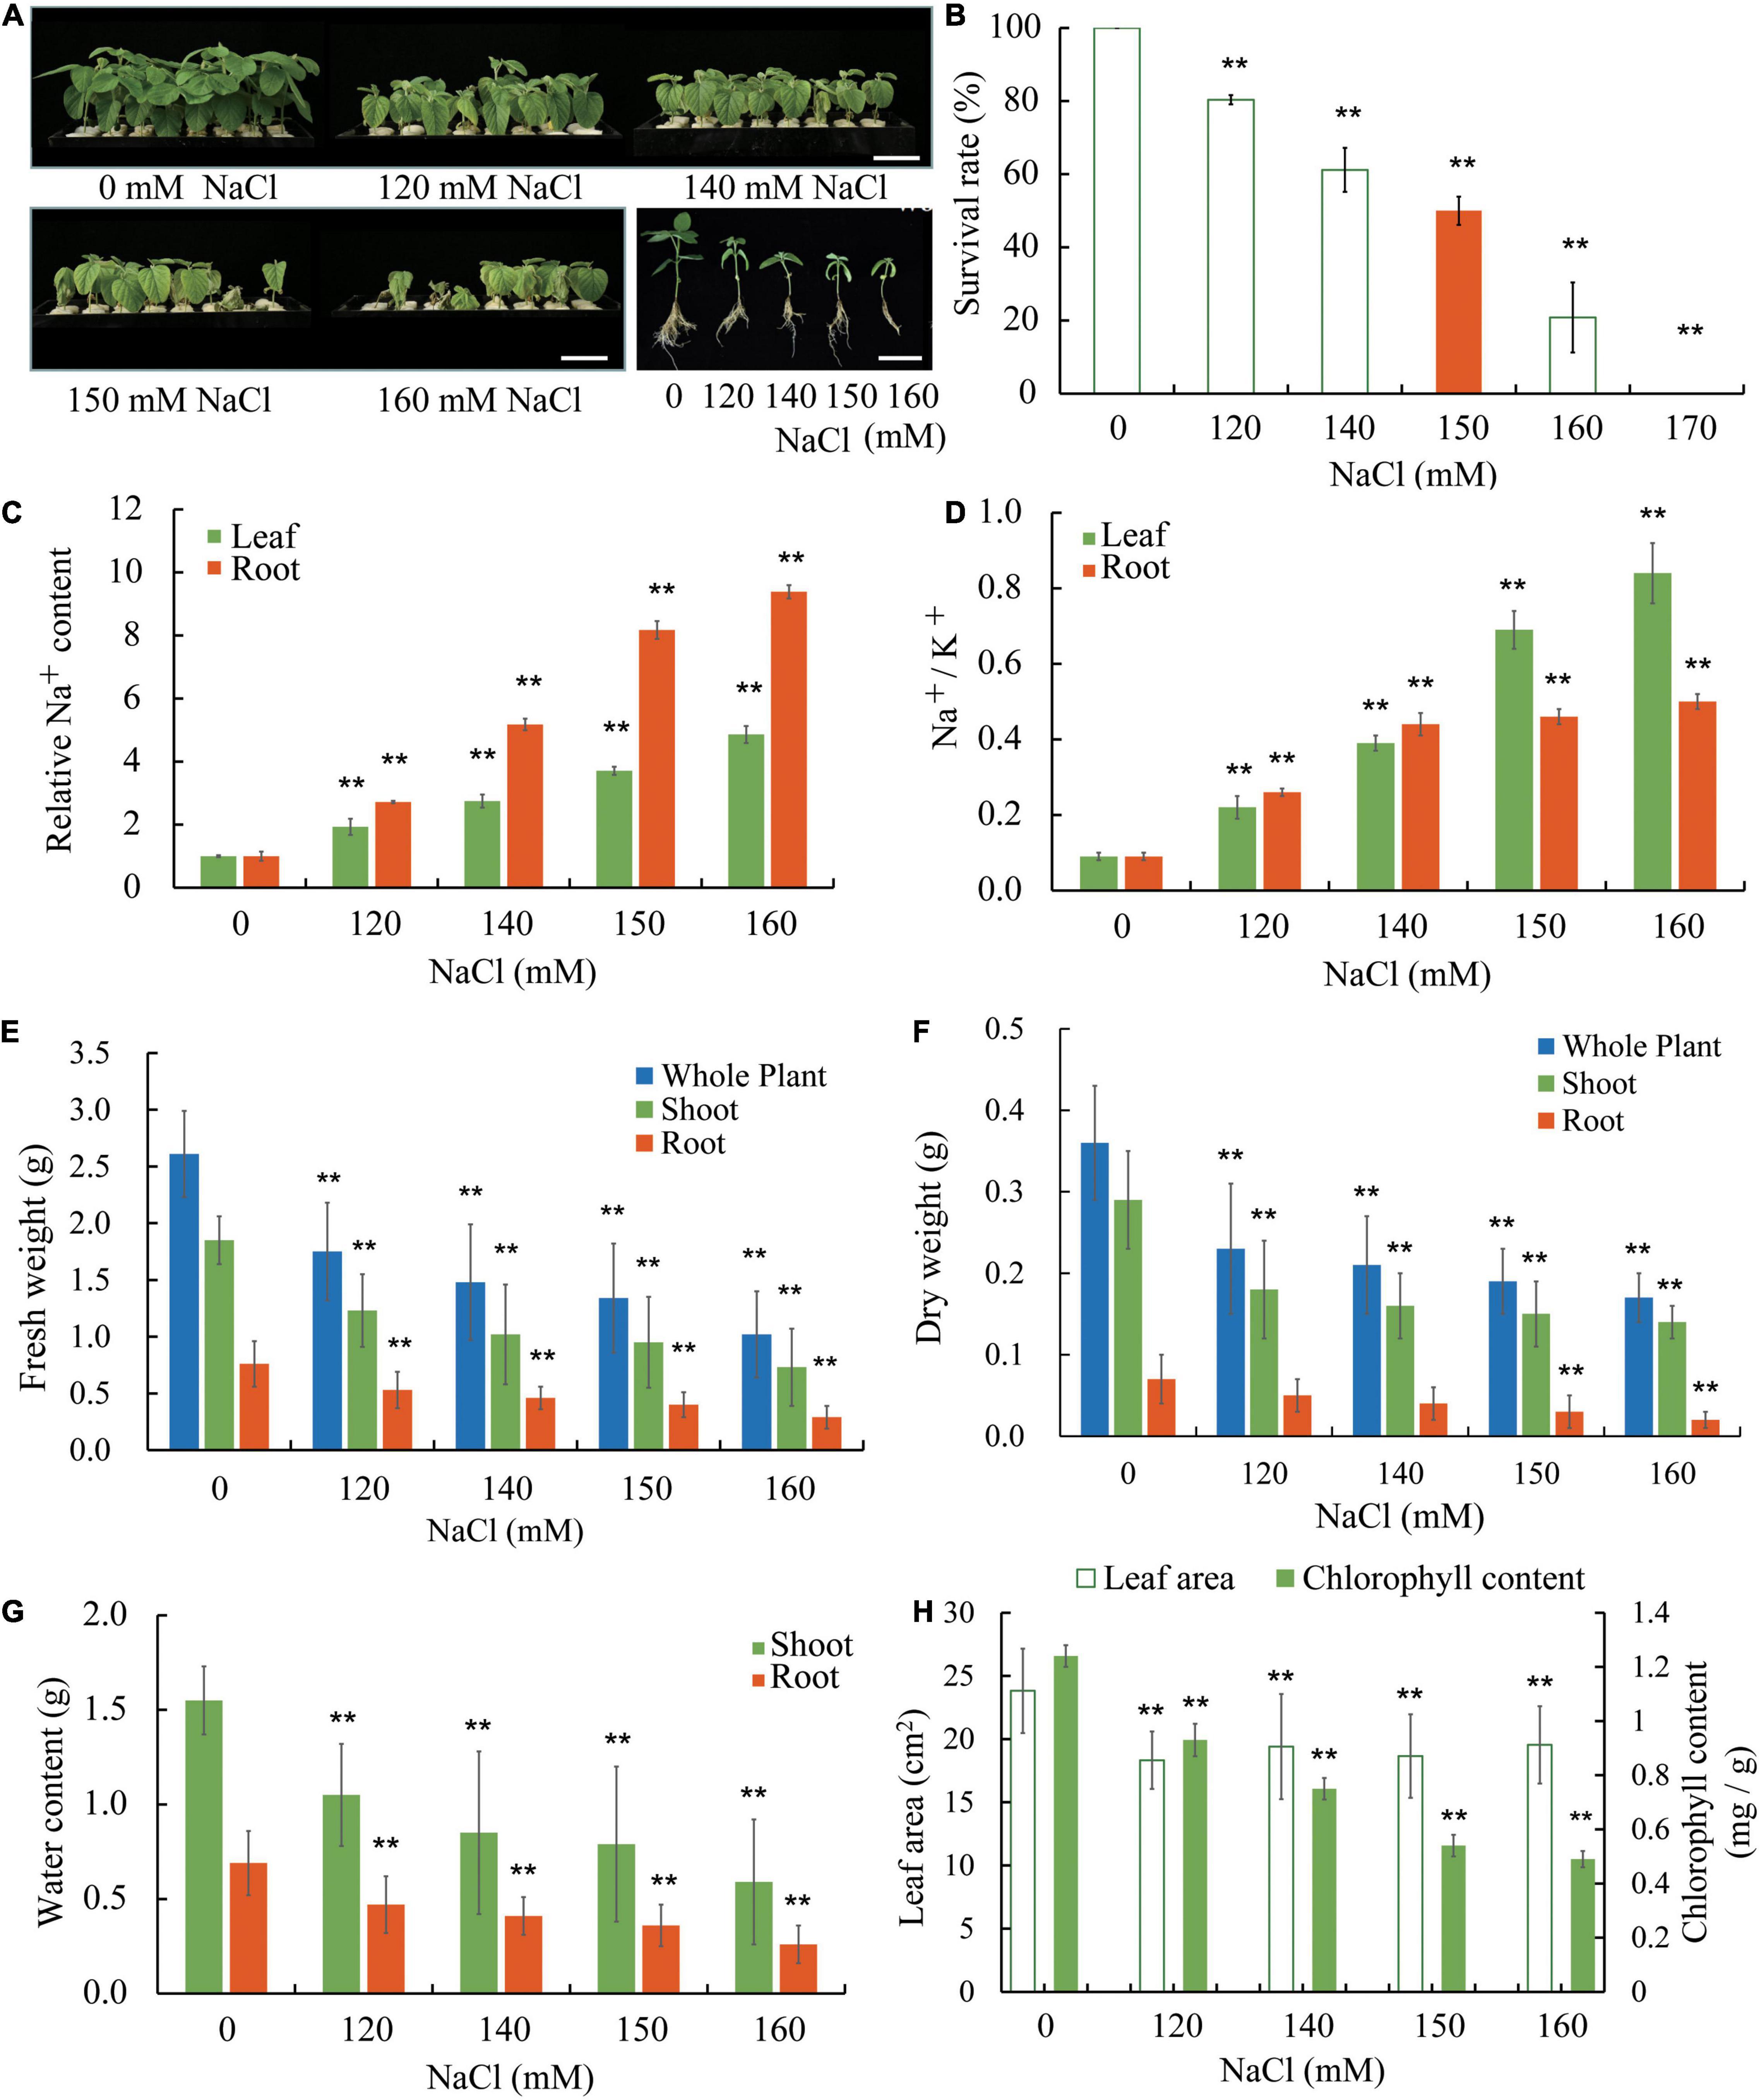
Figure 1. Salt sensitivity of Williams 82 (W82) plants. (A) Growth of seedlings in liquid growth medium containing 0, 120, 140, 150, or 160 mM NaCl. Bar = 6 cm. (B) The survival rates of plants as shown in (A) and data for plants treated with 170 mM NaCl are also provided. Survival is defined as the ability of shoot apical meristem to initiate new trifoliate leaves after the salt stress treatment. (C) The relative Na+ content in roots and unifoliate leaves of plants as shown in (A). (D) The Na+/K+ ratios in roots and unifoliate leaves from plants as shown in (A). (E) The fresh weight of whole plants, shoots, and roots of plants as shown in (A). (F) The dry weight of whole plants, shoots, and roots of plants as shown in (A). (G) The relative water content of shoots and roots of plants as shown in (A). (H) The chlorophyll content and the area unifoliate leaves of plants as shown in (A). The data are means ± SD [n = 3 (there are at least 12 plants in each biological replicate)]. Significant differences in mean values relative to the mean value of unstressed plants are indicated by Student’s t-tests (**p < 0.01).
Degree of Salt Tolerance Varies Amongst Soybean Cultivars
To further evaluate whether there are variations in salt tolerance in different soybean germplasms, six randomly selected cultivars from Northeast China: HeNong 85 (HN85), DongSheng 7 (DS7), DongNong 50 (DN50), HeiHe 43 (HH43), HeFeng 55 (HF55), and Jack are used in the hydroponic evaluation system described above (W82 is used as a control) (Figure 2). First, the survival rates of all cultivars were determined at varying concentrations of NaCl treatment (50 mM to 200 mM) to define the salt concentration at which each cultivar’s survival rate is around 50%. These were referred to as half survival concentrations (HSCs). The HSC is 180 mM NaCl for HN85 and DS7, which is the highest among the seven cultivars, the HSC for Jack and HF55 is 125 mM NaCl, which is the lowest among the cultivars tested, and the HSC for DN50 and HH43 is 150 mM NaCl (the same as W82) (Figure 2A). The HSC values also indicate the salt tolerance levels. This means that the HN85 and DS7 cultivars are the most salt-tolerant among the cultivars, the HN43, DN50, and W82 cultivars are moderately salt-tolerant, and the Jack and HF55 cultivars are least salt-tolerant among the seven cultivars.
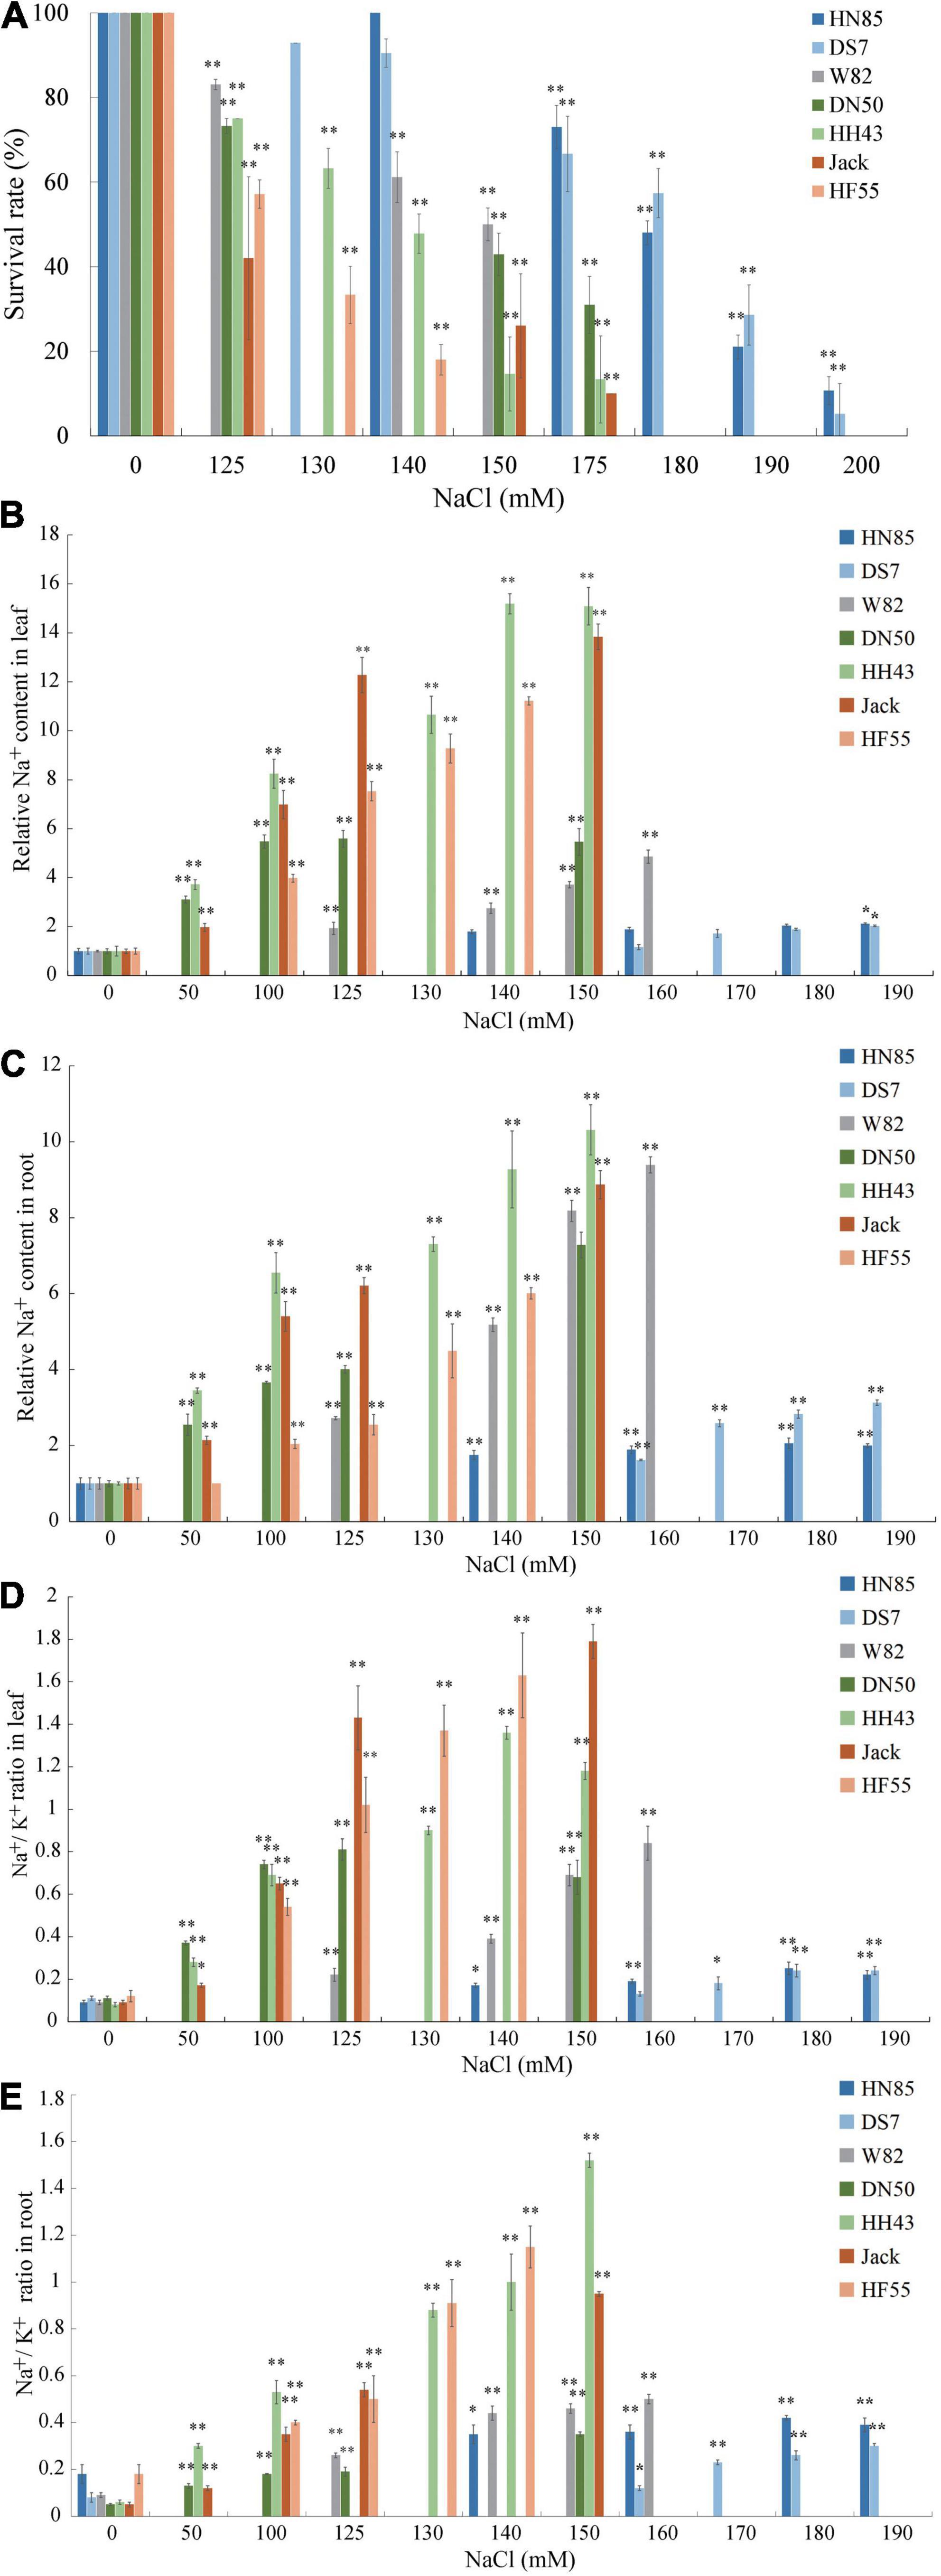
Figure 2. Salt sensitivity assay of six soybean cultivars. (A) Survival rates of six soybean cultivars subjected to treatment with 0, 125, 130, 140, 150, 175, 180, 190, or 200 mM NaCl. The six soybean cultivars are Henong 85 (HN85), Dongsheng 7 (DS7), Dongnong 50 (DN50), Heihe 43 (HH43), Jack (Jack), and Hefeng 55 (HF55). (B) The Na+ contents in unifoliate leaves of the six soybean cultivars. (C) The Na+ contents in roots of the six soybean cultivars. (D) The change of Na+/K+ ratios in unifoliate leaves of the six soybean cultivars. (E) The change of Na+/K+ ratios in roots of the six soybean cultivars. Data are means ± SD [n = 3 (there are at least 12 plants in each biological replicate)]. Significant differences in mean values relative to the mean value of unstressed plants are indicated by Student’s t-tests (*p < 0.05, **p < 0.01).
To validate the salt stress responses of the six cultivars, the unifoliolate leaves and roots at the first trifoliate (V1) stage from salt-treated seedlings were separately collected for quantitative evaluation of the Na+ and K+ contents. Although all cultivars’ relative Na+ contents in roots and leaves are increasing, it is noted that the slopes are moderate in salt-tolerant cultivars and steep in salt-sensitive cultivars (Figures 2B,C). Similar trends were found in the Na+/K+ values in unifoliate leaves (Figure 2D). In the roots, the salt-sensitive cultivars have higher values of Na+/K+ than the salt-tolerant cultivars, except for DS7 (Figure 2E).
Generation of gmsos1 Mutants by CRISPR/Cas9 Approach
We predict that GmSOS1 is important in salt tolerance in soybean. Database searches and sequence comparisons, such as phylogenetic analysis and conserved domain prediction, revealed that the NP_001244939.1 (encoded by a single-copy gene GLYMA.08G092000.1) protein from the W82 reference genome shows high sequence homology with the plasma membrane localized Na+/H+ Exchanger SOS1 family proteins from A. thaliana (NP_178307.2 encoded by AT2G01980.1) and O. sativa (AAW33875.1) (Supplementary Figures 2A,B). We subsequently named GLYMA.08G092000.1 as GmSOS1. GmSOS1 is predicted to be a cell membrane protein by the Plant-mPloc program3. GmSOS1 has 12 transmembrane helices at its N-terminal portion (from amino acids 35--446) as predicted by the TMHMM program4, a typical structure of most plasma membrane localized ion transporter proteins.
The expression patterns of GmSOS1 in various tissues of W82 under salt stress were determined to understand the role of GmSOS1 in salt tolerance (Figure 3A). The expression of GmNAC004 is responsive to salt stress, indicating that our salt stress treatments are effective (Supplementary Figure 2C). The expression levels of GmSOS1 are the highest in the roots compared to the other tissues, such as leaves, epicotyls, and hypocotyls (Figure 3A). Intriguingly, the expression of GmSOS1 in tissues above the cotyledon, such as the leaf and epicotyl, and tissues below cotyledon, such as the hypocotyl and root, showed distinct patterns when exposed to different levels of salt stress. Despite its modest expression level in control, GmSOS1 is downregulated in leaf and epicotyl when the NaCl concentration rises, while the expression of GmSOS1 in the hypocotyl and root increases as the levels of salt stress increases (Figure 3A). These results suggest that GmSOS1 responds to salt stress and may help maintain a low sodium concentration in sensitive organs by contributing to Na+ efflux in the root and transportation from root to aboveground tissues. To determine whether GmSOS1 is critical for salt tolerance in soybean, we designed a sgRNA complementary to the nucleotide sequences whose amino acid residues are in the linker region of the autoinhibitory domain and cNMP-binding domain of GmSOS1 to create mutations in GmSOS1 in the W82 and Jack backgrounds with the CRISPR/Cas9 approach (Figures 3B,D). We generated two mutations in GmSOS1 that correspond to 3 mutants: gmsos1-1 and gmsos1-2 in the background of W82, and gmsos1-6 in the background of Jack (Table 1). The gmsos1 mutations were validated by PCR amplifications with primers containing CAPS markers, followed by restriction enzyme digestions (Figure 3C). The 6-bp insertion mutation of the gmsos1-1 introduced a BstEII recognition site (GGTNACC) so that the PCR fragment from the mutant can be digested to produce two fragments: the 344-bp longer fragment and the 169-bp shorter one. The 1-bp insertion mutation of the gmsos1-2 and gmsos1-6 introduced a Hpy188III recognition site (TCNNGA) so that the PCR fragment from either the gmsos1-2 or gmsos1-6 plants can be digested to produce two fragments: the 344-bp longer fragment and the 169-bp shorter one. Seeds from the homozygous gmsos1 mutants in the T2 or T3 generations are used in the subsequent experiments. The gmsos1-1 has a 6-bp insertion, and this insertion would make a frameshift and produce a premature stop codon at the amino acid residue 975. The gmsos1-2 and gmsos1-6 have 1-bp insertion, and this insertion would make a frameshift and produce a premature stop codon at the amino acid residue 975. The gmsos1-1, gmsos1-2, or gmsos1-6 mutations would produce a truncated polypeptide that is missing the last 169 amino acids from the C-terminal end of wild-type GmSOS1 (Figure 3D).
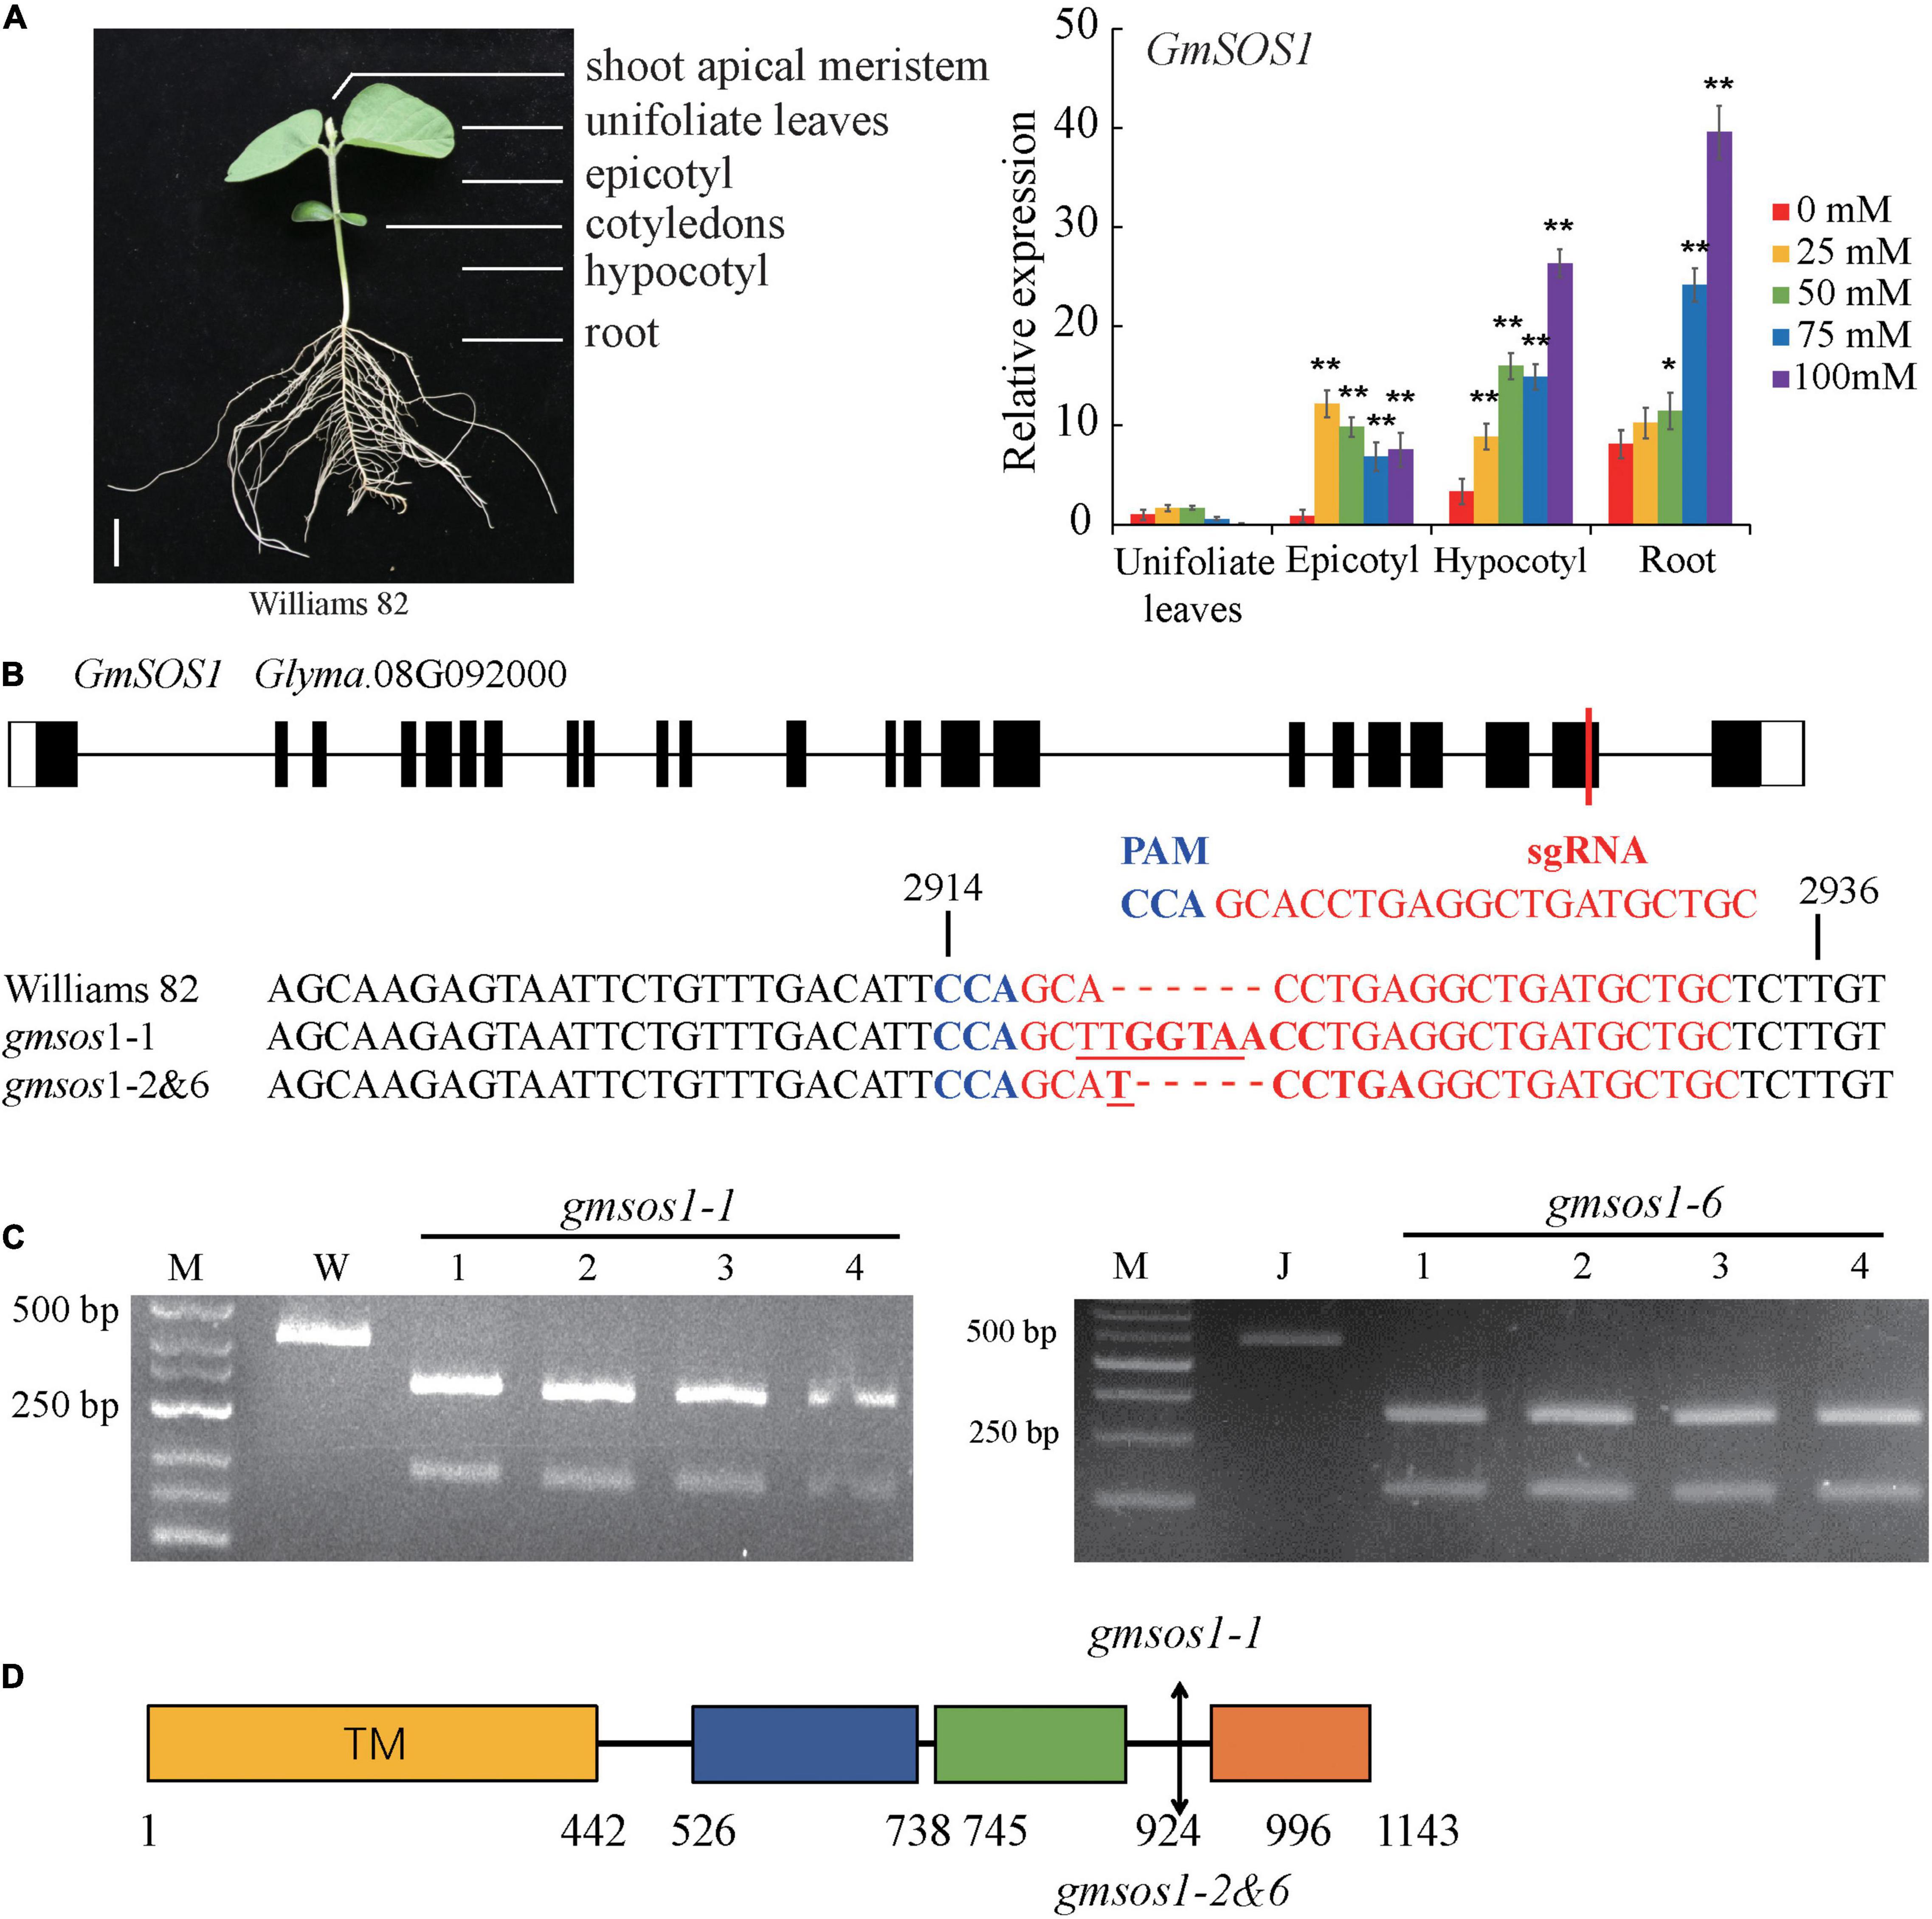
Figure 3. Generation of gmsos1 mutants using CRISPR/Cas9 system. (A) The relative transcript levels of GmSOS1 in different tissues as determined by qRT-PCR analysis. The RNA samples were from unifoliate leaf, root, epicotyl, and hypocotyl of Williams plants that are subjected to 0, 25, 50, 75, or 100 mM NaCl. Values are means ± SD (n = 3). Significant differences in mean values relative to the mean value of unstressed plants in each tissue are indicated by Student’s t-tests (*p < 0.05, **p < 0.01). (B) Generation of mutations in GmSOS1 (Glyma.08G092000) by CRISPR/Cas9 using single-guide RNA (sgRNA). The sgRNA sequence is in red, and the protospacer adjacent motif (PAM) sequence is in blue. The coding sequence of GmSOS1 that is complementary to the sgRNA and its flanking sequences are compared with the corresponding sequences in gmsos1-1, gmsos1-2, and gmsos1-6 mutants. The sequence in bold in gmsos1-1 is the BstE II digestion site (GGTNACC) and the sequence in bold in gmsos1-2 and gmsos1-6 is a Hpy188 III digestion site (TCNNGA). The numbers (2,914 and 2,936) above the nucleotide sequences are relative to the start codon of GmSOS1. (C) Cleaved amplified polymorphic sequence (CAPS) markers were used to identify the mutations in the gmsos1 mutants. PCR products amplified by specific primers from Williams (W) and the gmsos1-1 plants were digested by BstE II (left panel). PCR products amplified by specific primers from Jack and the gmsos1-6 plants were digested with Hpy188 III (right panel). Primers used in this experiment were listed in Supplementary Table 1. M represents DNA ladder. (D) The mutations identified in the gmsos1 mutants and potential effects on the GmSOS1 protein. Yellow box (from 1 to 442 aa), putative N-terminal transmembrane domain; blue box (from 526 to 738 aa), putative intracellular domain homologous to AtNHX8; green box (from 745 to 924 aa), putative C-terminal cyclic nucleotide (cNMP)-binding domain; orange box (from 996 to 1,143 aa), putative self-inhibition domain.
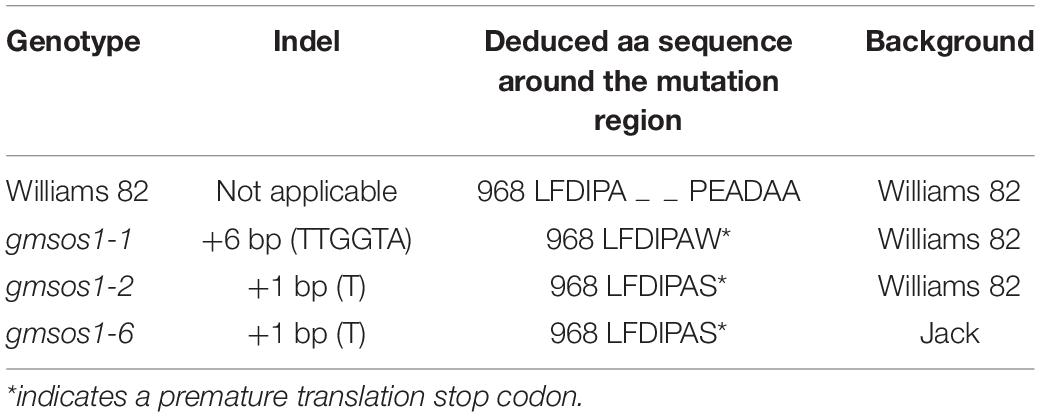
Table 1. List of the gmsos1 mutants in this study.
The gmsos1 Mutants Are Hypersensitive to Salt Stress
We examined the effects of the gmsos1-1 and gmsos1-6 mutations on salt tolerance with the hydroponic system. Compared with their relevant wild-type plants, the gmsos1-1 and gmsos1-6 plants display severe retarded growth or, at times, death and much lower survival rates under salt stress, indicating that they are hypersensitive to salt stress (Figures 4A,B). The roots of the gmsos1 mutants essentially accumulated the same amounts of Na+ as the roots of the wild-type seedlings under control conditions, but they accumulated substantially higher levels of Na+ under salt stress than the roots from the wild-type seedlings (Figure 4E). Meanwhile, the roots of the gmsos1 mutants had similar amounts of K+ as the roots from the wild-type seedlings under control conditions, but they accumulated significantly lower levels of K+ under salt stress than the roots of the wild-type seedlings (Figure 4G). As a result, the roots of the gmsos1 mutants had higher levels of Na+/K+ values than the roots of their wild-type seedlings under salt stress (Figure 4C). The unifoliate leaves of the gmsos1-6 seedlings accumulated lower amounts of Na+ than the unifoliate leaves from the Jack seedlings under control and salt stress conditions, whereas the unifoliate leaves of the gmsos1-1 seedlings had essentially similar levels of Na+ as the unifoliate leaves of the W82 seedlings under control and salt stress conditions (Figure 4F). The unifoliate leaves of the gmsos1-1 seedlings accumulated higher amounts of K+ than the unifoliate leaves of the W82 seedlings under control and salt stress conditions, whereas the unifoliate leaves of the gmsos1-6 seedlings had essentially similar levels of K+ as the unifoliate leaves of the Jack seedlings under control and salt stress conditions (Figure 4H). Because of the imbalanced accumulations of Na+ and K+, the unifoliate leaves of the gmsos1 mutants had lower Na+/K+ values than the unifoliate leaves of their wild-type seedlings under salt stress. Meanwhile, the unifoliate leaves of the gmsos1-6 seedlings had lower Na+/K+ value than the unifoliate leaves of the Jack seedlings under control conditions (Figure 4D). To examine in detail the gmsos1 mutant plants’ responses to salt stress, net Na+ or K+ flux in the root meristem zones of the gmsos1-1 and gmsos1-6 seedlings at the VC stage that were subjected to 160 mM NaCl treatment for 24 h were measured using Non-invasive Micro-Test Technology (NMT) within a continuous period of 300 s to show the dynamics of the Na+ or K+ flow. The gmsos1 mutants did not show any significant differences in net Na+ flux in the root meristem zones compared to their relevant wild-type seedlings under control conditions, but these mutants had slower net Na+ flux in the root meristem zones compared to their relevant wild-type seedlings under salt stress conditions (Figures 4I,J,M). The gmsos1-1 seedlings had slower net K+ flux in the root meristem zone than the W82 seedlings under control conditions, but had higher net K+ flux in the root meristem zone than the W82 seedlings under salt stress condition (Figures 4K,N). In contrast, the gmsos1-6 seedlings only had higher net K+ flux in the root meristem zone than the Jack seedlings under salt stress condition, while the mutant and the wild-type seedlings did not differ in net K+ flux in the root meristem zone under control conditions (Figures 4L,N). These results suggest that Na+ efflux in the gmsos1 mutants may be impaired due to the loss-of-function of GmSOS1, and that K+ efflux is enhanced in the gmsos1 mutants under salt stress.
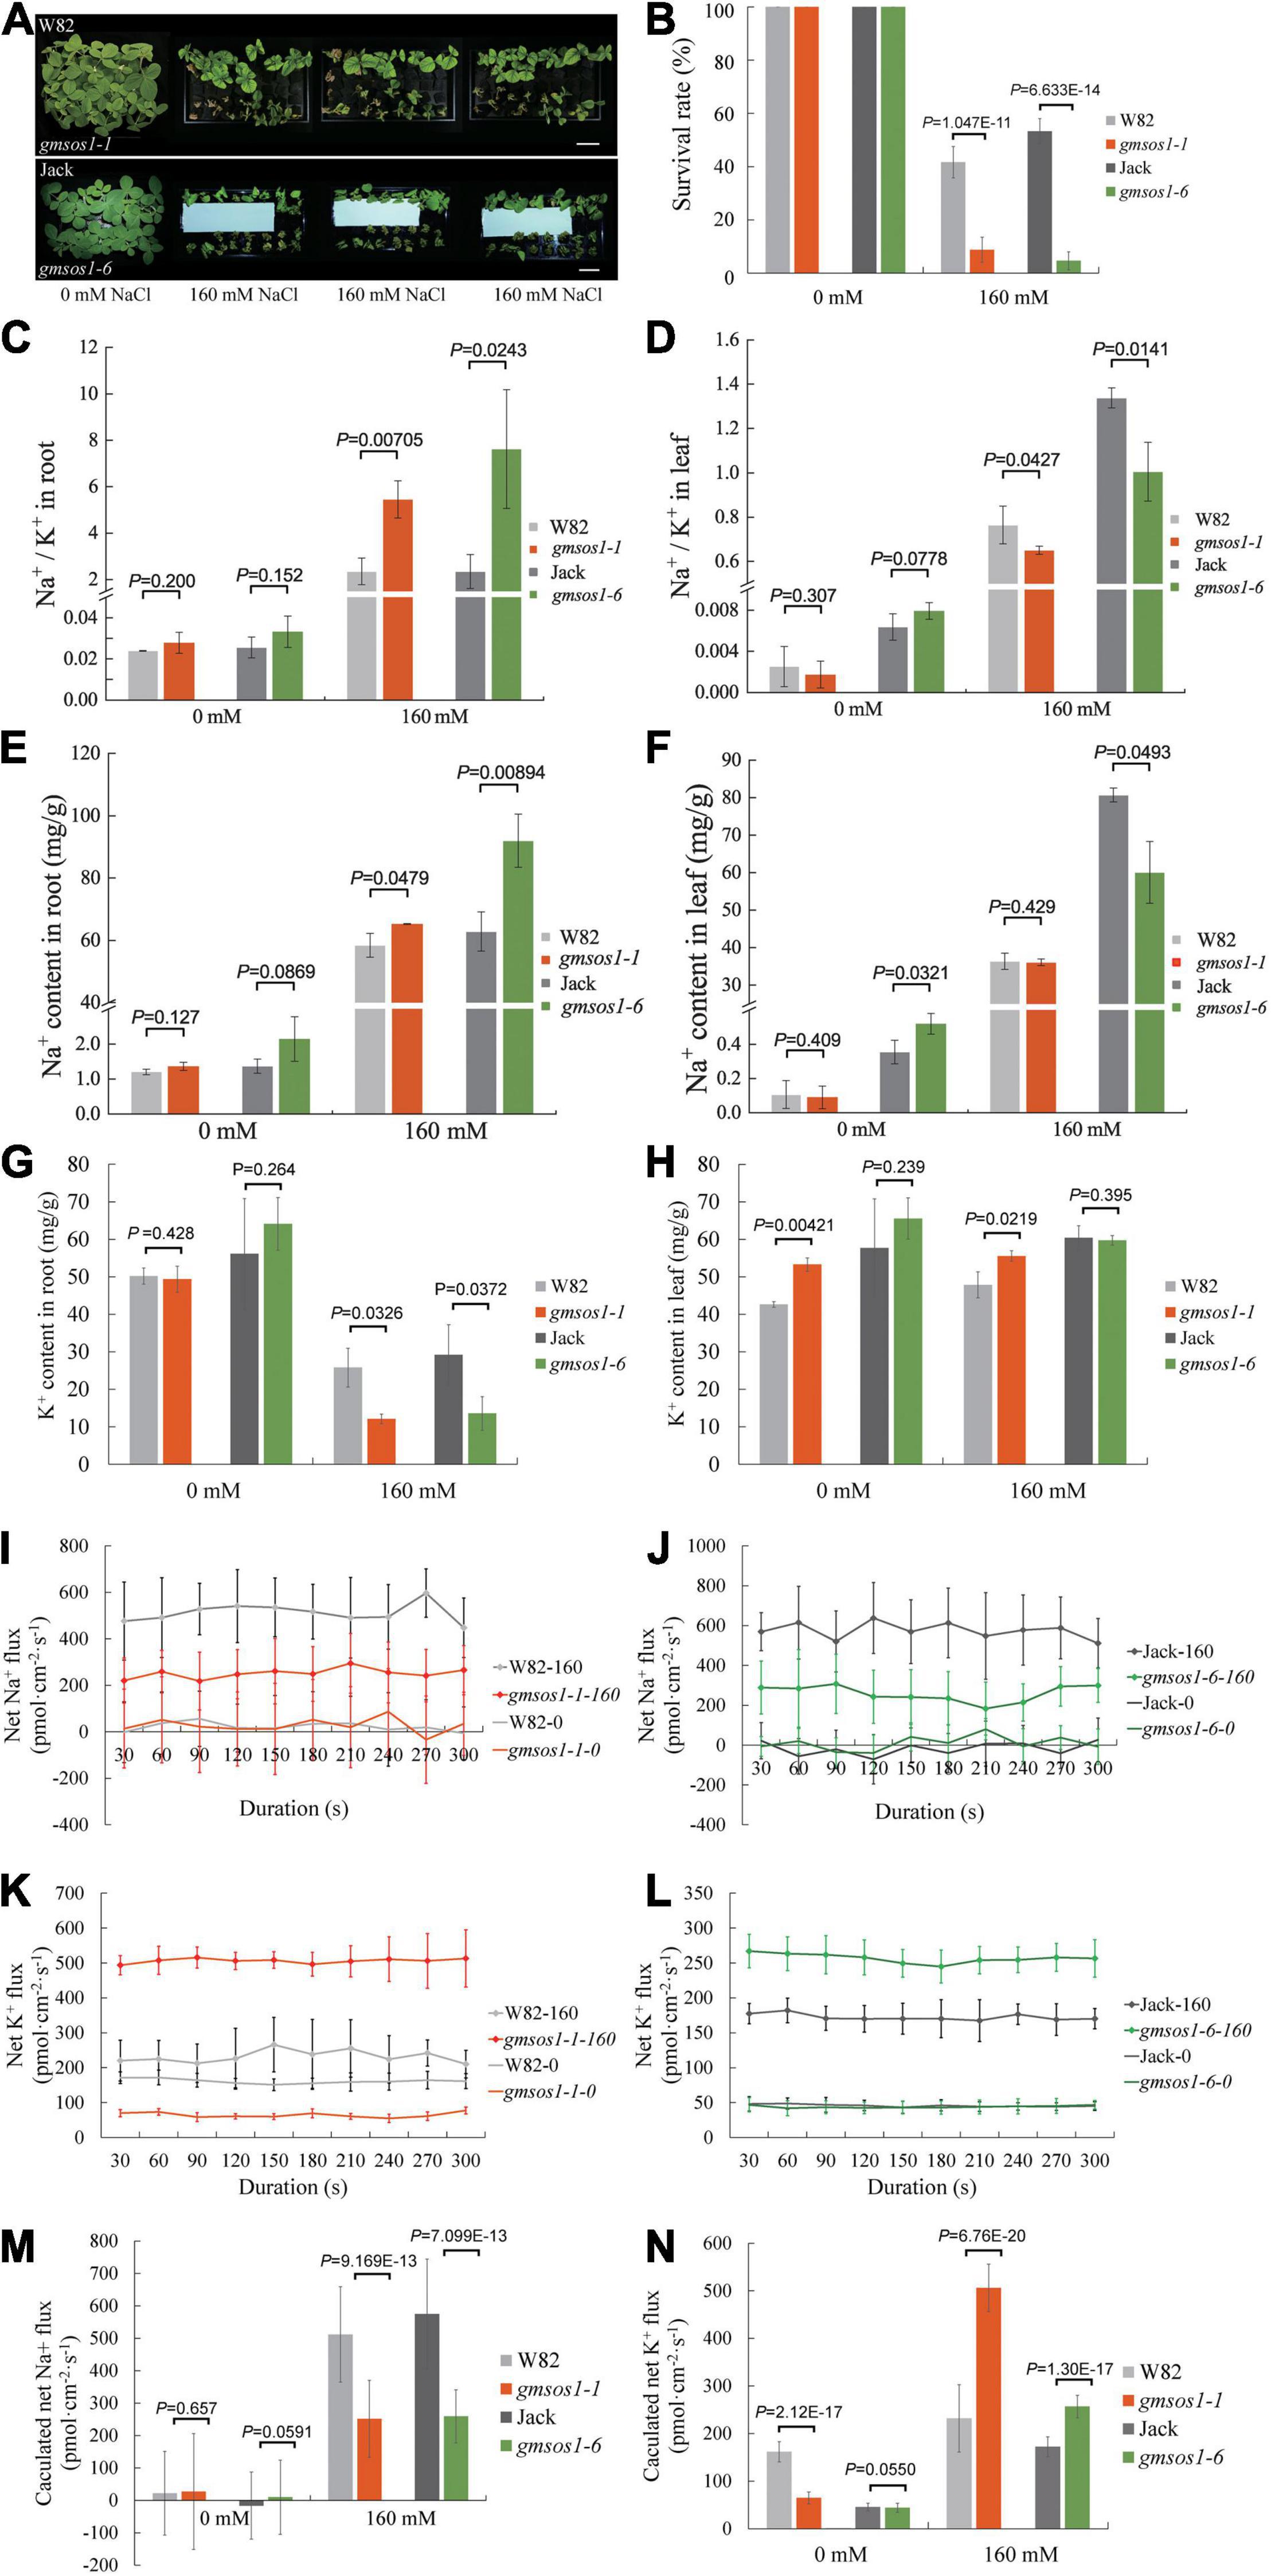
Figure 4. The gmsos1 mutants are more sensitive to salt stress than wild-type plants. (A) Growth of the gmsos1 mutants and wild type plants in liquid medium containing 0 or 160 mM NaCl. Bar = 6 cm. (B) Survival rates of the gmsos1 mutants and wild-type plants as shown in (A), the number of the plant is 12 in 3 repeated experiments. The Na+/K+ ratios in roots (C) and in unifoliate leaves (D), Na+ content in roots (E), Na+ content in unifoliate leaves (F), K+ content in roots (G), and K+ content in unifoliate leaves (H) of plants as shown in (A). Net Na+ flux analysis at the meristem zones of wild type and gmsos1-1 (I) and gmsos1-6 (J) mutants. Net K+ flux analysis at the root meristem zones of wild type and gmsos1-1 (K) and gmsos1-6 (L) mutant. (M) Calculated net Na+ fluxes from Net Na+ flux analysis at the meristem zone of wild-type and mutant roots. (N) Calculated net K+ fluxes from Net K+ flux analysis at the meristem zone of wild types and mutants. Data are means ± SD [n = 3 in (B, there are 12 plants per biological replicate), 6 in (C–N, there are at least 12 plants per biological replicate)]. p-values from Student’s t-tests were added in (B)–(H), (M), and (N).
Transcriptome Analysis of the gmsos1-1 Mutant
To further examine the global influence of the gmsos1-1 mutation on gene expression, we performed an RNA-seq analysis with roots and unifoliolate leaves from the W82 (WT) and gmsos1-1 plants under normal and salt stress conditions. We identified DEGs in the roots and unifoliate leaves of the gmsos1-1 under normal and salt stress conditions by the threshold of fold changes > 2 and adjusted FDR < 0.01 (Supplementary Tables 1, 2). Furthermore, principal component analysis (PCA) of the 2,000 most significant DEGs in the roots and unifoliate leaves of the wild-type and gmsos1-1 plants graphically confirmed that the DEG analysis was reliable (Figure 5A). Under the control conditions, there are 1,007 downregulated and 374 upregulated genes in the roots of the gmsos1-1, while there are 328 downregulated genes and 149 upregulated genes in the unifoliate leaves of the gmsos1-1 (Figure 5B and Supplementary Table 1). It seems that salt stress treatments led to a stronger effect on gene expression in the gmsos1-1 plants. Under the salt treatment, there are 692 downregulated genes and 936 upregulated genes in the roots of the gmsos1-1, while there are 851 downregulated genes and 1,453 upregulated genes in the unifoliate leaves of the gmsos1-1 (Figure 5B and Supplementary Table 2).
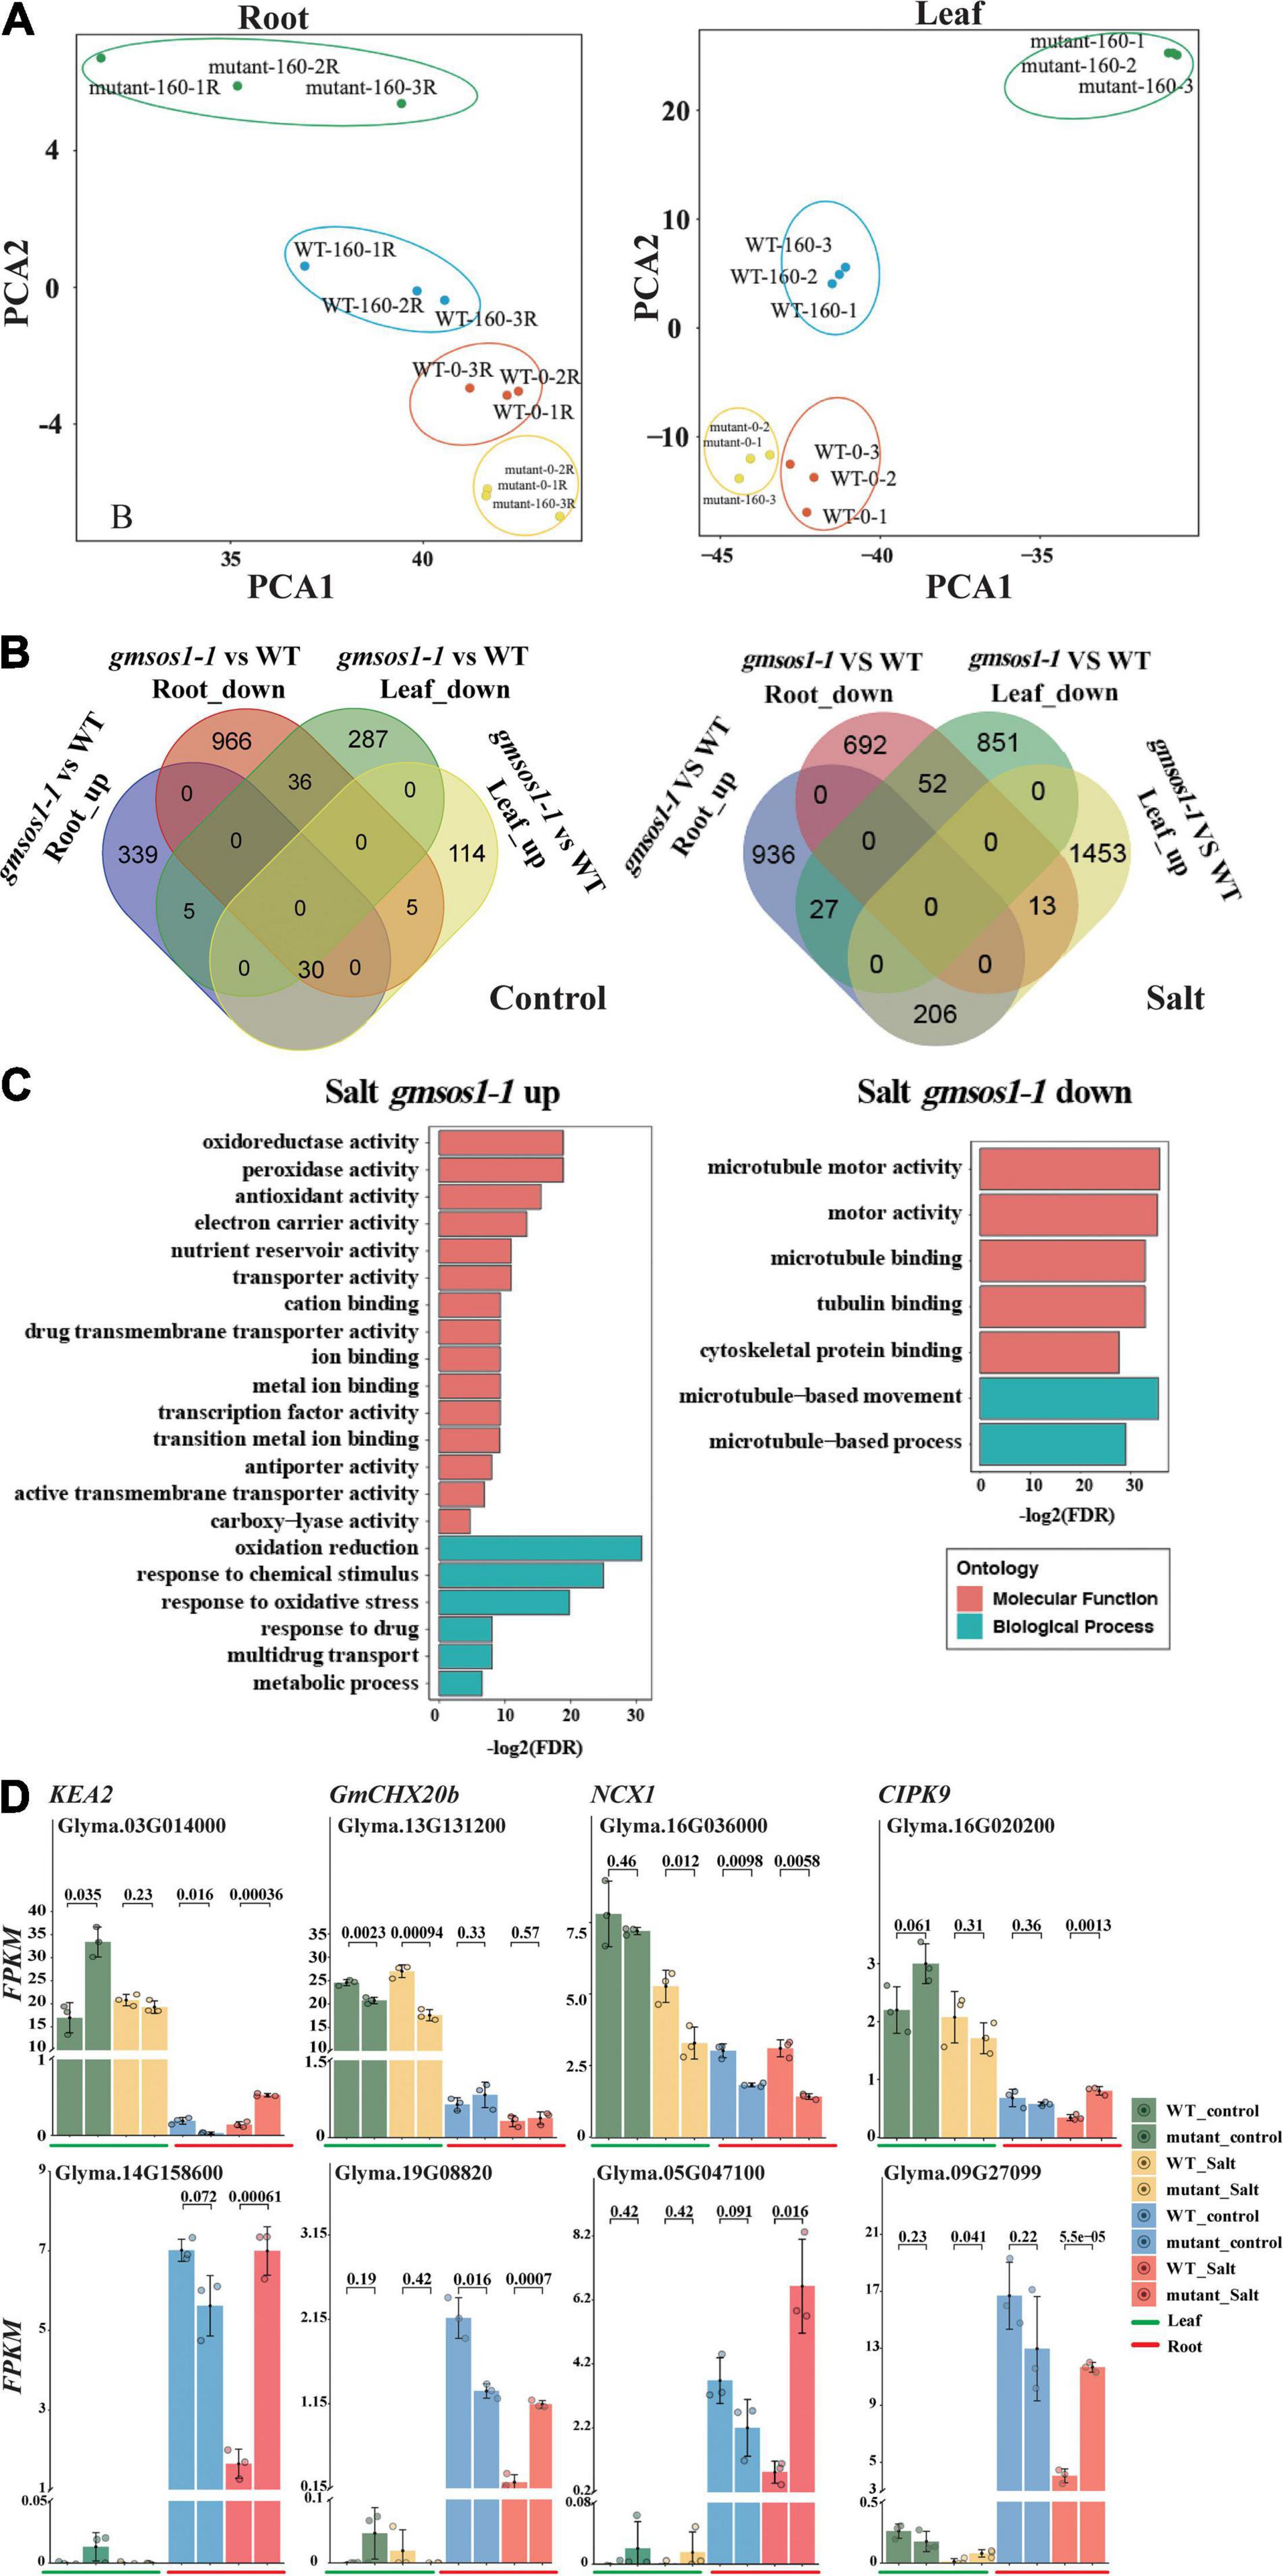
Figure 5. Summary of differentially expressed genes (DEGs) in the gmsos1-1 mutant. (A) Principal component analysis of the 2,000 most significant DEGs in root and leaf of the gmsos1-1 and wild-type plants (n = 3 biological replicates). (B) Four-way Venn diagram indicating the number of upregulated and downregulated genes in the unifoliate leaves and roots of gmsos1-1 mutant under control conditions (left panel). Four-way Venn diagram indicating the number of upregulated and downregulated genes found in the comparison between the roots of gmsos1-1 mutant and wild type under 160 mM NaCl treatment (right panel). (C) Gene-ontology analysis of the upregulated and downregulated genes in salted gmsos1-1 mutant. (D) Fragments per kilobase million (FPKM) of significantly upregulated and downregulated DEGs found in unifoliate leaves and roots of gmsos1-1 mutant and the wild-type W82 under 160 mM NaCl treatment. Error bars indicate standard deviation (n = 3). P-values are from Student’s t-tests.
To evaluate the potential biological function of the DEGs in the gmsos1-1 plants in response to salt treatment, GO analysis was performed using the AgriGO2 service (Du et al., 2010) for DEGs identified in the gmsos1-1 (Figure 5C and Supplementary Table 3). The 760 salt-responsive upregulated DEGs were clustered into 30 substantially enriched GO categories, with six biological processes and 18 functional categories (Figure 5C and Supplementary Table 4). The 693 salt responsive downregulated DEGs were clustered into seven substantially enriched GO categories, two of which corresponded to biological processes and the other five to functional categories (Figure 5C and Supplementary Table 4). The DEGs encode proteins with diverse functions in cellular processes. The top GO categories of the upregulated DEGs include “oxidation-reduction” (GO:0055114, 90 genes; FDR of 5.40E-10), “response to oxidative stress” (GO:0006979, 20 genes; FDR of 1.10E-06), “cation binding” (GO:0043169, 91 genes; FDR of 0.0016), and “antiporter activity” (GO:0022804, 17 genes; FDR of 0.004) (Supplementary Table 3). The top enriched GO categories of the downregulated DEGs in the salt-treated roots of the gmsos1-1 are microtubule network-related genes (GO:0007018, 20 genes; FDR of 2.10E-11) (Supplementary Table 2). There are 54 DEGs in the gmsos1-1 that encode proteins related to ion homeostasis (Supplementary Table 5). We paid particular attention to the expression levels of selected DEG encoding proteins potentially involved in the ionic component of salt stress, primarily Na+ and K+ transporters in the root and leaf, respectively (Supplementary Table 5). In Arabidopsis, KEA genes are expected to encode K+/H+ antiporters. GmKEA2 (Glyma.03G014000) is highly expressed in leaves, and it is upregulated in gmsos1-1 under control conditions (Figure 5D and Supplementary Table 5). GmKEA2 is expressed to a much lower level in the roots, and its level is greater in the gmsos1-1 than in the wild type (Figure 5D and Supplementary Table 5). GmCHX20b (Glyma.13G131200) encodes a cation/H+ exchanger (Jia et al., 2021), and its expression in roots was significantly lower than in leaves under control and salt stress conditions. In addition, its level is reduced in the leaves of the gmsos1-1 plants (Figure 5D and Supplementary Table 5). Furthermore, as a member of the Na+/Ca2+ exchanger (NCX) protein family, it plays important roles in cellular Ca2+ homeostasis (Singh et al., 2015). The expression of GmNCX1 (Glyma.16G036000) in roots was significantly lower than in leaves under control and salt stress conditions, and is upregulated in the roots of the gmsos1-1 plants (Figure 5D and Supplementary Table 5). Glyma.16G020200 encodes the CBL-interacting protein kinase 9 (GmCIPK9). The expression of GmCIPK9 in roots is lower than in leaves under control and salt stress conditions, and is downregulated in the unstressed roots and salted-treated leaves and roots of the gmsos1-1 plants (Figure 5D and Supplementary Table 5). Glyma.14G158600, Glyma.19G088200, Glyma.05G047100, and Glyma.09G270900 encode EF-hand (a diverse motif class consisting of 30 amino acids that fold into a helix-loop-helix structure; the loop between the helices comprised of ~12 conserved amino acids coordinates a calcium ion) domain-containing proteins and they have higher expression levels in the roots than in the leaves (Figure 5D and Supplementary Table 5). They are upregulated in the roots of the gmsos1-1 plants under salt stress (Figure 5D and Supplementary Table 5).
Discussion
Soybean is classified as a moderately salt-tolerant crop that displays a spectrum of salt-tolerance-related phenotypes (Phang et al., 2008). The salt-sensitive cultivars had a 37% decrease of yield than the salt-tolerant cultivars under saline conditions (Parker et al., 1983). At the seed germination and young seedling developmental stages, evaluation of soybean germplasms under salt stress employed cultivars of soybean from various regions, which showed diverse phenotypes that were sensitive, moderate, and tolerant under salt stress (Kan et al., 2016; Do et al., 2019). Efficient evaluation systems of soybean salt tolerance are lacking and could negatively impact the elucidation of molecular components in salt stress response pathways and breeding of salt-tolerant crops in the long term. In this study, we established a robust and quick salt-sensitivity screening for soybean cultivars. In addition, we primarily used the physiological parameters of seedling survival rate, accumulation of Na+ and K+ in the roots and leaves, and ratio of Na+/K+ in those two tissues.
There is a correlation between salt tolerance and Na+ accumulation and the Na+/K+ ratio (Wang et al., 2020). Comparative studies have shown that salinity-tolerant cultivars accumulate lower levels of Na+ in leaves and shoots compared with those in the salinity-sensitive cultivars. In addition, a lower Na+/K+ ratio is associated with salt tolerance (Golldack et al., 2003; Lee et al., 2003; Lin et al., 2004; Ren et al., 2005; Munns and Tester, 2008; Mahi et al., 2019; Wang et al., 2020). Hence, the quantitative measure of the Na+ and K+ concentrations in shoots and roots in salinized conditions has often been used as a trait in quantitative trait loci mapping, salt tolerance evaluation, and crop breeding programs (Hoang et al., 2016; Mahi et al., 2019). In this study, the contents of Na+ and K+ and the ratios of Na+/K+ in the roots are all significantly higher in the sensitive soybean cultivars and gmsos1 mutants. In contrast, there is no substantial differences in the contents of Na+, K+, or the Na+/K+ ratios in leaves of the sensitive soybean cultivars and gmsos1 mutants. One reason might be that GmSOS1 is highly expressed in the roots (Figure 3A), which are the most sensitive organ for Na+ accumulation and flow.
The membrane bound ion transporters are responsible for Na+ absorption, exclusion, compartmentation, and redistribution. The salt-tolerant cultivars HN85 and DS7 had much lower levels of Na+ in the leaves and roots, along with smaller Na+/K+ ratios in the roots, indicating that genes involved in Na+ efflux at high NaCl concentrations may be significant in these salt-tolerant cultivars. The results suggest that the sodium flux transporters are responsible for maintaining the intracellular Na+ concentration at low levels. The Na+/H+ antiporter SOS1 is one of the most important components in plant salt tolerance that is known so far. GmSOS1 is specifically expressed in roots and less expressed in leaves, epicotyls, and hypocotyls, and it is inducible by increasing salt stress levels. GmSOS1 shows similar expression patterns with the SOS1 genes from Arabidopsis, rice, and other plant species, which might contribute to the Na+ efflux in the roots to maintain low Na+ concentration in the sensitive organ.
In Arabidopsis, the C-terminal auto-inhibitory domain of SOS1 interacts with the adjacent activation domain to keep the resting status of basal activity without stress when the Ca2+-dependent SOS2-SOS3 protein kinase complex phosphorylates SOS1 and relieves SOS1 from auto-inhibition for an induced level upon salinity stress. The interaction of the auto-inhibitory domain with an activation domain is essential for the SOS1 activity (Quintero et al., 2011). There is evidence that a mutation, clustered at the C-terminal region between the activation and auto-inhibitory domains, causes salt tolerance which may hinder the activation and auto-inhibitory domain from interacting in vivo, thereby resulting in a constitutively active full-length SOS1 protein (Quintero et al., 2011). In this study, we designed a sgRNA that targets the nucleotide sequences corresponding to the linker of activation and auto-inhibitory domains, with an expectation to create point mutations in GmSOS1. In addition, to possibly create a constitutively active GmSOS1. We failed to identify a soybean plant carrying a constitutively active GmSOS1 in this study. Such a mutation may require successful precise base-pair editing technology, which is not currently well-developed. We were able to recover three mutants in GmSOS1 in this study: gmsos1-1, gmsos1-2, and gmsos1-6. These mutants have premature stop codons and created C-terminal deletions. The truncated GmSOS1 proteins from the gmsos1-1, gmsos1-2, and gmsos1-6 mutants might lack the target site (i.e., an amino acid residual equivalent to the serine 1,138 of AtSOS1) to be phosphorylated to activate GmSOS1 protein activity (Quintero et al., 2011). The roots of these mutants that lose SOS1 activity display decreased Na+ flux and increased accumulations of Na+, leading to hypersensitive responses to salt stress. The gmsos1 mutants have similar salt hypersensitive phenotypes as the sos1 mutants from other plant species, such as Arabidopsis and rice, suggesting that SOS1 function is conserved in eudicot and monocot angiosperms.
High salinity imposes water stress, which is the osmotic effect of the saline solution outside the cell, and an ionic imbalance, resulting primarily from the accumulation of Na+ and the loss of K+ (Munns and Tester, 2008). Roots are the main defensive barrier against salinity and is the organ that first senses this soil-derived stress (Munns and Tester, 2008). Leaves are the most sensitive organs to sense salinity. Hence, we performed whole-transcriptome sequencing (RNA-seq) analysis of roots and unifoliolate leaves from the W82 and gmsos1-1 plants under the normal and salt stress conditions to further investigate the global effect of the gmsos1-1 mutation on gene expression. We observed that a large number of genes whose expression was altered in the gmsos1-1 mutant plants. These DEGs encode proteins with diverse functions in nearly all cellular processes. There are over 50 DEGs in the roots of the salt-treated gmsos1-1, and these genes encodes proteins involved in ion homeostasis. Among the salt stress responses, ion homeostasis is essential for plant growth and development under environmental stresses. The monovalent CPA family members have evolved to accomplish this. AtKEAs encode K+/H+ antiporters in Arabidopsis and play important roles in facilitating K+ homeostasis and osmotic adjustment (Zheng et al., 2013). The expression of the AtKEA2 in atsos1 mutants shows a higher expression level under 160 mM NaCl (Zheng et al., 2013). In this study, GmKEA2 was upregulated in roots of the gmsos1-1 under salt stress, which shows a similar expression pattern as in the Arabidopsis atsos1 mutant plants. Our data demonstrated that the sensitivity of soybean seedlings to salt is strongly associated with the decreasing K+ contents in the roots and the accumulation of Na+ in the roots. The upregulation of GmKEA2 in the salinized gmsos1-1 roots might lead to the efflux of potassium ions in the roots and hypersensitive phenotype in the gmsos1-1 mutant plants. Studies on GmCHX20a and GmCHX1 indicate that cation/H+-exchangers (CHXs) perform diverse functions in plants to cope with salt stress. Cation/H+-exchanger1 (GmCHX1) is the causal gene in the major salt tolerance quantitative trait locus (QTL) in soybean that reduces the accumulation of Na+ in leaves (Guan et al., 2014; Qi et al., 2014; Patil et al., 2016; Do et al., 2019). Despite the lack of research on the function of GmCHX20b, GmCHX20a and GmCHX1 may act together in a coordinated manner to treat both osmotic and ionic stress caused by high salinity (Jia et al., 2021). The ectopic expression of GmCHX20a led to salt hypersensitivity, which is consistent with increased Na+ uptake into the root. Meanwhile, the expression of GmCHX1, which facilitates Na+ exportation, is halted to avoid counteracting the function of GmCHX20a (Jia et al., 2021). In our study, GmCHX20b (Glyma.13G131200) was significantly downregulated in the leaves of the gmsos1-1 mutant plants under salt stress. We speculate that GmCHX20b has a similar function as GmCHX1 to reduce the accumulation of Na+ in the leaves. Na+/Ca2+ exchangers (NCXs) play an important role in Ca2+ homeostasis in excitable animal cells. The NCX-like gene in Arabidopsis (AtNCL) had Na+/Ca2+exchange activity and was involved in Ca2+ homeostasis under salt stress in Arabidopsis. The atncl mutants are salt-tolerant, while the AtNCL overexpression plants are salt-sensitive in Arabidopsis (Wang et al., 2012). In this study, GmNCX1 (Glyma.16G036000) was significantly induced in the roots of the gmsos1-1 plants under salt stress, while GmNCX1 might function similarly as the AtNCL. Thus, the upregulation of GmNCX1 may contribute to the hypersensitivity of the gmsos1-1. The SOS pathway is the best-characterized CBL-CIPK pathway. The salt-induced increase in cytosolic free Ca2+ is sensed by the calcium-binding protein AtSOS3/AtCBL4 which binds to the serine/threonine protein kinase AtSOS2/AtCIPK24 (Liu and Zhu, 1998; Halfter et al., 2000; Liu et al., 2000). The AtSOS2-AtSOS3 complex phosphorylates AtSOS1, transporting sodium out of the cell (Halfter et al., 2000). In this study, genes encoding CIPK9 (Glyma.16G020200), at least ten EF-hand calcium-binding domain-containing proteins, and other protein kinases are up or downregulated in the roots of the gmsos1-1 mutant plants under salt stress (Supplementary Table 5), suggesting that malfunction of the calcium-binding proteins or calmodulin-like (CMLs) and CIPKs might contribute to the hypersensitive phenotype of the gmsos1-1 mutant to salt stress.
In summary, dysfunction of the GmSOS1 renders hypersensitivity to salt stress, which correlates with excessive Na+ accumulation and K+ efflux in the roots. This reverse genetic approach demonstrated that SOS1 function is conserved in eudicots (Arabidopsis sand soybean) and monocots (rice) of angiosperm species. The transcriptomic profiles of the roots of the gmsos1-1 mutant plants provide evidence of the critical and global regulatory role of GmSOS1 in soybean salinity stress responses. Findings from this study provide strong genetic evidence for GmSOS1 as a critical locus for future molecular breeding of salt-tolerant soybean cultivars. For example, as genome editing technologies develop, researchers could enhance the transcription of GmSOS1 by altering its promoter (i.e., insertion of an enhancer element), deactivate its transcriptional repressors, or enhance the transporter activities of GmSOS1 by expressing a constitutively active form of GmSOS1.
Accession Numbers
Sequence data from this article can be found in Phytozome (https://phytozome.jgi.doe.gov/pz/portal.html#) under accession numbers AtSOS1 (AT2G01980.1) and GmSOS1 (Glyma.08G092000.1 and NP_001244939.1).
Data Availability Statement
The datasets presented in this study can be found in online repositories. The names of the repository/repositories and accession number(s) can be found below: National Center for Biotechnology Information (NCBI) BioProject, accession no: PRJNA810576.
Author Contributions
LX, JZ, and QZ supervised and designed the experiments. MZ, JC, LY, XL, YG, and FJ performed the experiments and analyzed the data. TZ performed the bioinformatics analysis. LX, SA, TX, and JZ wrote the manuscript. All authors reviewed and approved the final version of the manuscript.
Funding
This work was supported by the National Natural Science Foundation of China (31801444), Heilongjiang Provincial Natural Science Foundation of China (LH2021C005), Heilongjiang postdoctoral Fund (LBH-Z14009), the National Non-Profit Institute Research Grant of the Chinese Academy of Forestry (CAFYBB2019ZY003), and the Fundamental Research Funds for the Central Universities (2572020DP01).
Conflict of Interest
The authors declare that the research was conducted in the absence of any commercial or financial relationships that could be construed as a potential conflict of interest.
Publisher’s Note
All claims expressed in this article are solely those of the authors and do not necessarily represent those of their affiliated organizations, or those of the publisher, the editors and the reviewers. Any product that may be evaluated in this article, or claim that may be made by its manufacturer, is not guaranteed or endorsed by the publisher.
Acknowledgments
We are grateful to Jian-Kang Zhu from the Shanghai Center for Plant Stress Biology and Center for Excellence in Molecular Plant Sciences, Chinese Academy of Sciences for kindly providing critical comments on the design of the experiments. We would like to thank Tianfu Han from the Institute of Crop Sciences, Chinese Academy of Agricultural Sciences for kindly providing the soybean seeds, HeNong 85, DongSheng 7, HeiHe 43, and HeFeng 55. We would like to thank Zhenfeng Jiang from Northeast Agricultural University for kindly providing the soybean seeds of DongNong 50 and Zhimin Zheng from Northeast Forestry University for kindly providing the soybean seeds of Williams 82 and Jack.
Supplementary Material
The Supplementary Material for this article can be found online at: https://www.frontiersin.org/articles/10.3389/fpls.2022.870695/full#supplementary-material
Footnotes
- ^ youngerusa.com
- ^ http://www.ncbi.nlm.nih.gov
- ^ http://www.csbio.sjtu.edu.cn/bioinf/plant-multi/
- ^ https://services.healthtech.dtu.dk/service.php?TMHMM-2.0
References
Aviv, A. (1993). “The Na+/H+ antiport: its role in cellular metabolism and in the pathophysiology of essential hypertension,” in Ionic Transport in Hypertension: New Perspectives, eds A. Coca and R. Garay (Boca Raton, FL: CRC Press), 119–132. doi: 10.1201/9780429277993-6
Boudsocq, M., and Sheen, J. (2013). CDPKs in immune and stress signaling. Trends Plant Sci. 18, 30–40. doi: 10.1016/j.tplants.2012.08.008
Chanroj, S., Wang, G., Venema, K., Zhang, M. W., Delwiche, C. F., and Sze, H. (2012). Conserved and diversified gene families of monovalent cation/H+ antiporters from algae to flowering plants. Front. Plant Sci. 3:25. doi: 10.3389/fpls.2012.00025
Chen, X. G., Lu, X. K., Shu, N., Wang, D. L., Wang, S., Wang, J. J., et al. (2017). GhSOS1, a plasma membrane Na+/H+ antiporter gene from upland cotton, enhances salt tolerance in transgenic Arabidopsis thaliana. PLoS One 12:e0181450. doi: 10.1371/journal.pone.0181450
Do, T. D., Vuong, T. D., Dunn, D., Clubb, M., Valliyodan, B., Patil, G., et al. (2019). Identification of new loci for salt tolerance in soybean by high-resolution genome-wide association mapping. BMC Genomics 20:318. doi: 10.1186/s12864-019-5662-9
Du, Z., Zhou, X., Ling, Y., Zhang, Z., and Su, Z. (2010). agriGO: a GO analysis toolkit for the agricultural community. Nucleic Acids Res. 38, W64–W70. doi: 10.1093/nar/gkq310
Gao, J. J., Sun, J., Cao, P. P., Ren, L. P., Liu, C., Chen, S. M., et al. (2016). Variation in tissue Na+ content and the activity of SOS1 genes among two species and two related genera of Chrysanthemum. BMC Plant Biol. 16:98. doi: 10.1186/s12870-016-0781-9
Golldack, D., Quigley, F., Michalowski, C. B., Kamasani, U. R., and Bohnert, H. J. (2003). Salinity stress- tolerant and -sensitive rice (Oryza sativa L.) regulate AKT1-type potassium channel transcripts differently. Plant Mol. Biol. 51, 71–81. doi: 10.1023/a:1020763218045
Graham, P. H., and Vance, C. P. (2003). Legumes: importance and constraints to greater use. Plant Physiol. 131, 872–877. doi: 10.1104/pp.017004
Guan, R., Qu, Y., Guo, Y., Yu, L., Liu, Y., Jiang, J., et al. (2014). Salinity tolerance in soybean is modulated by natural variation in GmSALT3. Plant J. 80, 937–950. doi: 10.1111/tpj.12695
Halfter, U., Ishitani, M., and Zhu, J.-K. (2000). The Arabidopsis SOS2 protein kinase physically interacts with and is activated by the calcium-binding protein SOS3. Proc. Natl. Acad. Sci. USA 97, 3735–3740. doi: 10.1073/pnas.040577697
Hasegawa, P. M., Bressan, R. A., Zhu, J.-K., and Bohnert, H. J. (2000). Plant cellular and molecular responses to high salinity. Annu. Rev. Plant Physiol. Plant Mol. Biol. 51, 463–499. doi: 10.1146/annurev.arplant.51.1.463
Isayenkov, S. V., and Maathuis, F. J. M. (2019). Plant Salinity Stress: Many Unanswered Questions Remain. Front. Plant Sci. 10:80. doi: 10.3389/fpls.2019.00080
Ishikawa, T., and Shabala, S. (2019). Control of xylem Na+ loading and transport to the shoot in rice and barley as a determinant of differential salinity stress tolerance. Physiol. Plant 165, 619–631. doi: 10.1111/ppl.12758
Jia, Q., Li, M. W., Zheng, C., Xu, Y., Sun, S., Li, Z., et al. (2021). The soybean plasma membrane-localized cation/H+ exchanger GmCHX20a plays a negative role under salt stress. Physiol. Plant 171, 714–727. doi: 10.1111/ppl.13250
Hoang, T. M. L., Tran, T. N., Nguyen, T. K. T., Williams, B., Wurm, P., Bellairs, S., et al. (2016). Improvement of salinity stress tolerance in rice: challenges and opportunities. Agronomy 6:54. doi: 10.3390/agronomy6040054
Kan, G., Ning, L., Li, Y., Hu, Z., Zhang, W., He, X., et al. (2016). Identification of novel loci for salt stress at the seed germination stage in soybean. Breed. Sci. 66, 530–541. doi: 10.1270/jsbbs.15147
Klink, V. P., Alkharouf, N., MacDonald, M., and Matthews, B. (2005). Laser capture microdissection (LCM) and expression analyses of Glycine max (soybean) syncytium containing root regions formed by the plant pathogen Heterodera glycines (soybean cyst nematode). Plant Mol. Biol. 59, 965–979. doi: 10.1007/s11103-005-2416-7
Kumar, S., Stecher, G., Li, M., Knyaz, C., and Tamura, K. (2018). MEGA X: molecular evolutionary genetics analysis across computing platforms. Mol. Biol. Evol. 35, 1547–1549. doi: 10.1093/molbev/msy096
Lee, K. S., Choi, W. Y., Ko, J. C., Kim, T. S., and Gregorio, G. B. (2003). Salinity tolerance of japonica and indica rice (Oryza sativa L.) at the seedling stage. Planta 216, 1043–1046. doi: 10.1007/s00425-002-0958-3
Lin, H. X., Zhu, M. Z., Yano, M., Gao, J. P., Liang, Z. W., Su, W. A., et al. (2004). QTLs for Na+ and K+ uptake of the shoots and roots controlling rice salt tolerance. Theor. Appl. Genet. 108, 253–260. doi: 10.1007/s00122-003-1421-y
Liu, J., and Zhu, J.-K. (1998). A calcium sensor homolog required for plant salt tolerance. Science 280, 1943–1945. doi: 10.1126/science.280.5371.1943
Liu, J., Ishitani, M., Halfter, U., Kim, C. S., and Zhu, J.-K. (2000). The Arabidopsis thaliana SOS2 gene encodes a protein kinase that is required for salt tolerance. Proc. Natl. Acad. Sci. USA 97, 3730–3734. doi: 10.1073/pnas.060034197
López-Ráez, J. A., Charnikhova, T., Gómez-Roldán, V., Matusova, R., Kohlen, W., De Vos, R., et al. (2008). Tomato strigolactones are derived from carotenoids and their biosynthesis is promoted by phosphate starvation. New Phytol. 178, 863–874. doi: 10.1111/j.1469-8137.2008.02406.x
Mahi, H. E., Pérez-Hormaeche, J., Luca, A. D., Villalta, I., Espartero, J., Gámez-Arjona, F., et al. (2019). A critical role of sodium flux via the plasma membrane Na+/H+ exchanger SOS1 in the salt tolerance of rice. Plant Physiol. 180, 1046–1065. doi: 10.1104/pp.19.00324
Martínez-Atienza, J., Jiang, X., Garciadeblas, B., Mendoza, I., Zhu, J.-K., Pardo, J. M., et al. (2007). Conservation of the salt overly sensitive pathway in rice. Plant Physiol. 143, 1001–1012. doi: 10.1104/pp.106.092635
Maughan, P. J., Turner, T. B., Coleman, C. E., Elzinga, D. B., Jellen, E. N., Morales, J. A., et al. (2009). Characterization of Salt Overly Sensitive 1 (SOS1) gene homologous in quinoa (Chenopodium quinoa Willd.). Genome 52, 647–657. doi: 10.1139/G09-041
Munns, R., and Tester, M. (2008). Mechanisms of salinity tolerance. Annu. Rev. Plant Biol. 59, 651–681. doi: 10.1146/annurev.arplant.59.032607.092911
Nie, W. X., Xu, L., and Yu, B. J. (2015). A putative soybean GmsSOS1 confers enhanced salt tolerance to transgenic Arabidopsis sos1-1 mutant. Protoplasma 252, 127–134. doi: 10.1007/s00709-014-0663-7
Núñez-Ramírez, R., Sánchez-Barrena, M. J., Villalta, I., Vega, J. F., Pardo, J. M., Quintero, F. J., et al. (2012). Structural insights on the plant salt-overly-sensitive 1 (SOS1) Na+/H+ antiporter. J. Mol. Biol. 424, 283–294. doi: 10.1016/j.jmb.2012.09.015
Oh, D. H., Leidi, E., Zhang, Q., Hwang, S. M., Li, Y. Z., Quintero, F. J., et al. (2009). Loss of halophytism by interference with SOS1 expression. Plant Physiol. 151, 210–222. doi: 10.1104/pp.109.137802
Parker, M. B., Gascho, G. J., and Gaines, T. P. (1983). Chloride toxicity of soybeans grown on Atlantic cost flatwoods soils. Agron. J. 75, 439–443. doi: 10.2134/agronj1983.00021962007500030005x
Patil, G., Do, T., Vuong, T. D., Valliyodan, B., Lee, J. D., Chaudhary, J., et al. (2016). Genomic-assisted haplotype analysis and the development of high-throughput SNP markers for salinity tolerance in soybean. Sci. Rep. 6:19199. doi: 10.1038/srep19199
Paz, M. M., Shou, H., Guo, Z., Zhang, Z., Banerjee, A. K., and Wang, K. (2004). Assessment of conditions affecting Agrobacterium-mediated soybean transformation using the cotyledonary node explant. Euphytica 136, 167–179. doi: 10.1023/B:EUPH.0000030669.75809.dc
Phang, T. H., Shao, G., and Lam, H. M. (2008). Salt tolerance in soybean. J. Plant Biol. 50, 1196–1212. doi: 10.1111/j.1744-7909.2008.00760.x
Qi, X., Li, M. W., Xie, M., Liu, X., Ni, M., Shao, G., et al. (2014). Identification of a novel salt tolerance gene in wild soybean by whole-genome sequencing. Nat. Commun. 5:4340. doi: 10.1038/ncomms5340
Quintero, F. J., Martinez, A. J., Villalta, I., Jiang, X., Kim, W. Y., Ali, Z., et al. (2011). Activation of the plasma membrane Na+/H+ antiporter salt-overly-sensitive 1 (SOS1) by phosphorylation of an auto-inhibitory c-terminal domain. Proc. Natl. Acad. Sci. USA 108, 2611–2616. doi: 10.1073/pnas.1018921108
Razzaque, S., Elias, S. M., Biswas, S., Haque, T., and Seraj, Z. I. (2014). Cloning of the plasma membrane sodium/hydrogen antiporter SOS1 for its over expression in rice. Plant Tissue Cult. Biotechnol. 23, 263–273. doi: 10.3329/ptcb.v23i2.17527
Ren, Z. H., Gao, J. P., Li, L. G., Cai, X. L., Huang, W., Chao, D. Y., et al. (2005). A rice quantitative trait locus for salt tolerance encodes a sodium transporter. Nat. Genet. 37, 1141–1146. doi: 10.1038/ng1643
Rubio, F., Nieves-Cordones, M., Horie, T., and Shabala, S. (2019). Doing ‘business as usual’ comes with a cost: evaluating energy cost of maintaining plant intracellular K+ homeostasis under saline conditions. New Phytol. 225, 1097–1104. doi: 10.1111/nph.15852
Sahraeian, S. M. E., Mohiyuddin, M., Sebra, R., Tilgner, H., Afshar, P. T., Au, K. F., et al. (2017). Gaining comprehensive biological insight into the transcriptome by performing a broad-spectrum RNA-seq analysis. Nat. Commun. 8:59. doi: 10.1038/s41467-017-00050-4
Shabala, S., Wu, H., and Bose, J. (2015). Salt stress sensing and early signalling events in plant roots: current knowledge and hypothesis. Plant Sci. 241, 109–119. doi: 10.1016/j.plantsci.2015.10.003
Shi, H., Ishitani, M., Kim, C., and Zhu, J.-K. (2000). The Arabidopsis thaliana salt tolerance gene SOS1 encodes a putative Na+/H+ antiporter. Proc. Natl. Acad. Sci. USA 97, 6896–6901. doi: 10.1073/pnas.120170197
Shi, H., Lee, B. H., Wu, S. J., and Zhu, J.-K. (2003). Overexpression of a plasma membrane Na+/H+ antiporter gene improves salt tolerance in Arabidopsis thaliana. Nat. Biotechnol. 21, 81–85. doi: 10.1038/nbt766
Shi, H., Quintero, F. J., Pardo, J. M., and Zhu, J.-K. (2002). The putative plasma membrane Na+/H+ antiporter SOS1 controls long-distance Na+ transport in plants. Plant Cell 14, 465–477. doi: 10.1105/tpc.010371
Singh, A. K., Kumar, R., Tripathi, A. K., Gupta, B. K., Pareek, A., and Singla-Pareek, S. L. (2015). Genome-wide investigation and expression analysis of sodium/calcium exchanger gene family in rice and Arabidopsis. Rice 8:21. doi: 10.1186/s12284-015-0054-5
Świeżawska, B., Duszyn, M., Jaworski, K., and Szmidt-Jaworska, A. (2018). Downstream targets of cyclic nucleotides in plants. Front. Plant Sci. 9:1428. doi: 10.3389/fpls.2018.01428
Wang, F., Sun, X., Shi, X., Zhai, H., Tian, C., Kong, F., et al. (2016). A global analysis of the polygalacturonase gene family in soybean (Glycine max). PLoS One 11:e0163012. doi: 10.1371/journal.pone.0163012
Wang, P., Li, Z., Wei, J., Zhao, Z., Sun, D., and Cui, S. (2012). A Na+/Ca2+ exchanger-like protein (AtNCL) involved in salt stress in Arabidopsis. J. Biol. Chem. 287, 44062–44070. doi: 10.1074/jbc.M112.351643
Wang, Z., Hong, Y. C., Li, Y. M., Shi, H. Z., Yao, J. J., Liu, X., et al. (2021). Natural variations in SlSOS1 contribute to the loss of salt tolerance during tomato domestication. Plant Biotechnol. J. 19, 20–22. doi: 10.1111/pbi.13443
Wang, Z., Hong, Y. C., Zhu, G. T., Li, Y. M., Niu, Q. F., Yao, J. J., et al. (2020). Loss of salt tolerance during tomato domestication conferred by variation in a Na+ /K+ transporter. EMBO J. 39:e103256. doi: 10.15252/embj.2019103256
Weinl, S., and Kudla, J. (2009). The CBL-CIPK Ca2+-decoding signaling network: function and perspectives. New Phytol. 184, 517–528. doi: 10.1111/j.1469-8137.2009.02938.x
Wu, H. H., Zhang, X. C., Giraldo, J. P., and Shabala, S. (2018). It is not all about sodium: revealing tissue specificity and signalling roles of potassium in plant responses to salt stress. Plant Soil 431, 1–17. doi: 10.1007/s11104-018-3770-y
Yadav, N. S., Shukla, P. S., Jha, A., Agarwal, P. K., and Jha, B. (2012). The SbSOS1 gene from the extreme halophyte Salicornia brachiata enhances Na+ loading in xylem and confers salt tolerance in transgenic tobacco. BMC Plant Biol. 12:188. doi: 10.1186/1471-2229-12-188
Ye, C.-Y., Yang, X., Xia, X., and Yin, W. (2013). Comparative analysis of cation/proton antiporter superfamily in plants. Gene 521, 245–251. doi: 10.1016/j.gene.2013.03.104
Zhao, X. F., Wei, P. P., Liu, Z., Yu, B. J., and Shi, H. Z. (2017). Soybean Na+/H+ antiporter GmsSOS1 enhances antioxidant enzyme activity and reduces Na+ accumulation in Arabidopsis and yeast cells under salt stress. Acta Physiol. Plant 39:19. doi: 10.1007/s11738-016-2323-3
Zheng, S., Pan, T., Fan, L., and Qiu, Q. S. (2013). A novel AtKEA gene family, homolog of bacterial K+/H+ antiporters, plays potential roles in K+ homeostasis and osmotic adjustment in Arabidopsis. PLoS One 8:e81463. doi: 10.1371/journal.pone.0081463
Zhou, Y., Yin, X. C., Wan, S. M., Hu, Y. P., Xie, Q., Li, R. M., et al. (2018). The Sesuvium portulacastrum Plasma membrane Na+/H+ antiporter SpSOS1 complemented the salt sensitivity of transgenic Arabidopsis sos1 mutant plants. Plant Mol. Biol. Rep. 36, 553–563. doi: 10.1007/s11105-018-1099-6
Zhu, J.-K. (2002). Salt and drought stress signal transduction in plants. Annu. Rev. Plant Biol. 53, 247–273. doi: 10.1146/annurev.arplant.53.091401
Keywords: GmSOS1, soybean, Na+ efflux, salt tolerance, breeding
Citation: Zhang M, Cao J, Zhang T, Xu T, Yang L, Li X, Ji F, Gao Y, Ali S, Zhang Q, Zhu J and Xie L (2022) A Putative Plasma Membrane Na+/H+ Antiporter GmSOS1 Is Critical for Salt Stress Tolerance in Glycine max. Front. Plant Sci. 13:870695. doi: 10.3389/fpls.2022.870695
Received: 14 February 2022; Accepted: 29 March 2022;
Published: 16 May 2022.
Edited by:
Camilla Hill, Murdoch University, AustraliaReviewed by:
Hongwei Xun, Northeast Normal University, ChinaMin Zhu, Yangzhou University, China
Huatao Chen, Jiangsu Academy of Agricultural Sciences (JAAS), China
Igor Pottosin, University of Colima, Mexico
Copyright © 2022 Zhang, Cao, Zhang, Xu, Yang, Li, Ji, Gao, Ali, Zhang, Zhu and Xie. This is an open-access article distributed under the terms of the Creative Commons Attribution License (CC BY). The use, distribution or reproduction in other forums is permitted, provided the original author(s) and the copyright owner(s) are credited and that the original publication in this journal is cited, in accordance with accepted academic practice. No use, distribution or reproduction is permitted which does not comply with these terms.
*Correspondence: Jianhua Zhu, amh6aHVAdW1kLmVkdQ==; Linan Xie, bGluYW54aWVAbmVmdS5lZHUuY24=
†These authors have contributed equally to this work