 Khadija Imtiaz
 Moddassir Ahmed
 Nazish Annum
 Mark Tester
 Nasir A. Saeed
- 1Wheat Biotechnology Lab, Agriculture Biotechnology Division, National Institute for Biotechnology and Genetic Engineering, Constituent College Pakistan Institute of Engineering and Applied Sciences, Faisalabad, Pakistan
- 2Center for Desert Agriculture, King Abdullah University of Science and Technology, Thuwal, Saudi Arabia
Globally, wheat is the major source of staple food, protein, and basic calories for most of the human population. Strategies must be adopted for sustainable wheat crop production to fill the ever-increasing food demand. Salinity is one of the major abiotic stresses involved in plant growth retardation and grain yield reduction. In plants, calcineurin-B-like proteins form a complicated network with the target kinase CBL-interacting protein kinases (CIPKs) in response to intracellular calcium signaling as a consequence of abiotic stresses. The AtCIPK16 gene has been identified in Arabidopsis thaliana and found to be significantly upregulated under salinity stress. In this study, the AtCIPK16 gene was cloned in two different plant expression vectors, i.e., pTOOL37 having a UBI1 promoter and pMDC32 having a 2XCaMV35S constitutive promoter transformed through the Agrobacterium-mediated transformation protocol, in the local wheat cultivar Faisalabad-2008. Based on their ability to tolerate different levels of salt stress (0, 50, 100, and 200 mM), the transgenic wheat lines OE1, OE2, and OE3 expressing AtCIPK16 under the UBI1 promoter and OE5, OE6, and OE7 expressing the same gene under the 2XCaMV35S promoter performed better at 100 mM of salinity stress as compared with the wild type. The AtCIPK16 overexpressing transgenic wheat lines were further investigated for their K+ retention ability in root tissues by utilizing the microelectrode ion flux estimation technique. It has been demonstrated that after 10 min of 100 mM NaCl application, more K+ ions were retained in the AtCIPK16 overexpressing transgenic wheat lines than in the wild type. Moreover, it could be concluded that AtCIPK16 functions as a positive elicitor in sequestering Na+ ions into the cell vacuole and retaining more cellular K+ under salt stress to maintain ionic homeostasis.
Introduction
Agricultural sustainability depends upon growing suitable crops in a particular ecological environment to achieve optimum crop productivity (Annum et al., 2022). Abiotic stresses such as salinity, drought, heat, frost, nutrient, and metal toxicity are the major factors affecting grain quality and limiting crop yield. Salinity is one of the major abiotic stresses that adversely affect agricultural productivity and sustainability, therefore threatening food security at the national and global scales (Syed et al., 2021).
Salinity affects plant growth and survival through osmotic or ionic stresses resulting in higher accumulation of sodium and chloride ions in the plant cells (Salim and Raza, 2020; Pastuszak et al., 2022). Excessive accumulation of Na+ results in poor aeration, reduced infiltration, and reduced hydraulic conductivity (water movement) through soil/water (Hailu and Mehari, 2021). Out of the 14 billion hectares of available land on earth, 831 million hectares are salt-affected, which accounts for 6% of the total available land (Ding et al., 2023). Out of the 831 million hectares of salt-affected land, 434 million hectares are affected by sodic soil and the remaining 397 million hectares are categorized as saline soil. In Pakistan, 4.5 million hectares of agricultural land are affected by salinity (Farid et al., 2018; Syed et al., 2021).
Over the years, extensive research has been carried out to understand the cellular and molecular mechanisms responsible for salt tolerance in plants. The molecular mechanisms associated with salt tolerance in plants are classified as transporters, detoxifiers, osmotic adjusters, phytohormones, and salt sensors. Transporters increase sodium/chloride ion efflux or compartmentalize into the vacuole and balance sodium/potassium homeostasis through potassium channel 1 (AKT1), potassium transporter 5 (HAK5), S-type anion channel (SLAH1), and salt overly sensitive 1 (SOS1). Detoxifiers that scavenge ROS are produced by ascorbate peroxidase, superoxide dismutase, catalase (CAT), GPX, GSH/glutathione, and NADH:peroxiredoxin oxidoreductase enzymes. Osmotic adjusters including glycine, betaine, polyphenol, sugars, proline, free amino acids, and polyamines have the ability to maintain low intracellular osmotic potential under salt stress in plants. Phytohormones like abscisic acid, cytokinin, gibberellic acid, brassinosteroids, jasmonates, indole acetic acid, and ethylene facilitate a broad array of adaptive responses and signaling in response to salt stress (Shabala et al., 2015; Amarasinghe et al., 2020.
Salt stress creates depolarization of the plasma membrane due to Na+ entry into the cell and initiates the outward potassium ion (K+) current to repolarize the plasma membrane potential. After repolarization of the plasma membrane with activation of the H+ pump by the phosphorylation process, the calcium ion (Ca2+) homeostasis is restored and potassium ion (K+) efflux channels are closed (Boudsocq and Sheen, 2013; Van Kleeff et al., 2018). The activation of the membrane and the restoration of its membrane potential (by maintaining inside negative potential) allowed in the potassium ions (K+) through the inward rectifying cation channel (IRCC) passive diffusion possibly through the H+/K+ symporter coupled with the downhill movement of H+ ions (Assaha et al., 2017).
Plants have established specific molecular and biochemical and physiological mechanisms to overcome the negative effect of salinity (El Sabagh et al., 2021). Plasma membranes play an important role in the transport of various ions/nutrients and vesicle transport across the membrane through host-specific proteins and are involved in downstream signal transduction pathways (Annum et al., 2022). In plants, calcium-facilitated signal transduction plays a regulatory role under biotic and abiotic stresses. Under salt stress, the SOS pathways are reported to be involved in the CBL–CIPK interaction to regulate the cellular ionic balance in plants. The salt overly sensitive pathway encoded a plasma membrane Na+/H+ antiporter that regulates the transport of Na+ ions from the cytoplasm and channels the sodium transport at a long distance from the plant root to the shoot. It also maintains the concentration of Na+ ions to a non-toxic level to increase salinity tolerance in plants (Ding et al., 2023).
To develop salt tolerance in plants, multiple transgenic approaches have been used by transforming salt tolerance genes through the Agrobacterium-mediated method in proliferating plant callus (Ishida et al., 2015), in-planta transformation protocol (Singh and Kumar, 2022), and chloroplast/plastid transformation through biolistic bombardment (Hanson et al., 2013). Several salt-tolerant genes isolated from various genetic resources have been transformed into cereal and vegetable crops to confer salinity tolerance. Overexpression of the NHX1 gene from Arabidopsis thaliana has demonstrated salinity tolerance in tomato, the AtAVP1 gene is associated with improving salinity tolerance in barley, the TaHKT1 gene excluded Na+ ions from the cell to develop salinity tolerance in durum wheat, and the expression of AtCIPK16 proved to improve salt tolerance in barley (Roy et al., 2013). In plants, four main Ca+2 ion sensors, namely, calmodulin (CaM), calmodulin-like proteins (CMLs), calmodulin-dependent protein kinase (CDPK), and calcineurin-B-like proteins (CBLs), receive the signals and temper the response due to rise in Ca+2 levels of different stimuli. In response to stress, CBLs as exclusive unique Ca+2 receptors sense the changes and bind with the CIPKs to develop a CBL–CIPK complex for downstream phosphorylation with the target protein to improve the plant stress-response ability (Xiaolin et al., 2022). The CBL–CIPK signaling is explicitly reported in plants (Arabidopsis, cotton, rice, etc.) as a Ca2+ ion-dependent system known to facilitate abiotic stress tolerance and is also involved in plant growth and development (Xiaolin et al., 2022). Therefore, the complexity and variety of CBL–CIPK signaling systems and the spatial specificity of target recognition were determined by their interacting function. CBLs were found to be two- to four-fold less in numbers as compared with CIPKs in green plants. The salt-responsive CBL–CIPK signaling mechanism exhibited much complexity in the functional diversity and expression pattern regulation due to diversity in the interaction of the different Ca2+ sensors with the same kinases and downstream phosphorylation of different target proteins (Tong et al., 2021).
In A. thaliana, abiotic stresses such as salinity, cold, and drought stimulate the CBL–CIPK gene expression (Tong et al., 2021). Recently, CBL–CIPK expression contributing to salinity tolerance had been verified in A. thaliana and Oryza sativa (Xi et al., 2017; Li et al., 2019). A sum of 10 loci encoding CBLs and 26 CIPKs encoding loci was found in A. thaliana, 10 CBLs and 34 CIPKs were determined in rice (O. sativa), 9 CBLs and 14 CIPKs were reported in barley (Hordeum vulgare), 7 CBLs and 13 CIPKs were demonstrated in soybean (Glycine max), and 2 CBLs and 7 CIPKs were identified in pine (Pinus) (Ma et al., 2020; Tong et al., 2021; Xiaolin et al., 2022). Arabidopsis thaliana CIPKs (CIPK1, CIPK3, CIPK6, CIPK8, CIPK16, CIPK21, CIPK23, and CIPK24) had been known to be involved in salinity tolerance in plants (Amarasinghe et al., 2020; Ding et al., 2022). In the wheat genome, approximately 24 CBL and 79 CIPK genes had been identified (Ma et al., 2020). However, the function and related molecular mechanism of the CIPK gene family associated with abiotic stress tolerance have yet to be explored, especially in wheat. The CIPK29 gene was identified in wheat and found to have a higher transcription level upon exposure to sodium, cold, ethylene, and methyl viologen. Salt stress changes the cytosolic calcium level in the root cells; these changes had been sensed and responded to the sensor molecules. Sensors (CBLs/Ca2+-binding domains) phosphorylate AtCIPK16 to relieve it from autoinhibition to further phosphorylate multiple downstream targets. In A. thaliana, AtCIPK16 was reported to possess a strong affinity with CBL4 and CBL5 rather than with CBL1, CBL2, CBL9, and CBL10 (Amarasinghe et al., 2020). AtCIPK16 has also been constitutively overexpressed in a barley cultivar (Golden promise) and reported to improve salinity tolerance with a 20%-45% increase in plant biomass compared with traditional breeding. ZmCIPK16 was identified in maize as a candidate gene to develop salinity tolerance in this crop plant species (Zhao et al., 2009; Ding et al., 2023).
A growing number of evidence explaining the role of AtCIPK16 in salinity tolerance were investigated in model systems, and it was found to be highly conserved in many plant species through evolutionary descent but had yet to be evaluated in crop plants like wheat (Xiaolin et al., 2022). Therefore, the present study focused on the transformation of the AtCIPK16 gene in a local wheat cultivar to investigate its involvement in imparting salinity tolerance in this crop plant.
Materials and methods
Plant material
Seeds of the local wheat cultivar Faisalabad-2008 were obtained from the Wheat Research Institute (WRI), Ayub Agriculture Research Institute (AARI), Faisalabad, Pakistan. The seeds were sown in pots and grown in a glasshouse at the National Institute for Biotechnology and Genetic Engineering (NIBGE), Faisalabad, under the following growth conditions: a photoperiod of 14/10 h (day/night), a temperature of 22°C with 70% humidity, and a light intensity of 116 μmol m−2 s−1. Standard agronomic practices were followed to maintain optimum plant growth in pots under control conditions. Two plasmid constructs, i.e., expressing the AtCIPK16 gene under the UBI1 promoter in the pTOOL37 plasmid (construct 1) and possessing the same gene under the 2XCaMV35S promoter in the pMDC32 plasmid (construct 2), were prepared and transformed in the local wheat cultivar Faisalabad-2008 through Agrobacterium-mediated wheat transformation protocol. Non-transformed Faisalabad-2008 plants were used as wild-type (Wt) control. Six transgenic wheat lines of overexpressing (OE) AtCIPK16 gene were selected to evaluate various salinity levels in this study. The transgenic lines OE1, OE2, and OE3 were expressing the AtCIPK16 gene under the UBI1 promoter, while the lines OE5, OE6, and OE7 were expressing the same gene under the 2XCaMV35S promoter. Plants were grown in small pots containing peat moss in a greenhouse with a 16/8-h day length regime at 20°C, 70% humidity, and a light intensity of 116 μmol m−2 s−1. Leaf samples from the transgenic wheat lines were collected from the greenhouse and processed for further experimentation.
Preparation of the AtCIPK16 plasmid constructs
Total RNA was isolated from the tissues of A. thaliana by following the RNase TRIzol reagent (Thermo Fisher Scientific, USA, Cat. # 15596026) method (Rio et al., 2010). The full-length cDNA of the AtCIPK16 (Accession # AY030304.1) gene was amplified using gene-specific primers. The polymerase chain reaction (PCR)-amplified product was purified using a PCR Purification Kit (Thermo Fisher Scientific, Cat. # K0701) and cloned under the UBI1 and 2XCaMV35S promoters. Restriction analysis was performed to confirm the successful integration of the AtCIPK16 gene using the Apa1 and Spe1 restriction enzymes in the pTOOL37 plasmid (construct 1) and the Sal1 and Spe1 restriction enzymes in the pMDC32 plasmid (construct 2). The restricted plasmid and the AtCIPK16 gene fragments were resolved on 1% agarose gel to validate the cloning of the said gene under the UBI1 and 2XCaMV35S promoters.
Transformation of plasmids in Escherichia coli
The heat shock method was used to transform the said plasmids in the Escherichia coli strain DH10α competent cells at 42°C for 45 s. Plasmid DNA was isolated by using Miniprep Kit (GeneJET, Cat. # 0502) from the transformed E. coli broth culture at OD600 cell density. Eluted plasmids were quantified by using the NanoDrop (ND-2000, Thermo Scientific) spectrometer. Extracted plasmids and glycerol stocks of bacterial cultures were stored at −80°C to be used for Agrobacterium tumefaciens transformation.
Transformation of Agrobacterium tumefaciens
A hypervirulent strain, i.e., AGL-1 of A. tumefaciens, was transformed by both the verified plasmid constructs through the electroporation method. Electric shock was provided at 1.44 kV, capacitance of 20 µF, and resistance of 220 Ω. The successful transformants of both vectors in A. tumefaciens cells were confirmed by PCR. The AGL-1 cells harboring the binary vectors pTOOL37 and pMDC32 were used for the inoculation of wheat immature embryos.
Wheat transformation
Immature wheat embryos were isolated from 9-14 days-old post-anthesis spikes and cultured on the callus induction medium. One-week-old calli were inoculated with A. tumefaciens culture and shifted to the freshly prepared Murashige and Skoog (MS) basal medium supplemented with 400 mM of acetosyringone. Inoculated immature embryos (in Petri plates) were incubated in the dark at 28°C for 2 h, blot-dried, and cultured on MS basal medium containing 200 mg L−1 of Timentin and 200 mg L−1 of hygromycin for 2 weeks. After 15 days, the developing calli were subcultured on a freshly prepared callus induction medium.
Growth and regeneration activity of the callus
The developing calli were kept on the subculturing MS basal medium supplemented with 200 mg L−1 of Timentin until the initiation of regeneration signs. Then, the calli were transferred to the freshly prepared IK4 (IAA and kinetin) medium containing 200 mg L−1 of hygromycin till the start of regeneration. The regenerated tiny plantlets were transferred to sterile jars having IK4 medium supplemented with 200 mg L−1 of hygromycin as a plant selection. After the emergence of the primary roots, the plantlets were shifted to small plastic pots filled with peat moss and compost in a 2:1 ratio. These plastic pots were tightly covered with air-tight polythene bags. Upon attaining sufficient growth of the plantlets, the polythene bags were removed from the top of the plastic pots, and the pots were supplied with the necessary fertilizers to meet the nutritional requirements of the wheat plants.
Molecular analysis of the putative wheat transgenes
Antibiotic selection assay
Putative transgenic wheat plants were initially assessed and evaluated through antibiotic selection assay by two different methods: 1) antibiotic leaf pasting assay by cotton swab and 2) detached leaf dip assay in antibiotic-supplemented solution. For this purpose, the MS medium containing 200 mg L−1 of hygromycin was prepared and used for the leaf pasting assay. The surface of the fully developed fourth leaf from the bottom was washed with distilled water and dried, and the 2-3-cm area of the leaves was painted in vivo with antibiotic (200 mg L−1 of hygromycin) solution with a cotton swab. In the detached leaf dip assay, a 5-cm-long piece of the fourth leaf of the Wt and putative transgenic wheat plants was cut and immersed in media containing 200 mg L−1 of hygromycin antibiotic for a period of 15 days.
Validation of putative transgenic wheat plants through PCR
Putative transgenic wheat plants confirmed through antibiotic leaf pasting and leaf dip assay were further subjected to validation through PCR amplification. Wheat leaf samples were taken to isolate DNA by using the CTAB method (Richards et al., 1994) from the Wt and transgenic plants. Antibiotic-specific (plant selection), promoter-specific, promoter- plus gene-specific, and gene-specific primers were used to further confirm the transgenic and non-transgenic (wild-type) plants. The plasmid DNA of each construct was used as a positive control, and the non-transformed wheat cultivar Faisalabad-2008 (wild type) was used as a negative control in the PCR reaction setup. Approximately 100 ng of genomic DNA from each sample was used as a template in PCR amplification. DreamTaq Green PCR Master Mix (Thermo Fisher Scientific, USA) was used in the PCR master mix reactions. The insertion of the binary vector pTOOL37 containing the AtCIPK16 gene under the control of the UBI1 promoter (construct 1) was validated in putative transgenic wheat plants through PCR by using primer sequences given in Table 1. The PCR profile consisted of an initial denaturation at 95°C for 5 min, followed by denaturation at 95°C for 1 min, primer annealing at 58°C for 1 min, fragment extension at 72°C for 1 min (repeated 30 times), and final extension at 72°C for 10 min. The integration of the binary vector pMDC32 expressing the AtCIPK16 gene under the 2XCaMV35S promoter (construct 2) in transgenic wheat plantlets was confirmed through PCR amplification in the same manner as discussed above. The primer sequences used for the confirmation of the transgene are given in Table 1. The PCR profile was set with an initial denaturation at 95°C for 5 min, denaturation at 95°C for 1 min, primer annealing at 54°C for 1 min, fragment extension at 72°C for 1 min, and final extension at 72˚C for 10 min. The PCR products were resolved on 1% agarose gel and visualized under UV light by using a gel documentation system (Bio-Rad, USA).
Table 1 List of primers.
Expression analysis through RT-PCR
The expression of the AtCIPK16 (Accession # AY030304.1) gene was quantified in transgenic wheat plants by using the following primer pairs: forward primer, 5′CCACCGTGGTTTTCCTTAGA3′; reverse primer, 5′TCCGTCGTCTTTTTCTCGT3′. Total RNA was extracted by using the TRIzol reagent (Invitrogen, USA, Cat. # TR118) followed by DNase treatment to remove any possible genomic DNA contamination. The first-strand cDNA was synthesized using a cDNA synthesis Kit (Fermentas, USA, Cat. # K1631). The relative expression of the AtCIPK16 gene was determined through comparative threshold cycle values. The actin gene (Accession # KC775782.1) with primer sequences, 5′CCGACCGTATGAGCAAGGAG3′ and 5′AAATTCGCCGTTACCTGCTG3′, was used for the normalization of the transcript level.
Assessment of salinity tolerance
Transgenic wheat plants expressing the AtCIPK16 gene under the 2XCaMV35S and UBI1 promoters were evaluated for salinity tolerance at various levels of salt stress. Fifteen seeds of each transgenic line were grown on germination paper at room temperature to check their viability and rate of germination. Upon the start of germination, plantlets were transplanted into small plastic/PVC pots containing vermiculite. Four salinity treatments, i.e., 0, 50, 100, and 200 mM, were applied along with Hoagland nutrient solution at regular 1-week intervals to assess the level of salinity tolerance in different overexpressing transgenic wheat lines.
Ion flux measurement
Net K+ ion flux was measured by non-invasive microelectrode ion flux estimation (MIFE) as described by Zarza et al. (2019). Microelectrode was prepared by following the protocol of Wu et al. (2015) (Supplementary S7). For the determination of K+ ion efflux from the root cells, 5-day-old seedlings of transgenic wheat were immobilized in a Petri plate containing basic salt solution (BSM 0.2 mM, CaCl2 5 mM, MES 0.5 mM, KCl 2 mM, Tris base, pH 6.0). The roots were separated from the shoot issues and immobilized horizontally for preincubation for 30 min in the salt solution (Zarza et al., 2019). Four seedlings were used randomly for each replicate. The reference electrode was prepared to be used as control, and the K+ ion microelectrode was calibrated to be positioned at a 40-µm distance from the root tissue surfaces in the root mature zone (Batistič and Kudla, 2009). Initially, the steady flux was measured for a period of 10 min, then 1 ml of 1,000 mM NaCl stock solution was added, and net K+ ion flux was recorded for 30 min. Three-dimensional micromanipulators of the inverted microscope were used with a magnification of ×200. The MIFE program interfaced with the CHART software was used for its calibration as used earlier for the K+ ion microelectrode. The travel range of the microelectrode was set to 70 µm between two positions, and the hydraulic manipulator controlled the movement of microelectrodes between designated positions.
Flux calculations
The MIFEFLUX software was used to calculate the K+ ion flux data generated from transgenic and Wt wheat root cells in controlled conditions and in NaCl-induced stress condition (Yun et al., 2018). Statistical analysis was conducted by using Microsoft Excel 2016 Windows 10 (RRID: SCR_016137, https://www.microsoft.com/en-gb/). The significance of data was predicted by exploiting one-way ANOVA and Student’s t-test (*P< 0.05). K+ ion flux values were plotted against designated time laps and changes in flux.
Results
Cloning of the AtCIPK16 gene under the UBI1 and 2XCaMV35S promoters
The AtCIPK16 gene (1,410 bp fragment size) cloned in construct 1 and construct 2 (Figures 1A, B) was validated through restriction analysis of pTooL37 and pMDC32, indicating the release of 2,131, 9,403, 2,154, and 10,131 bp cassettes (Figures S1A, B), respectively. These plasmid vectors containing the AtCIPK16 gene were then transformed into the AGL-1 strain of A. tumefaciens, and the transformants were confirmed by PCR amplification by plant selection (hygromycin)-specific (Figure S2A) and promoter- and gene-specific primers for construct 1 (Figure S2B) and promoter- and gene-specific primers for construct 2 (Figure S2C; Table 1).
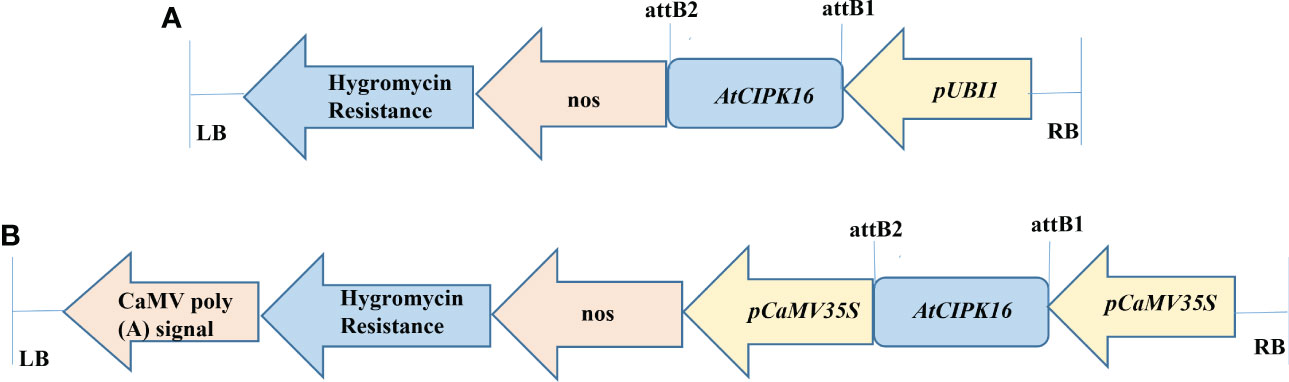
Figure 1 Diagrammatic representation of AtCIPK16 constructs. (A) Construct 1 was used for wheat transformation (pTOOL37 + UBI1 + AtCIPK16) under the Ubiquitin 1 promoter and the pTOOL37 vector. (B) Construct 2 was used for wheat transformation (pMDC32 + 2XCaMV35S + AtCIPK16) under the Cauliflower Mosaic Virus 35S promoter and the pMDC32 vector.
Selection of transformed wheat callus on antibiotic-supplemented medium
Upon transformation of the AtCIPK16 gene into the wheat callus (Figure 2) by using the Agrobacterium-mediated protocol, 90 wheat plantlets originated from the inoculated calli grown on the selection medium. Among the 90 plantlets, only 28 were phenotypically identical to the parental wheat cultivar and started to have roots emerging on the rooting medium. Twelve lines were selected for further evaluation depending on their survival rate and potential to grow on the selection medium. No regeneration activity was observed in non-transformed wheat calli on the antibiotic selection medium.
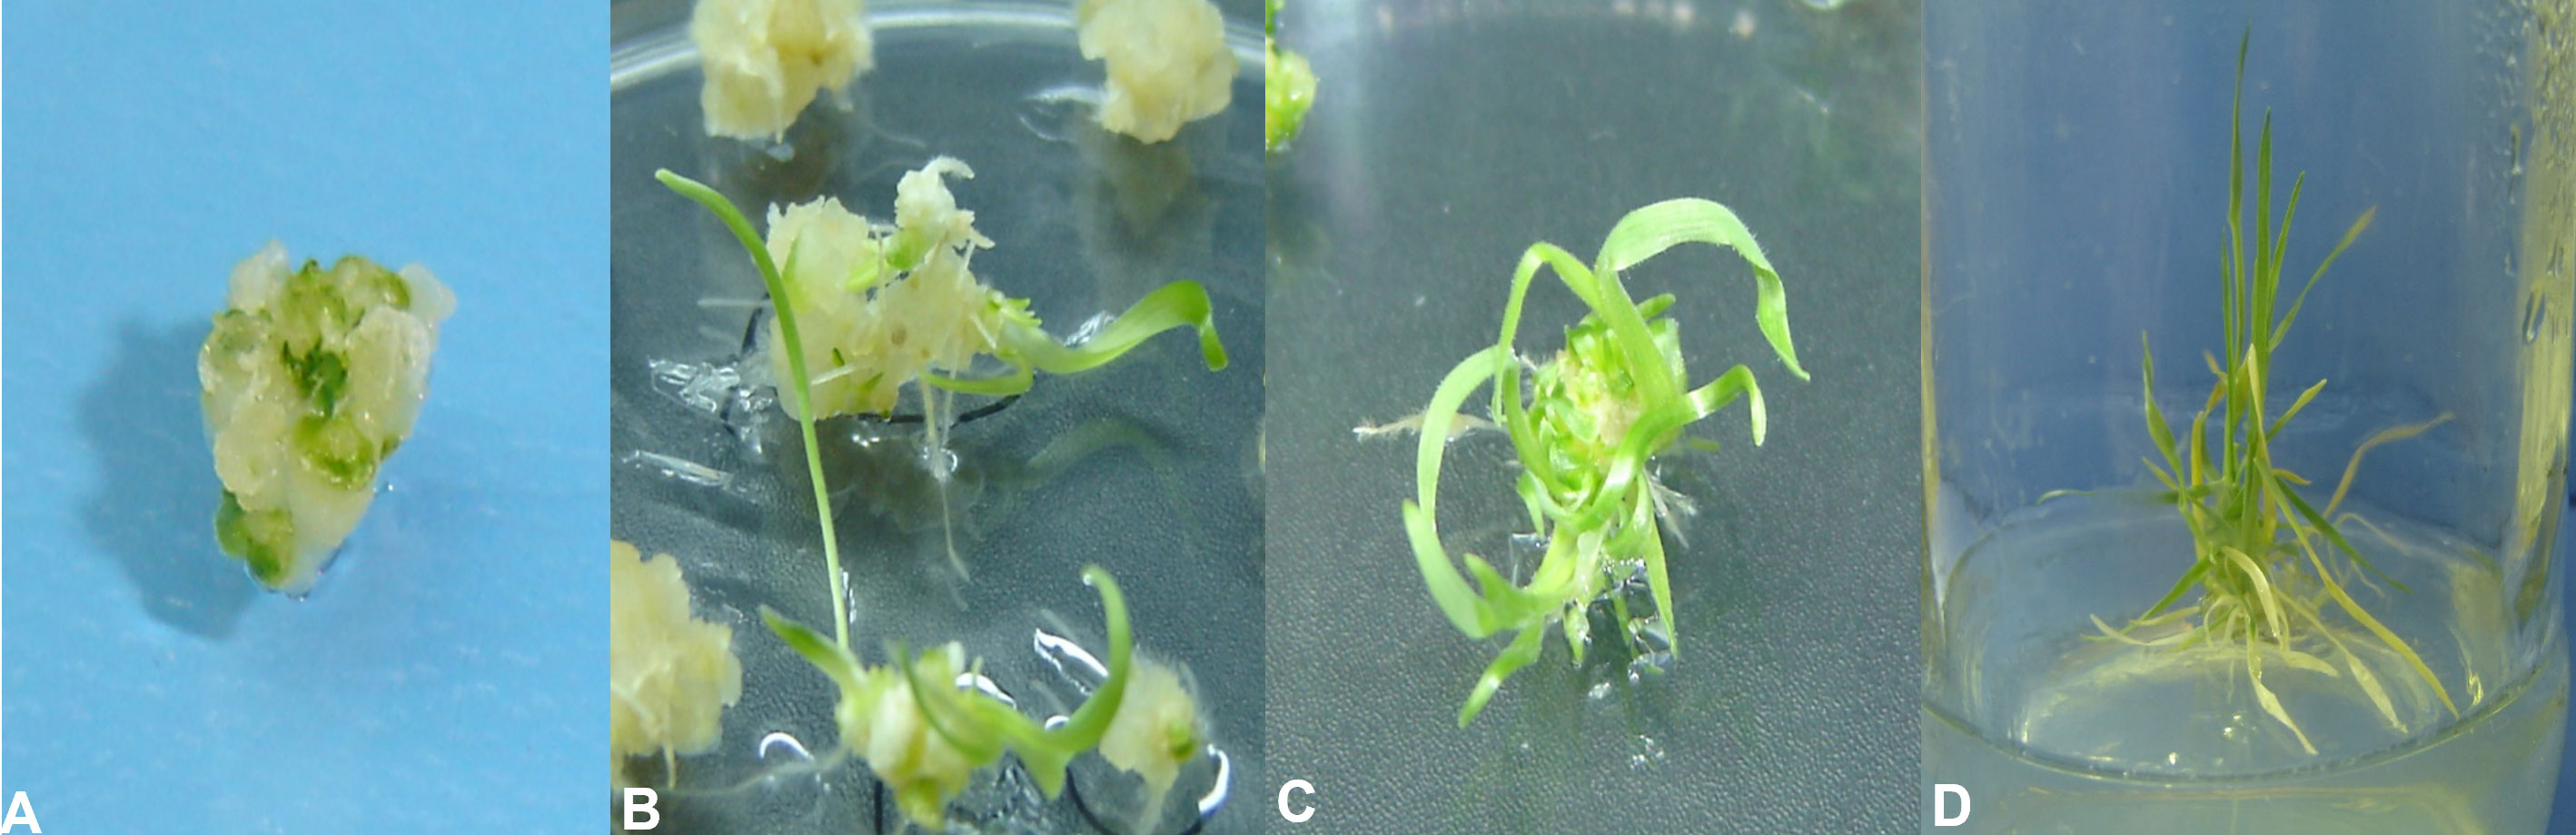
Figure 2 Stages of wheat tissue culturing and transformation. (A) Embryogenic callus. (B) Initiation of regeneration from embryogenic calli at IK4 regeneration media. (C) Profuse regeneration at the IK4 regeneration media. (D) Transfer of regenerated plantlets at the root induction media.
Antibiotic leaf pasting and leaf dip assay
Transgenic wheat plantlets surviving on the antibiotic selection medium were subjected to antibiotic leaf dip and leaf pasting assays. In the T1 generation of six transgenic wheat plants, their leaves stayed green in color 2 weeks after the application of 200 mg L−1 of hygromycin on leaf tissues. However, non-transgenic Wt showed tissue necrosis at the abovementioned dose of antibiotics. Necrotic lesions turned brown in color and became prominent in Wt plants (Figure 3A). The leaves of surviving plants were further verified by using the antibiotic leaf dip assay of both transgenic and non-transgenic plants in 200 mg L−1 of hygromycin solution. The leaves of transgenic wheat plants demonstrated less electrolyte leakage than the leaves of Wt control (Figure 3B). The seeds of the T1 generation were grown on MS medium supplemented with 200 mg L−1 of hygromycin and 200 mM of NaCl to induce salt stress in transgenic and non-transgenic wheat (Figure 4).
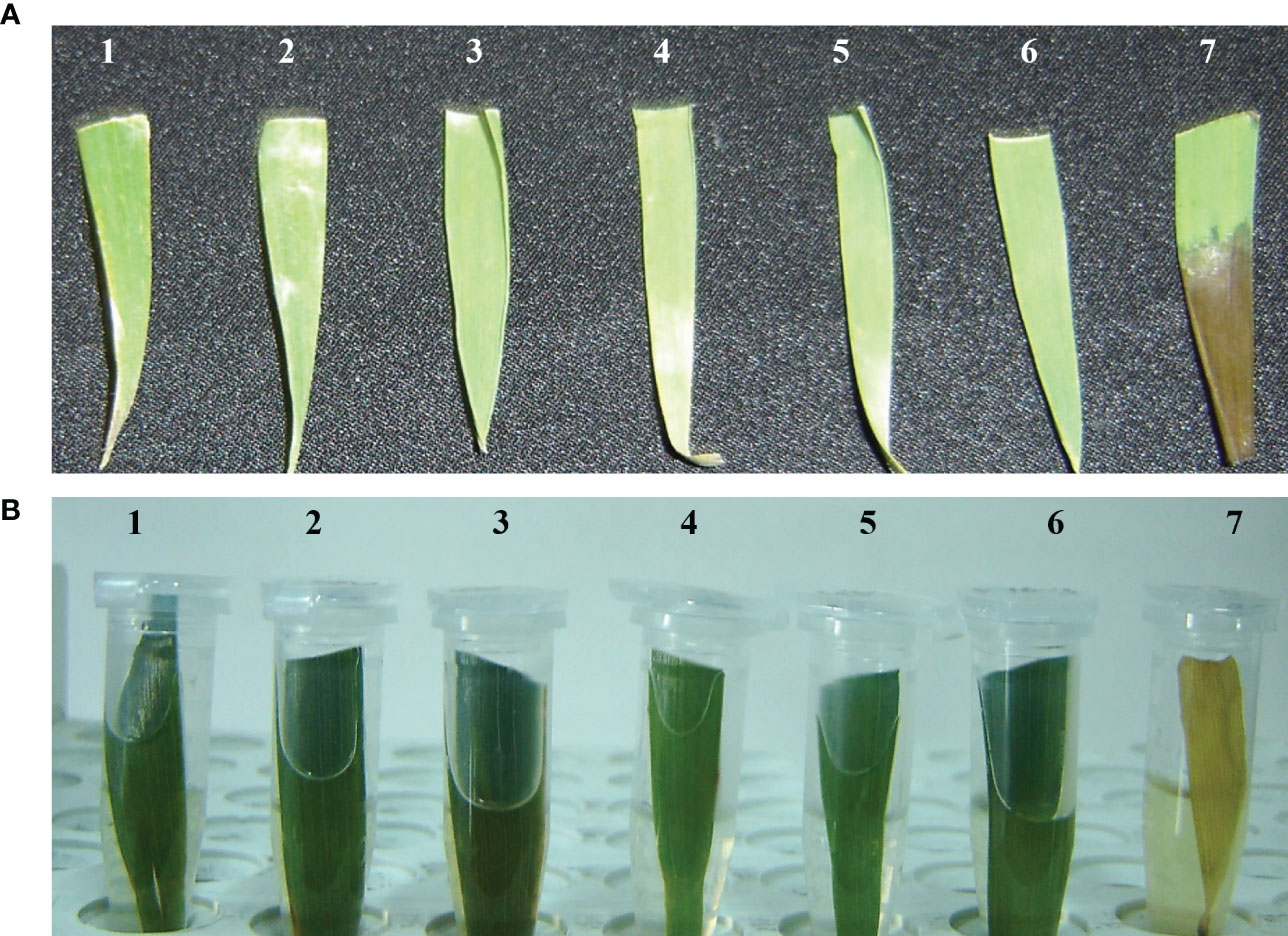
Figure 3 Antibiotic susceptibility assessment test comparing transformed wheat plants expressing AtCIPK16 and non-transgenic wheat plants. (A) Leaf paint assay was performed by using 200 mg L−1 of hygromycin antibiotic selection; 1-6 are putative transgenic wheat plants, while 7 is a non-transgenic wheat plant. (B) Detached leaf dip assessment test of putative transgenic and non-transgenic wheat plants by applying 200 mg L−1 of hygromycin as antibiotic selection. Samples 1-6 are putative transgenic wheat plants, while 7 is a non-transgenic wheat plant.
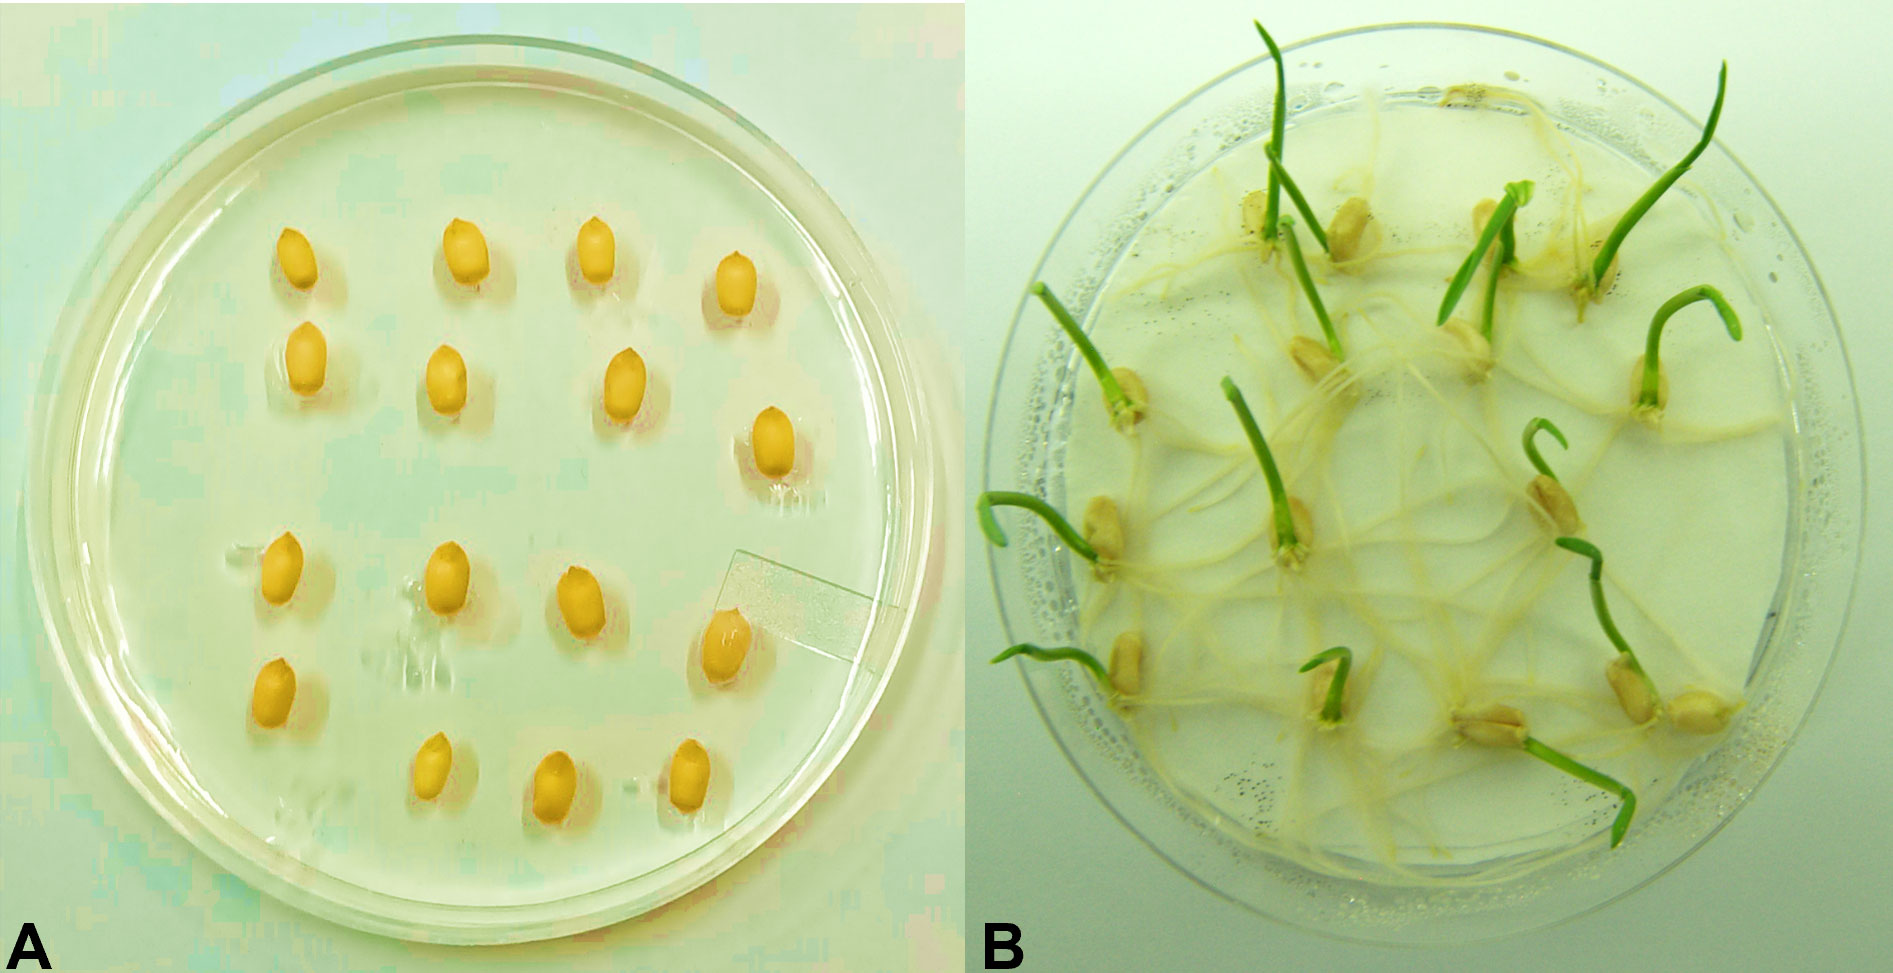
Figure 4 Germination assessment test. Wheat seeds of the T1 generation were grown on one-half strength MS media supplemented with 200 mM of NaCl and 200 mg L−1 of hygromycin antibiotic. (A) Non-transgenic (Faisalabad-2008) wheat plant. (B) Putative transgenic wheat plants expressing AtCIPK16.
Confirmation of AtCIPK16 transgenic wheat by PCR and RT-PCR
Hexaploid wheat cv. Faisalabad-2008 was transformed with the two constructs containing the AtCIPK16 gene. Successful integration of these gene constructs in wheat plants was confirmed by PCR using gene-specific and promoter-specific (UBI1 and 2XCaMV35S) primers. PCR amplification of the AtCIPK16 gene validated the integration of the transgene in six transgenic wheat lines which were selected earlier on antibiotic selection medium (Figures S3, S4). The relative expression of the AtCIPK16 gene was performed in transgenic wheat lines by RT-PCR grown at 100 mM of NaCl, using Wt as negative control. The AtCIPK16 transcript level was normalized by the actin gene. No increase in transcription level was observed in Wt plants of Faisalabad-2008. However, a significant increase was observed in the transcript level of the AtCIPK16 gene in overexpressing wheat lines, i.e., OE1, OE2, OE3, OE5, OE6, and OE7 (Figure 5). The transgenic lines OE1, OE2, and OE3 showed 18×, 30×, and 15× higher expression, respectively, while the OE5, OE6, and OE7 lines showed 7×, 5.5×, and 6.2× in transcript level as compared with the wild-type control.
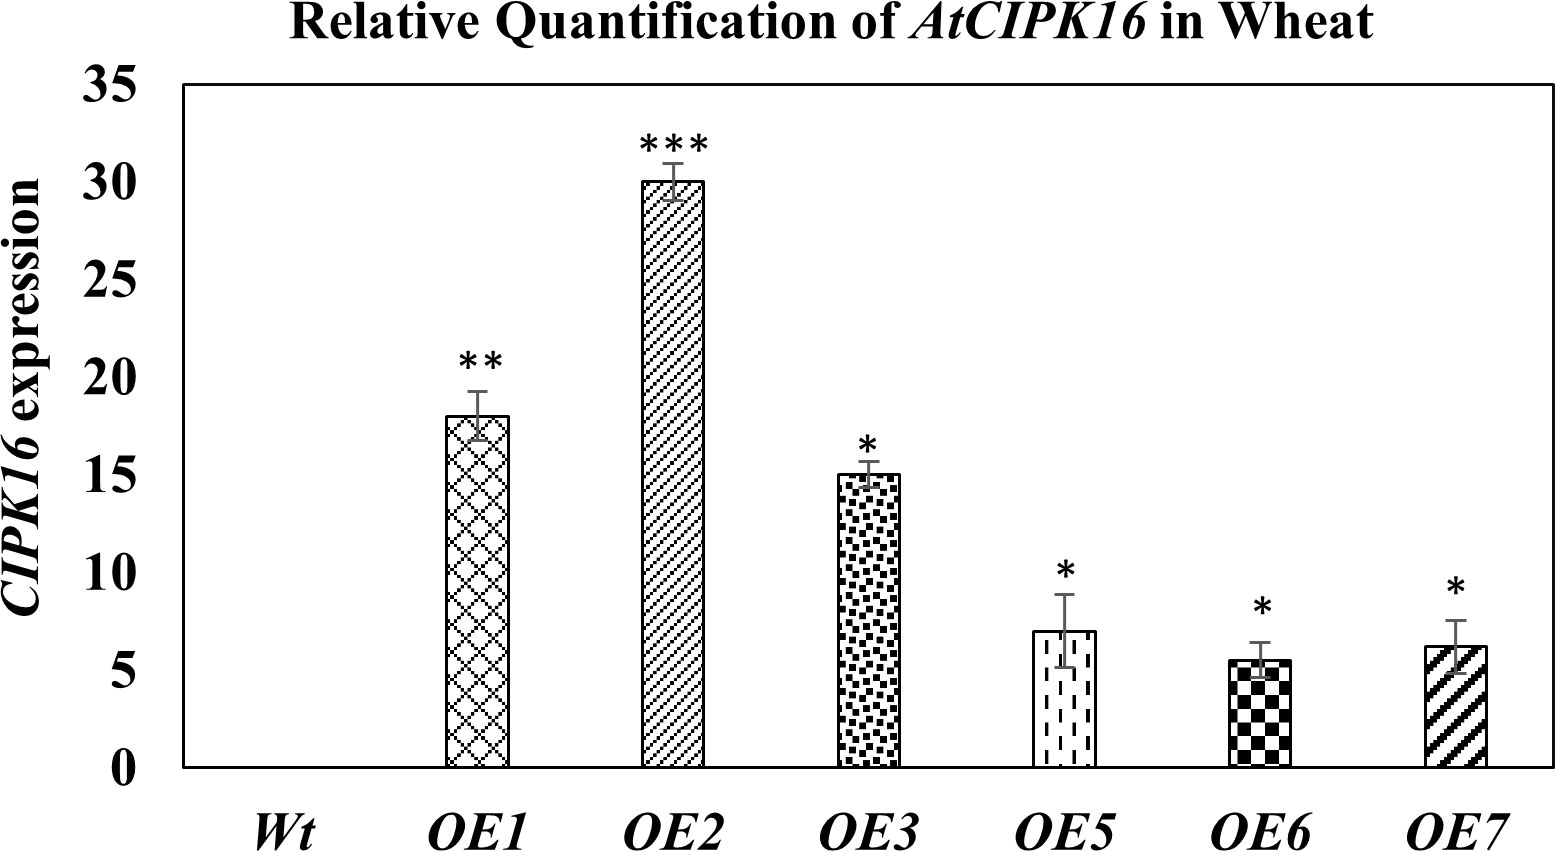
Figure 5 Expression analysis of the AtCIPK16 gene in transformed wheat lines and wild-type control at 100 mM of NaCl concentration. AtCIPK16 overexpressed lines showed a significant increase in expression profile in folds as compared to the control cultivar (Faisalabad-2008). Multiple comparison tests were performed to ascertain the significant difference between means at the significant level of P ≤0.05 (*), based on Student’s t-test, and represented as mean ± standard error (SE). The data presented are the means of four replicates.
Assessment of transgenic wheat plants for salinity tolerance
To determine the salinity tolerance level, Wt and wheat lines transformed with construct 1 and construct 2 were exposed to four NaCl treatments, i.e., 0, 50, 100, and 200 mM, under optimum growth conditions. Normal growth was observed in Wt and transgenic wheat lines at 0 mM of NaCl treatment. However, with the gradual increase in NaCl concentration, a significant reduction in plant growth/plant height and plant vigor was observed in both Wt and transgenic wheat lines (Figure 6). Interestingly, at 50 and 100 mM, the transgenic wheat plants produced more fertile tillers as compared with Wt. Additionally, at 200 mM of salt stress, Wt plants started dying. However, transgenic wheat lines survived upon exposure to 200 mM of NaCl treatment but produced some abortive tillers as well.
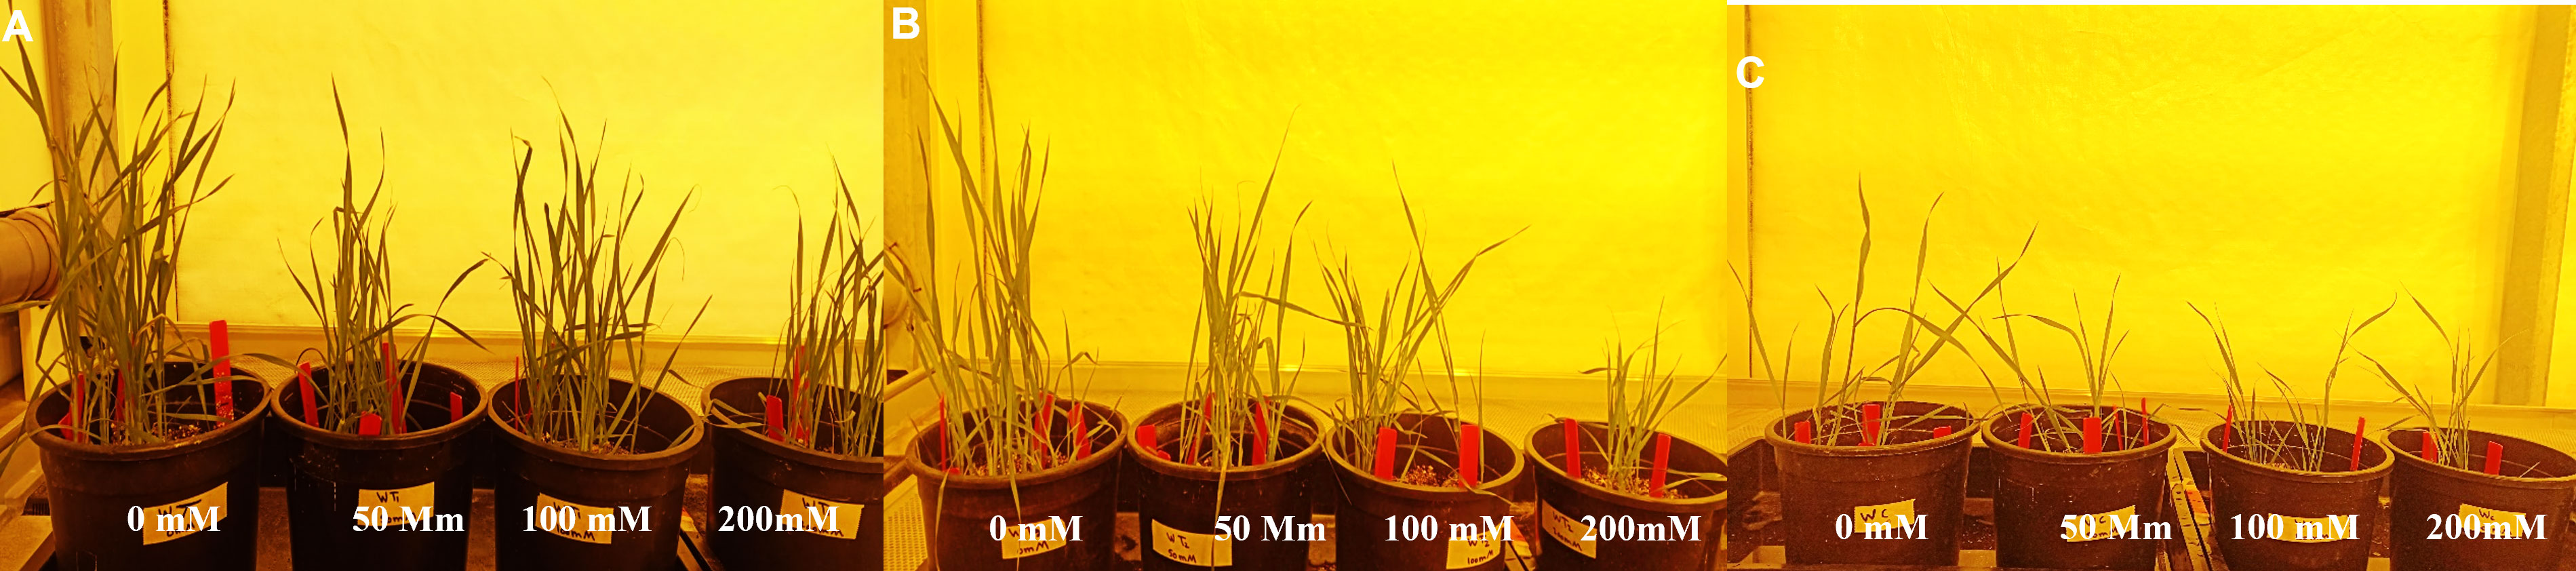
Figure 6 Assessment of transgenic wheat plants at 0, 50, 100, and 200 mM of NaCl concentrations. (A) Putative transgenic plants expressing gene cassette construct 1 (pTOOL37 + UBI1 + AtCIPK16) at different NaCl stress levels. (B) Putative transgenic plants expressing gene cassette construct 2 (pMDC32 + 2XCaMV35S + AtCIPK16) at different NaCl stress levels. (C) Seeds of wild type (Wt) (Faisalabad-2008) under different NaCl stress levels. Data were collected every week (2–4 weeks) to examine the germination rate and morphological parameters of plants under stress condition.
NaCl-induced ion flux measurement in the root tissues of transgenic wheat
MIFE was used to determine NaCl-induced ion flux in root tissues of transgenic and Wt wheat (Triticum aestivum L.) plants. Under the saline condition, the excess NaCl was absorbed by the roots of the wheat plant, so the plasma membrane starts removing K+ ions from the cell to maintain cellular homeostasis at the beginning of salt stress. So, there was a need to establish a cellular mechanism which can help to retain K+ ions inside the cell to sustain normal cellular activity.
K+ ion fluxes along the length of the wheat root showed a variable pattern; in the mature zone of the wheat root, K+ ion fluxes were lower as compared with those in the elongation zone and root tip. When the microelectrode was positioned away from the elongation zone, a reduction in potassium efflux was observed. A sharp peak was observed in the elongation zone of the root that described a higher K+ ion efflux. Fluxes of different overexpressed wheat lines (OE1, OE2, OE5, OE7) were compared in the mature root zone, where the variability of ion fluxes is less than that in the elongation zone ((Wang et al., 2018). Four transgenic lines were selected based on their expression profile and level of salinity tolerance for MIFE analysis. The transgenic wheat lines OE1 and OE2 (overexpressing AtCIPK16 under UBI1) and OE5 and OE7 (overexpressing AtCIPK16 under 2XCaMV35S) were selected to measure NaCl-induced ion flux in the root zone as compared with wild type. Five-day-old seedlings of these four OE lines (OE1, OE2, OE5, OE7) and Wt were exposed to 1 ml of 100 mM of NaCl to measure K+ ion flux (before and after NaCl application) in the root zone by using the MIFE protocol. K+ ion flux could be measured 10 mm away from the root tip because fluxes were higher there, and it could be used as a screening tool to measure salinity tolerance in a dose- and time-dependent manner of NaCl, for example, 100 mM of NaCl treatment for 30 min.
In the present study, it was observed that 10 min after adding NaCl, the OE1 and OE2 transgenic lines showed a significant decrease in K+ ion efflux, indicating an increase in K+ ion influx as compared with Wt; similarly, OE5 and OE7 have shown higher K+ ion influx as compared with the fluxes recorded in Wt in response to 100 mM of NaCl stress (Figure 8). However, relatively more K+ ion influx was observed in the OE1 and OE2 lines as compared with that in the OE5 and OE7 lines (Figures 9, 10). Among all AtCIPK16 overexpressing wheat lines, the OE2 line exhibited significantly higher and stable K+ ion retention in root tissues and demonstrated higher tolerance to salt stress (Figure 9). Finally, K+ ion efflux gradually recovered in the next 35 min, and a decrease in K+ ion efflux was recorded and an increase in K+ ion influx was observed in the flux profile of transgenic lines.
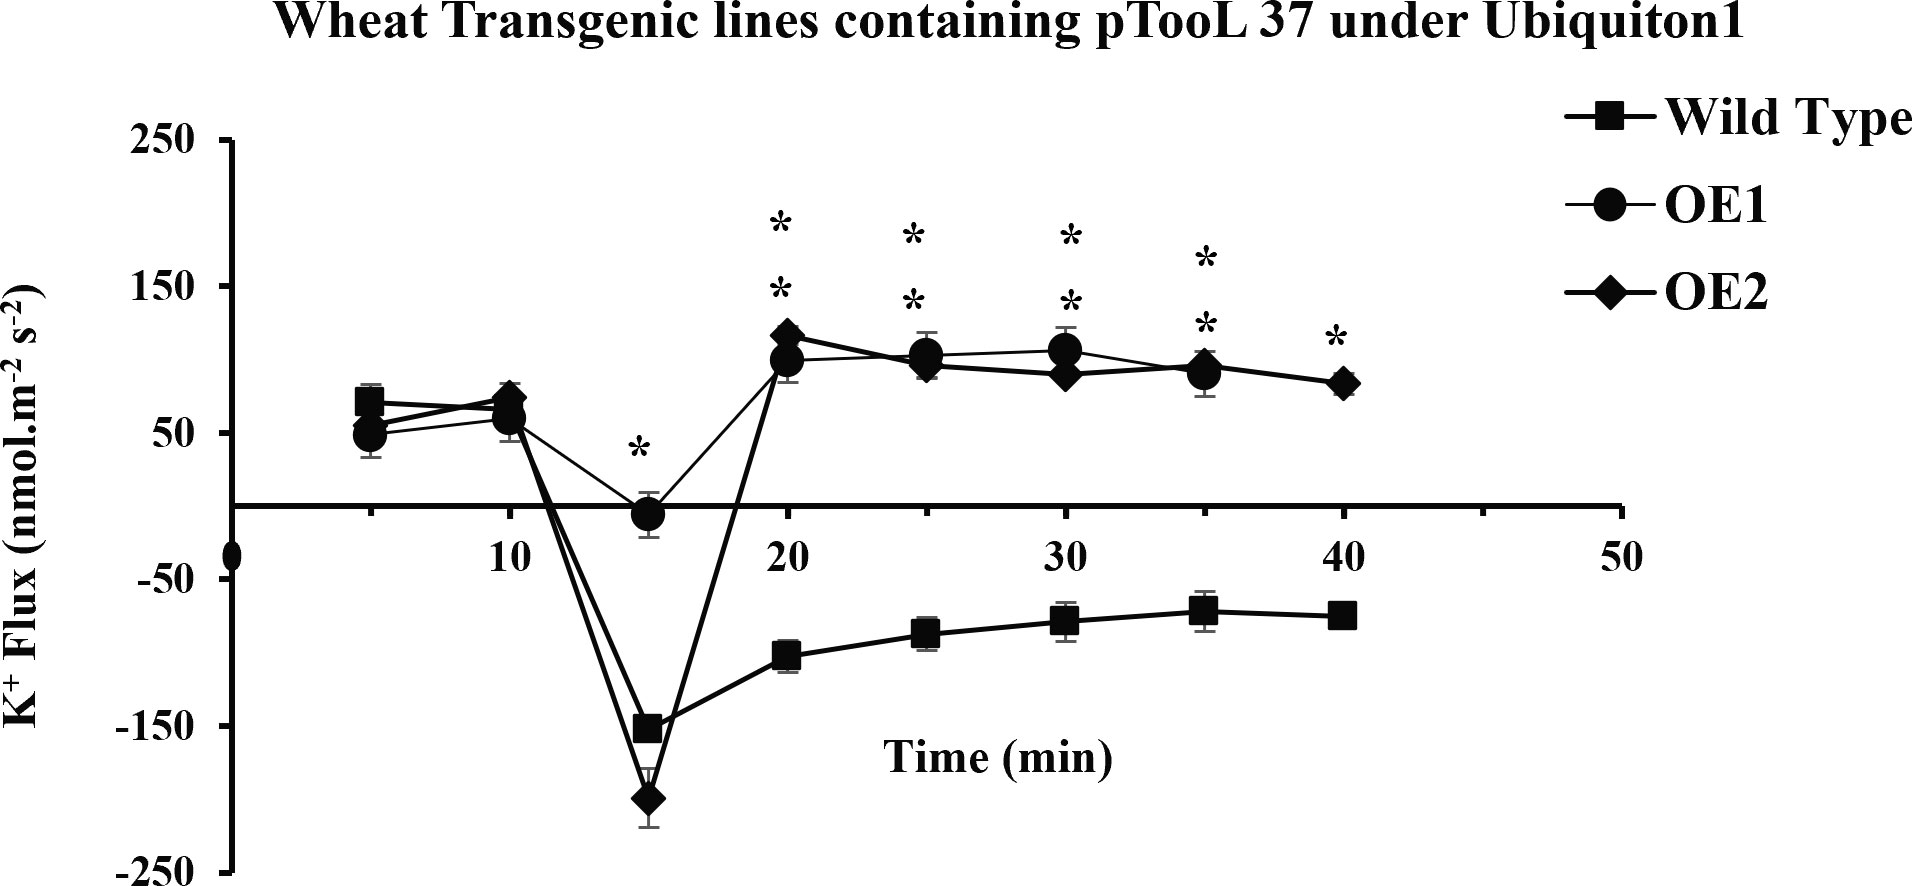
Figure 7 Transient K+ flux responses under the Ubiquitin 1 promoter. K+ flux profile of 5-day-old wheat seedlings along the root axis. The net K+ flux of OE1, OE2 (pTOOL37 + UBI1 + AtCIPK16), and wild-type wheat cultivar Faisalabad-2008 was measured along the root axis with time and distance (10 mm away from the root tip) before and after 100 mM of NaCl treatment. Average K+ retention ability was found to increase in transgenic lines. Student’s t-test was employed for the significant difference between means at the significant level of *P<0.05 and represented as mean ± standard error (SE). (*) indicates significance; all the rest are non-significant.
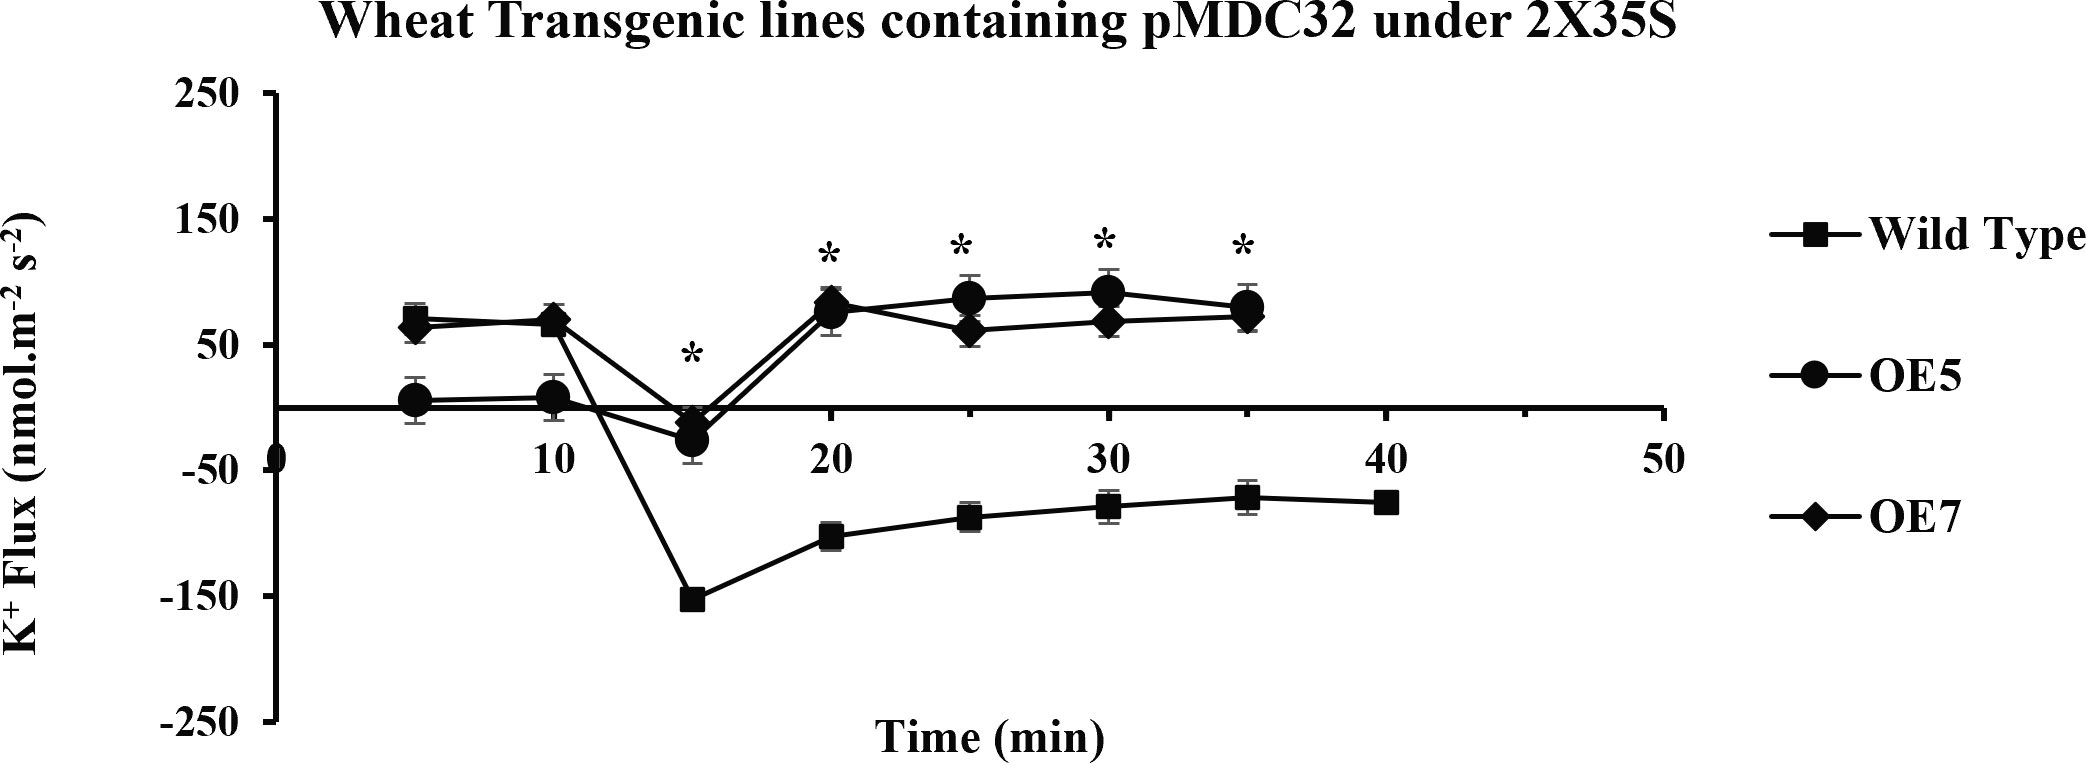
Figure 8 Transient K+ flux responses under the 2XCaMV35S promoter. Flux was measured from the OE5, OE7 (pMDC32 + 2XCaMV35S + AtCIPK16), and wild type before and after 100 mM of NaCl addition, in the mature zone 10 mm away from the root tip. In transgenic wheat lines, a significant increase in K+ influx (retention) was found as compared to that in the wild-type (Wt) wheat cultivar. Student’s t-tests were conducted to evaluate the results and ascertain the significant difference between means at the significant level of *P<0.05 and represented as mean ± standard error (SE).
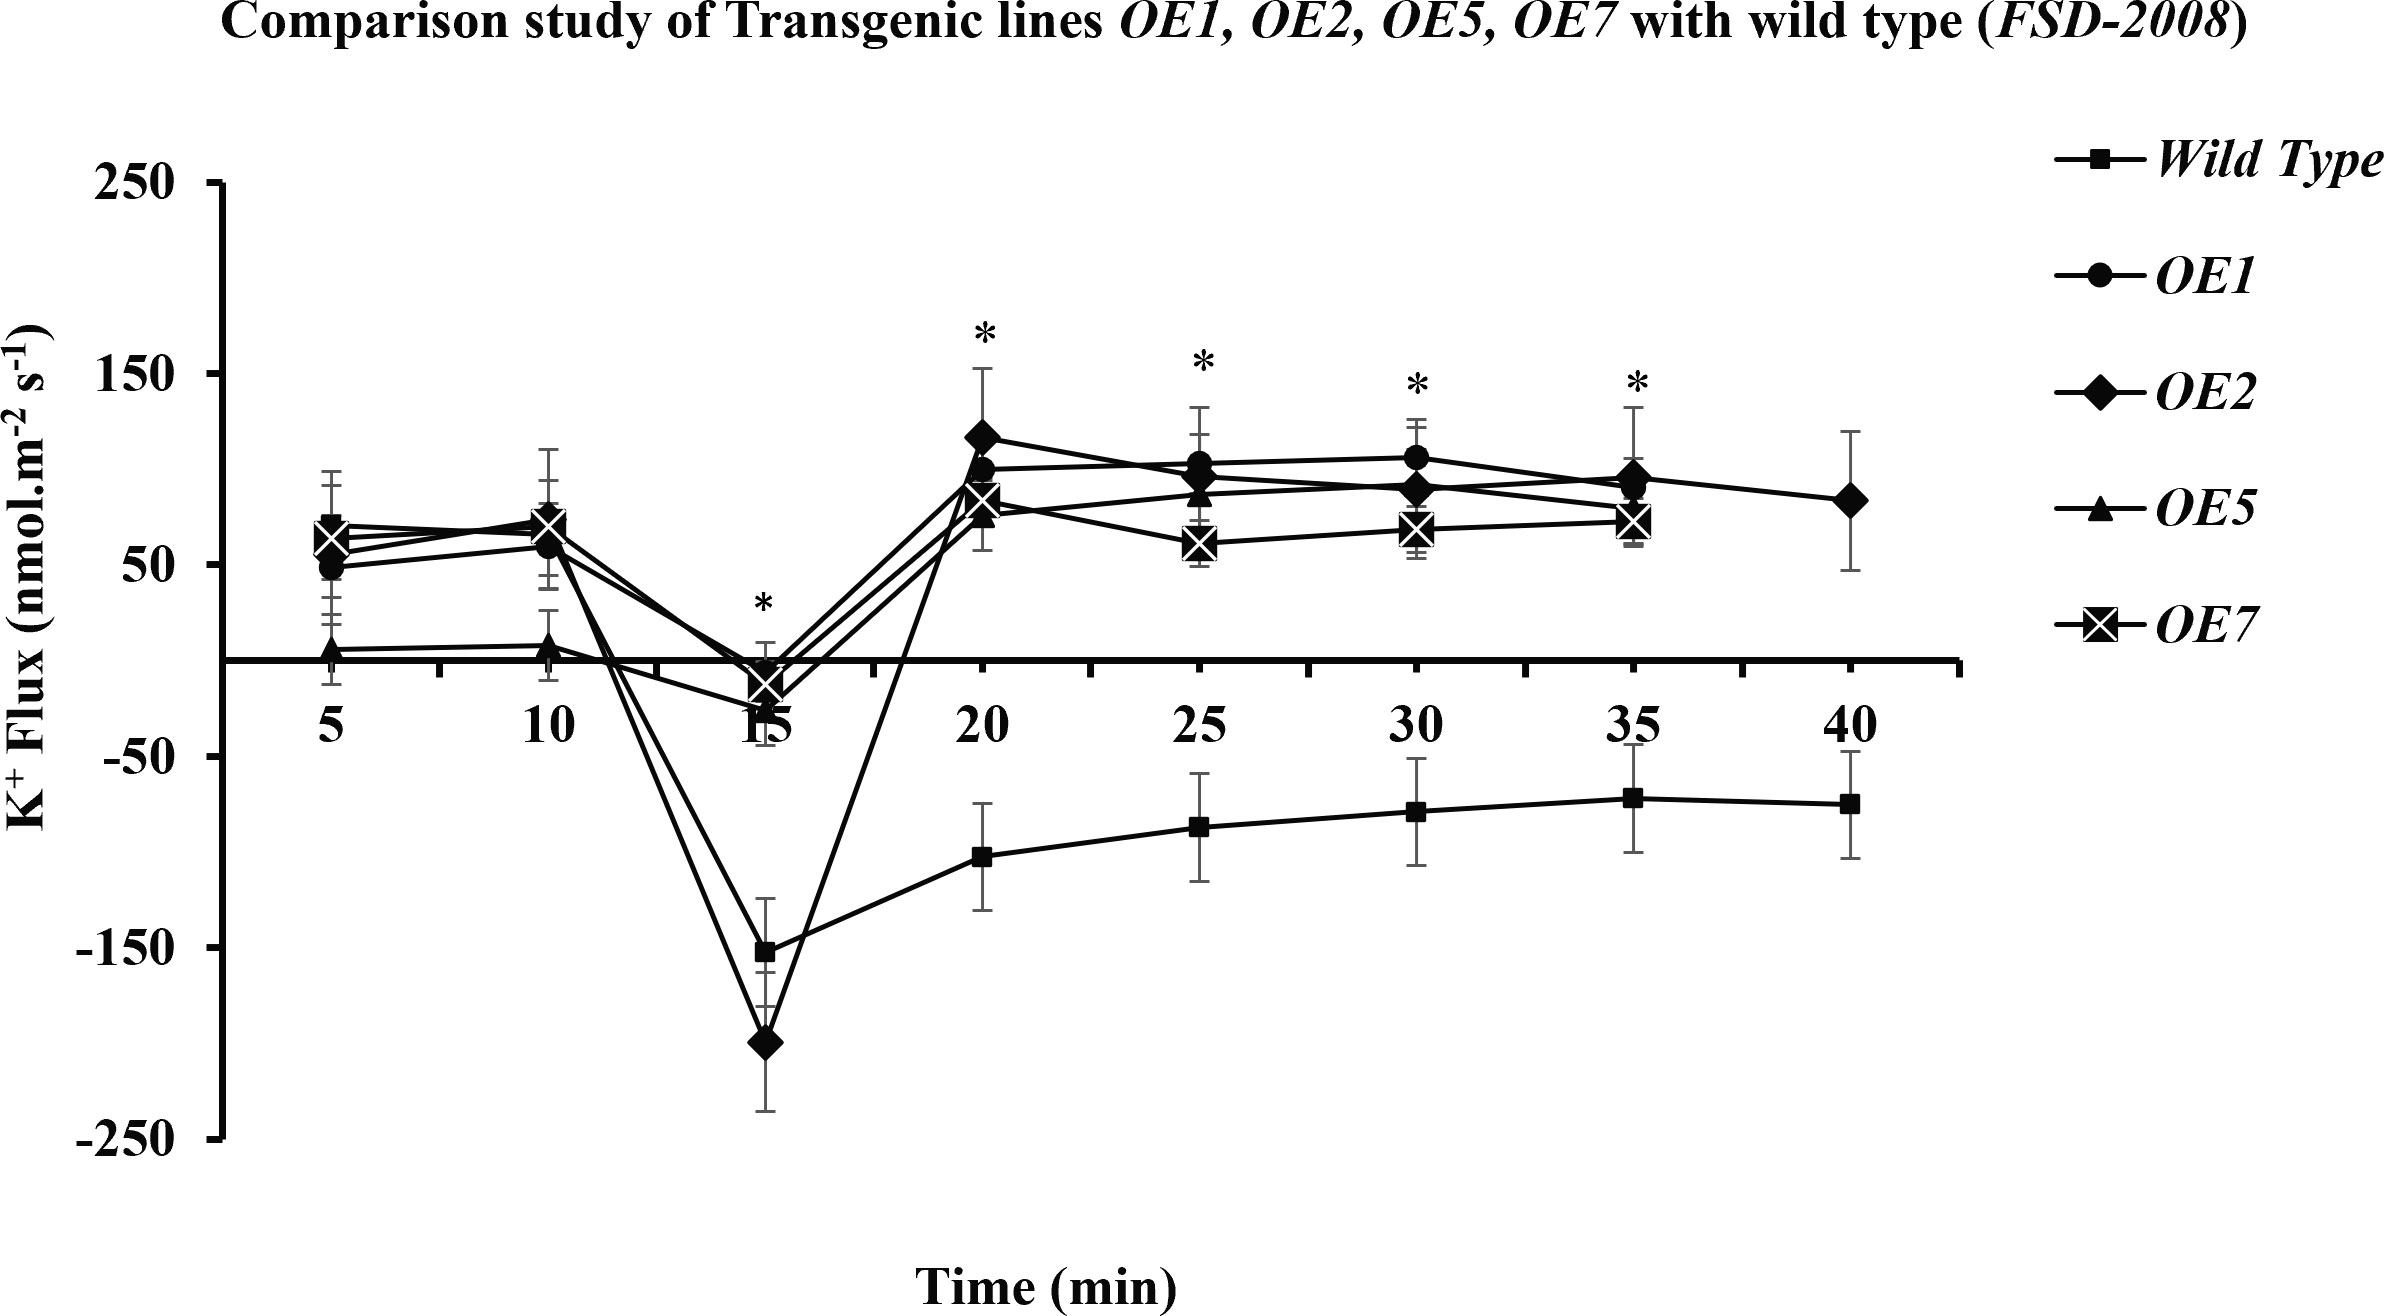
Figure 9 Comparative study of K+ retention in different overexpressed lines and wild type. The performance of transgenic lines under 100 mM of NaCl stress is better in comparison with that of the wild type (Wt) (Fsd-2008), respectively. Among the transgenic wheat lines, OE2 is performing better than the OE1, OE5, and OE7 transgenic lines. Student’s t-tests were conducted to evaluate the results and ascertain the significant difference between means at the significant level of *P<0.05 and represented as mean ± standard error (SE).
Variation in NaCl-induced K+ flux in transgenic wheat lines
Results have shown that there is a significant difference between the flux profiles of overexpressed and Wt wheat lines. Overexpressing wheat lines exhibited a change in flux profile by a significant increase in K+ ion influx (a decrease in K+ ion efflux) after 10-25 min of salt exposure. K+ ion efflux of different magnitudes was measured upon salt exposure in each wheat line. A transient peak showing an increase in K+ ion efflux (for 10 min) was observed in response to NaCl application. Six overexpressed wheat lines showed a significant difference in steady-state potassium ion flux profiles after the transient potassium ion efflux peak lasted for 10-20 min. In overexpressed wheat lines, a steady and stable K+ ion influx was observed after 20-25 min of salt exposure. A non-significant K+ ion efflux was observed in most of the wheat transgenic lines as compared with the Wt (a significant K+ ion efflux was observed) immediately after exposure to salt stress. In OE1 (90.2519 nmol m−2 s−1), OE2 (95.78772 nmol m−2 s−1), OE5 (79.50103 nmol m−2 s−1), and OE7 (72.67819 nmol m−2 s−1), a steady-state K+ ion influx was recorded compared with that in the Wt (−71.7871 nmol m−2 s−1) at the same time interval (at 35 min). Wt K+ ion flux still shows an efflux of potassium, and no K+ ion influx was observed at any point in the flux profile under salt stress. A significant (P ≤ 0.05*) positive correlation was observed between AtCIPK16-induced K+ retention and overall salinity tolerance in transgenic wheat lines.
Discussion
Abiotic stresses can provoke a series of plant responses. Among them, salt stress is considered to have the most adverse effects, affecting ultrastructural cell components and cell metabolism and altering membranous structures and plant physiology. Salts can also cause an ionic imbalance in the cell resulting in ionic toxicity. Specific effects of salt stress on plant metabolism, especially leaf senescence, are associated with the accumulation of toxic Na+ and Cl− ions and the depletion of K+ and Ca2+ ions (Arif et al., 2020; El Sabagh et al., 2021).
Most of the earlier efforts had been made to develop salt tolerance in plants and to investigate the mechanism involved in the exclusion of Na+ ions from plants to prevent its transport into the shoot or excessive accumulation in the vacuole. Later, many studies demonstrated no relationship between leaf Na+ ion content and salinity tolerance in wheat. So, Na+ ion exclusion did not prove to be the single factor associated with salt tolerance in wheat plants. However, Na+ ion exclusion and K+ ion retention in the root cells may be considered a more reliable strategy for imparting salinity tolerance in wheat as was observed in barley (Wu et al., 2013). Previously, different salinity-tolerant mechanisms at the physiological and molecular levels had been studied extensively. The aim of our present study was to explore research advances with the transgenic approach and genetic biotechnology (Ibrahimova et al., 2021).
In the present study, a locally adapted wheat cultivar was transformed with the AtCIPK16 gene and evaluated for its salinity tolerance, as it has been reported that AtCIPK16 has no homolog or ortholog in wheat (T. aestivum) and barley (H. vulgare) (Amarasinghe et al., 2016). Approximately 1.7% transformation efficiency (TE) was recorded in transgenic wheat using the AGL-1 strain of A. tumefaciens. Although many factors are usually involved in the effective delivery of transgene, the AGL-1 strain of A. tumefaciens was especially employed for its simplicity, rapidity, and well-known hypervirulence in monocot for enhanced transformation efficiency (Li et al., 2021). Previously, Raja et al. (2009) also reported an 8% transformation efficiency by using calli originating from immature wheat embryos in the same cultivar Faisalabad-2008. Khan et al. (2015) obtained 5% TE through AGL-I by infecting wheat calli. Similarly, Wei et al. (2017) reported 3.70%-5.90% TE by using AGL-I for the transformation of the TaPIMP2 gene under constitutive promoter in wheat crops. Recently, Wu et al. (2018) obtained 0.60-9.70 transformation efficiency by using the same strain of A. tumefaciens in wheat.
Furthermore, the expression analysis of the AtCIPK16 gene under the UBI1 and 2XCaMV35S promoters revealed significantly higher gene expression in all transgenic wheat lines at 100 mM of NaCl treatment as compared with the Wt (Figure 5). The higher transcript level of transformed wheat lines represented presumably efficient Na+ ion sequestration into the root vacuoles, restricting the transport of Na+ ions into the shoot and leaf tissues. Moreover, the transcripts of the AtCIPK16 gene under the UBI1 promoter in transgenic wheat lines exhibited a significantly higher level than the transgenic lines expressing the same gene under the 2XCaMV35S promoter. Annum et al. (2022) reported the expression of the AtPLC5 gene at a significantly higher level when expressed under the UBQ10 promoter upon exposure to heat stress in transgenic wheat. Tao et al. (2015) found that the UBI1 promoter was significantly active in monocotyledonous plants, especially in cereals (wheat, rice, maize, and barley), and it brought a higher transgene expression level. However, the CaMV35S promoter was found to constitutively enhance gene expression in dicots (chickpea, soybean, etc.), but its activity was reduced in monocots (wheat, rice) (Li et al., 2021). In the current study, it was observed that the expression of the AtCIPK16 gene under the UBI1 promoter enabled transformed wheat lines to tolerate salinity stress quite effectively. Transgenic wheat lines, i.e., OE1 and OE2 expressing AtCIPK16 under the UBI1 promoter, were performing better as compared with the OE5 and OE7 lines expressing AtCIPK16 under the 2XcaMV35S promoter (Figure 10). However, overexpressing AtCIPK16 transgenic wheat lines showed significantly better growth performance under 100 mM of salinity stress level as compared with the Wt (non-transgenes), presumably due to better K+ ion retention. To validate this hypothesis, Na+/K+ ion fluxes were determined using MIFE.
The MIFE technique has offered a significant conceptual development as well as advancement to understand the adaptive responses and cellular membrane transport processes of plants, fungi, bacteria, animal cells, and biofilms related to different environmental stress conditions (Shabala et al., 2012; Buchroithner et al., 2021). Newman (2001), an Australian scientist, invented this technique in 2001 by using ion-selective microelectrodes to determine the non-invasive measurement of ion fluxes (Figure S5). This technique was also previously used to study the regulation of ion transport and cyclic nucleotide-mediated transport via the root plasma membrane in A. thaliana (Ordoñez et al., 2013). It was also reported to be specifically used in wheat plants to determine the K+ ion retention ability in plant leaf mesophyll tissues as mandatory components involved in the plant salinity tolerance mechanism (Wu et al., 2015). Salinity tolerance enhanced by cytosolic K+ retention in maize roots possessed by the fungus Piriformospora indica was also assessed by MIFE (Yun et al., 2018). Wang et al. also found a major QTL responsible for the overall salinity tolerance in cereals (wheat and barley) by using the MIFE technique (Wang et al., 2019). Therefore, in the recent study, the MIFE technique was employed to determine the K+/Na+ ion fluxes. It was observed that selected transgenic lines used in this study and Wt exhibited different flux proportions when exposed to salinity stress of 100 mM of NaCl and showed a significant difference in net K+ ion fluxes/retention. Initially, NaCl induced transient potassium (K+ ions) efflux upon the addition of 100 mM of NaCl in the root epidermal cells due to excessive salt availability in the rhizospheric region, and then a transient peak of K+ ion efflux gradually shifted to the K+ ion influx (K+ retention) (Figures 7–9). Similarly, K+ ion efflux was also observed in wheat and barley plants upon the start of salt stress signaling (Wang et al., 2018). Therefore, the flux profile of the overexpressed lines OE1 and OE2 showed significantly higher K+ ion influx and Na+ ion efflux from the plasma membrane than that of the lines OE5 and OE7 and Wt upon exposure to 100 mM of NaCl. Zarza et al. (2019) performed a biochemical analysis of PIP2-mediated signaling involved in the K+ ion flux of plants by using MIFE in A. thaliana.
K+ is the essential ion required for most of the plant processes and metabolic pathways. Potassium ion fluxes across the plasma membrane are controlled and channeled by fine-tuned ion channels (outward rectifying K+ channels). Thus, maintaining the intracellular K+ ion level is essentially required, especially in the challenging condition of salt stress for plant survival. Low potassium homeostasis causes K+ ion stress which initiated the Ca2+ ion signaling pathway by the activation of CIPKs, i.e., AtCIPK16 interacts with the K+ ion channels (AKT1) that maintain the cytosolic Na+/K+ ion ratio by regulating salt exclusion from the root and shoot tissues under salinity stress to confer salinity tolerance upon overexpression in A. thaliana and barley plants. The AtCIPK16 gene is positively involved in salinity tolerance in A. thaliana (Van Kleeff et al., 2018). Similarly, Zhao et al. (2009) reported the involvement of ZmCIPK16 in high salinity, drought tolerance, and ABA signaling in Zea mays. Conversely, CIPK3, CIPK9, CIPK23, and CIPK26 were reported to interact with CBL 2/3 to maintain K+ homeostasis in Arabidopsis (Tong et al., 2021). However, the CBL–CIPK complex also takes part in the regulation of Mg+2, Na+, and ions (Verma et al., 2021). Xiaolin et al. (2022) proposed the involvement of CqCIPK-CBL genes in quinoa for improving salinity, cold, and drought tolerance in transgenic and molecular breeding, indicating functional diversity and regulation at the transcriptional level in multiple ways. Similar results were described by Ma et al. (2020) in apple (Malus domestica) where MdCIPK13 was reported to regulate the downstream phosphorylation of the MdSUT2.2 gene to enhance salinity tolerance (Ma et al., 2020). AtCIPK23 interacts with AtCBL1 and AtCBL9 followed by downstream phosphorylation that activated AKT1 (Arabidopsis potassium transporter 1) to maintain potassium homeostasis in the root cells of rice species (Mao et al., 2022). CDPK13 (calcium-dependent protein kinase 13) had shown a specific role to establish phosphorylation of the guard cell and potassium influx channels, resulting in inward rectification of K+ ion channels (KAT1 and KAT2) for the retention of K+ ions in A. thaliana (Van Kleeff et al., 2018). SOS3 (CBL4) is a calcium sensor that receives the sodium-induced rise in cytosolic calcium and interacts with SOS2 (CIPK24) to regulate the downstream mechanisms, i.e., phosphorylation, which in turn activates the SOS1 in the plasma membrane to exclude Na+ ions from the root cells (Shen et al., 2020). Additionally, Khan et al. (2020) and Wang et al. (2022) proposed the exclusion of Na+ ions out of the plasma membrane or Na+ sequestration into the vacuole and activation of the antioxidant defense system in plant cells for the generation of salt tolerance. K+ ion retention in the cytosol was shown to be essentially required for the enhancement of plant performance under salinity stress (Wang et al., 2018). A positive association between K+ ion retention and salinity tolerance was reported in many plant species like wheat, tomato, soybean, and barley. K+ ion retention in the plant mesophyll and root tissues was found to be the most important contributing factor in generating salt tolerance (Wang et al., 2019; Khan et al., 2020).
The current study concludes that CIPKs are found to be the key regulators determining pre-transcriptional and post-transcriptional responses to salinity, drought, heat, and cold stresses, and their signaling took part through the membrane system. Published reports have shown the role of the CIPK family in salinity tolerance, but it had not been fully exploited yet, thus strongly suggesting further investigation of this gene family for other abiotic stresses (Shi et al., 2018; Ma et al., 2020). It is also concluded that K+ ion retention in the root cells of transgenic wheat lines expressing AtCIPK16 under the UBI1 and 2XCaMV35S promoters showed a high correlation with salinity tolerance in wheat plants. The results were further supported by K+ ion influx and retention which was a biochemical indicator for the development of salt-tolerant plants through conventional and transgenic approaches. The results of the present study suggest that K+ ion retention in wheat plant root cells is an essential mechanism employed by plants to develop resistance against salinity stress and survival under harsh conditions. Therefore, in addition to emphasizing Na+ ion exclusion from the leaf tissues, K+ ion retention in the root cells of a plant must be considered while devising a strategy to generate salt tolerance in crop plants.
Data availability statement
The original contributions presented in the study are included in the article/Supplementary Material. Further inquiries can be directed to the corresponding author.
Author contributions
NAS and MA conceived and planned the experiments. KI designed and conducted the research experiments. MT provided the constructs used in this study. KI and NA evaluated the data on statistical grounds. KI wrote the initial draft. MA and NA reviewed the data and prepared the initial draft of the manuscript. MT and NAS reviewed and edited the manuscript. All authors contributed to the article and approved the submitted version.
Funding
This work was supported by the Center for Desert Agriculture, King Abdullah University of Science and Technology (KAUST), Saudi Arabia, under a collaborative research project (ORS # 2375), and the International Research Support Initiative Program (IRSIP) fellowship to Khadija Imtiaz, Ph.D. scholar, funded by the Higher Education Commission (HEC), Government of Pakistan [IRSIP Fellowship No. (PIN) IRSIP 40, BMS 43].
Acknowledgments
The authors would like to thank Dr. Theo Elzenga and Mr. Martin from The Faculty of Science and Engineering, Ecophysiology of Plant, University of Groningen, for designing the MIFE-based experiments, conducting the biochemical analysis, and providing an excellent working environment, technical guidance, and support.
Conflict of interest
The authors declare that the research was conducted in the absence of any commercial or financial relationships that could be construed as a potential conflict of interest.
Publisher’s note
All claims expressed in this article are solely those of the authors and do not necessarily represent those of their affiliated organizations, or those of the publisher, the editors and the reviewers. Any product that may be evaluated in this article, or claim that may be made by its manufacturer, is not guaranteed or endorsed by the publisher.
Supplementary material
The Supplementary Material for this article can be found online at: https://www.frontiersin.org/articles/10.3389/fpls.2023.1127311/full#supplementary-material
Abbreviations
CAT, catalase gene; CBL, calcineurin-B-like proteins; GSH, γ-glutamyl-cysteinyl-glycine; GPX, glutathione peroxidase gene; MIFE, microelectrode ion flux estimation; NADPH, nicotinamide adenine dinucleotide phosphate hydrogen; OE, overexpression; ROS, reactive oxygen species.
References
Amarasinghe, S. L., Huang, W., Watson-Haigh, N. S., Gilliham, M., Roy, S. J., Baumann, U. (2020). AtCIPK16 mediates salt stress through phytohormones and transcription factors. BioRxiv. doi: 10.1101/2020.02.17.953216
Amarasinghe, S., Watson-Haigh, N. S., Gilliham, M., Roy, S., Baumann, U. (2016). The evolutionary origin of CIPK16: A gene involved in enhanced salt tolerance. Mol. Phylogenet. Evol. 100, 135–147. doi: 10.1016/j.ympev.2016.03.031
Annum, N., Ahmed, M., Imtiaz, K., Mansoor, S., Tester, M., Saeed, N. A. (2022). 32Pi labeled transgenic wheat shows the accumulation of phosphatidylinositol 4, 5-bisphosphate and phosphatidic acid under heat and osmotic stress. Front. Plant Sci. 13. doi: 10.3389/fpls.2022.881188
Arif, Y., Singh, P., Siddiqui, H., Bajguz, A., Hayat, S. (2020). Salinity induced physiological and biochemical changes in plants: An omic approach towards salt stress tolerance. Plant Physiol. Biochem. 156, 64–77. doi: 10.1016/j.plaphy.2020.08.042
Assaha, D. V., Ueda, A., Saneoka, H., Al-Yahyai, R., Yaish, M. W. (2017). The role of na+ and k+ transporters in salt stress adaptation in glycophytes. Front. Physiol. 8, 509. doi: 10.3389/fphys.2017.00509
Batistič, O., Kudla, J. (2009). Plant calcineurin b-like proteins and their interacting protein kinases. Biochim. Biophys. Acta (BBA)-Mol. Cell Res. 1793, 985–992. doi: 10.1016/j.bbamcr.2008.10.006
Boudsocq, M., Sheen, J. (2013). CDPKs in immune and stress signaling. Trends Plant Sci. 18, 30–40. doi: 10.1016/j.tplants.2012.08.008
Buchroithner, B., Spurný, P., Mayr, S., Heitz, J., Sivun, D., Jacak, J., et al. (2021). An improved transwell design for microelectrode ion-flux measurements. Micromachines 12, 273. doi: 10.3390/mi12030273
Ding, X., Liu, B., Liu, H., Sun, X., Sun, X., Wang, W., et al. (2023). A new CIPK gene CmCIPK8 enhances salt tolerance in transgenic chrysanthemum. Sci. Hortic. 308, 111562. doi: 10.1016/j.scienta.2022.111562
Ding, X., Liu, B., Sun, X., Sun, X., Zheng, C. (2022). New functions of CIPK gene family are continue to emerging. Mol. Biol. Rep. 49 (7), 1–12. doi: 10.1007/s11033-022-07255-x
El Sabagh, A., Islam, M. S., Skalicky, M., Ali Raza, M., Singh, K., Anwar Hossain, M., et al. (2021). Salinity stress in wheat (Triticum aestivum l.) in the changing climate: Adaptation and management strategies. Front. Agron. 3, 661932. doi: 10.3389/fagro.2021.661932
Farid, H. U., Bakhsh, A., Ali, M. U., Mahmood-Khan, Z., Shakoor, A., Ali, I. (2018). Field investigation of aquifer storage and recovery (ASR) technique to recharge groundwater: a case study in punjab province of Pakistan. Water Sci. Technol.: Water Supply 18, 71–83. doi: 10.2166/ws.2017.083
Hailu, B., Mehari, H. (2021). Impacts of soil Salinity/Sodicity on soil-water relations and plant growth in dry land areas: A review. J. Natural Sci. Res. 12, 1–10.
Hanson, M. R., Gray, B. N., Ahner, B. A. (2013). Chloroplast transformation for engineering of photosynthesis. J. Exp. Bot. 64, 731–742. doi: 10.1093/jxb/ers325
Ibrahimova, U., Kumari, P., Yadav, S., Rastogi, A., Antala, M., Suleymanova, Z., et al. (2021). Progress in understanding salt stress response in plants using biotechnological tools. J. Biotechnol. 329, 180–191. doi: 10.1016/j.jbiotec.2021.02.007
Ishida, Y., Tsunashima, M., Hiei, Y., Komari, T. (2015). “Wheat (Triticum aestivum l.) transformation using immature embryos,” in Agrobacterium protocols (Springer), 189–198.
Khan, N., Abid, N., Maqbool, A. (2015). Effect of different parameters on wheat transformation efficiency J. Plan. Bio. Res. 4 (4), 119–125.
Khan, W.-U.-D., Tanveer, M., Shaukat, R., Ali, M., Pirdad, F. (2020). An overview of salinity tolerance mechanism in plants. Salt drought Stress tolerance Plants, 1–16. doi: 10.1007/978-3-030-40277-8_1
Li, Y., Chen, T., Wang, W., Liu, H., Yan, X., Wu-Zhang, K., et al. (2021). A high-efficiency agrobacterium-mediated transient expression system in the leaves of artemisia annua l. Plant Methods 17, 1–12. doi: 10.1186/s13007-021-00807-5
Li, P., Zheng, T., Li, L., Zhuo, X., Jiang, L., Wang, J., Cheng, T., et al. (2019). Identification and comparative analysis of the CIPK gene family and characterization of the cold stress response in the woody plant prunus mume. PeerJ 7, e6847. doi: 10.7717/peerj.6847
Ma, X., Li, Q.-H., Yu, Y.-N., Qiao, Y.-M., Haq, S. U., Gong, Z.-H. (2020). The CBL–CIPK pathway in plant response to stress signals. Int. J. Mol. Sci. 21, 5668. doi: 10.3390/ijms21165668
Mao, J., Mo, Z., Yuan, G., Xiang, H., Visser, R. G., Bai, Y., et al. (2022). The CBLCIPK network is involved in the physiological crosstalk between plant growth and stress adaptation. Plant Cell Environ. 1–11 doi: 10.1111/pce.14396
Newman, I. (2001). Ion transport in roots: measurement of fluxes using ion-selective microelectrodes to characterize transporter function. Plant Cell Environ. 24, 1–14. doi: 10.1046/j.1365-3040.2001.00661.x
Ordoñez, N. M., Shabala, L., Gehring, C., Shabala, S. (2013). Noninvasive microelectrode ion flux estimation technique (MIFE) for the study of the regulation of root membrane transport by cyclic nucleotides. Methods Mol. Biol. 1016, 95–106. doi: 10.1007/978-1-62703-441-8_7
Pastuszak, J., Dziurka, M., Hornyák, M., Szczerba, A., Kopeć, P., Płażek, A. (2022). Physiological and biochemical parameters of salinity resistance of three durum wheat genotypes. Int. J. Mol. Sci. 23, 8397. doi: 10.3390/ijms23158397
Raja, N. I., Bano, A., Rashid, H., Khan, M. H., Chaudhry, Z. (2009). Effect of age of embryogenic callus on plant regeneration in local cultivars of wheat (Triticum aestivum l.). Pak. J. Bot. 41, 2801–2806.
Richards, E., Reichardt, M., Rogers, S. (1994). Preparation of genomic DNA from plant tissue. Curr. Protoc. Mol. Biol. 27, 2.3.1–2.3.7.
Rio, D. C., Ares, M., Hannon, G. J., Nilsen, T. W. (2010). Purification of RNA using TRIzol (TRI reagent). Cold Spring Harbor Protoc. 2010, pdb. prot5439. doi: 10.1101/pdb.prot5439
Roy, S., Huang, W., Wang, X., Evrard, A., Schmöckel, S., Zafar, Z., et al. (2013). A novel protein kinase involved in na+ exclusion revealed from positional cloning. Plant Cell Environ. 36, 553–568. doi: 10.1111/j.1365-3040.2012.02595.x
Salim, N., Raza, A. (2020). Nutrient use efficiency (NUE) for sustainable wheat production: a review. J. Plant Nutr. 43, 297–315. doi: 10.1080/01904167.2019.1676907
Shabala, S., Shabala, L., Newman, I. (2012). Studying membrane transport processes by non-invasive microelectrodes: basic principles and methods. Plant Electrophysiol., 167–186. doi: 10.1007/978-3-642-29119-7_7
Shabala, S, Wu, H, Bose, J (2015). Salt stress sensing and early signalling events in plant roots: Current knowledge and hypothesis. Plant Sci 249, 101–119.
Shen, Q., Fu, L., Su, T., Ye, L., Huang, L., Kuang, L., et al. (2020). Calmodulin HvCaM1 negatively regulates salt tolerance via modulation of HvHKT1s and HvCAMTA4. Plant Physiol. 183, 1650–1662. doi: 10.1104/pp.20.00196
Shi, S., Li, S., Asim, M., Mao, J., Xu, D., Ullah, Z., et al. (2018). The arabidopsis calcium-dependent protein kinases (CDPKs) and their roles in plant growth regulation and abiotic stress responses. Int. J. Mol. Sci. 19, 1900. doi: 10.3390/ijms19071900
Singh, P., Kumar, K. (2022). Agrobacterium-mediated in-planta transformation of bread wheat (Triticum aestivum l.). J. Plant Biochem. Biotechnol. 31, 206–212. doi: 10.1007/s13562-021-00669-x
Syed, A., Sarwar, G., Shah, S. H., Muhammad, S. (2021). Soil salinity research in 21st century in Pakistan: its impact on availability of plant nutrients, growth and yield of crops. Commun. Soil Sci. Plant Anal. 52, 183–200. doi: 10.1080/00103624.2020.1854294
Tao, Y.-B., He, L.-L., Niu, L.-J., Xu, Z.-F. (2015). Isolation and characterization of an ubiquitin extension protein gene (JcUEP) promoter from jatropha curcas. Planta 241, 823–836. doi: 10.1007/s00425-014-2222-z
Tong, T., Li, Q., Jiang, W., Chen, G., Xue, D., Deng, F., et al. (2021). Molecular evolution of calcium signaling and transport in plant adaptation to abiotic stress. Int. J. Mol. Sci. 22, 12308. doi: 10.3390/ijms222212308
Van Kleeff, P., Gao, J., Mol, S., Zwart, N., Zhang, H., Li, K., et al. (2018). The arabidopsis GORK k+-channel is phosphorylated by calcium-dependent protein kinase 21 (CPK21), which in turn is activated by 14-3-3 proteins. Plant Physiol. Biochem. 125, 219–231. doi: 10.1016/j.plaphy.2018.02.013
Verma, P., Sanyal, S. K., Pandey, G. K. (2021). Ca2+–CBL–CIPK: a modulator system for efficient nutrient acquisition. Plant Cell Rep. 40, 2111–2122. doi: 10.1007/s00299-021-02772-8
Wang, C.-F., Han, G.-L., Qiao, Z.-Q., Li, Y.-X., Yang, Z.-R., Wang, B.-S. (2022). Root na+ content negatively correlated to salt tolerance determines the salt tolerance of brassica napus l. inbred seedlings. Plants 11, 906. doi: 10.3390/plants11070906
Wang, H., Shabala, L., Zhou, M., Shabala, S. (2018). Hydrogen peroxide-induced root Ca2+ and k+ fluxes correlate with salt tolerance in cereals: towards the cell-based phenotyping. Int. J. Mol. Sci. 19, 702. doi: 10.3390/ijms19030702
Wang, H., Shabala, L., Zhou, M., Shabala, S. (2019). Developing a high-throughput phenotyping method for oxidative stress tolerance in barley roots. Plant Methods 15, 1–9. doi: 10.1186/s13007-019-0397-9
Wei, X., Shan, T., Hong, Y., Xu, H., Liu, X., Zhang, Z. (2017). TaPIMP2, a pathogen-induced MYB protein in wheat, contributes to host resistance to common root rot caused by bipolaris sorokiniana. Sci. Rep. 7, 1–15. doi: 10.1038/s41598-017-01918-7
Wu, H., Shabala, L., Barry, K., Zhou, M., Shabala, S. (2013). Ability of leaf mesophyll to retain potassium correlates with salinity tolerance in wheat and barley. Physiol. Plant. 149, 515–527. doi: 10.1111/ppl.12056
Wu, X., Shi, H., Chen, X., Liu, Y., Guo, Z. (2018). Establishment of agrobacterium-mediated transformation of seashore paspalum (Paspalum vaginatum o. Swartz). In Vitro Cell. Dev. Biology-Plant 54, 545–552. doi: 10.1007/s11627-018-9930-1
Wu, H., Zhu, M., Shabala, L., Zhou, M., Shabala, S. (2015). K+ retention in leaf mesophyll, an overlooked component of salinity tolerance mechanism: a case study for barley. J. Integr. Plant Biol. 57, 171–185. doi: 10.1111/jipb.12238
Xi, Y., Liu, J., Dong, C., Cheng, Z.-M. (2017). The CBL and CIPK gene family in grapevine (Vitis vinifera): genome-wide analysis and expression profiles in response to various abiotic stresses. Front. Plant Sci. 8, 978. doi: 10.3389/fpls.2017.00978
Xiaolin, Z., Baoqiang, W., Xian, W., Xiaohong, W. (2022). Identification of the CIPK-CBL family gene and functional characterization of CqCIPK14 gene under drought stress in quinoa. BMC Genomics 23, 1–18. doi: 10.1186/s12864-022-08683-6
Yun, P., Xu, L., Wang, S.-S., Shabala, L., Shabala, S., Zhang, W.-Y. (2018). Piriformospora indica improves salinity stress tolerance in zea mays l. plants by regulating na+ and k+ loading in root and allocating k+ in shoot. Plant Growth Regul. 86, 323–331. doi: 10.1007/s10725-018-0431-3
Zarza, X., Shabala, L., Fujita, M., Shabala, S., Haring, M. A., Tiburcio, A. F., et al. (2019). Extracellular spermine triggers a rapid intracellular phosphatidic acid response in arabidopsis, involving PLDδ activation and stimulating ion flux. Front. Plant Sci. 10, 601. doi: 10.3389/fpls.2019.00601
Keywords: CBL-CIPK, CIPK16, K+ homeostasis, MIFE, salt tolerance, Wheat
Citation: Imtiaz K, Ahmed M, Annum N, Tester M and Saeed NA (2023) AtCIPK16, a CBL-interacting protein kinase gene, confers salinity tolerance in transgenic wheat. Front. Plant Sci. 14:1127311. doi: 10.3389/fpls.2023.1127311
Received: 19 December 2022; Accepted: 27 February 2023;
Published: 16 March 2023.
Edited by:
Dr. Muhammad Nawaz, Khwaja Fareed University of Engineering and Information Technology (KFUEIT), PakistanReviewed by:
Mohamed Magdy F. Mansour, Ain Sham University, EgyptSibaji Kumar Sanyal, Heinrich Heine University of Düsseldorf, Germany
Copyright © 2023 Imtiaz, Ahmed, Annum, Tester and Saeed. This is an open-access article distributed under the terms of the Creative Commons Attribution License (CC BY). The use, distribution or reproduction in other forums is permitted, provided the original author(s) and the copyright owner(s) are credited and that the original publication in this journal is cited, in accordance with accepted academic practice. No use, distribution or reproduction is permitted which does not comply with these terms.
*Correspondence: Moddassir Ahmed, Y21tYW5pYmdlQHlhaG9vLmNvLnVr