 Yiwen Liu1,2,3†‡
 Songtao Ban2,3†‡
 Shiwei Wei4
 Linyi Li1,2,3
 Minglu Tian2,3*
 Dong Hu2,3
 Weizhen Liu5Tao Yuan2,3
- 1College of Information Technology, Shanghai Ocean University, Shanghai, China
- 2Institute of Agricultural Science and Technology Information, Shanghai Academy of Agricultural Sciences, Shanghai, China
- 3Key Laboratory of Intelligent Agricultural Technology (Yangtze River Delta), Ministry of Agriculture and Rural Affairs, Shanghai, China
- 4Jinshan Experimental Station, Shanghai Agrobiological Gene Center, Shanghai, China
- 5School of Computer and Artificial Intelligence, Wuhan University of Technology, Wuhan, China
Introduction: The cold stress is one of the most important factors for affecting production throughout year, so effectively evaluating frost damage is great significant to the determination of the frost tolerance in lettuce.
Methods: We proposed a high-throughput method to estimate lettuce FDI based on remote sensing. Red-Green-Blue (RGB) and multispectral images of open-field lettuce suffered from frost damage were captured by Unmanned Aerial Vehicle platform. Pearson correlation analysis was employed to select FDI-sensitive features from RGB and multispectral images. Then the models were established for different FDI-sensitive features based on sensor types and different groups according to lettuce colors using multiple linear regression, support vector machine and neural network algorithms, respectively.
Results and discussion: Digital number of blue and red channels, spectral reflectance at blue, red and near-infrared bands as well as six vegetation indexes (VIs) were found to be significantly related to the FDI of all lettuce groups. The high sensitivity of four modified VIs to frost damage of all lettuce groups was confirmed. The average accuracy of models were improved by 3% to 14% through a combination of multisource features. Color of lettuce had a certain impact on the monitoring of frost damage by FDI prediction models, because the accuracy of models based on green lettuce group were generally higher. The MULTISURCE-GREEN-NN model with R2 of 0.715 and RMSE of 0.014 had the best performance, providing a high-throughput and efficient technical tool for frost damage investigation which will assist the identification of cold-resistant green lettuce germplasm and related breeding.
1 Introduction
Lettuce (Lactuca sativa L.) is one of the most widely consumed leafy vegetables worldwide with high nutritional value(Shi et al., 2022). It is also one of the most economically important vegetable crops in the world(Soldatenko et al., 2018), with China consistently leading in production (Shatilov et al., 2019; Wang et al., 2022). Lettuces prefer cool temperatures between 7 and 24°C with an average of 18°C(Jenni, 2005), and their growth will be retarded or stagnant when temperature goes below 7°C. Frost damage of lettuce is a stress caused by low temperatures and generally occurs below 0°C(Yu and Lee, 2020). When frost damage occurs, ice nuclei are formed outside the cells and ice crystals are gradually developed as long as the low temperature continues. When the ice crystals spread into the cells, irreversible damage will occur, causing the leaves to appear watery, yellow or dark brown and the whole plant to wilt. Fresh lettuce is not storage-resistant, and its supply relies on fresh harvesting. Frost can damage the outer leaves of mature lettuce, leading to decay in handling and storage(Turini et al., 2011). As a result, low temperature is one of the most important factors threatening to supply lettuce in winter (Pirinc and Alas, 2021). Under harsh environmental conditions, crop yields can be lost ranging from 50% to 70%(Francini and Sebastiani, 2019). Due to the low availability and high market demand for lettuce in winter(Han et al., 2014), it is urgent to breed cold-resistant lettuce cultivars to keep the yield of lettuce in winter. Meanwhile, frost damage investigation is an important basement in the breeding programs of cold-resistant lettuce. The traditional method relies on manual surveys plot-by-plot in the field, which is time-consuming, laborious, subjective, and low in efficiency, especially when the number of lettuce cultivars is large. Therefore, it is of great significance to develop high-throughput methods of frost damage investigation to improve breeding efficiency.
Remote sensing based on Unmanned Aerial Vehicle (UAV), a newly developed technique for high-throughput crop growth information acquisition, has been widely used in crop monitoring under growth (Jiang et al., 2022)and various stresses such as pests, diseases, water deficit, salt-stressed(Johansen et al., 2019) and frost(Wójtowicz et al., 2016; Perry et al., 2017a; Chen et al., 2019; Choudhury et al., 2019; Goswami et al., 2019; Jełowicki et al., 2020; Millan et al., 2020; Marin et al., 2021). Although satellite remote sensing technology was also used in frost damage monitoring(Feng et al., 2009; Romanov, 2009; Romani et al., 2011; Rudorff et al., 2012; She et al., 2015; She et al., 2017; Li et al., 2021; Gabbrielli et al., 2022a; Gabbrielli et al., 2022b), the UAV-based remote sensing is more accurate in the breeding field due to its high spatial resolution. UAVs, including DJI, 3D Robotics solo and Ebee, were equipped with spectral cameras to detect frost damage of crops such as wheat(Guo et al., 2014; Wang et al., 2014; Murphy et al., 2020), maize(Choudhury et al., 2019; Goswami et al., 2019; Shu et al., 2022), oat(Macedo-Cruz et al., 2011), oilseed rape(She et al., 2015), and coffee plants(Marin et al., 2021; Marin et al., 2022). In these studies, data analysis techniques such as Pearson correlation analysis and principal component analysis were used to extract stress-related spectral features including the reflectance of different spectral bands and several commonly used vegetation indexes (VIs) such as normalized difference vegetation index (NDVI)(She et al., 2015), green NDVI, photochemical reflectance index (PRI), carotenoid reflectance index(CRI), and anthocyanin reflectance index(ARI)(Choudhury et al., 2019; Marin et al., 2021; Marin et al., 2022). Pixel-based classification with thresholds, random forest, random committee, support vector machine (SVM) and other classification methods were used to predict frost damage degree in some of these studies(Goswami et al., 2019; Jełowicki et al., 2020). Besides, regression methods such as multiple linear regression (MLR) and principal component regression were employed to predict crop yield or other physical parameters and then their changes before and after frost damage were compared to assess stress severity(Guo et al., 2014; Choudhury et al., 2019). Currently, several studies have utilized RGB and multispectral image features for lettuce, such as prediction of lettuce health(Pham et al., 2019), detection of lettuce anthocyanin content(Kim and Van Iersel, 2023) and classification of lettuce seeds(Concepcion et al., 2020). However, as far as we know, few studies have been conducted to apply these techniques to detect the frost damage of lettuce in the field during the growth stage. Unlike other crops, different varieties of lettuce in breeding trial fields exhibit significant differences in both morphology (Iceberg, Batavian, Butterhead, etc.) and color (green, red, etc.). Therefore, it remains to be seen whether these spectral features, which are widely used in crop stress monitoring, are suitable for screening the frost damage of lettuce with different varieties, and whether these non-destructive and high-throughput methods for evaluating frost damage can be applied to field investigation of lettuce breeding materials.
Frost damage to lettuce not only leads to changes of appearance, but also affects its physiological and biochemical indexes. Spectral imagers have an advantage in responding to changes in the physiological and biochemical indexes of crops due to their ability to detect reflectance spectra in the visible and near infrared wavelengths(Tao et al., 2022). This is the reason why spectral imagers were chosen in the most existing researches on frost damage of field crops(Macedo-Cruz et al., 2011; Wang et al., 2014; Yang et al., 2019; Lassalle, 2021). However, the cost of multispectral cameras is high, and the resolution of multispectral images is generally low, with insufficient texture information in the images. On the other side, Red-Green-Blue (RGB) cameras have an advantage in responding to the surface characteristics of crops due to their high spatial resolution. Despite the low cost and high resolution of RGB cameras, they cannot capture spectral information beyond the visible spectrum. The combination of data from the RGB camera and the multispectral imager allows for a comprehensive analysis of the changes in lettuce after frost damage. In early research, various methodologies utilizing data from distinct sensors were contrasted to determine the most advantageous approach (Dammer et al., 2011). Currently, there have been studies of combining multisource image features for crop monitoring (Perry et al., 2017b; Zheng et al., 2020; Li et al., 2021), confirming the improvement of detection effect when multisource image features were integrated. Thus, it is worthwhile to try to use both RGB and multispectral images to evaluate the lettuce frost damage.
Therefore, the objectives of this study were to evaluate the frost damage in lettuce by analyzing UAV-based RGB and multispectral imagery. To accomplish this objective, correlation analysis with frost damage index (FDI) was employed to find FDI-sensitive features, new FDI-sensitive VIs were constructed by modifying existing well-performing VIs and tested, and multivariate regression models using different algorithms were compared to explore the potential of lettuce FDI estimation in the field.
2 Materials and methods
2.1 Plant material and study area
The experiment was performed in the test site of Shanghai Academy of Agricultural Sciences in Fengxian District, Shanghai City, China (30.891°N, 121.359°E), as shown in Figure 1. Fengxian District is located in the alluvial plain of the Yangtze River Delta. It has a subtropical marine monsoon climate and the average annual temperature is about 15.8°C.
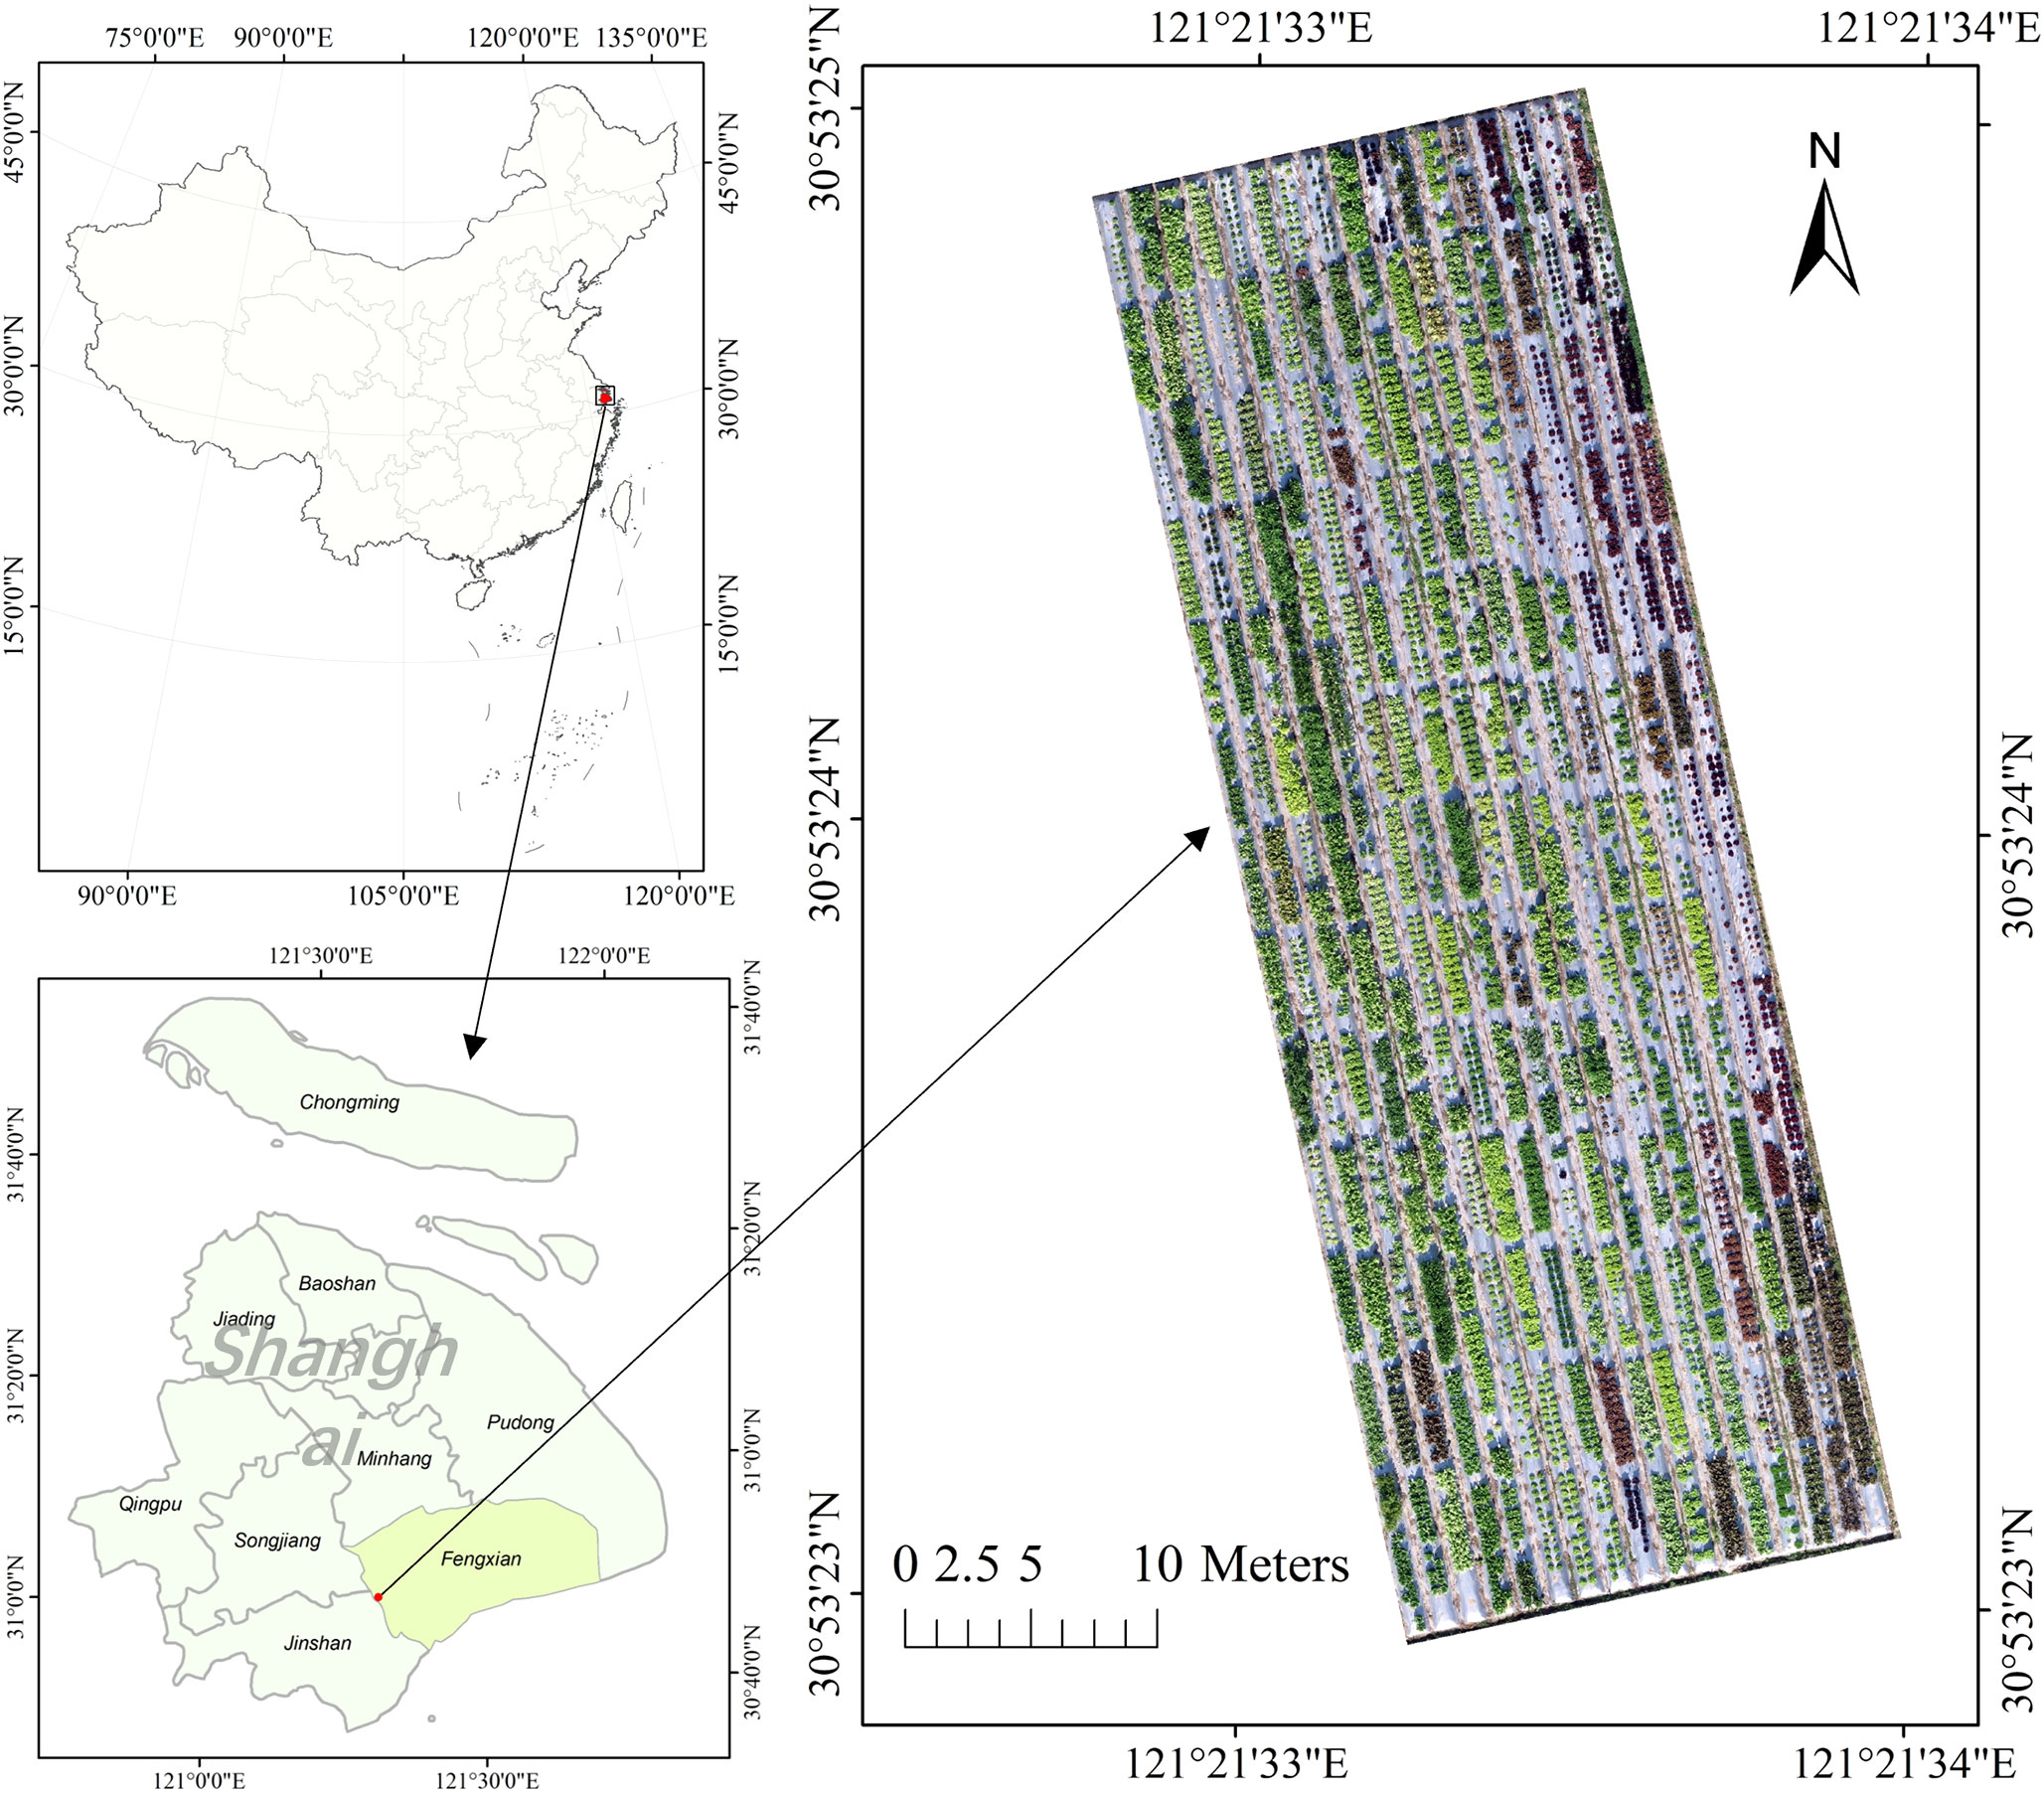
Figure 1 Location and RGB image of the experiment field in this study.
A total of 209 distinct cultivars of lettuce, consisting of 160 green and 49 red varieties, were randomly assigned to 209 plots. Each plot, measuring approximately 4 m2 (4m x 1m), contained approximately 24 plants of each cultivar, as illustrated in Figure 1. All the lettuces were sown on September 24, 2020, and were transplanted to the field on October 22, 2020. The harvest period commenced around December 29, 2020.
2.2 Data acquisition of frost damage index
Figure 2 shows the minimum and maximum temperatures from Dec 15, 2020 to Jan 8, 2021. The temperatures from Dec 15, 2020 to Dec 28, 2020 and from Jan 2, 2021 to Jan 5, 2021 range from 0 to 15°C. Lettuce leaves remain undamaged at temperatures near freezing, but are susceptible to damage at temperatures below freezing (Turini et al., 2011). The first day when temperature went below 0°C after field-planting was Dec 29, 2020, on which day the temperature dropped to -5°C. The lowest temperature, which was -9°C, appeared on Jan 7, 2021. During these two periods, from Dec 29, 2020 to Jan 1, 2021 and from Jan 6, 2021 to Jan 8, 2021, different cultivars of lettuce suffered from frost damage of different degrees, as shown in Figure 3.
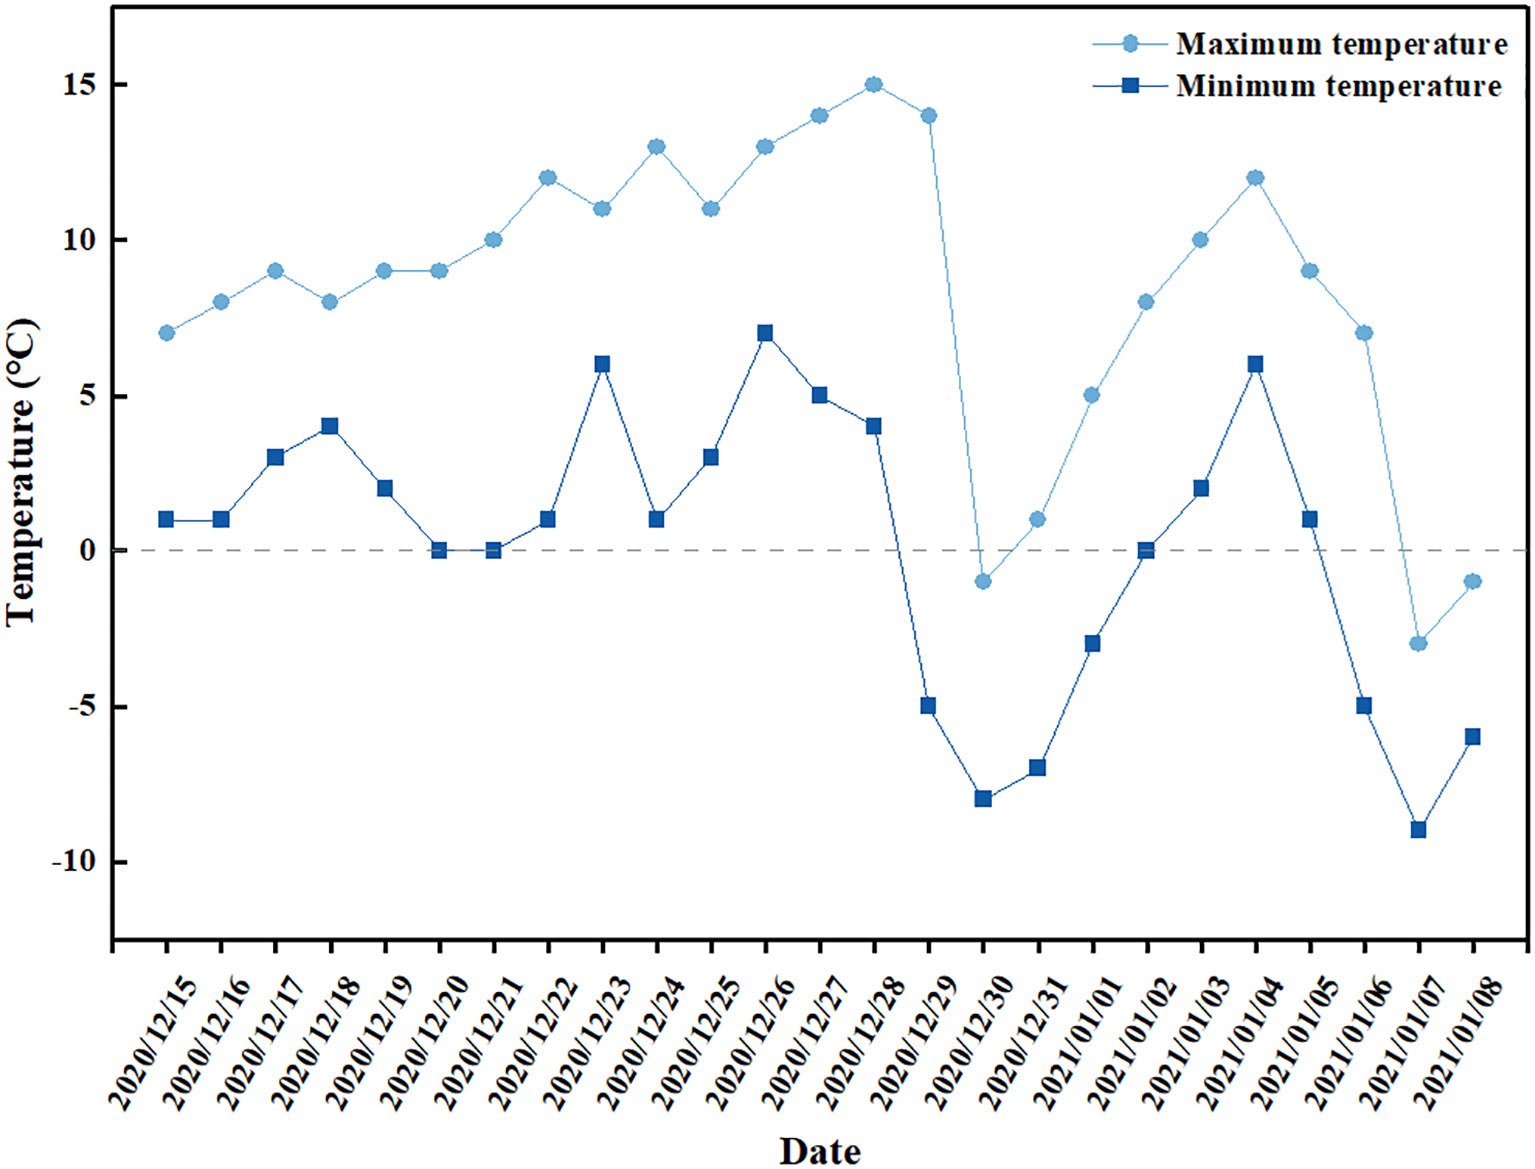
Figure 2 The temperature during the experiment in this study.
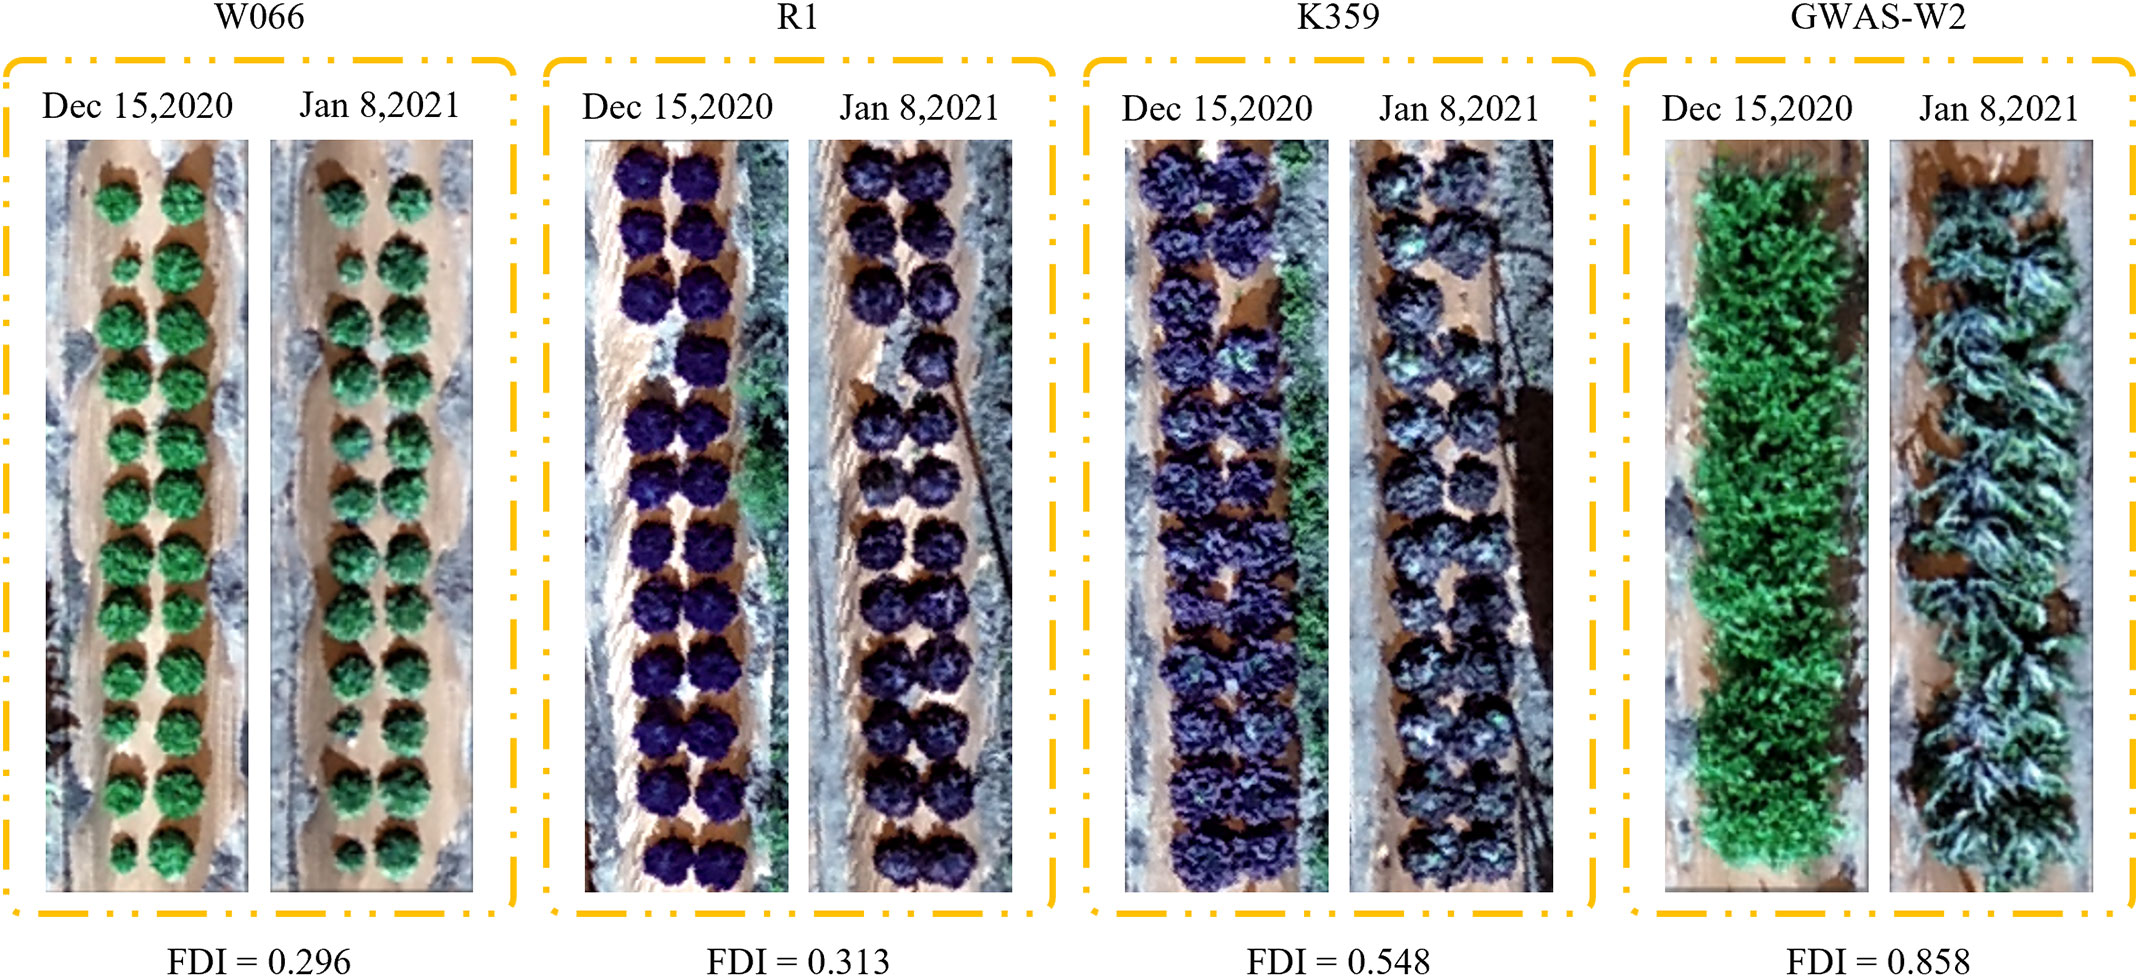
Figure 3 Lettuce before and lettuce after frost damage in this experiment. FDI represents frost damage index.
The field investigation of FDI of each lettuce cultivar plot was carried out on Jan 8, 2021. The FDI was defined by referring to the statistical method of other damage indexes, such as chilling injury index(Fernandez-Trujillo et al., 1998; Porat et al., 2000; González-Aguilar et al., 2004; Zhao et al., 2006; Yang et al., 2011; Pan et al., 2016) and leaf disease index(Wang et al., 2015), which involved in a variety of crop stress investigations. In this research, the severity of frost damage was graded according to the characteristics of frost damage, which was shown in Supplementary Table 1. Then the FDI was calculated using the following equation:
where is the damage level value, is the number of damage levels counted in this plot, is the number of plants at damage level of in this plot, is the maximum damage level, is the total number of plants in this plot.
2.3 Acquisition and processing of images
Two aerial surveys were performed on Dec 15, 2020, when the temperature had not dropped below 0°C and there was no frost damage, and Jan 8, 2021, when the lettuce had suffered from low temperature and frost damage happened. In each survey, the UAV-based RGB and multispectral images of lettuce field were acquired respectively.
The RGB images were captured by a quadrotor named DJI Phantom 4 RTK (SZ DJI Technology Co., Shenzhen, China), which is a compact and lightweight UAV with a 20-megapixel RGB camera. The flight height of flight route was set as 30 m and the corresponding ground resolution of images was 0.012 m, and the forward and side overlaps were 80% and 70%, respectively.
The multispectral images were acquired using a five-band multispectral camera with a resolution of 1280 × 980 pixels, RedEdge-M (Micasense Inc., Seattle, WA, USA), mounted on a DJI M600 Pro UAV (SZ DJI Technology Co., Shenzhen, China). The central wavelength of each band with the corresponding bandwidth was 475nm (20nm), 560nm (20nm), 668nm (10nm), 717nm (10nm), and 840nm (40nm). The flight height of flight route was set as 30 m and the corresponding ground resolution of images was 0.018 m, and the forward and side overlaps were 85% and 80%, respectively. The images of reference panel which is a gray board with 50% reflectance by the size of 15.5 cm × 15.5 cm were captured before flight missions for radiometric calibration.
The RGB and multispectral images of the whole lettuce field were generated by mosaicking the originally acquired images within the aerial survey area using Pix4Dmapper Pro (PIX4D, Lausanne, Switzerland). The multispectral images were radiometrically corrected before mosaicking according to the images of reference panel. All the mosaiced images were geometrically corrected based on the RGB image of Dec 15, 2020 using ArcGIS (ESRI, Redlands, CA, USA).
The growth of lettuces almost stopped during Dec 15, 2020 to Jan 8, 2021 and their changes were mainly caused by frost damage. On Jan 8, 2021, many lettuces had reduced their coverage and lost biometric features because of frost damage, making it difficult to separate them from the background. Therefore, we chose the image on Dec 15, 2020 to extract pure lettuce regions for image features calculation from images on Jan 8, 2021. As NDVI is one of the most sensitive indexes to vegetation cover(Liu et al., 2020; Murphy et al., 2020), decision tree classification was performed on the multispectral image (MSI) of Dec 15, 2020, when the lettuces were in health status, to separate the lettuce plants from the background by setting NDVI greater than 0.5 as the rule using ENVI (Harris Geospatial Solutions, Inc., Broomfield, CO, America). Majority/Minority analysis was then applied to the classified results to reduce small plaques. Regions of interest of lettuce plants of each plot were generated based on the classification results and converted to shapefiles which were used to extract image and spectral features from the RGB and multispectral images of Jan 8, 2021 through zonal statistics tool.
2.4 Image and spectral features extraction
2.4.1 RGB image features
Frost damage will change the color and texture features of the RGB images of lettuce. These features will, in turn, provide information about the surface characteristics of lettuce after frost damage has occurred. The color features included the digital number (DN) of red, green, and blue channels, which were represented by R, G, and B, respectively. In addition, fifteen vegetation-related color indexes (CIs) were calculated based on DN, as listed in Table 1.
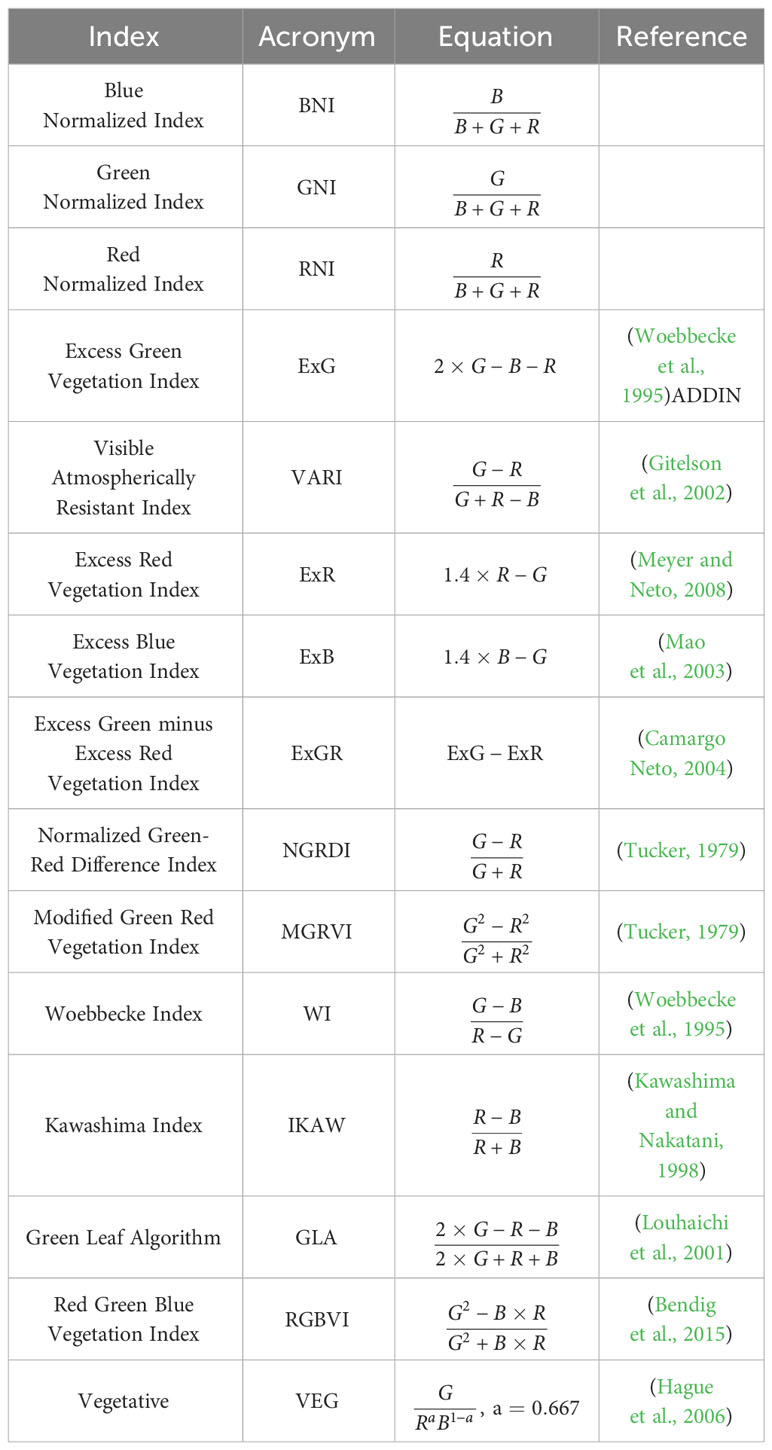
Table 1 Color indexes(CIs).
For each channel of the RGB image, 8 texture features, namely, Mean (M), Variance (V), Homogeneity (H), Contrast (Con), Dissimilarity (D), Entropy (E), Second Moment (SM), and Correlation (Cor) were calculated using Gray-level Co-occurrence Matrix (GLCM). Therefore, a total of 24 texture features were calculated and named with the initials of the color channels plus the abbreviation of the texture names. The calculation formulae of texture features are as follows:
where is the value of the (i, j)th entry in the gray level cooccurrence matrix; is the number of distinct gray levels in the quantized image; and are the mean and standard deviation of x rows in matrix calculation. and are the mean and standard deviation of y rows in the matrix calculation.
2.4.2 MSI features
In addition to the changes in surface characteristics, physiological and biochemical indexes of lettuce will also undergo alterations, leading to corresponding changes in the spectral reflectance of different bands. The features extracted from MSI included the spectral reflectance of each band and different VIs. , , , and represented the reflectance value at specified bands. A total of twenty-three VIs were calculated based on the spectral reflectance at different bands according to the formulation in Table 2. Specifically, for lettuce frost damage evaluation in this study, experiential frost damage VIs (FD_VIs) were constructed by examining the correlativity between FDI and the spectral reflectance of each band, while referring to the existing FDI-sensitive VIs such as NDVI, EVI, and SIPI. These FD_VIs incorporated more bands and different constants, and their sensitivity to FDI was assessed through Pearson correlation analysis. Ultimately, four FD_VIs, namely FD_VI1, FD_VI2, FD_VI3, and FD_VI4, were established.
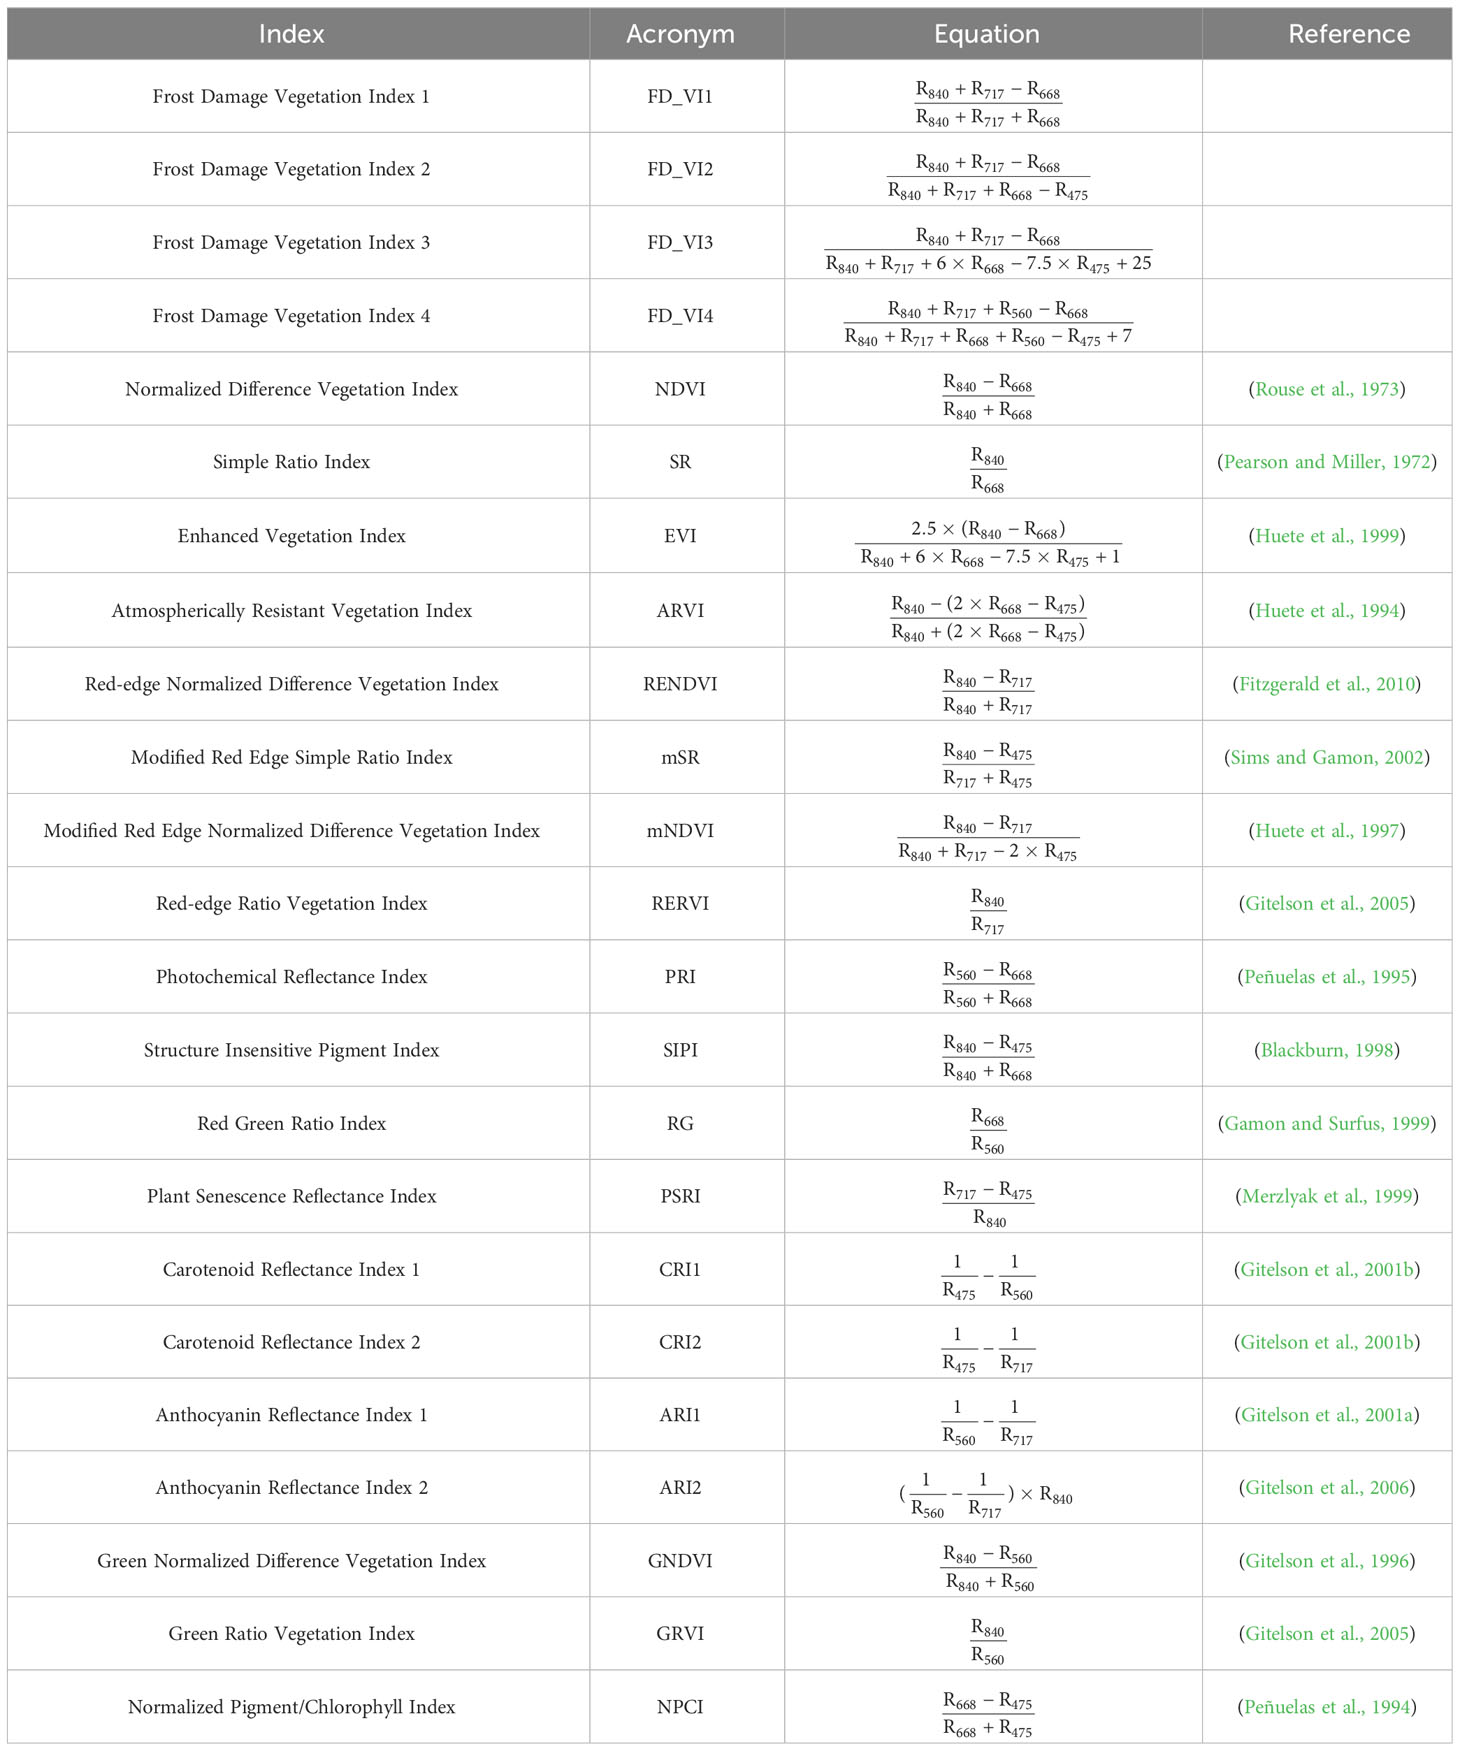
Table 2 Vegetation indexes(VIs).
2.5 Statistical analysis and modeling algorithms
Pearson correlation analysis method was used to select the RGB and multispectral image features. The correlation analysis was employed between these features and FDI in each group. The features that reached a highly significant level (p<0.01) were selected. Three regression algorithms, namely MLR, SVM and neural network (NN), were used to establish the estimation models of lettuce FDI by taking selected color, texture and spectral features as independent variables.
MLR is a basic method in multiple regression analysis and widely used in remote sensing monitoring because of their good theoretical basis(Zhang et al., 2021). In this study, the MLR models were constructed based on the following calculation formula:
where , and are the FDI of the ith sample, the number of independent variables and the ith independent identically distributed normal error; and are respectively the jth independent variable and its coefficient of the ith sample ( =1, 2, …, ).
SVM is one of the commonly used regression methods to predict physiological parameters of crops(Shah et al., 2018; Zhang et al., 2022). The essence of SVM is to construct a set of planes or hyperplanes in a high or infinite dimensional space(Cortes and Vapnik, 1995). In this study, linear kernel function and sequential minimal optimization were chosen to construct the SVM models. The value of kernel scale was 1 and the approximations of box constraint and epsilon ranged from 0.18 to 0.2 and 0.018 to 0.02, respectively.
NN is a mathematical model that simulates the brain for information processing(Agatonovic-Kustrin and Beresford, 2000). The NN models are powerful predictive tools for crop growth status(Romero et al., 2018). The network structure of NN includes the number of hidden layers, the number of nodes in each layer, the initialization of weights, the training algorithm, and the learning rate. The NN models in this study used 10 hidden layers, and the training algorithm was the Levenberg-Marquardt algorithm.
The experimental cultivars contained lettuce in both green and red colors. There may be some influence of lettuce color on the predicted results. To understand this influence, the data was divided into three groups according to the color of lettuce: a group of all the lettuce (ALL), a group of green lettuce (GREEN) and a group of red lettuce (RED). Each group was divided into a training set and a test set by stratified random sampling according to the sample ratio of 7:3. Table 3 describes the statistical characteristics of the FDI of the samples.
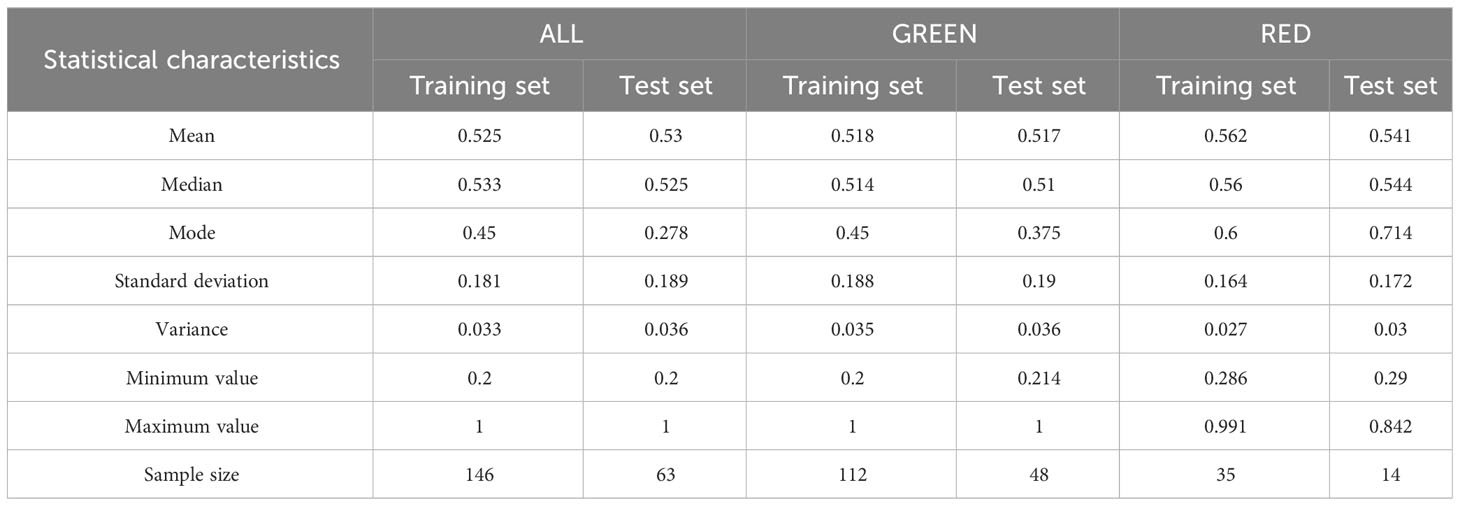
Table 3 Descriptive statistics of the FDI of lettuce.
The procedure of statistical analysis is summarized by the flowchart in Figure 4. Coefficient of determination (R-squared, R2), Root Mean Square Error (RMSE) and Mean Absolute Error (MAE) were used to evaluate the accuracy of the estimation models established with FDI as the dependent variable. The value of R2 (0≤R2 ≤ 1) determines the degree of closeness of correlation. The larger R2 is, the closer the relationship between dependent and independent variables is. RMSE and MAE are used to measure the deviation between the predicted and actual values. The smaller RMSE and MAE are, the closer the predicted values are to the actual values. Therefore, the closer R2 is to 1, RMSE is to 0 and MAE is to 0, the higher the accuracy of model will be. The formulas are as follows:
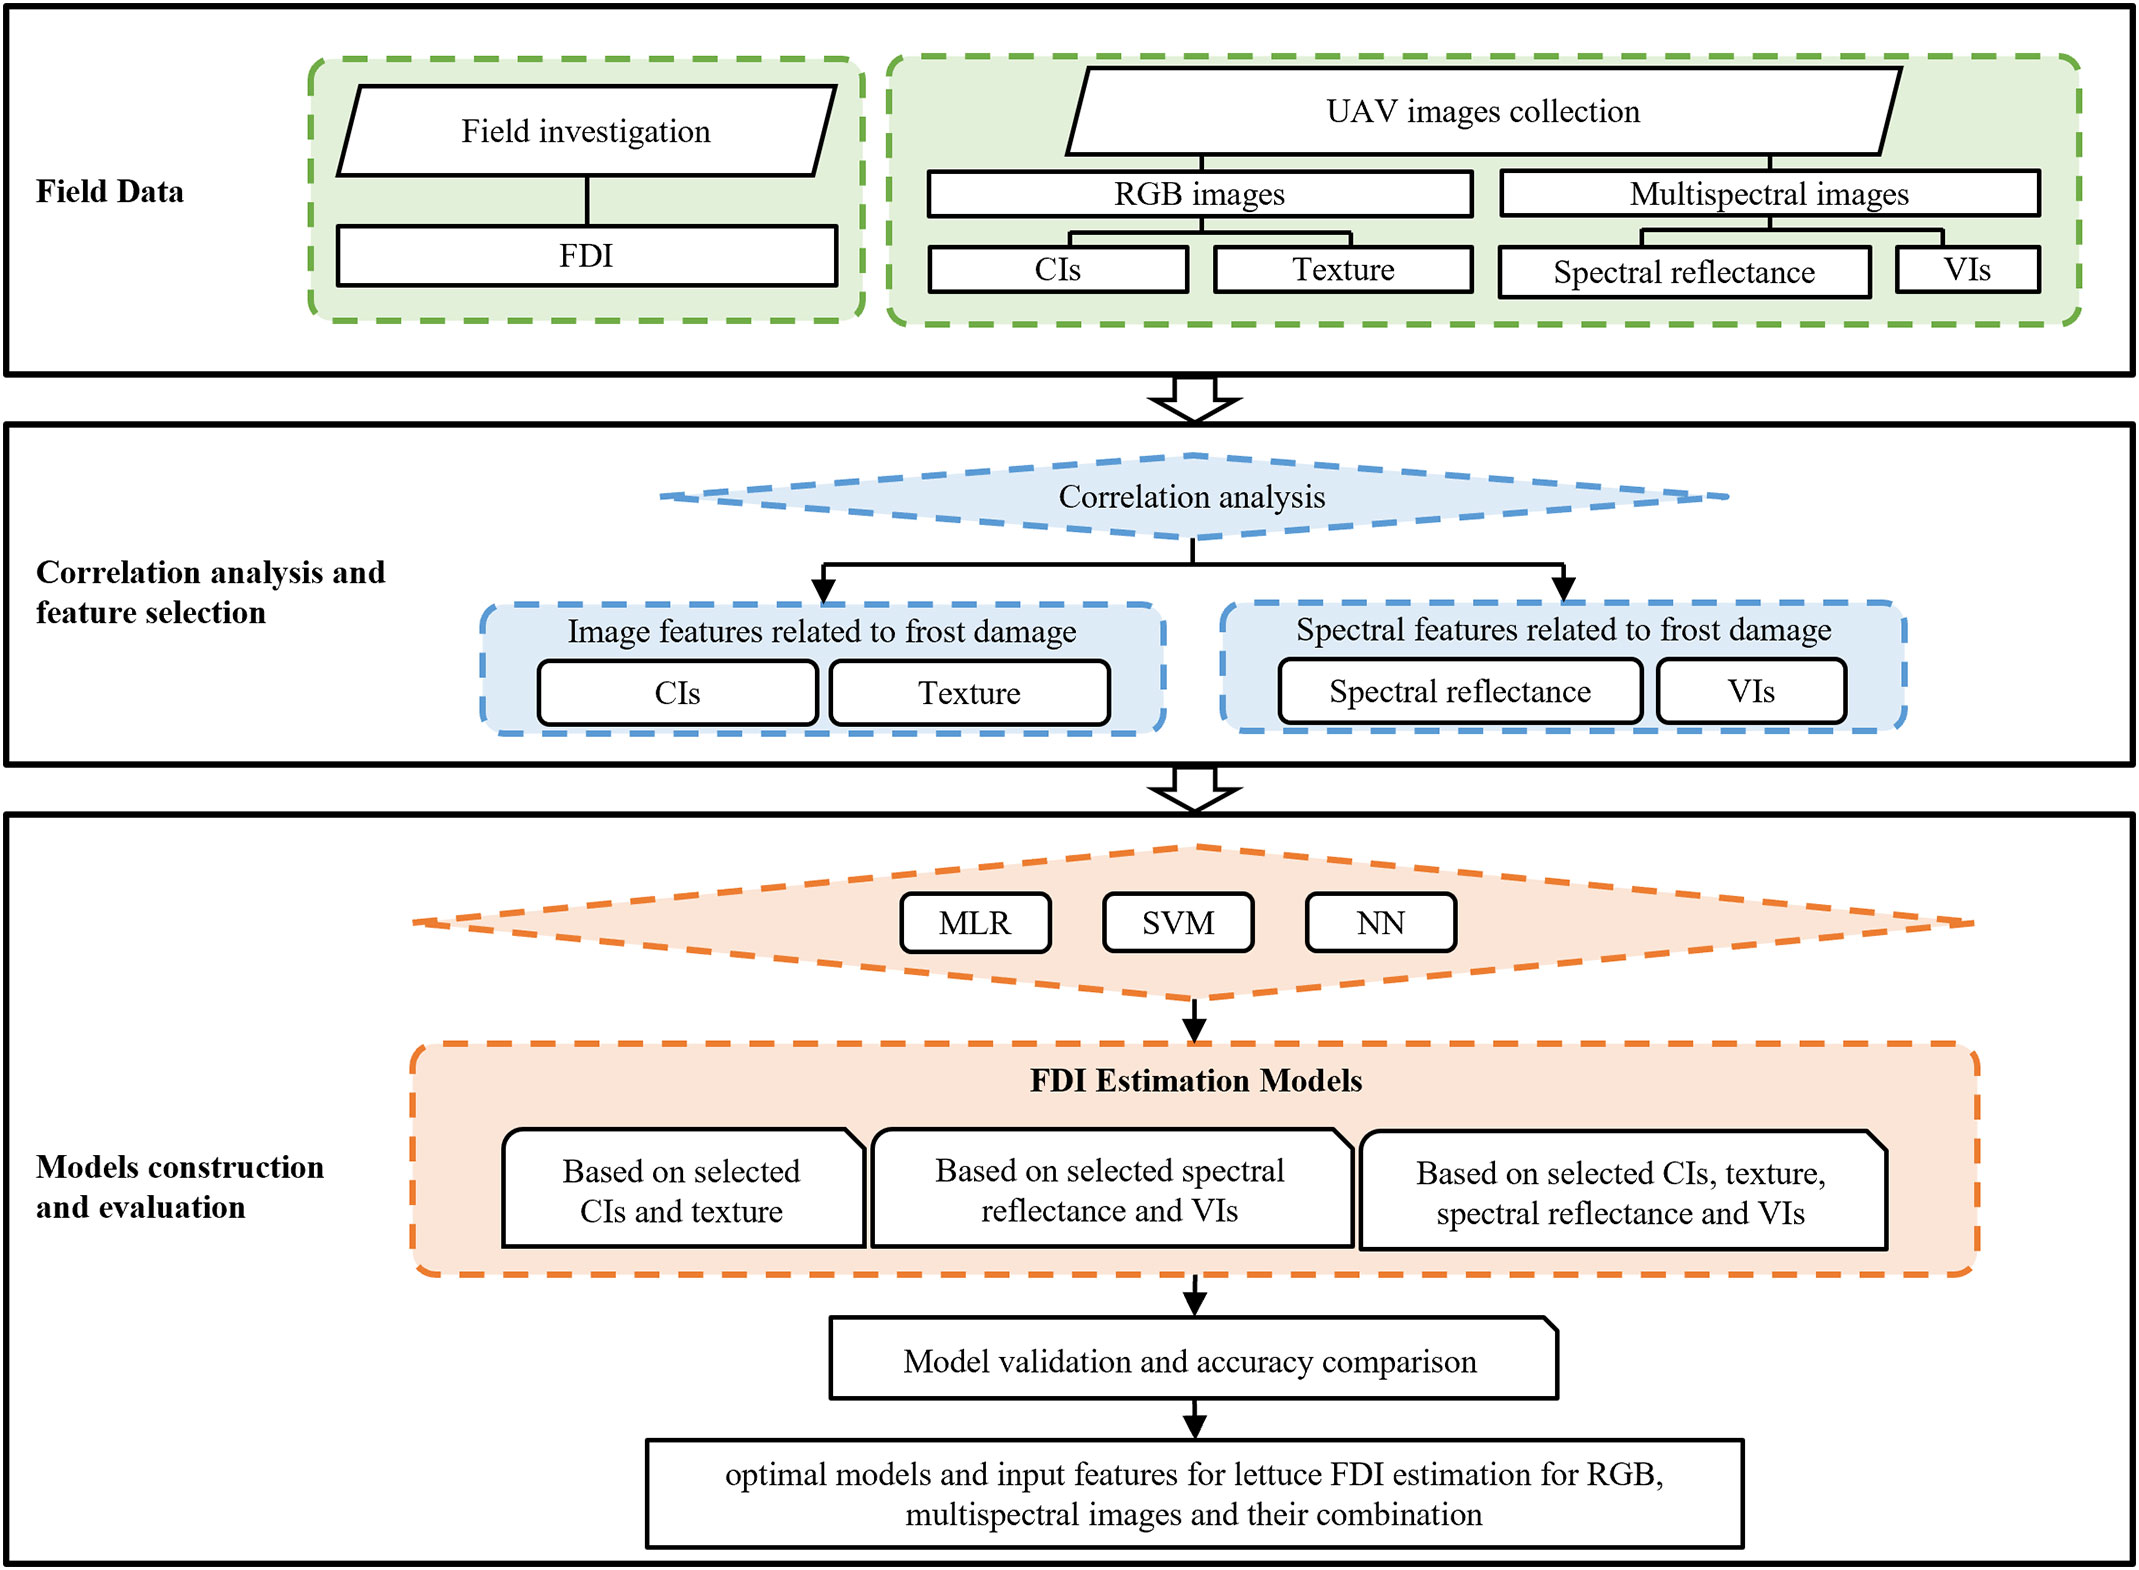
Figure 4 Experiment methodology and procedure of statistical analysis in this study. MLR, SVM and NN represent multiple linear regression, support vector machine and neural network, respectively.
where , and are the actual FDI, the predicted FDI and the average of actual FDI, respectively; is the number of samples.
3 Results
3.1 Correlation analysis between RGB and multispectral image features and FDI
Supplementary Figure 1 illustrates the correlation between the RGB and multispectral image features and FDI for three distinct lettuce groups. The results reveal that certain CIs demonstrated a significant correlation with FDI, while all texture features exhibited no noticeable correlation with FDI. The majority of MSI features displayed a significant correlation with FDI, and their correlation trends with lettuce FDI remained largely consistent within each group. Notably, the correlations between certain features, primarily CIs, and FDI exhibited opposing trends for GREEN and RED. Subsequent to the correlation analysis (p<0.01), features with absolute Pearson correlation coefficients (absolute r) greater than 0.181, 0.202, and 0.358 were selected respectively for ALL, GREEN and RED for further analysis, as depicted in Figure 5.
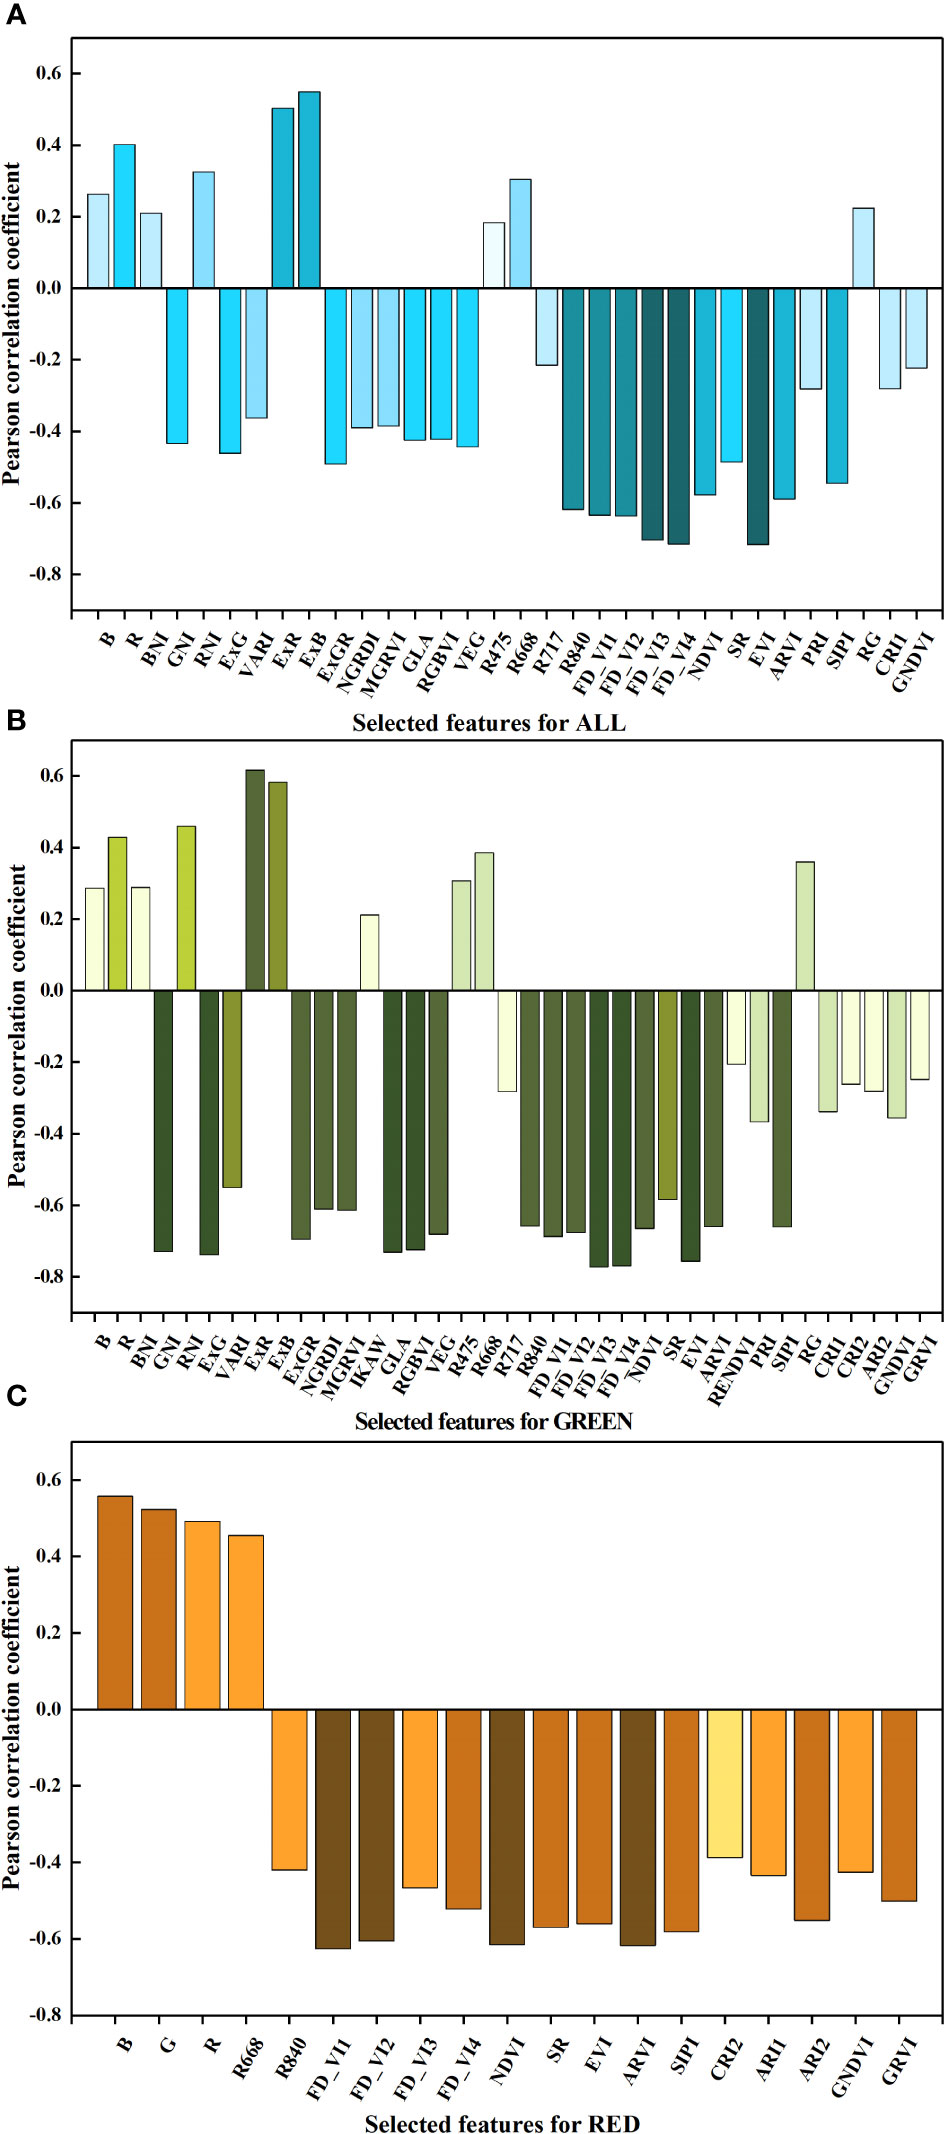
Figure 5 The features with significant correlation with FDI for the group of (A) ALL, (B) GREEN, and (C) RED.
For the ALL group, a total of 32 features were selected, including 15 features from the RGB images and 17 features from the multispectral images. The CIs derived from the RGB images exhibited low correlations with FDI (absolute r< 0.55), with ExR and ExB demonstrating absolute r values higher than 0.5, and the highest absolute r recorded at 0.549. The correlations between various MSI features and FDI displayed considerable disparity (absolute r arranged from 0.183 to 0.717), with , the four FD_VIs and EVI surpassing an absolute r of 0.6, and the highest absolute r observed for EVI.
For the group of GREEN, 16 RGB image features and 21 MSI features were selected. The absolute r of RGB image features were all above 0.21 (mostly surpassing 0.55) with ExG recording the highest absolute r of 0.738. Specifically, GNI, ExG, GLA, and RGBVI exhibited absolute r values exceeding 0.72. As for the MSI features, FD_VI3, FD_VI4, EVI, FD_VI1, FD_VI2, NDVI, SIPI, ARVI, and R_840 demonstrated absolute r values greater than 0.65. Among them, FD_VI3 attained the maximum absolute r of 0.773.
For the group of RED, a total of 19 features were selected, including 3 RGB image features and 16 MSI features. The selected RGB image features were B, G and R with absolute r of 0.558, 0.523, and 0.492, respectively. They all showed positive correlations with FDI. The MSI features with absolute r above 0.6 were FD_VI1, FD_VI2, ARVI and NDVI, and FD_VI1 had the highest absolute r of 0.626. Additionally, was the only feature that displayed a positive correlation with FDI.
Notably, the four newly proposed FD_VIs were explicitly correlated with FDI and displayed exceptional performance across the three groups of lettuce data, highlighting their broad utility in accurately evaluating the impact of frost damage.
3.2 FDI estimation models based on RGB image features
The estimation models were constructed with selected RGB image features as independent variables and FDI as a dependent variable by using MLR, SVM and NN algorithms. The accuracy of models was demonstrated in Table 4 and Figure 6. For the models of the group of ALL, the R2 and RMSE of training set ranged from 0.465 to 0.56 and 0.014 to 0.132 with MAE between 0.094 and 0.104, and the R2 and RMSE of test set ranged from 0.437 to 0.545 and 0.019 to 0.142 with MAE between 0.111 and 0.115. The FDI estimation accuracy of models for GREEN were highest among the three groups with the R2 of training and test sets between 0.517 and 0.637, RMSE between 0.012 and 0.131 and MAE between 0.090 and 0.094. The performance of FDI estimation models for RED was neither sufficient nor stable with R2 ranging from 0.223 to 0.386 for the training set, but from 0.357 to 0.737 for the test set. For all the three groups, the models using NN algorithm always achieved better accuracy and stability than others with higher R2, lower RMSE and lower MAE, and the difference of R2, RMSE and MAE between the training and test set were smaller.
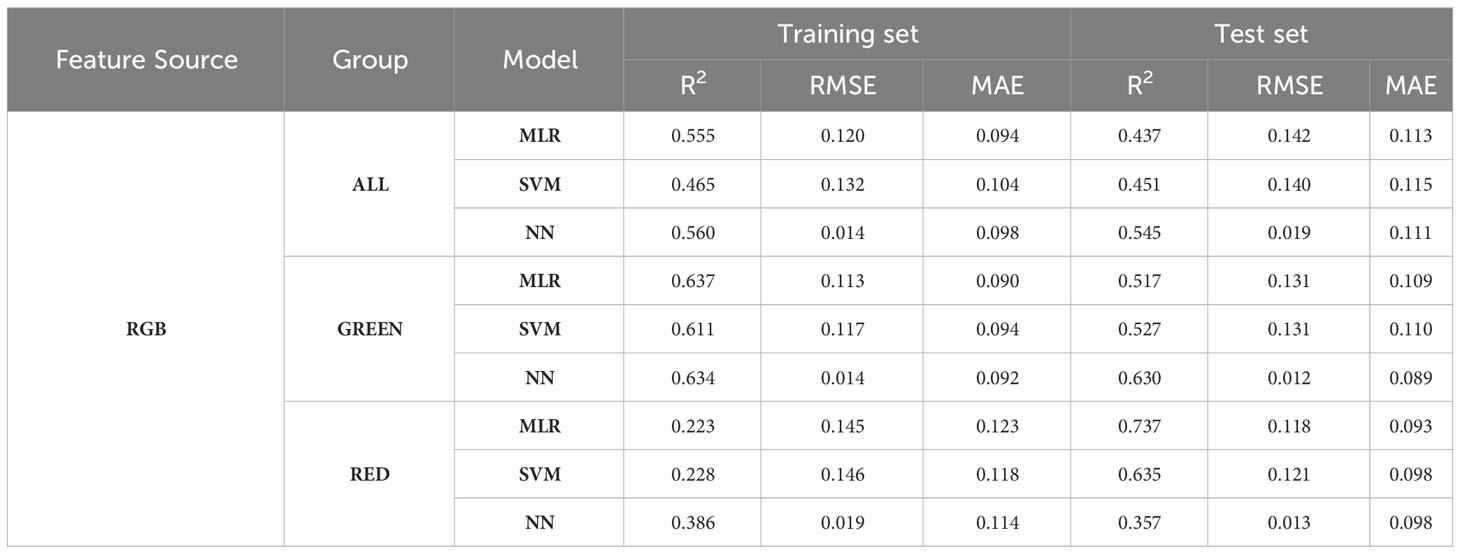
Table 4 Accuracy of the FDI estimation models based on RGB image features.
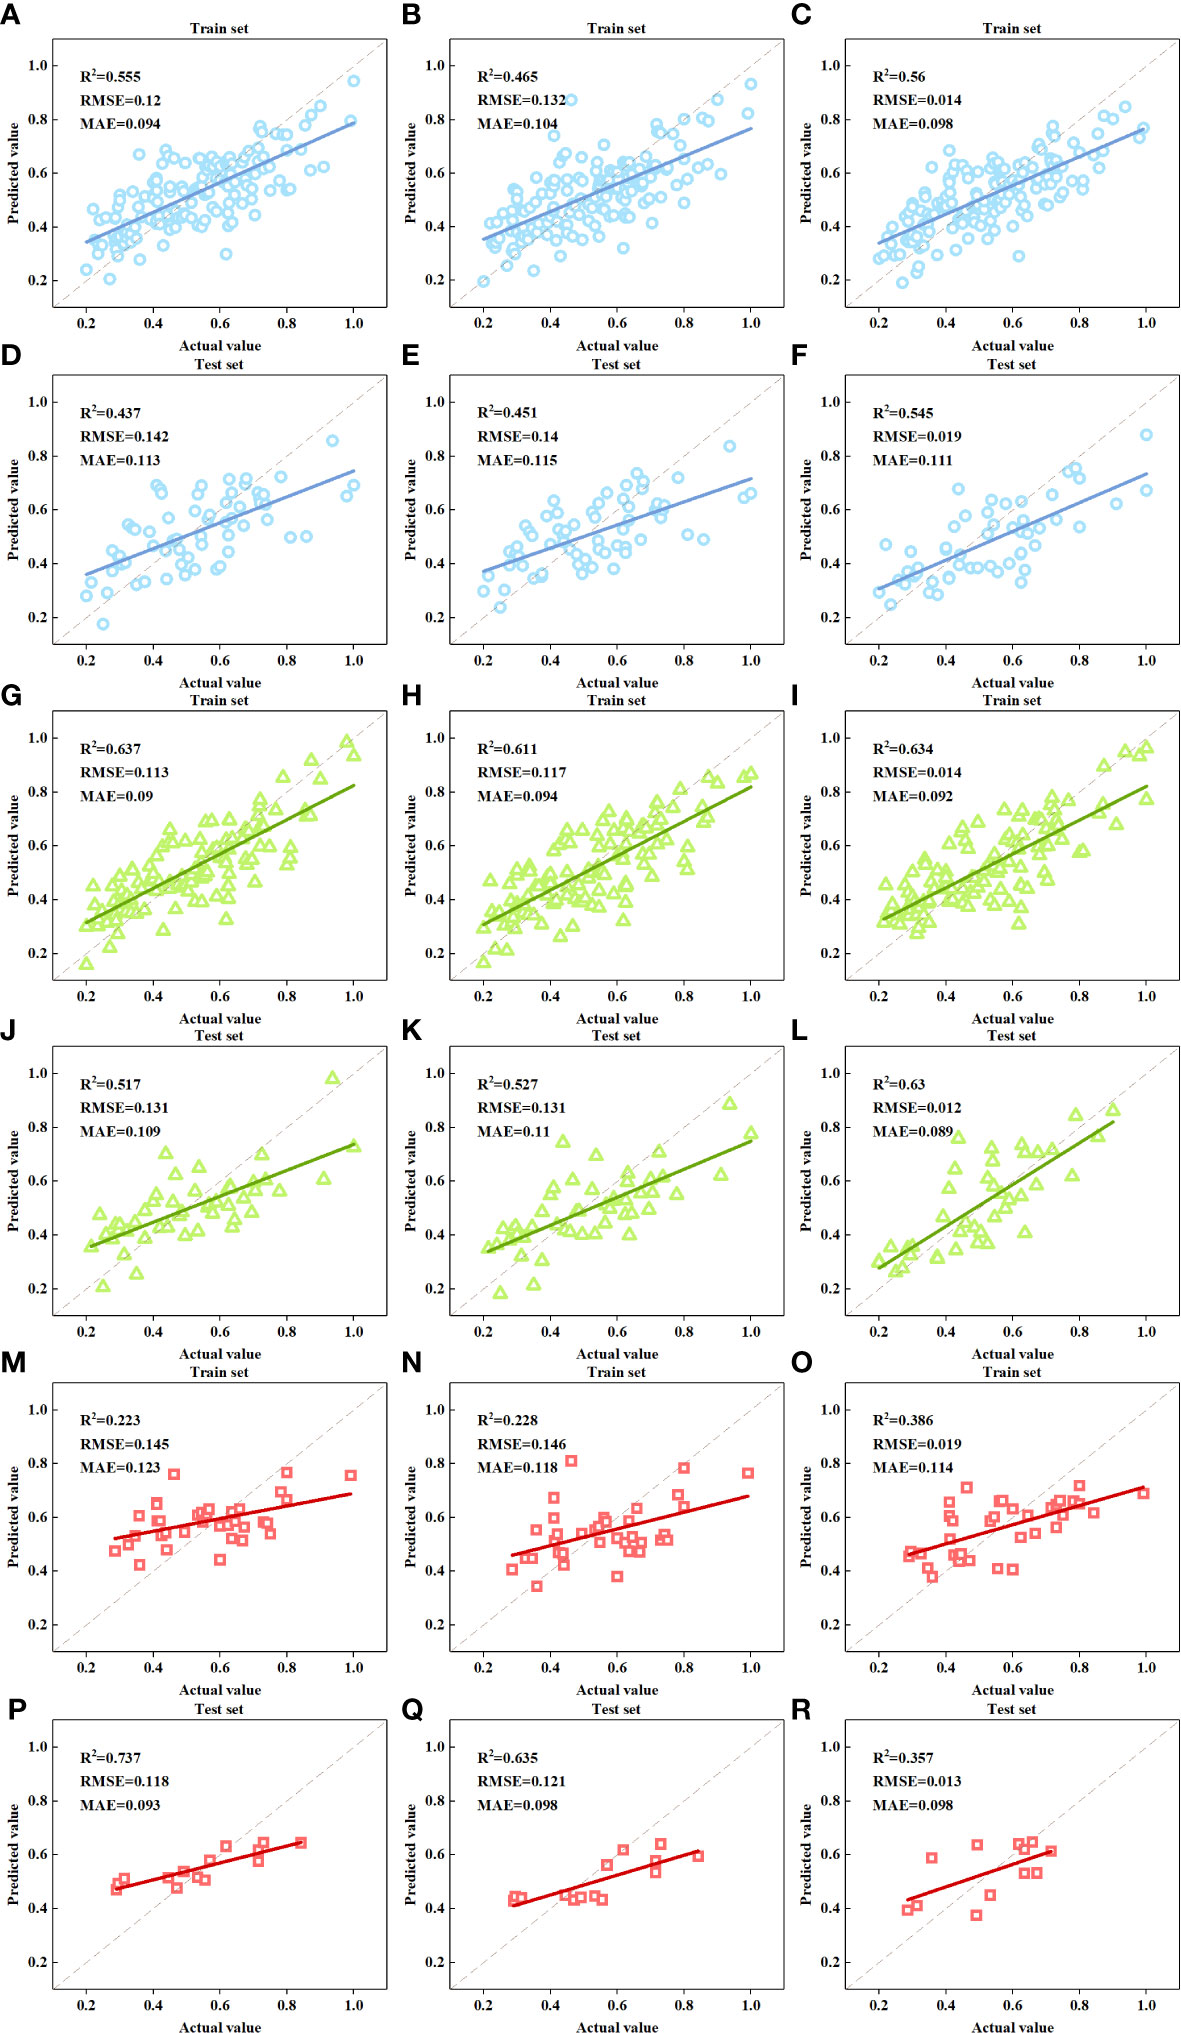
Figure 6 Scatter plots of the actual FDI and the predicted FDI. (A, D). RGB-ALL-MLR model; (B, E). RGB-ALL-SVM model; (C, F). RGB-ALL-NN model; (G, J). RGB-GREEN-MLR model; (H, K). RGB-GREEN-SVM model; (I, L). RGB-GREEN-NN model; (M, P). RGB-RED-MLR model; (N, Q). RGB-RED-SVM model; (O, R). RGB-RED-NN model.
3.3 FDI estimation models based on MSI features
The FDI estimation models based on selected MSI features were constructed using MLR, SVM and NN, respectively. Table 5 and Figure 7 illustrate the accuracy of FDI prediction. All the models based on MSI features had better performance than those based on RGB image features. The R2 of models by different algorithms for the group of ALL in the training set were relatively close, ranging from 0.6 to 0.651; but the R2 of test set varied from 0.484 to 0.639. The models for GREEN had better accuracy than other groups with R2 up to 0.718 and 0.665, RSME down to 0.01 and 0.014 and MAE down to 0.080 and 0.090 for the training and test set, respectively. The models for RED were improved by using MSI features, but still not good enough for FDI estimation with R2 lower than 0.5. As for the algorithms, NN was still superior to MLR and SVM.
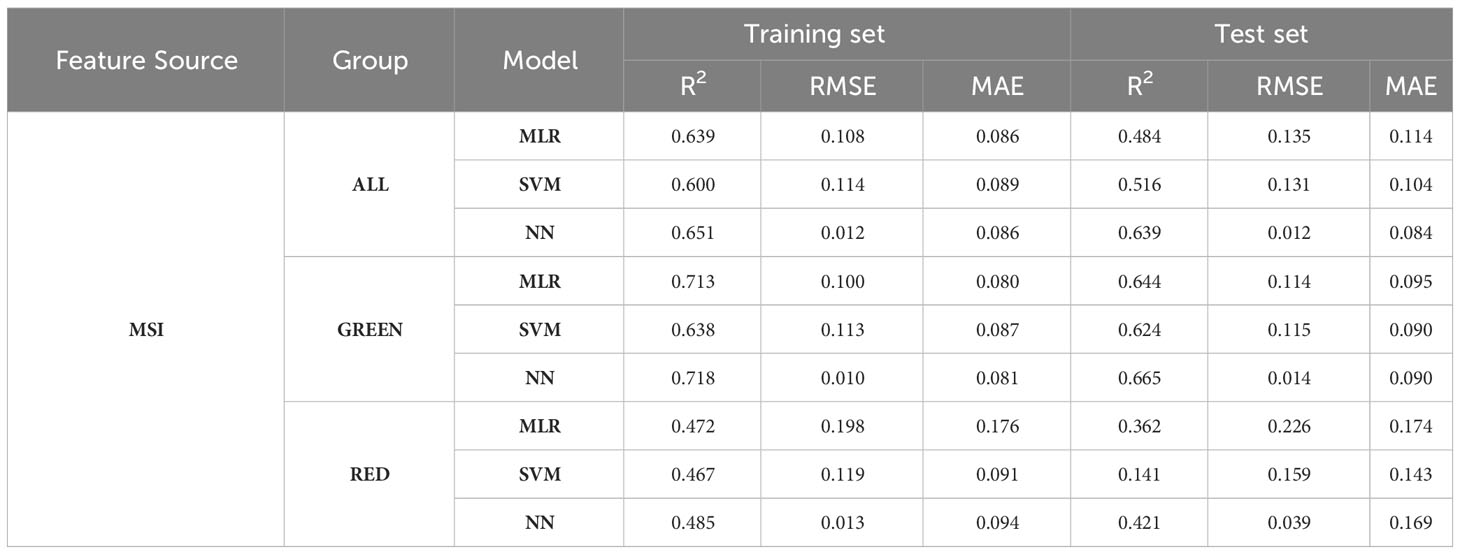
Table 5 Accuracy of the FDI estimation models based on MSI features.
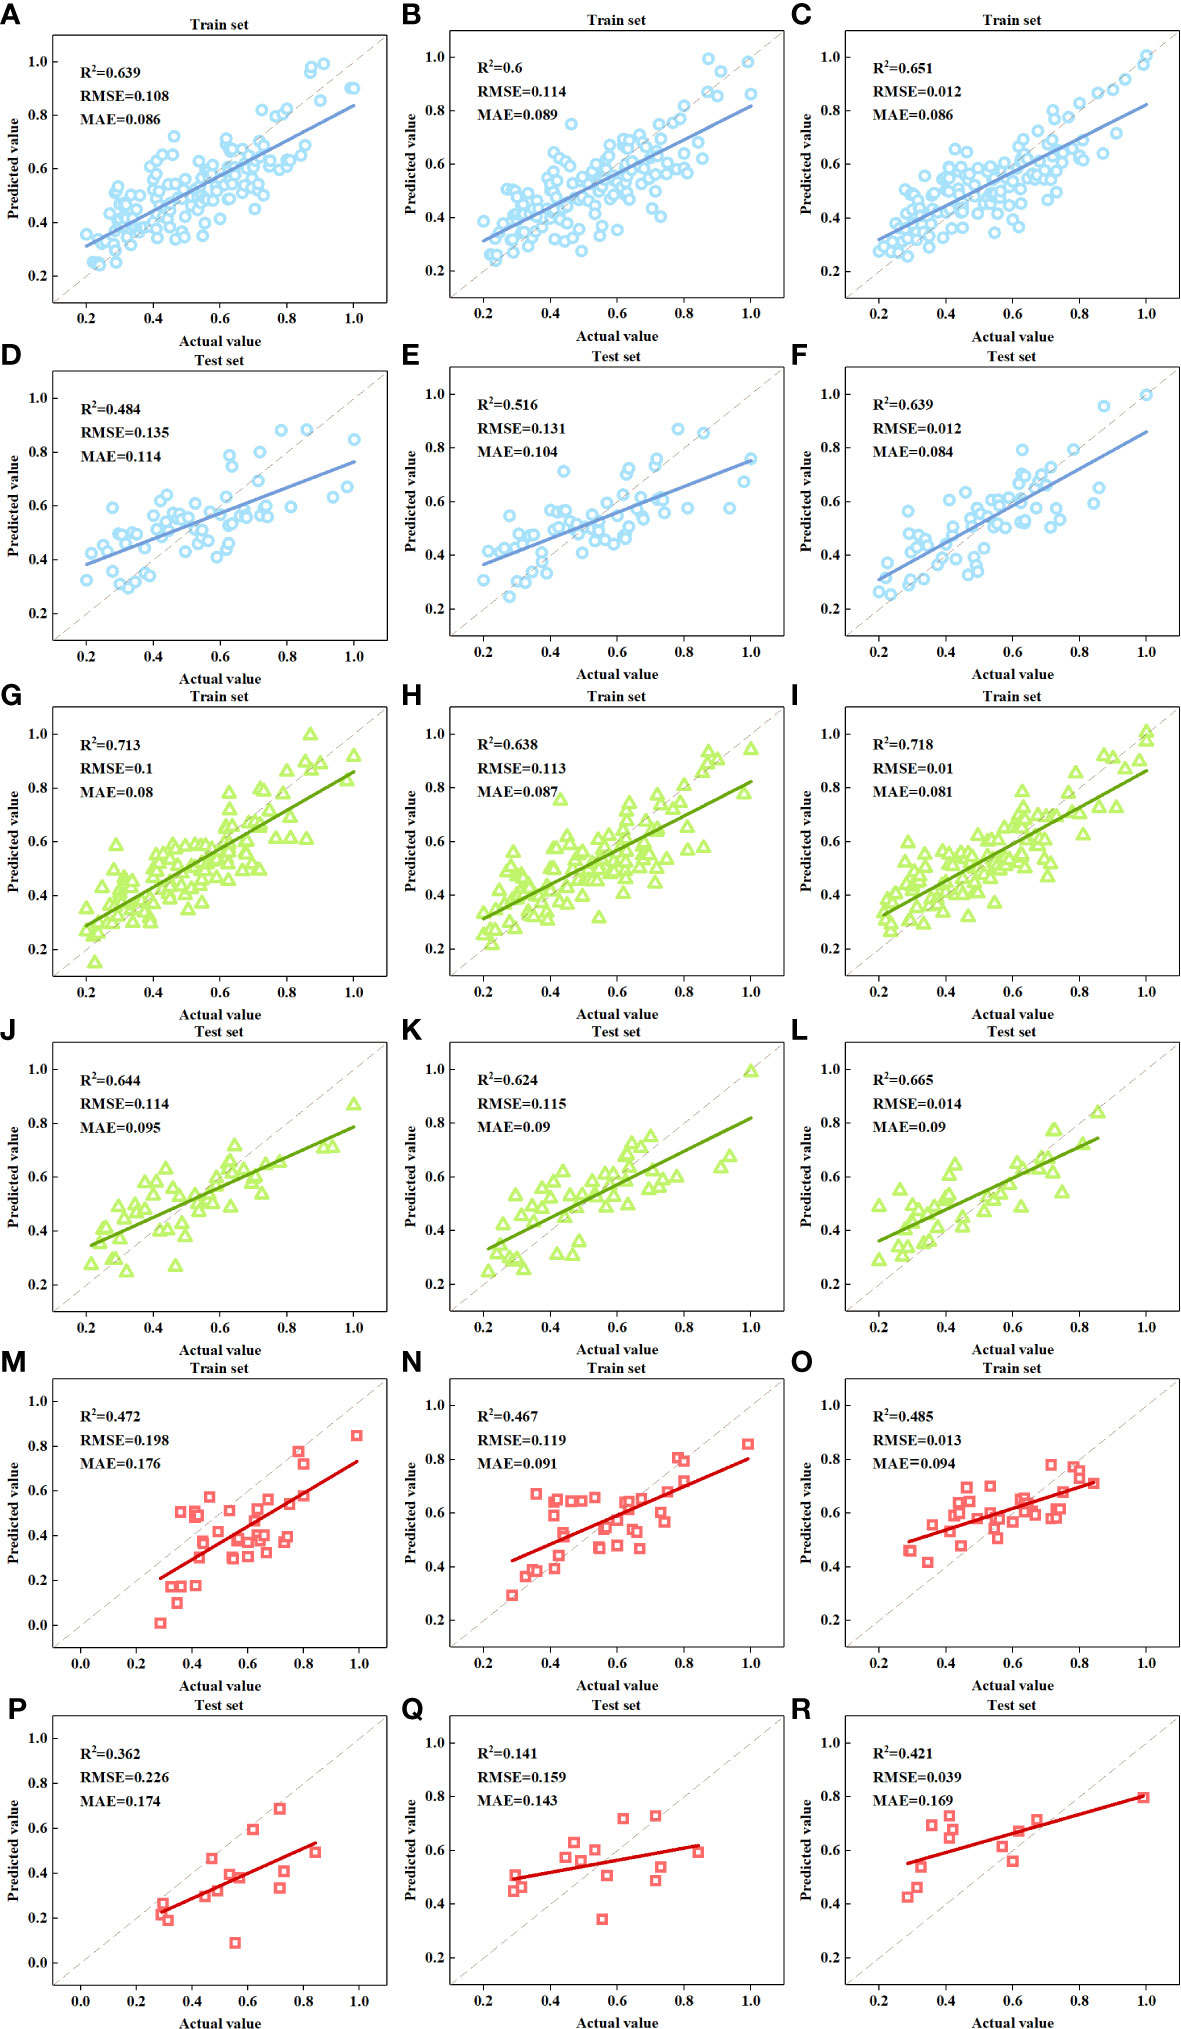
Figure 7 Scatter plots of the actual FDI and the predicted FDI. (A, D). MSI-ALL-MLR model; (B, E). MSI-ALL-SVM model; (C, F). MSI-ALL-NN model; (G, J). MSI-GREEN-MLR model; (H, K). MSI-GREEN-SVM model; (I, L). MSI-GREEN-NN model; (M, P). MSI-RED-MLR model; (N, Q). MSI-RED-SVM model; (O, R). MSI-RED-NN model.
3.4 FDI estimation models based on multisource features
In order to make full use of the information from different data sources, the estimation models were constructed using all selected features from both RGB and multispectral images, as shown in Table 6 and Figure 8. Again, NN remained the best modeling algorithm for each group. In the training sets, The R2 of the NN models for ALL, GREEN, and RED raised to 0.653, 0.722, and 0.592; while the RMSE and MAE decreased to 0.011, 0.009, and 0.009, and to 0.086, 0.074 and 0.082, respectively. Correspondingly, The R2 of NN models in the test sets for each group increased to 0.694, 0.715, and 0.575, respectively; the RMSE dropped to 0.014, 0.014, and 0.018; and the MAE reduced to 0.097, 0.093 and 0.113.
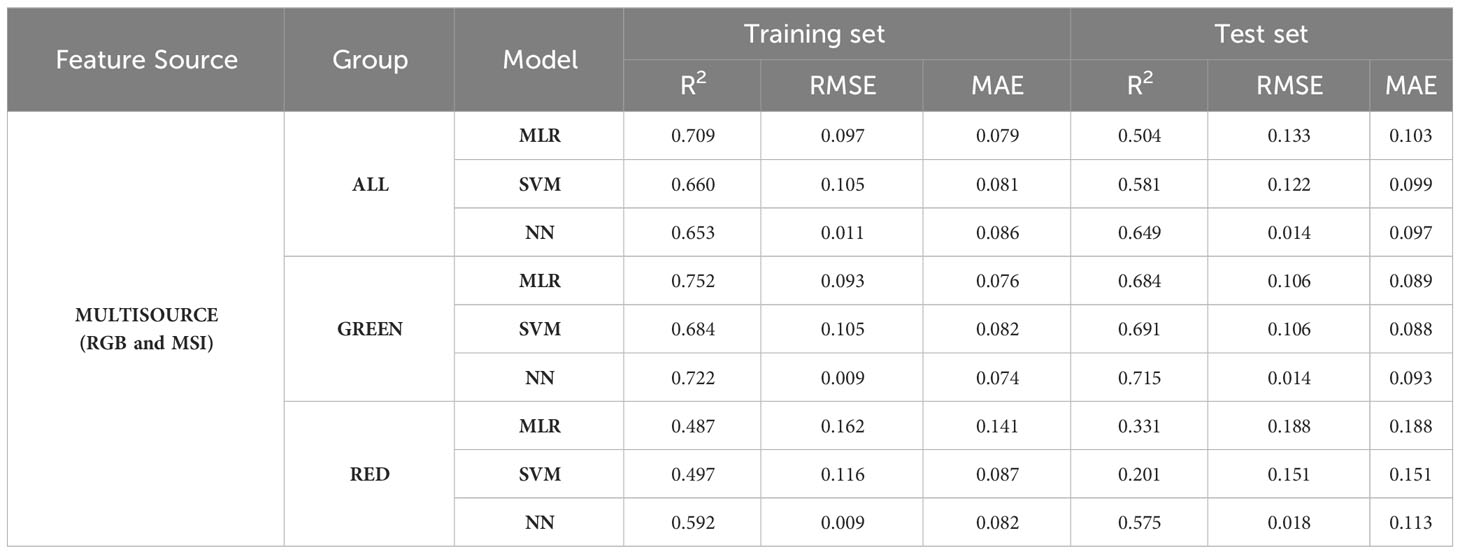
Table 6 Accuracy of the FDI estimation models based on multisource features.
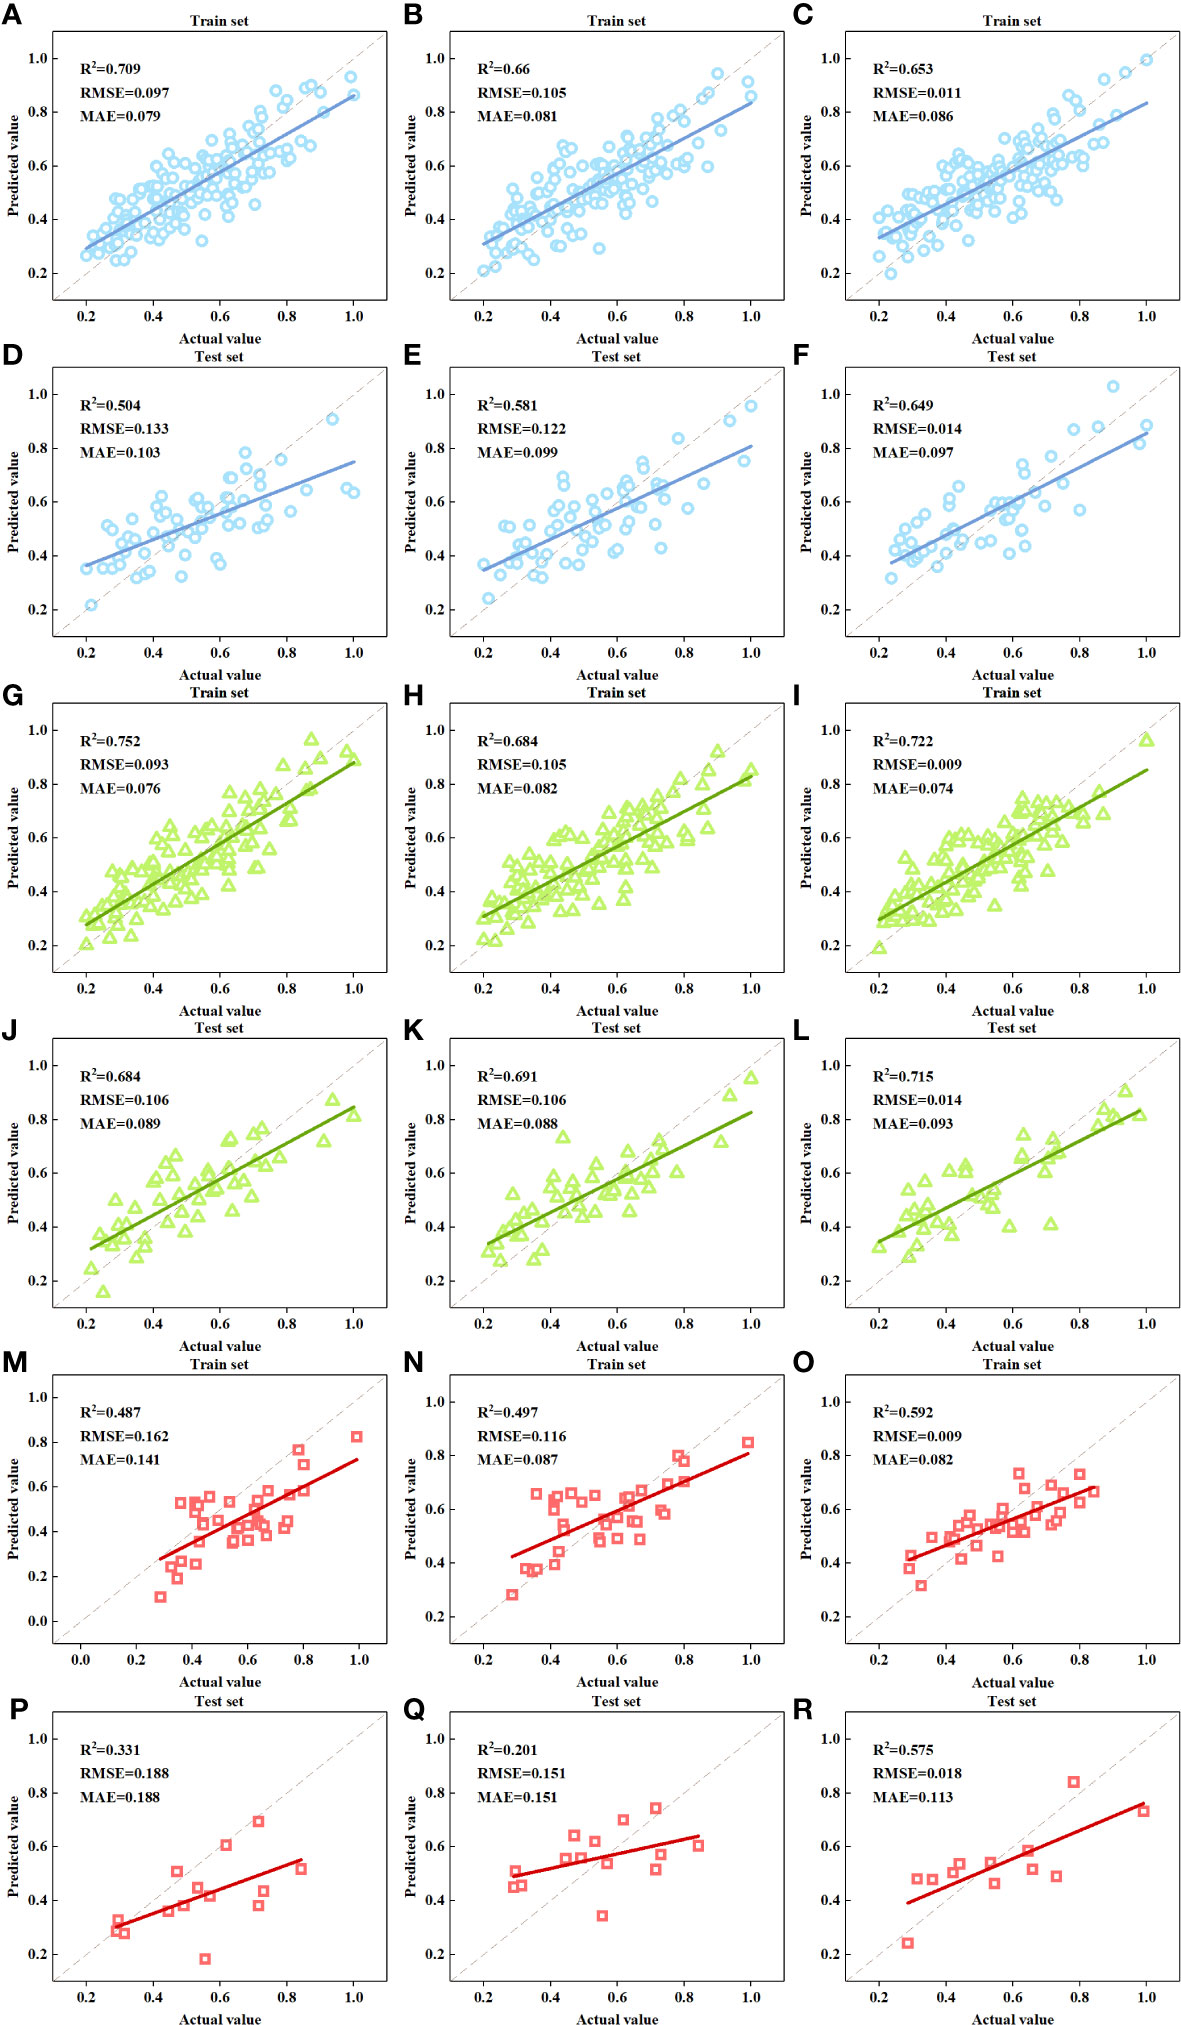
Figure 8 Scatter plots of the actual FDI and the predicted FDI. (A, D). MULTISOURCE-ALL-MLR model; (B, E). MULTISOURCE-ALL-SVM model; (C, F). MULTISOURCE-ALL-NN model; (G, J). MULTISOURCE-GREEN-MLR model; (H, K). MULTISOURCE-GREEN-SVM model; (I, L). MULTISOURCE-GREEN-NN model; (M, P). MULTISOURCE-RED-MLR model; (N, Q). MULTISOURCE-RED-SVM model; (O, R). MULTISOURCE-RED-NN model.
Table 7 illustrates the average accuracy of FDI estimation models with different sensors and groups. It can be seen that the predictive performance of models with multisource features were better than those with the single-source features. Therefore, it can be concluded that the multisource features are helpful in improving the accuracy of FDI prediction.
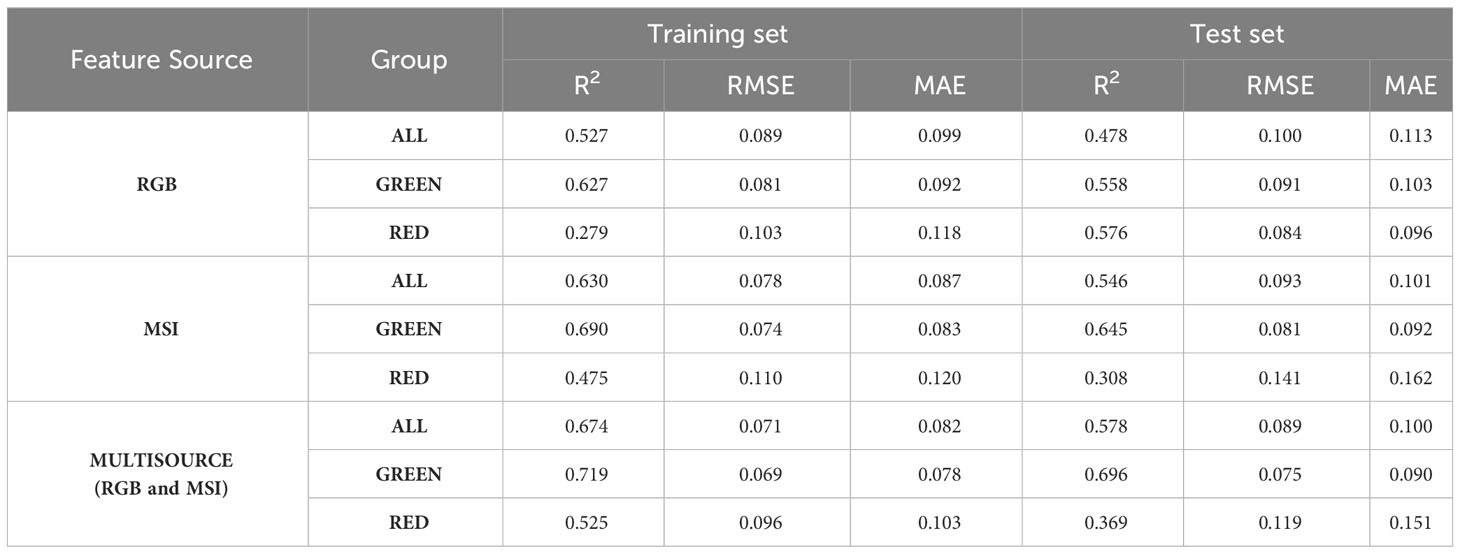
Table 7 The average accuracy of FDI estimation models with different sensors and groups.
4 Discussion
4.1 Response of RGB and multispectral features to FDI of lettuce with different colors
The damage caused by frost on lettuce will change the way how solar radiation interacts with lettuce leaf cells. When frost damage happened, chlorophyll broke down and Photosynthesis was weakened(Choudhury et al., 2019), which would cause the decrease of absorption of visible light, especially the blue and red light which were mainly used for photosynthesis(Gates et al., 1965). In consequence, the reflectance of red and blue bands increased with the FDI. As can be seen in Supplementary Figure 1B and R of RGB image as well as and of MSI were positively correlated with FDI. For the same reason, most of the VIs (including NDVI, SR, EVI, ARVI, and SIPI) that had been proven to be related to chlorophyll content on(Susantoro et al., 2017; Chen et al., 2021; Shu et al., 2022) had significant negative correlation with FDI.
The response of green channel of RGB image (G) and reflectance at green band of MSI () responded quite differently for green and red lettuce. The absolute r of G and of red lettuce were much higher than that of green one. The possible reason is that red lettuce contained much more anthocyanin which absorbed the green light(Yang et al., 2016); when anthocyanins of lettuce decomposed due to frost damage, the absorption of green light was decreased and the reflection was enhanced; therefore, the positive relations between FDI and G and of red lettuce were more significant. For the same reason, the anthocyanin reflectance indexes of MSI, ARI1 and ARI2, which reflected anthocyanin content, was more sensitive to FDI of red lettuce. For green lettuce, the change of color from green to yellow caused by frost damage was obvious. Although G and did not achieve a significant correlation with FDI of the green lettuce, this change could still make the CIs(including GNI, ExG, VARI, ExGR, NGRDI, MGRVI, GLA, RGBVI, and VEG) which enhanced the green component show much closer relation to FDI of the green lettuce than that of the red one.
The destruction of cell structure due to frost damage would cause the decrease of reflectance at NIR band(Gates et al., 1965). As a result, was obviously negative correlation with FDI of all lettuces. The result is similar to that obtained in an experiment evaluating maize frost damage, where it was found that the frost damage caused a sharp decline of reflectance between 720 and 1350 nm(Choudhury et al., 2019).
Although Pearson correlation analysis showed that and were weakly correlated with FDI, the four proposed FD_VIs also showed high correlations with FDI. These improvements were mainly due to the involvement of red edge band (717nm), green band (560nm) and blue band (475nm), on the basis of the near-infrared band (840nm) and red band (668nm). In particular, the correlations between FD_VI4 of all five bands and FDI of green and red lettuce reached the maximum. The possible reason is that canopy spectrum is the result of comprehensive influence of multiple factors such as internal components of leaves and canopy structure, and there are synergistic changes between FDI and the spectrum of these bands.
The correlations between the texture features and the FDI were not significant. One possible reason is that there were many cultivars with different structures in this experiment, and the difference in texture features among cultivars exceeds the difference in texture caused by frost damage.
4.2 Effect of different sensors and algorithms on FDI estimation models of lettuce with different colors
The lettuce FDI estimation models based on MSI features had better performance than those based on RGB image features, which is consistent with previous studies on the vegetation coverage monitoring and nitrogen accumulation estimation of rice (Zheng et al., 2018; Furukawa et al., 2021). It was because that multispectral imager typically captured more information than RGB cameras(Shu et al., 2022). While RGB cameras capture only three color channels, multispectral imagers capture more pronounced changes in reflectance at multiple bands across the electromagnetic spectrum, including near-infrared bands. This allows for the calculation of vegetation indexes that are highly sensitive to changes in plant health and vigor. This additional information can be leveraged to better detect and quantify frost damage. Some relevant studies have proved that RGB images are generally used to monitor the early growth of crops, and the information about near-infrared band provided by multispectral images is more suitable for the later growth of crops(Marcial-Pablo et al., 2019). In addition, the use of multispectral images in some studies enhanced the monitoring of biodiversity(Tait et al., 2019; Wolff et al., 2023). In this research, the monitored field lettuces were already in the harvesting period, and the changes were no longer obvious as in the early growth stage. As a result, the changes captured by the RGB camera were limited. At the same time, many cultivars of lettuce were selected in this study, the diversity of which was suitable for monitoring with a multispectral camera. However, although multispectral imagers had the advantage of high accuracy, RGB cameras could also be an alternative selection for low-cost monitoring of frost damage, for green lettuce at least. The FDI predictive accuracy was further improved by taking the combination of both RGB and multispectral image features as model independent variables, in which way all the information related to frost damage was fully used and the problem of spectrum saturation can be solved(Zhou et al., 2021; Shu et al., 2022). The conclusion that multisource data fusion can improve model accuracy has also been demonstrated in previous studies on crop monitoring(Jiang et al., 2019; Liu et al., 2019; Zhu et al., 2021).
Compared to the models trained based on RED and ALL, the models trained based on GREEN worked better. The major reason for the low accuracy of RED models was that there were only 49 red lettuce plots, and the sample size of red lettuce was too small which led to severe overfitting in most models for RED. In the future studies, the number of red lettuce cultivars should be increased in the selection of experimental cultivars to improve the sample size of the red lettuce dataset. Since green and red lettuces had different levels of secondary metabolites, they presented different colors and produced different responses after frost damage, as manifested in section 3.1. Therefore, the accuracy of models for ALL were not as good as those for GREEN. But even in the best FDI estimation model for GREEN, the RGB and multispectral image features could explain only about 70% of the variation. The differences between lettuces were not only caused by the different frost damage degrees, but also influenced by the different plant morphologies and green levels among different lettuce cultivars. The accuracy of models built by different regression algorithms did not show significant distinction for ALL and GREEN. NN models tended to be more stable than MLR and SVM with less difference of R2 between training and test set.
5 Conclusions
This study showed the feasibility of using features derived from RGB and multispectral images collected by a UAV to estimate lettuce FDI. Especially, the accuracy of models with multisource features were higher than those with single-source features. Notably, the four newly proposed FD_VIs had certain universal correlation with frost damage of lettuce with different colors. The findings could be applied for the prediction and evaluation lettuce resources tolerant to freeze by non-destructive, accurate, and high-throughput identification, providing genetic resources and theoretical basis for the cultivation and genetic improvement of new varieties of lettuce resistant to frost damage in the future. In subsequent works, the impact of differences among cultivars of lettuce on the evaluation of frost damage should be considered, and the sample size of red lettuce should be increased, so as to improve the evaluation models and improve the accuracy of evaluation results.
Data availability statement
Data, models, or codes generated or used in the course of the study are available on GitHub at https://github.com/kwcnmm/predict-FDI.
Author contributions
YL implemented this research and wrote the draft of the manuscript. SB and MT helped formulate research ideas and highlighted research objectives. SW provided research materials and field data. DH and TY provided guidance for technical issues. WL and LL provided constructive suggestions to clarify the expression of ideas. All authors contributed to the article and approved the submitted version.
Funding
The author(s) declare financial support was received for the research, authorship, and/or publication of this article. This study was supported by Shanghai Agriculture Applied Technology Development Program, China (Grant No. G20220401) and SAAS Program for Excellent Research Team (Grant No. 2022015).
Acknowledgments
We would like to thank the relevant workers of Shanghai Agrobiological Gene Center for their extensive assistance in lettuce planting and field investigation. Also, we would like to thank Institute of Agricultural Science and Technology Information of Shanghai Academy of Agricultural Sciences for its financial and equipment support.
Conflict of interest
The authors declare that the research was conducted in the absence of any commercial or financial relationships that could be construed as a potential conflict of interest.
Publisher’s note
All claims expressed in this article are solely those of the authors and do not necessarily represent those of their affiliated organizations, or those of the publisher, the editors and the reviewers. Any product that may be evaluated in this article, or claim that may be made by its manufacturer, is not guaranteed or endorsed by the publisher.
Supplementary material
The Supplementary Material for this article can be found online at: https://www.frontiersin.org/articles/10.3389/fpls.2023.1242948/full#supplementary-material
Supplementary Figure 1 | Pearson correlation analysis between RGB and multispectral image features and FDI.
Supplementary Table 1 | Damage level and description for assessing frost damage of lettuce.
References
Agatonovic-Kustrin, S., Beresford, R. (2000). Basic concepts of artificial neural network (ANN) modeling and its application in pharmaceutical research. J. Pharm. Biomed. Anal. 22 (5), 717–727. doi: 10.1016/S0731-7085(99)00272-1
Bendig, J., Yu, K., Aasen, H., Bolten, A., Bennertz, S., Broscheit, J., et al. (2015). Combining UAV-based plant height from crop surface models, visible, and near infrared vegetation indices for biomass monitoring in barley. Int. J. Appl. Earth Observation Geoinformation 39, 79–87. doi: 10.1016/j.jag.2015.02.012
Blackburn, G. (1998). Spectral indices for estimating photosynthetic pigment concentrations: a test using senescent tree leaves. Int. J. Remote Sens. 19 (4), 657–675. doi: 10.1080/014311698215919
Camargo Neto, J. (2004). A combined statistical-soft computing approach for classification and mapping weed species in minimum -tillage systems (Lincoln, Nebraska, United States: Ph.D, University of Nebraska - Lincoln).
Chen, S., Gao, Y., Fan, K., Shi, Y., Luo, D., Shen, J., et al. (2021). Prediction of drought-induced components and evaluation of drought damage of tea plants based on hyperspectral imaging. Front. Plant Sci. 12. doi: 10.3389/fpls.2021.695102
Chen, Y., Sidhu, H., Kaviani, M., McElroy, M., Pozniak, C., Navabi, A. (2019). Application of image-based phenotyping tools to identify QTL for in-field winter survival of winter wheat (Triticum aestivum L.). Theor. Appl. Genet. 132 (9), 2591–2604. doi: 10.1007/s00122-019-03373-6
Choudhury, B., Webster, R., Sharma, V., Goswami, J., Meetei, T., Krishnappa, R., et al. (2019). Frost damage to maize in northeast India: assessment and estimated loss of yield by hyperspectral proximal remote sensing. J. Appl. Remote Sens. 13 (4), 44527. doi: 10.1117/1.JRS.13.044527
Concepcion, R., Lauguico, S., Siphengphet, K., Alejandrino, J., Dadios, E., Bandala, A. (2020). “Variety classification of Lactuca sativa seeds using single-kernel RGB images and spectro-textural-morphological feature-based machine learning,” in IEEE 12th International Conference on Humanoid, Nanotechnology, Information Technology, Communication and Control, Environment, and Management (HNICEM)). (New York, United States: IEEE).
Cortes, C., Vapnik, V. (1995). Support-vector networks. Mach. Learn. 20 (3), 273–297. doi: 10.1007/BF00994018
Dammer, K., Möller, B., Rodemann, B., Heppner, D. (2011). Detection of head blight (Fusarium ssp.) in winter wheat by color and multispectral image analyses. Crop Prot. 30 (4), 420–428. doi: 10.1016/j.cropro.2010.12.015
Feng, M., Yang, W., Cao, L., Ding, G. (2009). Monitoring winter wheat freeze injury using multi-temporal MODIS data. Agric. Sci. China 8 (9), 1053–1062. doi: 10.1016/s1671-2927(08)60313-2
Fernandez-Trujillo, J. P., Cano, A., Artes, F. (1998). Physiological changes in peaches related to chilling injury and ripening. Postharvest Biol. Technol. 13 (2), 109–119. doi: 10.1016/s0925-5214(98)00006-4
Fitzgerald, G., Rodriguez, D., O'Leary, G. (2010). Measuring and predicting canopy nitrogen nutrition in wheat using a spectral index-The canopy chlorophyll content index (CCCI). Field Crops Res. 116 (3), 318–324. doi: 10.1016/j.fcr.2010.01.010
Francini, A., Sebastiani, L. (2019). Abiotic stress effects on performance of horticultural crops. Horticulturae 5 (4), 67. doi: 10.3390/horticulturae5040067
Furukawa, F., Laneng, L. A., Ando, H., Yoshimura, N., Kaneko, M., Morimoto, J. (2021). Comparison of RGB and multispectral unmanned aerial vehicle for monitoring vegetation coverage changes on a landslide area. Drones 5 (3), 97. doi: 10.3390/drones5030097
Gabbrielli, M., Corti, M., Nicola, F., Maro, P., Bechini, L. (2022a). “Detection of winterkill events of white mustard (Sinapis alba L.) by satellite-based remote sensing,” in Book of abstract (Bolzano, Italy: Unibz), 1–1.
Gabbrielli, M., Corti, M., Perfetto, M., Fassa, V., Bechini, L. (2022b). Satellite-based frost damage detection in support of winter cover crops management: a case study on white mustard. Agronomy-Basel 12 (9), 2025. doi: 10.3390/agronomy12092025
Gamon, J., Surfus, J. (1999). “Assessing leaf pigment content and activity with a reflectometer,” in Proceedings of the 4th New Phytologist Symposium on At the Crossroads of Plant Physiology and Ecology, at the Meeting of the ENSA-M: New Phytologist. (Hoboken, New Jersey, United States: Wiley), 105–117.
Gates, D., Keegan, H., Schleter, J., Weidner, V. (1965). Spectral properties of plants. Appl. Optics 4 (1), 11–20. doi: 10.1364/AO.4.000011
Gitelson, A., Kaufman, Y., Merzlyak, M. (1996). Use of a green channel in remote sensing of global vegetation from EOS-MODIS. Remote Sens. Environ. 58 (3), 289–298. doi: 10.1016/S0034-4257(96)00072-7
Gitelson, A., Kaufman, Y., Stark, R., Rundquist, D. (2002). Novel algorithms for remote estimation of vegetation fraction. Remote Sens. Environ. 80 (1), 76–87. doi: 10.1016/S0034-4257(01)00289-9
Gitelson, A., Keydan, G., Merzlyak, M. (2006). Three-band model for noninvasive estimation of chlorophyll, carotenoids, and anthocyanin contents in higher plant leaves. Geophysical Res. Lett. 33 (11), L11402. doi: 10.1029/2006GL026457
Gitelson, A., Merzlyak, M., Chivkunova, O. (2001a). Optical properties and nondestructive estimation of anthocyanin content in plant leaves. Photochem. Photobiol. 74 (1), 38–45. doi: 10.1562/0031-8655(2001)074<0038:OPANEO>2.0.CO;2
Gitelson, A., Merzlyak, M., Zur, Y., Stark, R., Gritz, U. (2001b). “Non-destructive and remote sensing techniques for estimation of vegetation status,” in Proceedings of the 3rd European Conference on Precision Agriculture: Papers in Natural Resources. (Montpelier, France: L'Institut Agro Montpellier), 273.
Gitelson, A., Viña, A., Ciganda, V., Rundquist, D., Arkebauer, T. (2005). Remote estimation of canopy chlorophyll content in crops. Geophysical Res. Lett. 32 (8), L08403. doi: 10.1029/2005GL022688
González-Aguilar, G. A., Tiznado-Hernández, M. E., Zavaleta-Gatica, R., Martínez-Téllez, M. A. (2004). Methyl jasmonate treatments reduce chilling injury and activate the defense response of guava fruits. Biochem. Biophys. Res. Commun. 313 (3), 694–701. doi: 10.1016/j.bbrc.2003.11.165
Goswami, J., Sharma, V., Chaudhury, B., Raju, P. (2019). Rapid identification of abiotic stress (frost) in in-filed maize crop using UAV remote sensing. Int. Arch. Photogrammetry Remote Sens. Spatial Inf. Sci. XLII-3/W6, 467–471. doi: 10.5194/isprs-archives-XLII-3-W6-467-2019
Guo, Q., Li, J., Yu, W., Zhang, H. (2014). Study on hyperspectral sensitivity index of winter wheat after freezing injury at mid winter period. Chin. J. Agrometeorol. 35 (06), 708–716. doi: 10.3969/j.issn.1000-6362.2014.06.015
Hague, T., Tillett, N., Wheeler, H. (2006). Automated crop and weed monitoring in widely spaced cereals. Precis. Agric. 7 (1), 21–32. doi: 10.1007/s11119-005-6787-1
Han, Y., Li, Y., Fan, S., Liu, C., Hao, J., Chen, Q., et al. (2014). “Screening and identification of lettuce germplasm for tolerance to high and low temperature,” in Proceedings of the 29th International Horticultural Congress on Horticulture - Sustaining Lives, Livelihoods and Landscapes (IHC) / International Symposium on Plant Breeding in Horticulture (Belgium: Acta Horticulturae), 381–387.
Huete, A., Justice, C., Liu, H. (1994). Development of vegetation and soil indices for MODIS-EOS. Remote Sens. Environ. 49 (3), 224–234. doi: 10.1016/0034-4257(94)90018-3
Huete, A., Justice, C., Van Leeuwen, W. (1999). MODIS vegetation index (MOD13)". (Algorithm Theoretical Basis Document Version 3.1). (Tucson, USA: Vegetation Index & Phenology Lab). Available at: https://www.cen.uni-hamburg.de/en/icdc/data/land/docs-land/modis-collection6-vegetation-index-atbd-mod13-v03-1.pdf.
Huete, A., Liu, H., Batchily, K., Van Leeuwen, W. (1997). A comparison of vegetation indices over a global set of TM images for EOS-MODIS. Remote Sens. Environ. 59 (3), 440–451. doi: 10.1016/S0034-4257(96)00112-5
Jełowicki, L., Sosnowicz, K., Ostrowski, W., Osińska-Skotak, K., Bakuła, K. (2020). Evaluation of rapeseed winter crop damage using UAV-based multispectral imagery. Remote Sens. 12 (16), 2618. doi: 10.3390/rs12162618
Jenni, S. (2005). Rib discoloration: A physiological disorder induced by heat stress in crisphead lettuce. HortScience 40 (7), 2031–2035. doi: 10.21273/HORTSCI.40.7.2031
Jiang, Q., Fang, S. H., Peng, Y., Gong, Y., Zhu, R. S., Wu, X. T., et al. (2019). UAV-based biomass estimation for rice-combining spectral, TIN-based structural and meteorological features. Remote Sens. 11 (7), 890. doi: 10.3390/rs11070890
Jiang, J. L., Johansen, K., Stanschewski, C. S., Wellman, G., Mousa, M. A. A., Fiene, G. M., et al. (2022). Phenotyping a diversity panel of quinoa using UAV-retrieved leaf area index, SPAD-based chlorophyll and a random forest approach. Precis. Agric. 23 (3), 961–983. doi: 10.1007/s11119-021-09870-3
Johansen, K., Morton, M. J. L., Malbeteau, Y., Aragon, B., Al-Mashharawi, S., Ziliani, M., et al. (2019). Predicting biomass and yield at harvest of salt-stressed tomato plants using UAV imagery. Int. Arch. Photogramm. Remote Sens. Spatial Inf. Sci. XLII-2/W13, 407–411. doi: 10.5194/isprs-archives-XLII-2-W13-407-2019
Kawashima, S., Nakatani, M. (1998). An algorithm for estimating chlorophyll content in leaves using a video camera. Ann. Bot. 81 (1), 49–54. doi: 10.1006/anbo.1997.0544
Kim, C., Van Iersel, M. W. (2023). Image-based phenotyping to estimate anthocyanin concentrations in lettuce. Front. Plant Sci. 14. doi: 10.3389/fpls.2023.1155722
Lassalle, G. (2021). Monitoring natural and anthropogenic plant stressors by hyperspectral remote sensing: Recommendations and guidelines based on a meta-review. Sci. Total Environ. 788, 147758. doi: 10.1016/j.scitotenv.2021.147758
Li, W., Huang, J., Yang, L., Chen, Y., Fang, Y., Jin, H., et al. (2021). A practical remote sensing monitoring framework for late frost damage in wine grapes using multi-source satellite data. Remote Sens. 13 (16), 3231. doi: 10.3390/rs13163231
Liu, Y., Liu, S., Li, J., Guo, X., Wang, S., Lu, J. (2019). Estimating biomass of winter oilseed rape using vegetation indices and texture metrics derived from UAV multispectral images. Comput. Electron. Agric. 166, 105026. doi: 10.1016/j.compag.2019.105026
Liu, Z., Liu, H., Luo, C., Yang, H., Meng, X., Ju, Y., et al. (2020). Rapid extraction of regional-scale agricultural disasters by the standardized monitoring model based on google earth engine. Sustainability 12 (16), 6497. doi: 10.3390/su12166497
Louhaichi, M., Borman, M., Johnson, D. (2001). Spatially located platform and aerial photography for documentation of grazing impacts on wheat. Geocarto Int. 16 (1), 65–70. doi: 10.1080/10106040108542184
Macedo-Cruz, A., Pajares, G., Santos, M., Villegas-Romero, I. (2011). Digital image sensor-based assessment of the status of oat (Avena sativa L.) crops after frost damage. Sensors 11 (6), 6015–6036. doi: 10.3390/s110606015
Mao, W., Wang, Y., Wang, Y. (2003). “Real-time detection of between-row weeds using machine vision,” in 2003 ASAE Annual Meeting. (Michigan, United States: American Society of Agricultural and Biological Engineers), 031004.
Marcial-Pablo, M. D., Gonzalez-Sanchez, A., Jimenez-Jimenez, S. I., Ontiveros-Capurata, R. E., Ojeda-Bustamante, W. (2019). Estimation of vegetation fraction using RGB and multispectral images from UAV. Int. J. Remote Sens. 40 (2), 420–438. doi: 10.1080/01431161.2018.1528017
Marin, D., Araújo, G., Feraz, S., Schwerz, F., Barata, R., Faria, R., et al. (2022). “Analysis of the potential of remote piloted aircraft in the detection of damage by frost in coffee plants,” in 8th International Engineering, Sciences and Technology Conference (IESTEC). (Los Alamitos, United States: IEEE Computer Soc), 654–658.
Marin, D., Ferraz, G., Schwerz, F., Barata, R., Faria, R., Dias, J. (2021). Unmanned aerial vehicle to evaluate frost damage in coffee plants. Precis. Agric. 22 (6), 1845–1860. doi: 10.1007/s11119-021-09815-w
Merzlyak, M., Gitelson, A., Chivkunova, O., Rakitin, V. (1999). Non-destructive optical detection of pigment changes during leaf senescence and fruit ripening. Physiologia Plantarum 106 (1), 135–141. doi: 10.1034/j.1399-3054.1999.106119.x
Meyer, G., Neto, J. (2008). Verification of color vegetation indices for automated crop imaging applications. Comput. Electron. Agric. 63 (2), 282–293. doi: 10.1016/j.compag.2008.03.009
Millan, V., Rankine, C., Sanchez-Azofeifa, G. (2020). Crop loss evaluation using digital surface models from unmanned aerial vehicles data. Remote Sens. 12 (6), 981. doi: 10.3390/rs12060981
Murphy, M., Boruff, B., Callow, J., Flower, K. (2020). Detecting frost stress in wheat: a controlled environment hyperspectral study on wheat plant components and implications for multispectral field sensing. Remote Sens. 12 (3), 477. doi: 10.3390/rs12030477
Pan, L. Q., Zhang, Q., Zhang, W., Sun, Y., Hu, P. C., Tu, K. (2016). Detection of cold injury in peaches by hyperspectral reflectance imaging and artificial neural network. Food Chem. 192, 134–141. doi: 10.1016/j.foodchem.2015.06.106
Pearson, R., Miller, L. (1972). Remote mapping of standing crop biomass for estimation of the productivity of the shortgrass prairie (Ann Arbor, Michigan, United States: Remote Sensing of Environment, VIII: Willow Run Laboratories, Environmental Research Institute of Michigan), 1355.
Peñuelas, J., Filella, I., Gamon, J. (1995). Assessment of photosynthetic radiation-use efficiency with spectral reflectance. New Phytol. 131 (3), 291–296. doi: 10.1111/j.1469-8137.1995.tb03064.x
Peñuelas, J., Gamon, J., Fredeen, A., Merino, J., Field, C. (1994). Reflectance indices associated with physiological changes in nitrogen-and water-limited sunflower leaves. Remote Sens. Environ. 48 (2), 135–146. doi: 10.1016/0034-4257(94)90136-8
Perry, E., Nuttall, J., Wallace, A., Delahunty, A., Barlow, K. (2017a). “Evaluating canopy reflectance for assessment of frost damage in wheat,” in Proceedings of the 18th ASA Conference. (Ballarat, Australia: Australian Society of Agronomy), 1–4.
Perry, E., Nuttall, J., Wallace, A., Fitzgerald, G. (2017b). In-field methods for rapid detection of frost damage in Australian dryland wheat during the reproductive and grain-filling phase. Crop Pasture Sci. 68 (6), 516–526. doi: 10.1071/cp17135
Pham, F., Raheja, A., Bhandari, S. (2019). “Machine learning models for predicting lettuce health using UAV imageries,” in Autonomous Air and Ground Sensing Systems for Agricultural Optimization and Phenotyping IV. (Bellingham, Washington, United States: Spie-Int Soc Optical Engineering).
Pirinc, V., Alas, E. (2021). The effects of applying natural plant antifreeze under low temperature conditions on lettuce (Lactuca sativa L.) yield and quality. Appl. Ecol. Environ. Res. 19 (4), 2963–2970. doi: 10.15666/aeer/1904_29632970
Porat, R., Pavoncello, D., Peretz, J., Ben-Yehoshua, S., Lurie, S. (2000). Effects of various heat treatments on the induction of cold tolerance and on the postharvest qualities of 'Star Ruby' grapefruit. Postharvest Biol. Technol. 18 (2), 159–165. doi: 10.1016/s0925-5214(99)00075-7
Romani, L., Goncalves, R., Amaral, B., Chino, D., Zullo, J., Traina, C., et al. (2011). “Clustering analysis applied to NDVI/NOAA multitemporal images to improve the monitoring process of sugarcane crops,” in 2011 6th International Workshop on the Analysis of Multi-temporal Remote Sensing Images (Multi-Temp). (New York, United States: IEEE).
Romanov, P. (2009). “Satellite-derived information on snow cover for agriculture applications in Ukraine,” in Advanced research workshop on using satellite and in situ data to improve sustainability (Dordrecht, Netherlands: Springer), 81–91.
Romero, M., Luo, Y., Su, B., Fuentes, S. (2018). Vineyard water status estimation using multispectral imagery from an UAV platform and machine learning algorithms for irrigation scheduling management. Comput. Electron. Agric. 147, 109–117. doi: 10.1016/j.compag.2018.02.013
Rouse, J., Jr., Haas, R., Schell, J., Deering, D. (1973). Monitoring the vernal advancement and retrogradation (green wave effect) of natural vegetation (Washington D.C., United States: NASA Technical Reports Server (NTRS)).
Rudorff, B., Aguiar, D., Adami, M., Salgado, M. (2012). “Frost damage detection in sugarcane crop using MODIS images and SRTM data,” in IEEE International Geoscience and Remote Sensing Symposium (IGARSS)). (New York, United States: IEEE), 5709–5712.
Shah, A., Dubey, A., Hemnani, V., Gala, D., Kalbande, D. (2018). “Smart farming system: crop yield prediction using regression techniques,” in Proceedings of International Conference on Wireless Communication, ICWICOM 2017. (Switzerland: Springer Singapore), 49–56.
Shatilov, M., Razin, A., Ivanova, M. (2019). Analysis of the world lettuce market. IOP Conf. Ser. Earth Environ. Sci. 395, 12053. doi: 10.1088/1755-1315/395/1/012053
She, B., Huang, J., Guo, R., Wang, H., Wang, J. (2015). Assessing winter oilseed rape freeze injury based on Chinese HJ remote sensing data. J. Zhejiang University-Science B 16 (2), 131–144. doi: 10.1631/jzus.B1400150
She, B., Huang, J., Zhang, D., Huang, L. (2017). Assessing and characterizing oilseed rape freezing injury based on MODIS and MERIS data. Int. J. Agric. Biol. Eng. 10 (3), 143–157. doi: 10.3965/j.ijabe.20171003.2721
Shi, M., Gu, J., Wu, H., Rauf, A., Emran, T., Khan, Z., et al. (2022). Phytochemicals, nutrition, metabolism, bioavailability, and health benefits in lettuce-a comprehensive review. Antioxidants 11 (6), 1158. doi: 10.3390/antiox11061158
Shu, M., Fei, S., Zhang, B., Yang, X., Guo, Y., Li, B., et al. (2022). Application of UAV multisensor data and ensemble approach for high-throughput estimation of maize phenotyping traits. Plant Phenomics 2022, 9802585. doi: 10.34133/2022/9802585
Sims, D., Gamon, J. (2002). Relationships between leaf pigment content and spectral reflectance across a wide range of species, leaf structures and developmental stages. Remote Sens. Environ. 81 (2-3), 337–354. doi: 10.1016/S0034-4257(02)00010-X
Soldatenko, A., Pivovarov, V., Razin, A., Meshcheryakova, R., Shatilov, M., Ivanova, M., et al. (2018). The economy of vegetable growing: the state and the present. Vegetable Crops Russia 5), 63–68. doi: 10.18619/2072-9146-2018-5-63-68
Susantoro, T., Wikantika, K., Saepuloh, A., Harsolumakso, A. (2017). “Selection of vegetation indices for mapping the sugarcane condition around the oil and gas field of North West Java Basin, Indonesia,” in Proceedings of the 4th International Symposium on LAPAN-IPB Satellite for Food Security and Environmental Monitoring (LISAT-FSEM): IOP Conference Series-Earth and Environmental Science. (Amsterdam, Netherlands: Elsevier Science BV), 012001.
Tait, L., Bind, J., Charan-Dixon, H., Hawes, I., Pirker, J., Schiel, D. (2019). Unmanned aerial vehicles (UAVs) for monitoring macroalgal biodiversity: comparison of RGB and multispectral imaging sensors for biodiversity assessments. Remote Sens. 11 (19), 2332. doi: 10.3390/rs11192332
Tao, M., He, Y., Bai, X., Chen, X., Wei, Y., Peng, C., et al. (2022). Combination of spectral index and transfer learning strategy for glyphosate-resistant cultivar identification. Front. Plant Sci. 13. doi: 10.3389/fpls.2022.973745
Tucker, C. (1979). Red and photographic infrared linear combinations for monitoring vegetation. Remote Sens. Environ. 8 (2), 127–150. doi: 10.1016/0034-4257(79)90013-0
Turini, T., Cahn, M., Cantwell, M., Jackson, L., Koike, S., Natwick, E., et al. (2011). Iceberg lettuce production in California (California, United States: University of California Agriculture and Natural Resources), 7215. doi: 10.3733/ucanr.7215
Wang, H., Qin, F., Liu, Q., Ruan, L., Wang, R., Ma, Z., et al. (2015). Identification and disease index inversion of wheat stripe rust and wheat leaf rust based on hyperspectral data at canopy level. J. Spectrosc. 2015, 1–10. doi: 10.1155/2015/651810
Wang, H., Wang, J., Dong, Y., Gu, X., Huo, Z. (2014). Monitoring freeze stress levels on winter wheat from hyperspectral reflectance data using principal component analysis. Spectrosc. Spectral Anal. 34 (5), 1357–1361. doi: 10.3964/j.issn.1000-0593(2014)05-1357-05
Wang, Z., Yang, R., Liang, Y., Zhang, S., Zhang, Z., Sun, C., et al. (2022). Comparing efficacy of different biostimulants for hydroponically grown lettuce (Lactuca sativa L.). Agronomy-Basel 12 (4), 786. doi: 10.3390/agronomy12040786
Woebbecke, D., Meyer, G., Von Bargen, K., Mortensen, D. (1995). Color indices for weed identification under various soil, residue, and lighting conditions. Trans. ASAE 38 (1), 259–269. doi: 10.13031/2013.27838
Wójtowicz, M., Wójtowicz, A., Piekarczyk, J. (2016). Application of remote sensing methods in agriculture. Commun. Biometry Crop Sci. 11 (1), 31–50. Available at: http://agrobiol.sggw.pl/~cbcs/content_11_1.php.
Wolff, F., Kolari, T. H. M., Villoslada, M., Tahvanainen, T., Korpelainen, P., Zamboni, P. A. P., et al. (2023). RGB vs. Multispectral imagery: Mapping aapa mire plant communities with UAVs. Ecol. Indic. 148, 110140. doi: 10.1016/j.ecolind.2023.110140
Yang, H., Wu, F., Cheng, J. (2011). Reduced chilling injury in cucumber by nitric oxide and the antioxidant response. Food Chem. 127 (3), 1237–1242. doi: 10.1016/j.foodchem.2011.02.011
Yang, W., Yang, C., Hao, Z., Xie, C., Li, M. (2019). Diagnosis of plant cold damage based on hyperspectral imaging and convolutional neural network. IEEE Access 7, 118239–118248. doi: 10.1109/access.2019.2936892
Yang, X., Zhang, J., Guo, D., Xiong, X., Chang, L., Niu, Q., et al. (2016). “Measuring and evaluating anthocyanin in lettuce leaf based on color information,” in Proceedings of the 5th IFAC Conference on Sensing, Control and Automation Technologies for Agriculture (AGRICONTROL): IFAC-PapersOnLine. (Amsterdam Netherlands: Elsevier Science BV) 96–99.
Yu, D., Lee, H. (2020). Evaluation of freezing injury in temperate fruit trees. Horticulture Environ. Biotechnol. 61 (5), 787–794. doi: 10.1007/s13580-020-00264-4
Zhang, L., Han, W., Niu, Y., Chávez, J., Shao, G., Zhang, H. (2021). Evaluating the sensitivity of water stressed maize chlorophyll and structure based on UAV derived vegetation indices. Comput. Electron. Agric. 185, 106174. doi: 10.1016/j.compag.2021.106174
Zhang, Y., Zhao, Z., Zheng, J. (2022). Estimation of reference crop evapotranspiration under different combination of meteorological elements using multivariate adaptive regression splines. Geomatics Inf. Sci. Wuhan Univ. 47 (5), 789–798. doi: 10.13203/j.whugis20190337
Zhao, Z., Jiang, W., Cao, J., Zhao, Y., Gu, Y. (2006). Effect of cold-shock treatment on chilling injury in mango (Mangifera indica L. cv. Wacheng) fruit. J. Sci. Food Agric. 86 (14), 2458–2462. doi: 10.1002/jsfa.2640
Zheng, H. B., Cheng, T., Li, D., Zhou, X., Yao, X., Tian, Y. C., et al. (2018). Evaluation of RGB, color-infrared and multispectral images acquired from unmanned aerial systems for the estimation of nitrogen accumulation in rice. Remote Sens. 10 (6), 824. doi: 10.3390/rs10060824
Zheng, H., Zhou, X., He, J., Yao, X., Cheng, T., Zhu, Y., et al. (2020). Early season detection of rice plants using RGB, NIR-G-B and multispectral images from unmanned aerial vehicle (UAV). Comput. Electron. Agric. 169, 105223. doi: 10.1016/j.compag.2020.105223
Zhou, Y., Lao, C., Yang, Y., Zhang, Z., Chen, H., Chen, Y., et al. (2021). Diagnosis of winter-wheat water stress based on UAV-borne multispectral image texture and vegetation indices. Agric. Water Manage. 256, 107076. doi: 10.1016/j.agwat.2021.107076
Keywords: lettuce, frost damage, unmanned aerial vehicle, high-throughput detection, multisource data
Citation: Liu Y, Ban S, Wei S, Li L, Tian M, Hu D, Liu W and Yuan T (2024) Estimating the frost damage index in lettuce using UAV-based RGB and multispectral images. Front. Plant Sci. 14:1242948. doi: 10.3389/fpls.2023.1242948
Received: 20 June 2023; Accepted: 11 December 2023;
Published: 04 January 2024.
Edited by:
Jiangang Liu, Chinese Academy of Agricultural Sciences (CAAS), ChinaReviewed by:
Magdi A. A. Mousa, King Abdulaziz University, Saudi ArabiaKaransher Singh Sandhu, Bayer Crop Science, United States
Copyright © 2024 Liu, Ban, Wei, Li, Tian, Hu, Liu and Yuan. This is an open-access article distributed under the terms of the Creative Commons Attribution License (CC BY). The use, distribution or reproduction in other forums is permitted, provided the original author(s) and the copyright owner(s) are credited and that the original publication in this journal is cited, in accordance with accepted academic practice. No use, distribution or reproduction is permitted which does not comply with these terms.
*Correspondence: Minglu Tian, dGlhbm1pbmdsdUBzYWFzLnNoLmNu
†These authors have contributed equally to this work
‡These authors share first authorship