- 1School of Pharmacy, Anhui University of Chinese Medicine, Hefei, China
- 2Institute of Systems Biology, Universiti Kebangsaan Malaysi, Bangi, Malaysia
- 3Joint Research Center for Chinese Herbal Medicine of Anhui of IHM, Anhui University of Chinese Medicine, Hefei, China
- 4School of Life Sciences, Anhui University of Chinese Medicine, Hefei, China
- 5Department of Research and Development, Functional Activity and Resource Utilization on Edible and Medicinal Fungi Joint Laboratory of Anhui Province, Jinzhai, China
Climate change has significantly impacted the distribution patterns of medicinal plants, highlighting the need for accurate models to predict future habitat shifts. In this study, the Maximum Entropy model to analyze the habitat distribution of Pulsatilla chinensis (Bunge) Regel under current conditions and two future climate scenarios (SSP245 and SSP585). Based on 105 occurrence records and 12 environmental variables, precipitation of the wettest quarter, isothermality, average November temperature, and the standard deviation of temperature seasonality were identified as key factors influencing the habitat suitability for P. chinensis. The reliability of the model was supported by a mean area under the curve (AUC) value of 0.916 and a True Skill Statistic (TSS) value of 0.608. The results indicated that although the total suitable habitat for P. chinensis expanded under both scenarios, the highly suitable area contracted significantly under SSP585 compared to SSP245. This suggests the importance of incorporating climate change considerations into P. chinensis management strategies to address potential challenges arising from future ecosystem dynamics.
1 Introduction
As carbon emissions continue to rise, global warming has gradually become an irreversible trend. Under this influence, China’s climate and environment have undergone significant changes, including rising average annual temperatures and shifting precipitation patterns. Studies indicate that from 1951 to 2021, the average annual temperature in China increased by 0.26°C per decade, while annual precipitation rose by 5.5 mm per decade, accompanied by a northward shift in the primary rainy zone (Ren et al., 2021). The growth, development, and distribution status of plants are typically closely associated with climate (Huang et al., 2024; Ni and Vellend, 2024). Consequently, climate change will inevitably lead to some degree of alteration in species habitats (Li et al., 2019; Wouyou et al., 2022). For example, due to climate change, the range of Gymnadenia conopsea (L.) R. Br. is expected to contract and gradually shift to higher altitudes, such as those in Tibet and Yunnan (Cha et al., 2024). Similarly, the suitable area of Paris polyphylla var. yunnanensis (Franch.) Hand.-Mzt. is also expected to shrink significantly under future high greenhouse gas emission scenarios, with its center of mass shifting toward higher latitudes (Zhang et al., 2024). These cases exemplify the differentiated response mechanisms of medicinal plants to climate change, reflecting the two primary types of species habitat shifts: altitudinal and latitudinal migration. Therefore, understanding the interaction between climate change and plants is of great significance for plant resource conservation and exploitation.
In recent years, species distribution modeling (SDM) has become the method of choice for predicting changes in species’ habitats, which focuses on simulating areas of habitat distribution by analyzing known location information and ecological factors of species (Li et al., 2020; Wang et al., 2020; Low et al., 2021). Compared with models such as the Generalized Linear Model (GLM) (Hirzel et al., 2001) and DOMAIN model (Xia et al., 2024), the Maximum Entropy (Maxent) model is easy to operate, has higher prediction accuracy, and has been widely used in species distribution modeling studies (Glor and Warren, 2011; Fitzpatrick et al., 2013; Warren et al., 2014; Remya et al., 2015). By searching the Web of Science using “MaxEnt” and “species distribution” as keywords, we retrieved 906 and 1,145 publications in 2023 and 2024, respectively, which reflects the applicability of the MaxEnt model in plant ecology study. Although the maximum entropy model achieves high prediction accuracy with default parameters, its fixed feature combinations with regularization multipliers may lead to overfitting risk and do not apply to the prediction of all species distributions (Warren and Seifert, 2011; Moreno-Amat et al., 2015). In practice, parameters used for MaxEnt analysis will be adjusted in advance by using the R program to screen the optimal configuration based on environmental variables and distribution points. By this means, the model reliability can be improved to construct a more ecologically meaningful distribution model.
Pulsatilla chinensis (Bunge) Regel is a rhizomatous perennial herb of the buttercup family, whose rhizomes are widely used for clearing away heat and toxins, cooling the blood, and treating dysentery, with a particular specialty in removing toxins of dampness-heat and blood-heat from the gastrointestinal tract (Zhao et al., 2021). Pharmacological studies have reported that the active ingredients contained in P. chinensis extracts have demonstrated significant antitumor, anti-inflammatory, antibacterial, and antiviral effects (Cheng et al., 2008; Sun et al., 2010; Li et al., 2014). However, with the increasing demand for P. chinensis for medicinal purposes, its wild resources are gradually being depleted, leading to an increasing conflict between supply and demand. In the face of this situation, it is particularly urgent to strengthen the research on the distribution of P. chinensis resources and its ecological characteristics, which not only helps to scientifically and rationally formulate conservation measures but also provides strong support for the development of artificial cultivation technology and realizes the sustainable use of resources. However, there is a relative paucity of research on the resource distribution of P. chinensis and its habitat characteristics. Therefore, to investigate the habitat suitability dynamics and climate adaptation mechanisms of P. chinensis. In this study, we used the parameter-optimized MaxEnt model, combined with ArcGIS spatial analysis techniques, to systematically assess the distribution pattern of P. chinensis habitat suitability under the current climatic conditions, as well as under two future climate scenarios (SSP245 and SSP585) in the 2050s (2041–2060) and 2070s (2061–2080). Based on the variable contribution rankings and response curves of the model outputs, key climate factors driving the distribution of P. chinensis were identified, and their ecological threshold ranges were analyzed to reveal the adaptation boundaries of P. chinensis to climate change.
The aims of this study were as follows: (1) to predict the current distribution of P. chinensis into different suitability classes; (2) to analyze key variables affecting the growth of P. chinensis; and (3) to predict future changes in the habitat of P. chinensis in China under different carbon emission scenarios.
2 Materials and methods
2.1 Species distribution data of P. chinensis
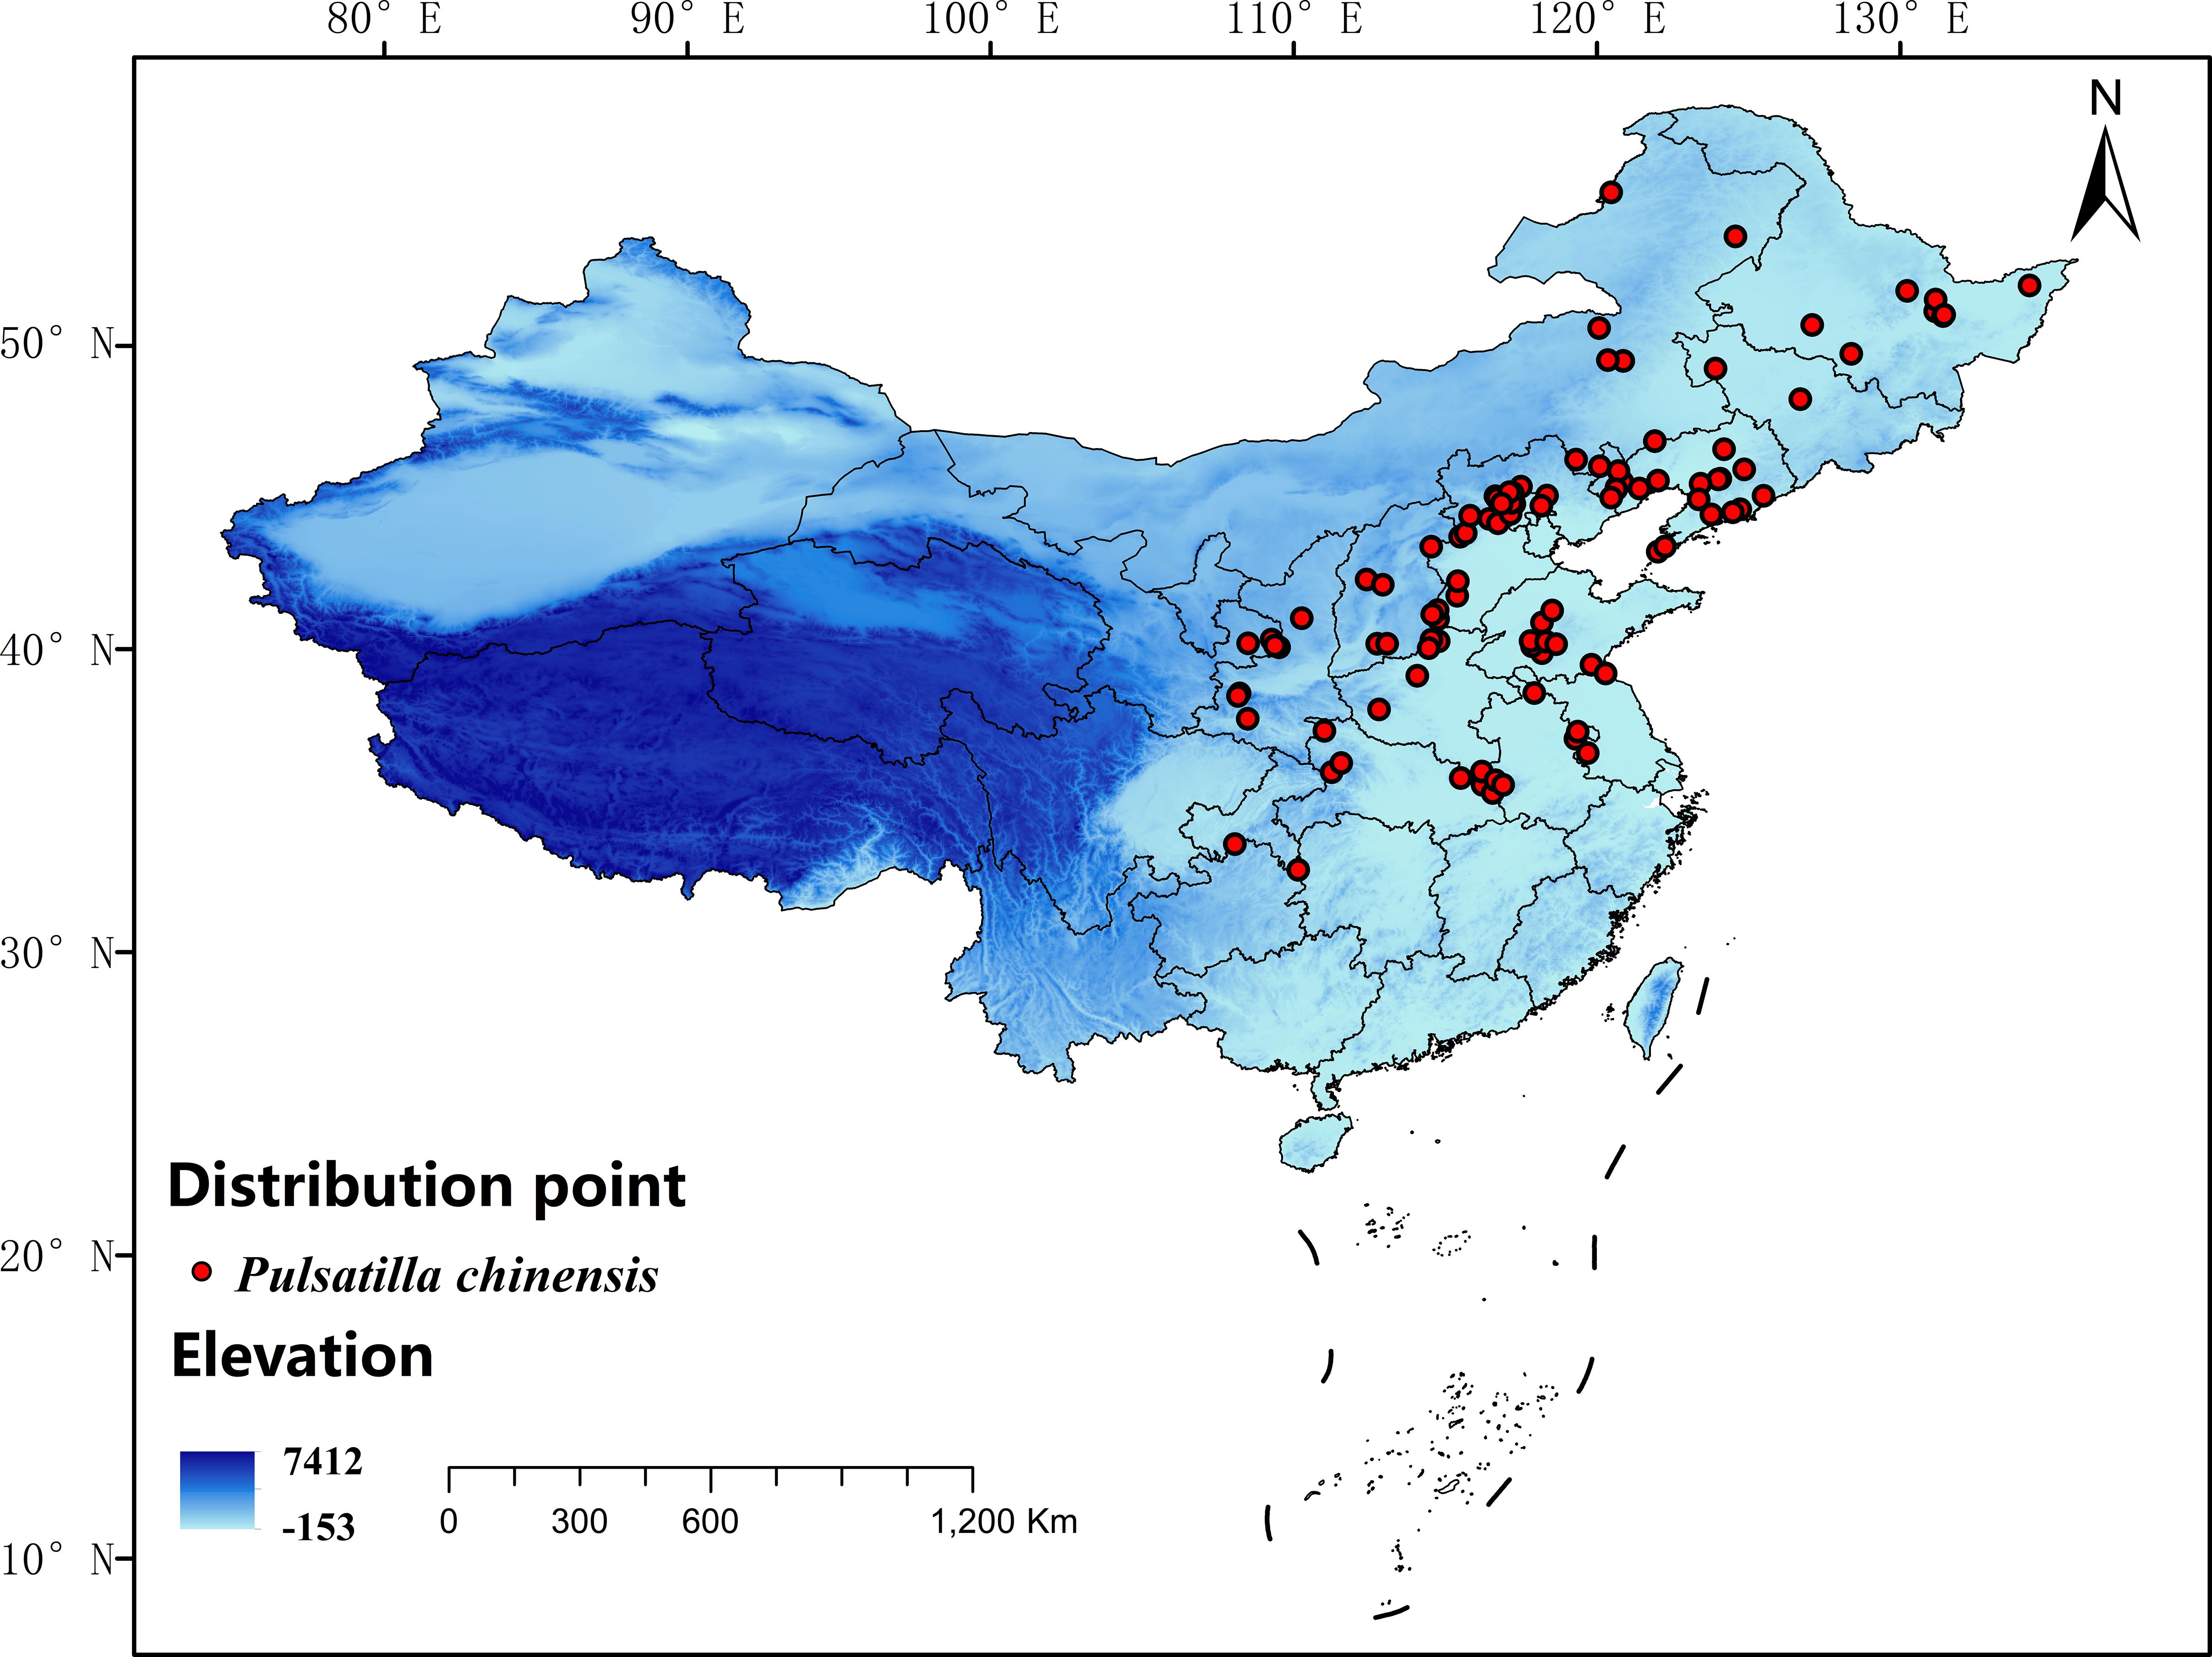
Information on the distribution points of P. chinensis in this study was obtained from the National Specimen Information Infrastructure (NSII, http://www.nsii.org.cn) and the Global Biodiversity Information Facility (GBIF, http://data.gbif.org). For distribution points lacking detailed latitude and longitude coordinates, geographic coordinates were obtained through Google Maps, and 133 coordinates were collected. Environmental variables exhibit significant spatial autocorrelation at short distances (Dormann et al., 2007). To prevent model overfitting caused by clustered distribution points, a 5 km × 5 km grid consistent with the resolution of the bioclimatic data (2.5 arc min) was generated by using a Spatially Rarefy tool in ArcGIS 10.8, with only one coordinate point retained in each grid. The 5-km spatial interval ensures both the independence of distribution points by representing different grid cells and avoids sampling too sparsely and missing key environmental assemblages. Eventually, 105 distribution points were retained for model construction (Figure 1).
2.2 Environmental data acquisition and processing
This study utilized climate data from the modern period (1970–2000) and two future periods (2041–2060 and 2061–2080). Ecosystem responses to climate change usually have a lag, and the selection of the 2050s and 2070s as time points for future scenarios can reflect changes in species distributions under the medium-term immediate response and the loss of habitat or the ability to adapt to new environments under the forward cumulative effect. The climate data included in this study include monthly precipitation, January-December mean temperature, and 19 bioclimatic variables, which were obtained from WorldClim (http://www.worldclim.org) with a spatial resolution of 2.5 arcminutes (about 5 km). This resolution achieved a good balance between data accuracy and computational efficiency. In addition, ArcGIS was used to extract slope and aspect direction from the digital elevation model provided by WorldClim, which characterize the degree of inclination and orientation of the ground surface, respectively. Data for soil were obtained from the Harmonized World Soil Database (HWSD, http://vdb3.soil.csdb.cn/). Future bioclimatic variables were accessed from the WorldClim database, which integrates datasets derived from the BCC-CSM2-MR climate model under the Sixth Coupled Model Intercomparison Project (CMIP6) (Wu et al., 2019). BCC-CSM2-MR is suitable for modeling the Chinese climate and provides relatively accurate forecast data (Fick and Hijmans, 2017). This study modeled the potential future fitness zones of P. chinensis under two typical concentration emission scenarios, SSP245 and SSP585. SSP 245 represents a development pattern with a moderate level of greenhouse gas emissions, while SSP 585 is a development pattern with fossil fuels as the main source of energy, reflecting higher greenhouse gas emissions (Zhang et al., 2019).
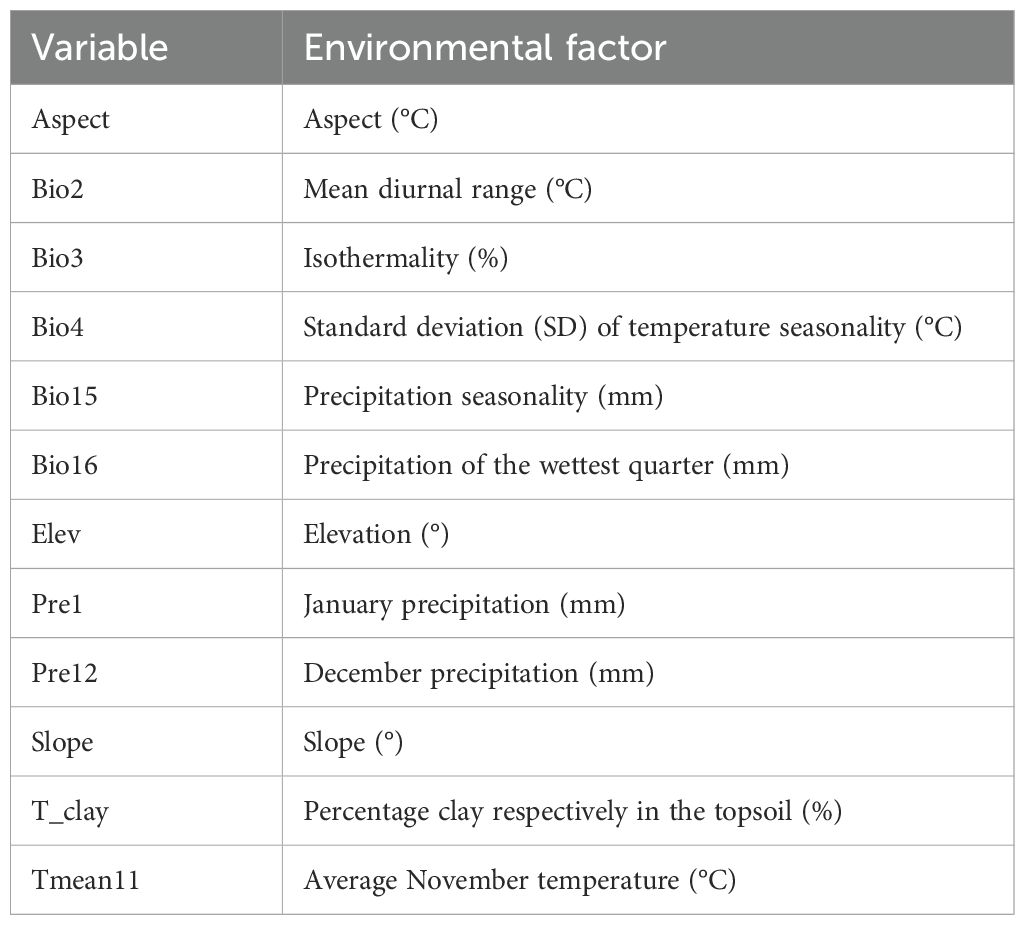
To avoid the potential impact of multicollinearity on model stability, this study first excluded variables with zero contribution rate using the MaxEnt 3.4.4 to ensure that candidate variables were potentially ecologically driven (Shi et al., 2021; Guo et al., 2023). The Pearson correlation coefficients of the variables screened by MaxEnt were then calculated using Statistical Product and Service Solutions (SPSS, version 27.0), and for the group of highly correlated variables (|r| ≥ 0.8), those with high contributions were retained (Zhang et al., 2022). Finally, 12 variables were obtained for model analysis (Table 1).
2.3 Species distribution modeling
The distribution data of P. chinensis, along with associated environmental variables, were processed using the MaxEnt model. Logistic output was selected, and the random test percentage was configured to 25%, reserving 75% of the dataset for training purposes (Amiri et al., 2022). The model was set to run for a maximum of 500 iterations with 10,000 pseudo-absence points, and cross-validation was conducted ten times. The use of 10,000 background points is usually sufficient to characterize the environmental space of the study area. When there are fewer species distribution points, appropriately increasing the number of background points can help reduce potential sampling bias (Barber et al., 2022). To determine the importance of each variable, Jackknife tests were employed, followed by an evaluation using the ROC curve. The ROC curve, a widely recognized tool for assessing binary classifiers, illustrates the balance between true positive and false positive rates. Model performance was quantified through the area under the curve (AUC), with the following interpretation: 0.50–0.60 indicates failure, 0.60–0.70 poor, 0.70–0.80 fair, 0.80–0.90 good, and 0.90–1.00 very good (Phillips et al., 2006).
To comprehensively assess the predictive performance of the model, we also chose the True Skill Statistic (TSS) to verify the reliability of the results. TSS is an indicator that assesses the predictive performance of species distribution models, which effectively corrects for sample imbalance bias in species distribution data by integrating sensitivity and specificity (Allouche et al., 2006). The value of TSS ranges from − 1 to 1, and the closer to 1 the better the prediction results; when the value of TSS is located between 0.6 and 1, the prediction ability can be considered good. The calculation of TSS values in this study was done in R 4.4.1.
2.4 Optimization of the model
The MaxEnt model regularization level is governed by two critical parameters: the regularization multiplier (RM) and feature combinations (FC) (Radosavljevic and Anderson, 2014). The feature classes available include linear (L), quadratic (Q), hinge (H), product (P), and threshold (T) (Elith et al., 2011). To identify the optimal parameter settings, RM values were incrementally varied from 0.5 to 4.0 in steps of 0.5, and tested with six combinations of feature classes: L, LQ, H, LQH, LQHP, and LQHPT. The Akaike Information Criterion Correction (AICc) is an important metric for assessing model fit (Muscarella et al., 2014). In this study, we used the ENMeval package for R to calculate the AICc values of the MaxEnt models for different parameter settings. Delta AICc is a metric used in model selection to measure the relative difference between candidate models and the optimal model. The delta AICc value is obtained by calculating the AICc values and then subtracting the AICc of each model from the smallest AICc value among all candidate models. Larger values of delta AICc are less likely to serve as the best approximation of the model in the candidate set. Models with delta AICc ≤ 2 have substantial support, while models with delta AICc > 10 have essentially no support (Burnham and Anderson, 2004). For our study on P. chinensis, the model with delta AICc = 0 was finally chosen.
2.5 Data processing
The grading and visualization of P. chinensis suitable areas were achieved by loading the mean results of the model output into ArcGIS software. Suitability probability classes were classified using the natural breakpoint method, which determines the optimal classification threshold based on the distributional characteristics of the data itself. There were four categories: highly suitable (0.5–1.0), moderately suitable (0.3–0.5), lowly suitable (0.1–0.3), and unsuitable (0.0–0.1). Dynamic changes in center-of-mass trajectories better reflect the spatial and temporal reconfiguration characteristics of the distribution pattern than area fluctuations. Therefore, in this study, while quantifying the areas with different suitability classes, we used the spatial statistical tools in ArcGIS to transform the distribution of P. chinensis suitable areas in each period into representative centroids (Brown, 2014; Guo et al., 2023; Wang et al., 2024), which reflected the overall spatial positioning of P. chinensis suitability zones.
3 Results and analysis
3.1 Model optimization accuracy evaluation
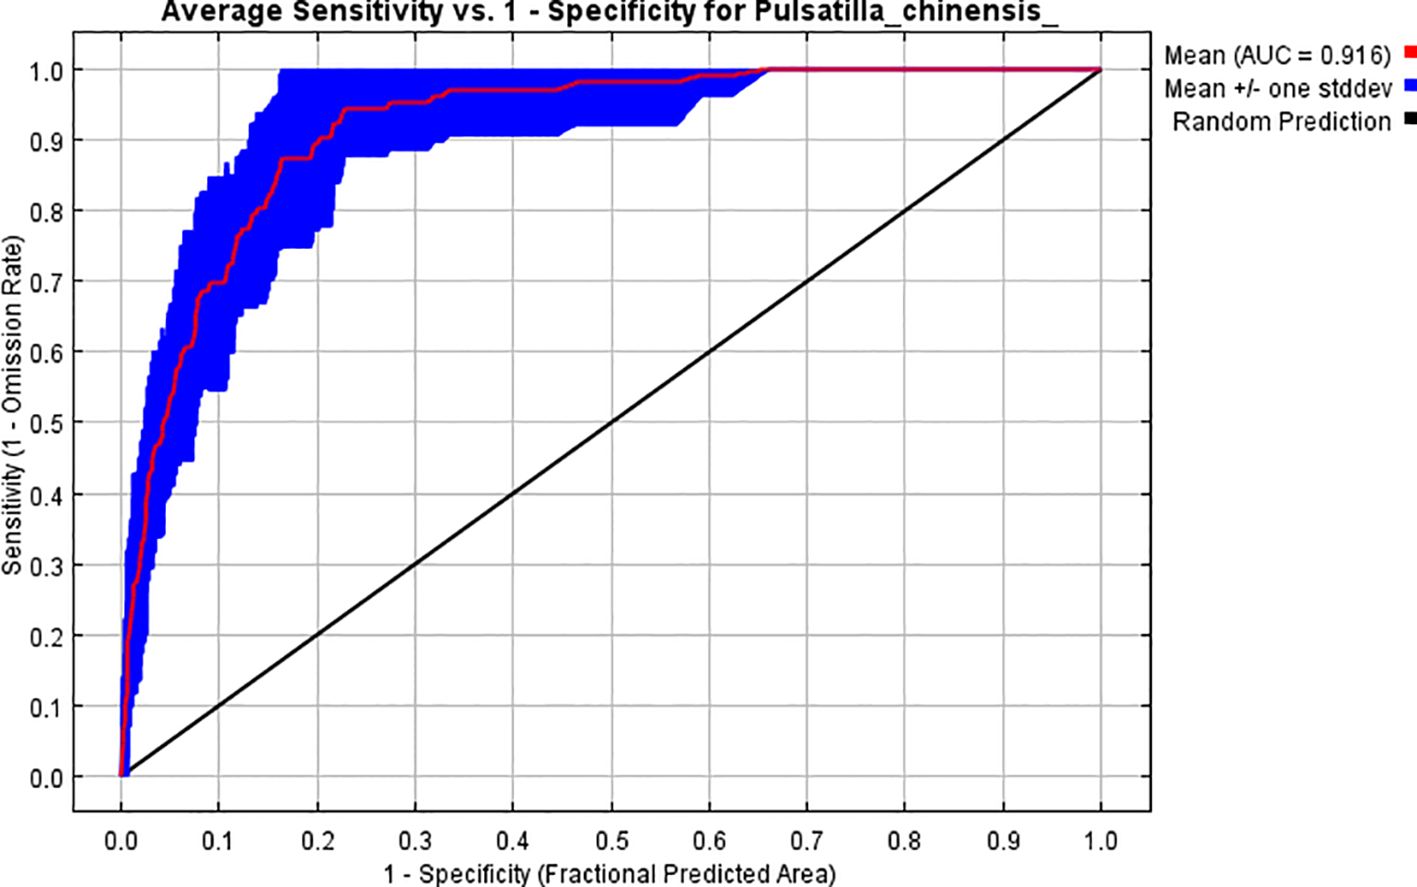
The distribution area of P. chinensis was predicted based on 105 occurrence records and 12 environmental variables. When running the model with the MaxEnt default parameters (RM = 1, FC = LQH), delta AICc = 317.77, it indicated a risk of overfitting. Nevertheless, adopting the adjusted parameters (RM = 2.5, FC = LQHPT), delta AICc = 0, demonstrated that the predictive accuracy of the model was better than the default model for this combination of parameters. The results showed that the mean AUC of the model under the optimized parameters was 0.916 and the mean TSS was 0.608, both of which further confirmed the reliability of the model results (Figure 2).
3.2 Distribution of P. chinensis concerning environmental variables
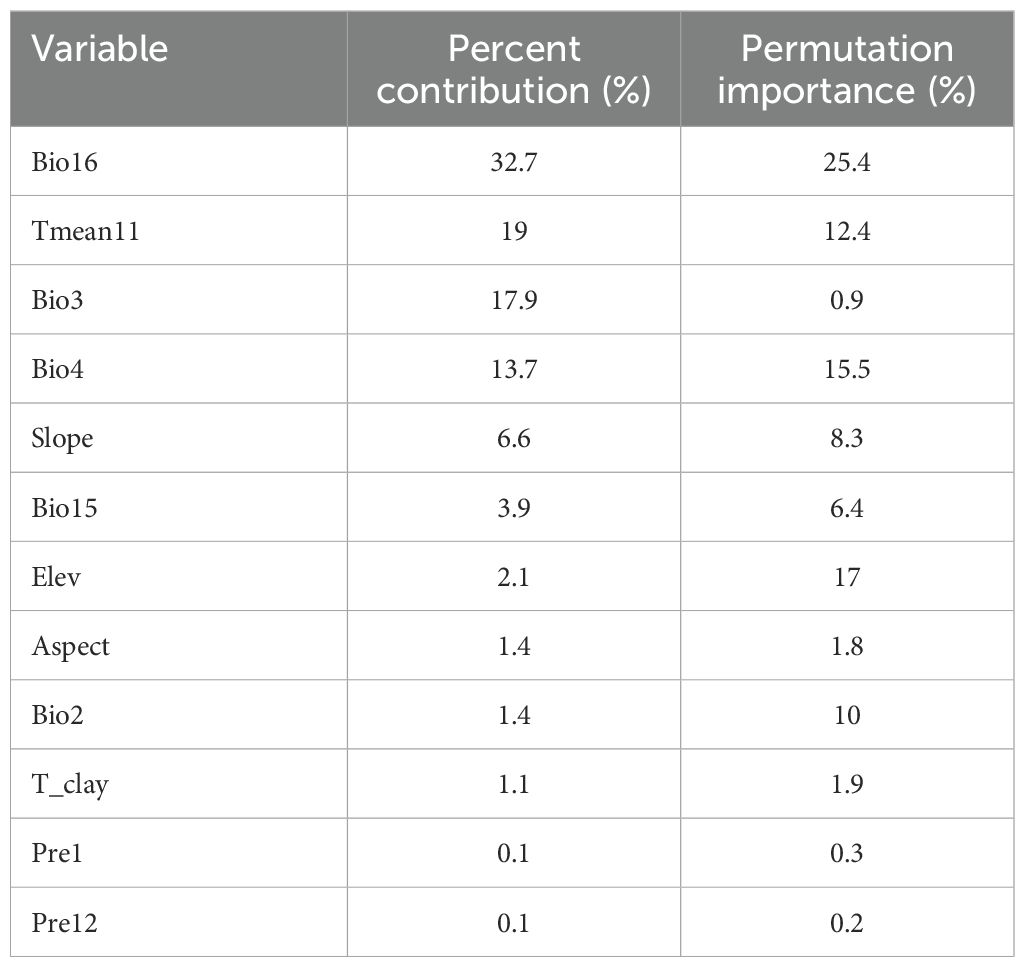
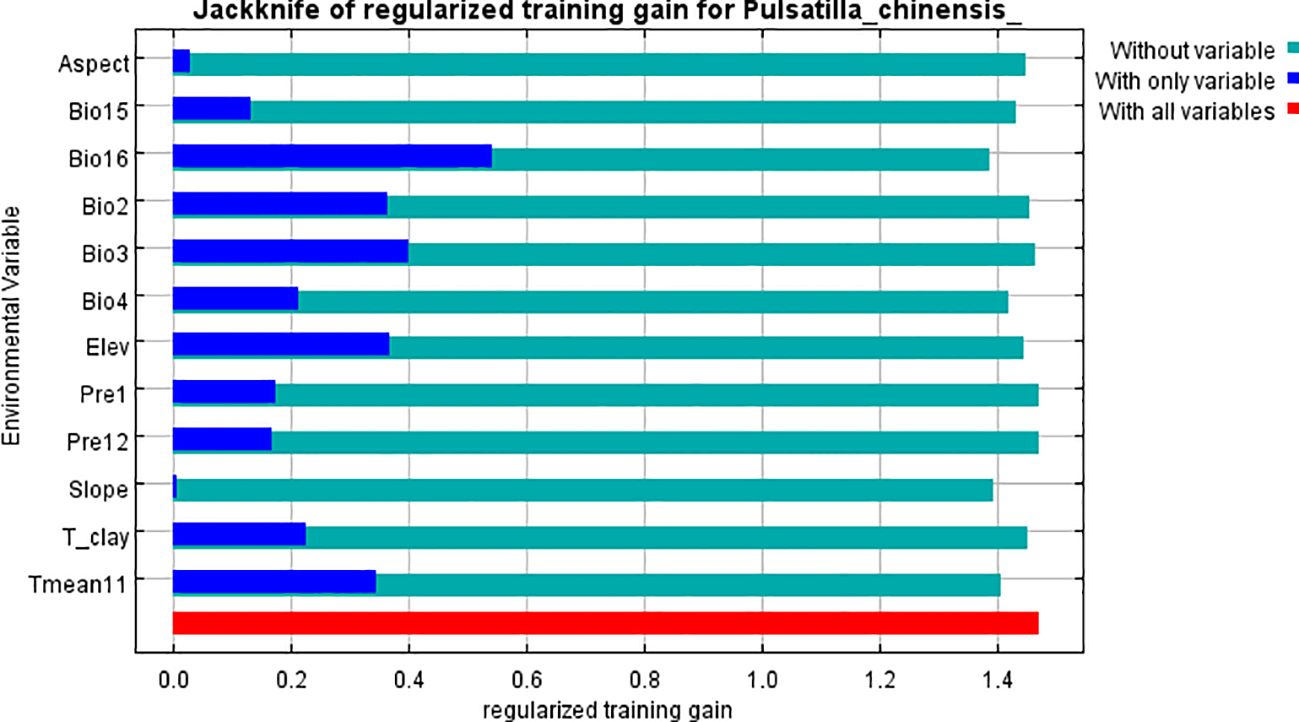
Model results indicate that Precipitation of the wettest quarter, Isothermality, Average November temperature, and Standard deviation of temperature seasonality collectively contributed 83.3% to the habitat suitability of P. chinensis. The precipitation of the wettest quarter ranked as the most influential variable, contributing 32.7% (Table 2). The Jackknife test revealed that Precipitation of the wettest quarter, Isothermality, and Mean diurnal range had significant impacts on the survival of P. chinensis. This highlights precipitation and temperature as key determinants of P. chinensis habitat suitability (Figure 3).
Response curves were generated by univariate marginal effects analysis in the MaxEnt model, reflecting each variable’s marginal contribution to species habitat suitability while holding other variables constant. In this study, response curves for the four variables with the highest contributions were specifically analyzed using a threshold probability of occurrence greater than 0.50 (Liu et al., 2005; Xu et al., 2023b). The presence of P. chinensis was most likely when the precipitation of the wettest quarter ranged from 307.5 to 506.9 mm. P. chinensis grows best in this region when isothermality values range from 16.2% to 31.1%. The likelihood of P. chinensis presence exceeded 50% when the average November temperature ranged from − 1.7°C to 9.7°C. Additionally, P. chinensis exhibited higher survival rates when the standard deviation of temperature seasonality ranged from 9.3°C to 13.1°C (Figure 4).
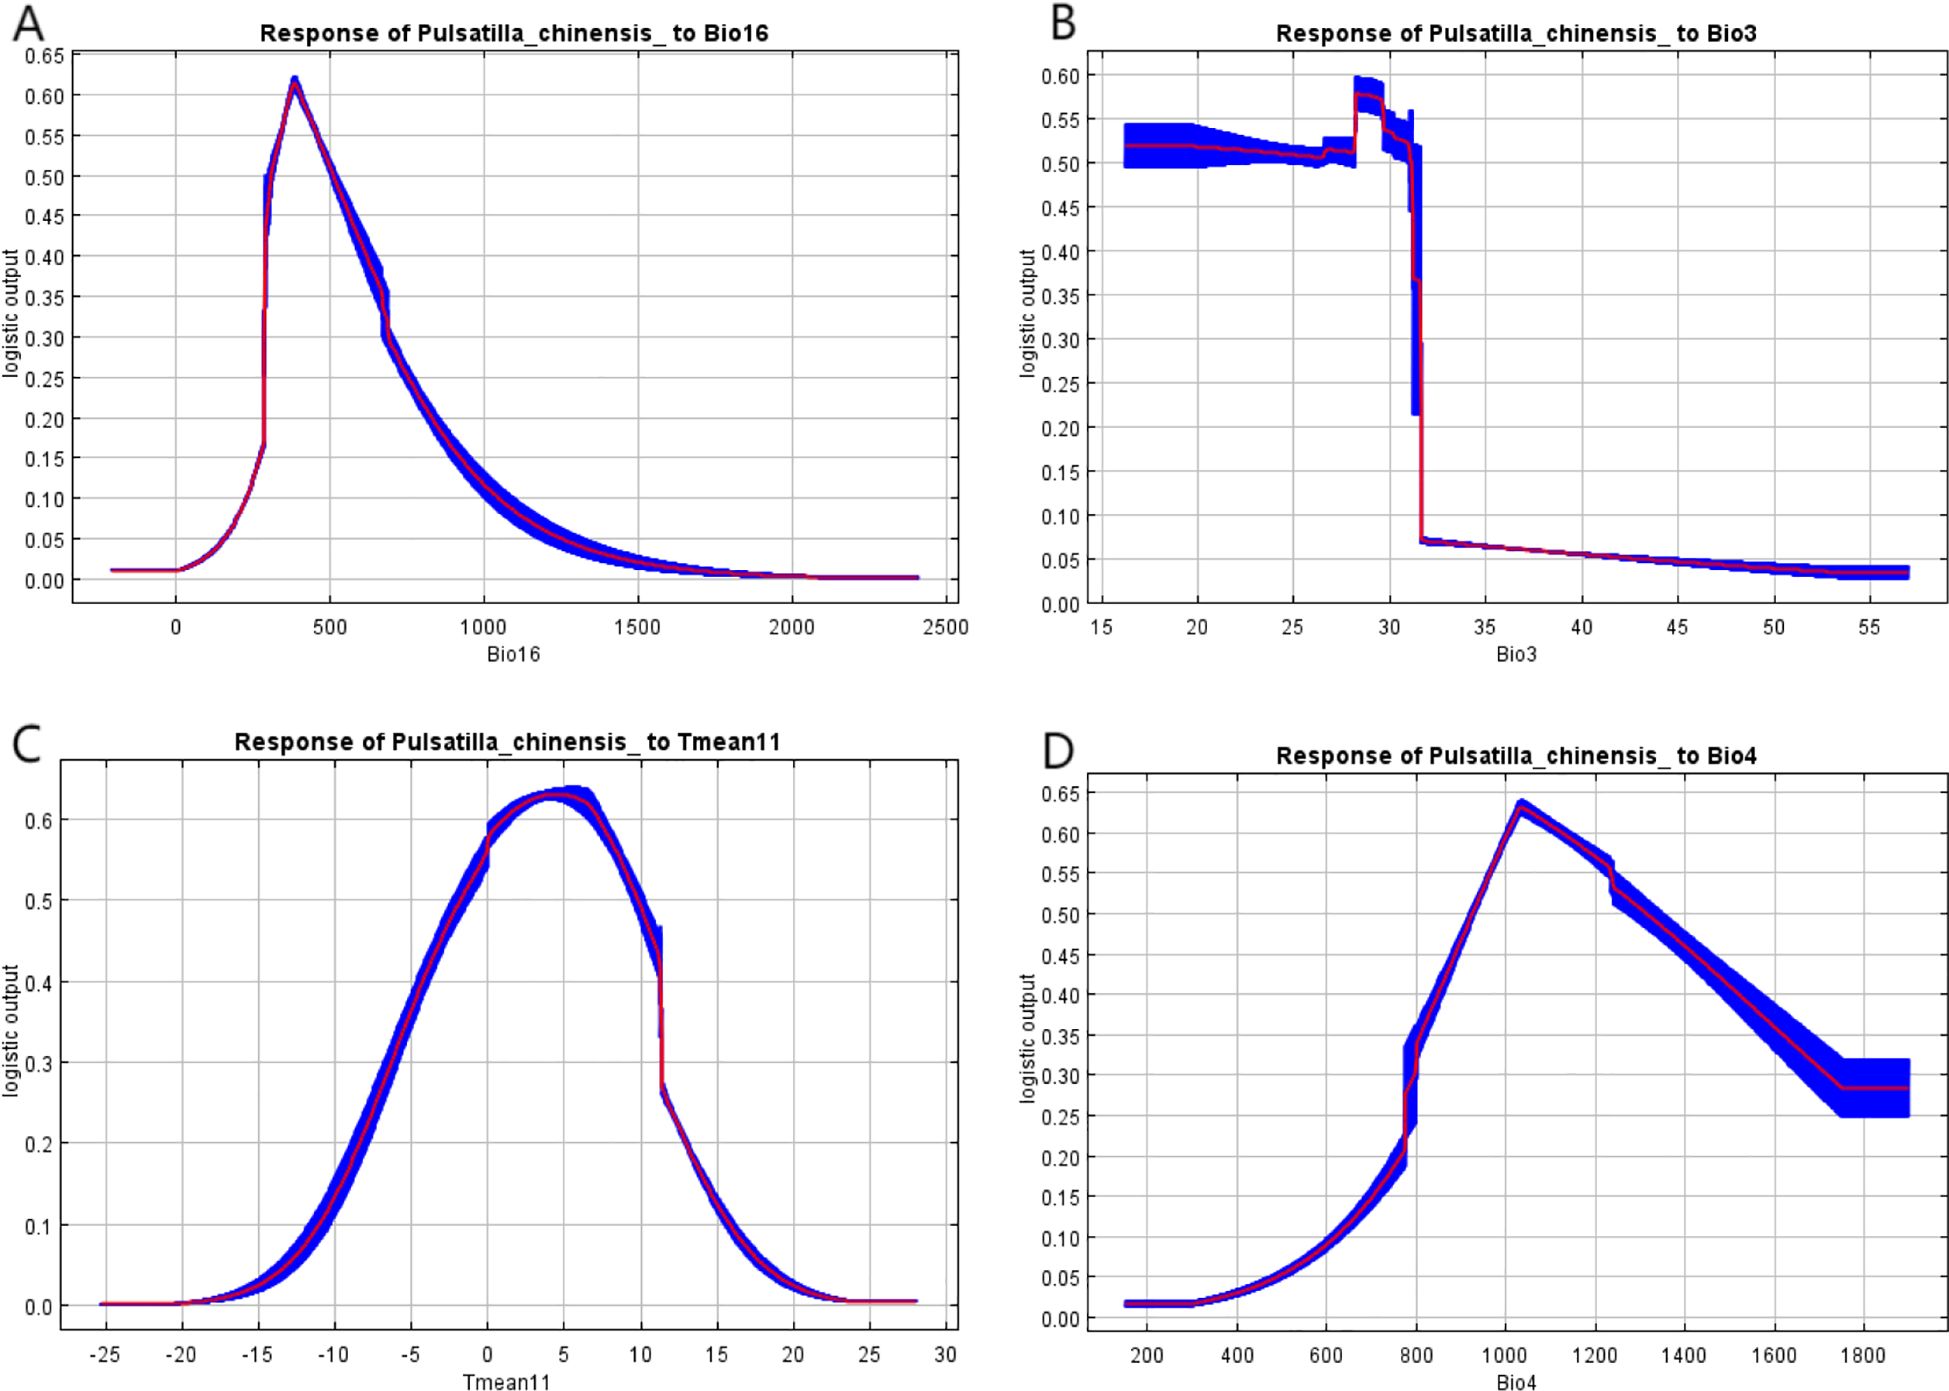
Figure 4. Response curves for the critical variables: precipitation of the wettest quarter (A), isothermality (B), average November temperature (C), and standard deviation of temperature seasonality (D).
3.3 Current distribution of P. chinensis in China
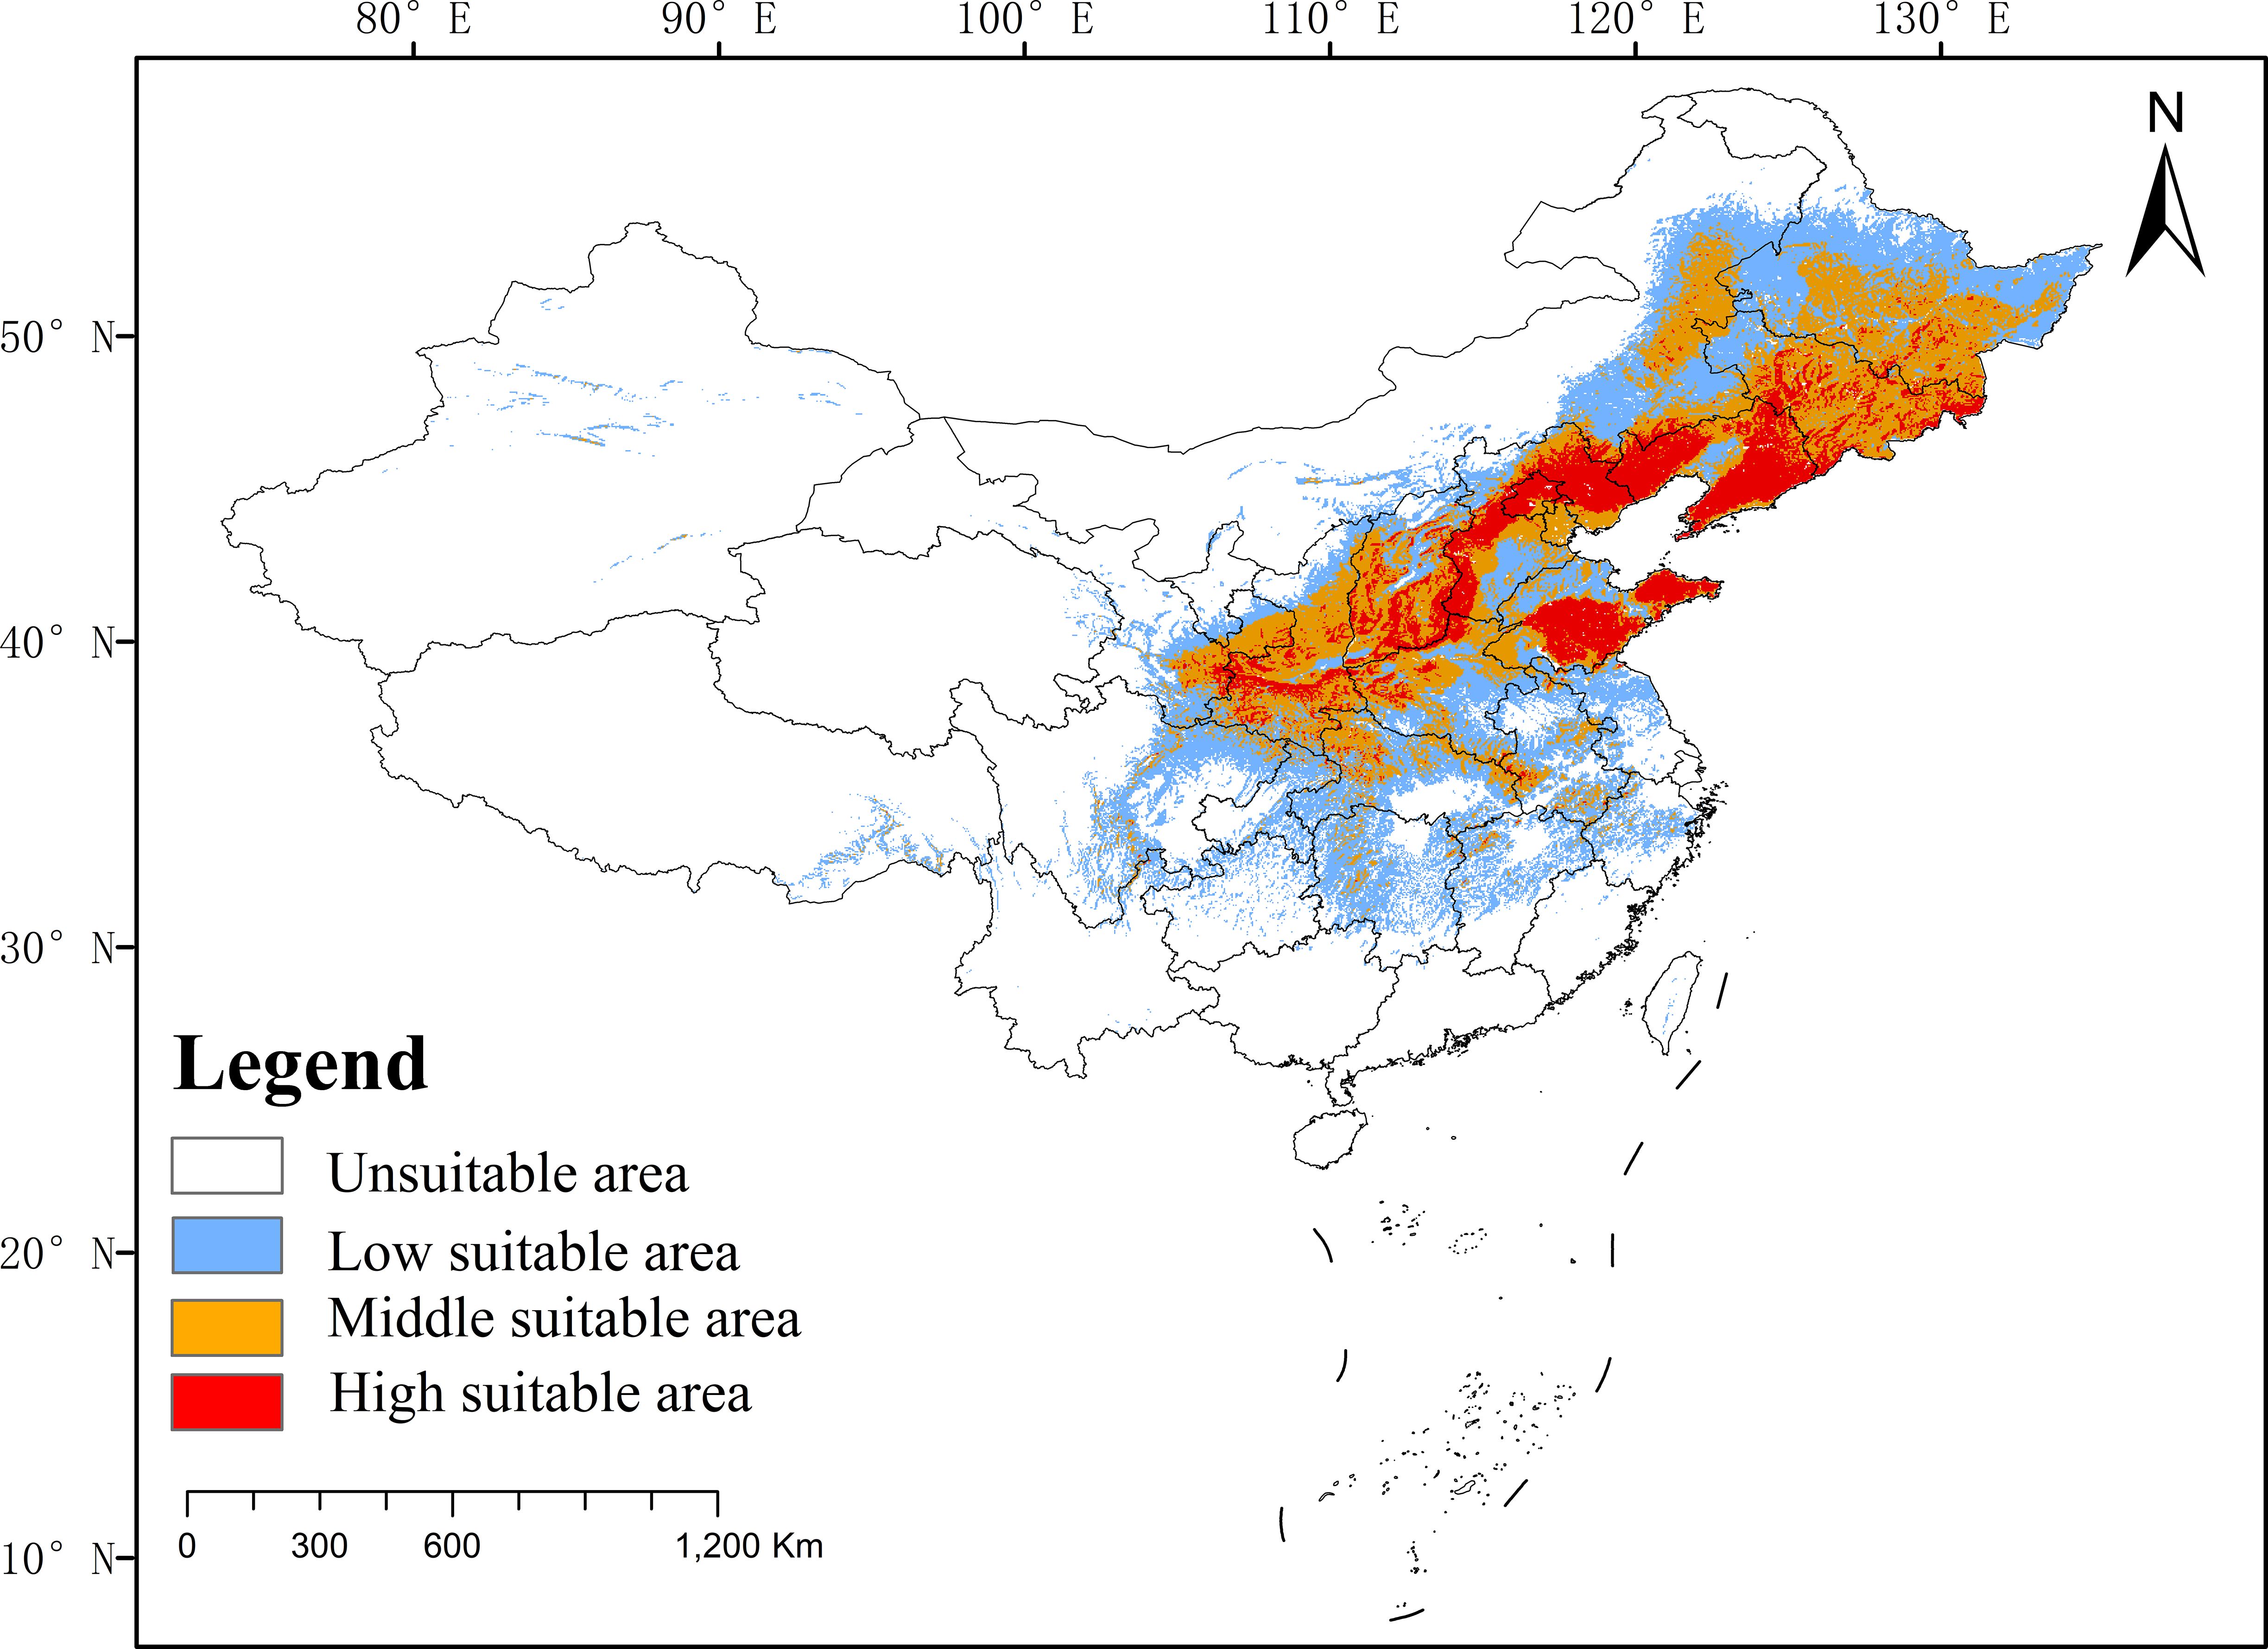
The distribution of P. chinensis is primarily concentrated in northern and eastern China, with a total suitable area estimated at 262.78 × 10⁴ km². The highly suitable zone covers 47.60 × 10⁴ km², accounting for 18.12% of the total suitable area, and is primarily distributed across Liaoning, Beijing, Shandong, Hebei, and Shanxi. The moderately suitable zone spans 84.02 × 10⁴ km², representing 31.98% of the total suitable area. It surrounds the highly suitable zone and extends into regions such as Inner Mongolia, Jilin, and Shaanxi. The low suitability zone occupies 131.14 × 10⁴ km², making up 49.91% of the total suitable area. It is primarily located around the moderately suitable zone, spanning central, eastern, and southwestern China (Figure 5).
3.4 Distributional changes of P. chinensis under future climates
Projections suggest an overall expansion of suitable habitat for P. chinensis under both future emission scenarios. The SSP245 scenario predicts a more pronounced increase in suitable habitat compared to SSP585 (Table 3).
Between 2041 and 2060, the total suitable area under SSP245 increased by 25.40% relative to the current period, with significant expansion in highly suitable areas (Figure 6A). Key suitable regions included Shandong, Hebei, Beijing, Tianjin, Liaoning, Jilin, Heilongjiang, Inner Mongolia, Shanxi, Shaanxi, and Gansu. Under SSP585, the total suitable area increased by 8.89% compared to the current period (Figure 6B). While moderately suitable areas expanded, highly suitable areas experienced a relative decline.
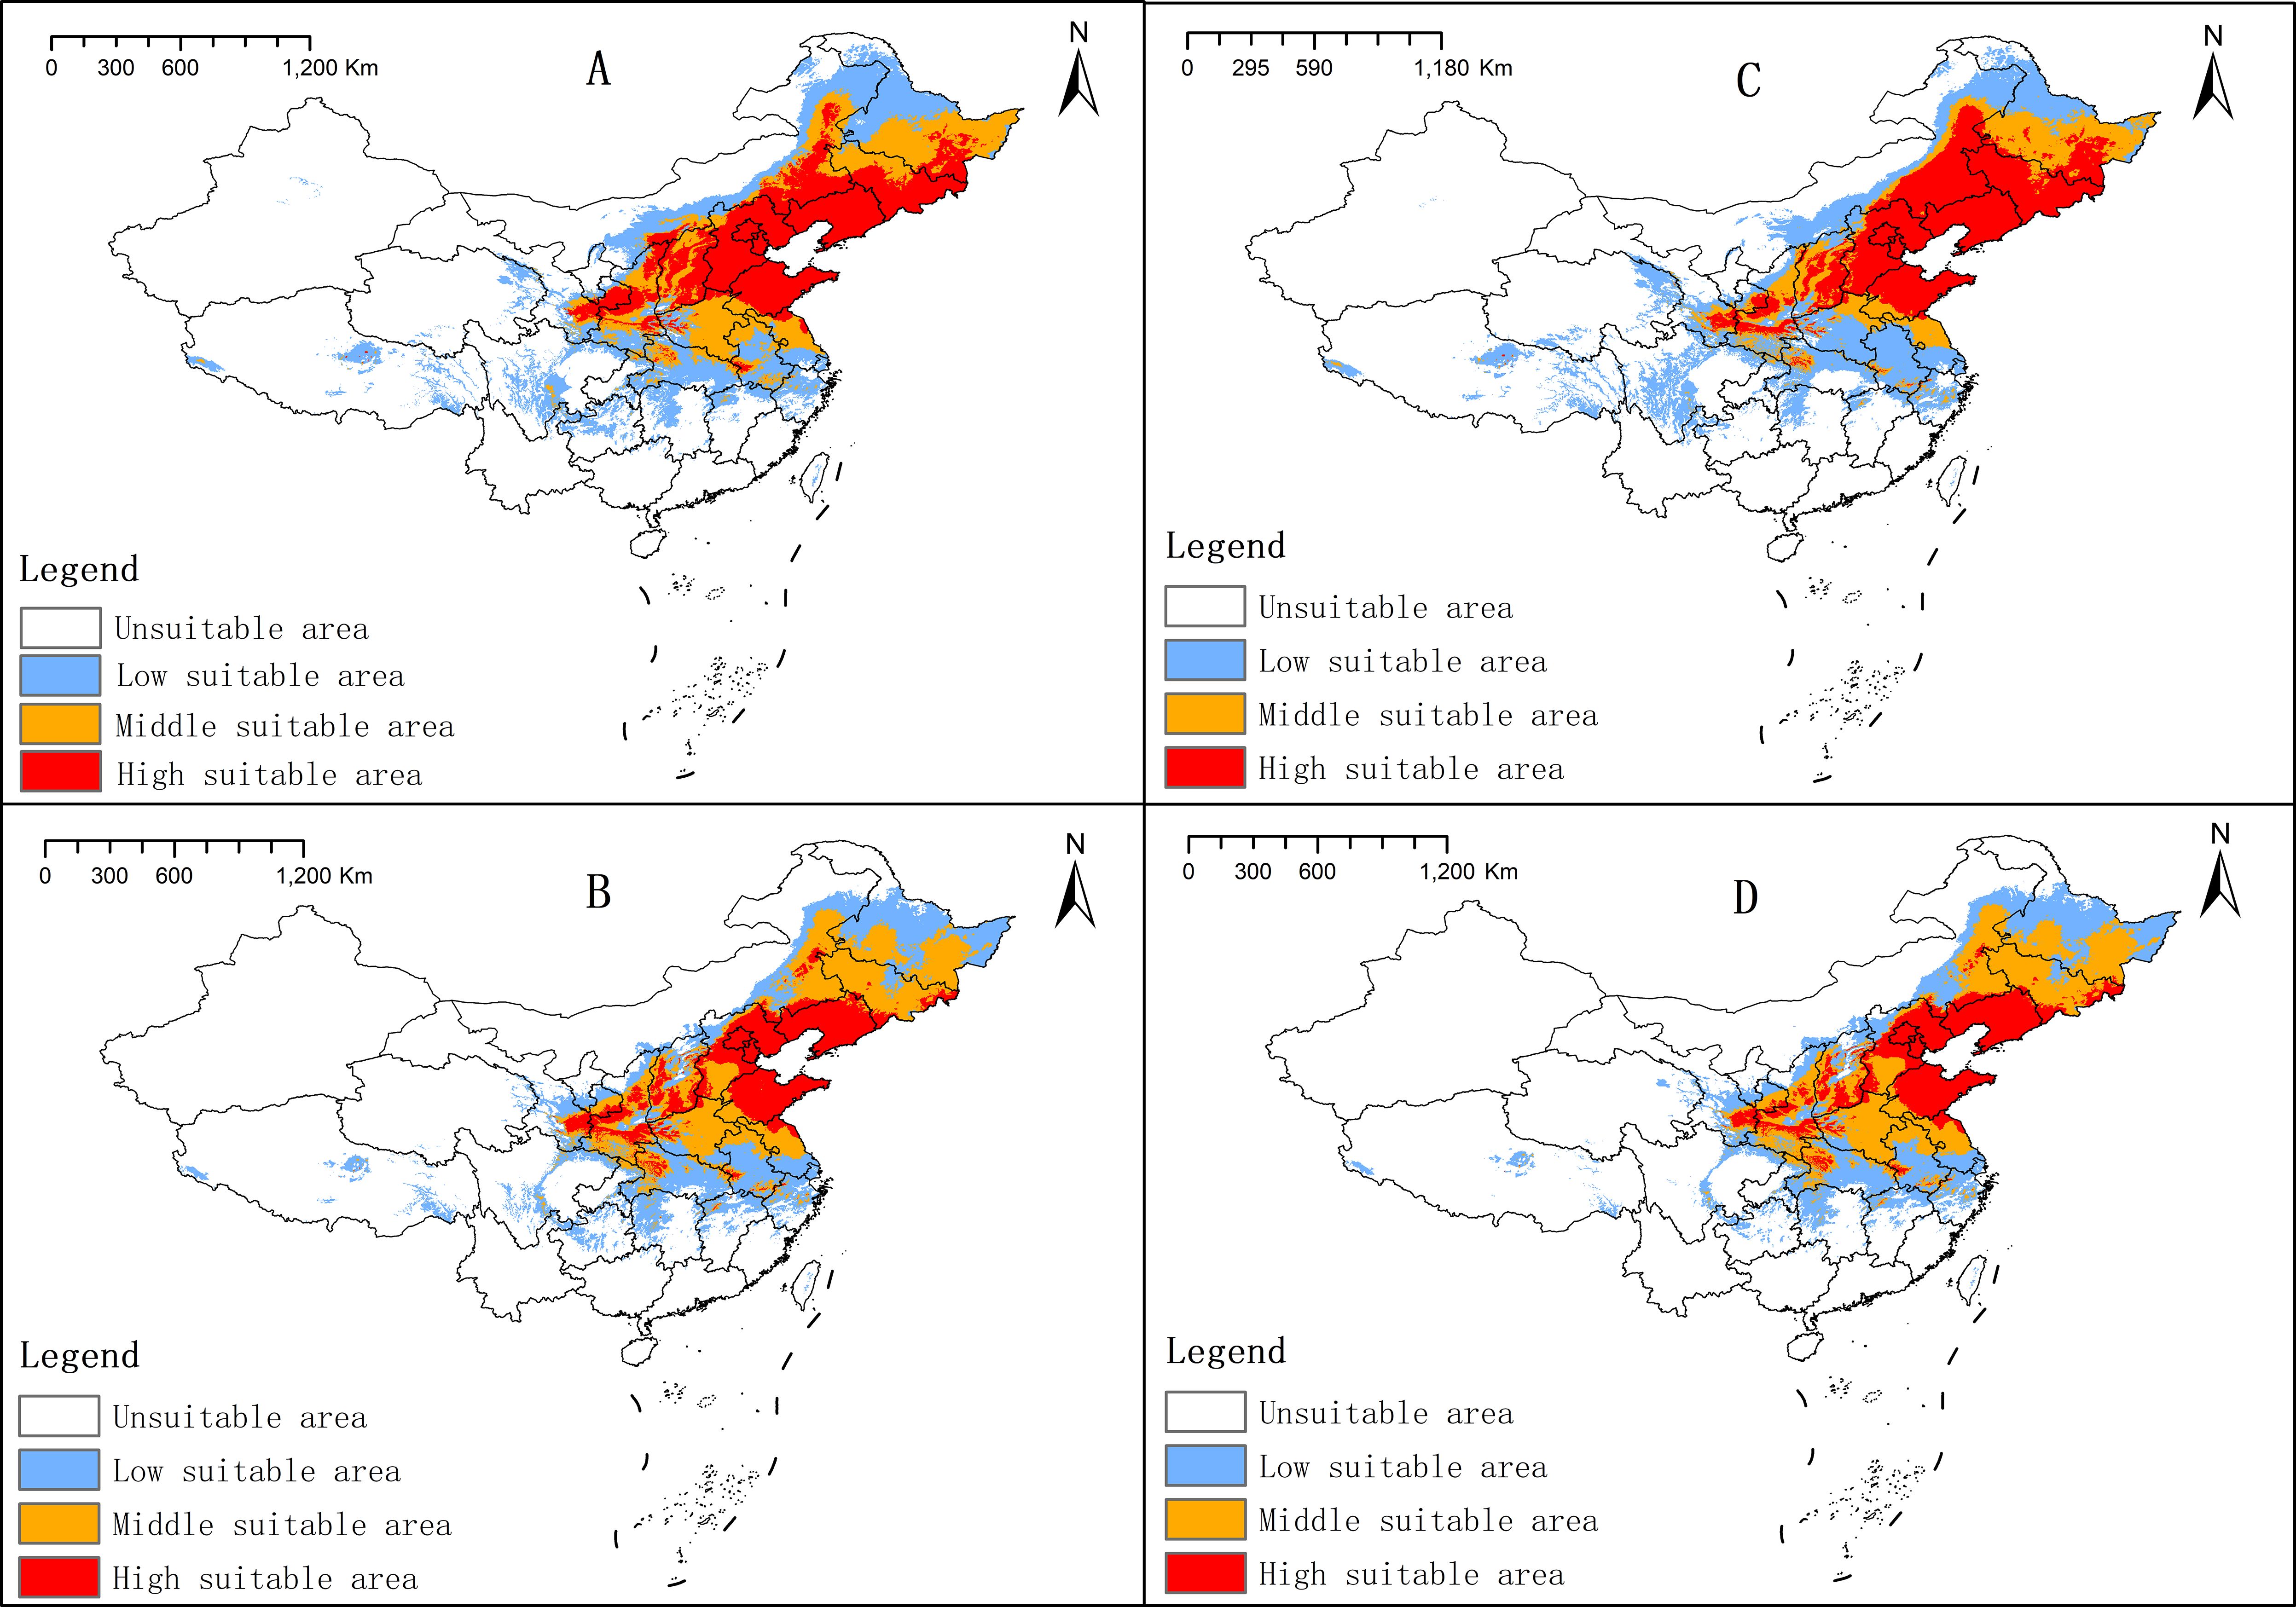
Figure 6. Changes in P. chinensis suitability areas under future climate conditions. (A) 2041–2060, SSP 245; (B) 2041–2060, SSP 585; (C) 2061–2080, SSP 245; and (D) 2061–2080, SSP 585.
Between 2061 and 2080, the SSP245 scenario projected a 23.26% increase in total suitable area, with further expansion in highly suitable regions, particularly in Jilin, Heilongjiang, and Inner Mongolia (Figure 6C). The overall distribution pattern remained consistent with projections for 2041–2060 under the SSP245 scenario. Under SSP585, the total suitable area increased by 7.41% compared to the current period, with a slight decrease relative to the 2041–2060 projections. The distribution pattern remained largely unchanged (Figure 6D). According to ArcGIS, the threshold for a highly suitable area is greater than 0.5. To present the data from another perspective, we redrew the highly suitable areas with an adjusted threshold greater than 0.8, considering current (Supplementary 1) and future scenarios (Supplementary 2).
3.5 Changes in the center of mass of P. chinensis at different periods
The center of mass of P. chinensis exhibits slight variations under different emission scenarios (Figure 7). Under the SSP245 scenario, the center of mass of P. chinensis is projected to shift westward from Tangyin County, Anyang City, Henan Province, to Lintong District, Xi’an City, Shaanxi Province, covering a distance of approximately 501.28 km between 2041 and 2060. It is expected to move further to Chang’an District, Xi’an City, Shaanxi Province, with an additional shift of about 544.32 km between 2061 and 2080.
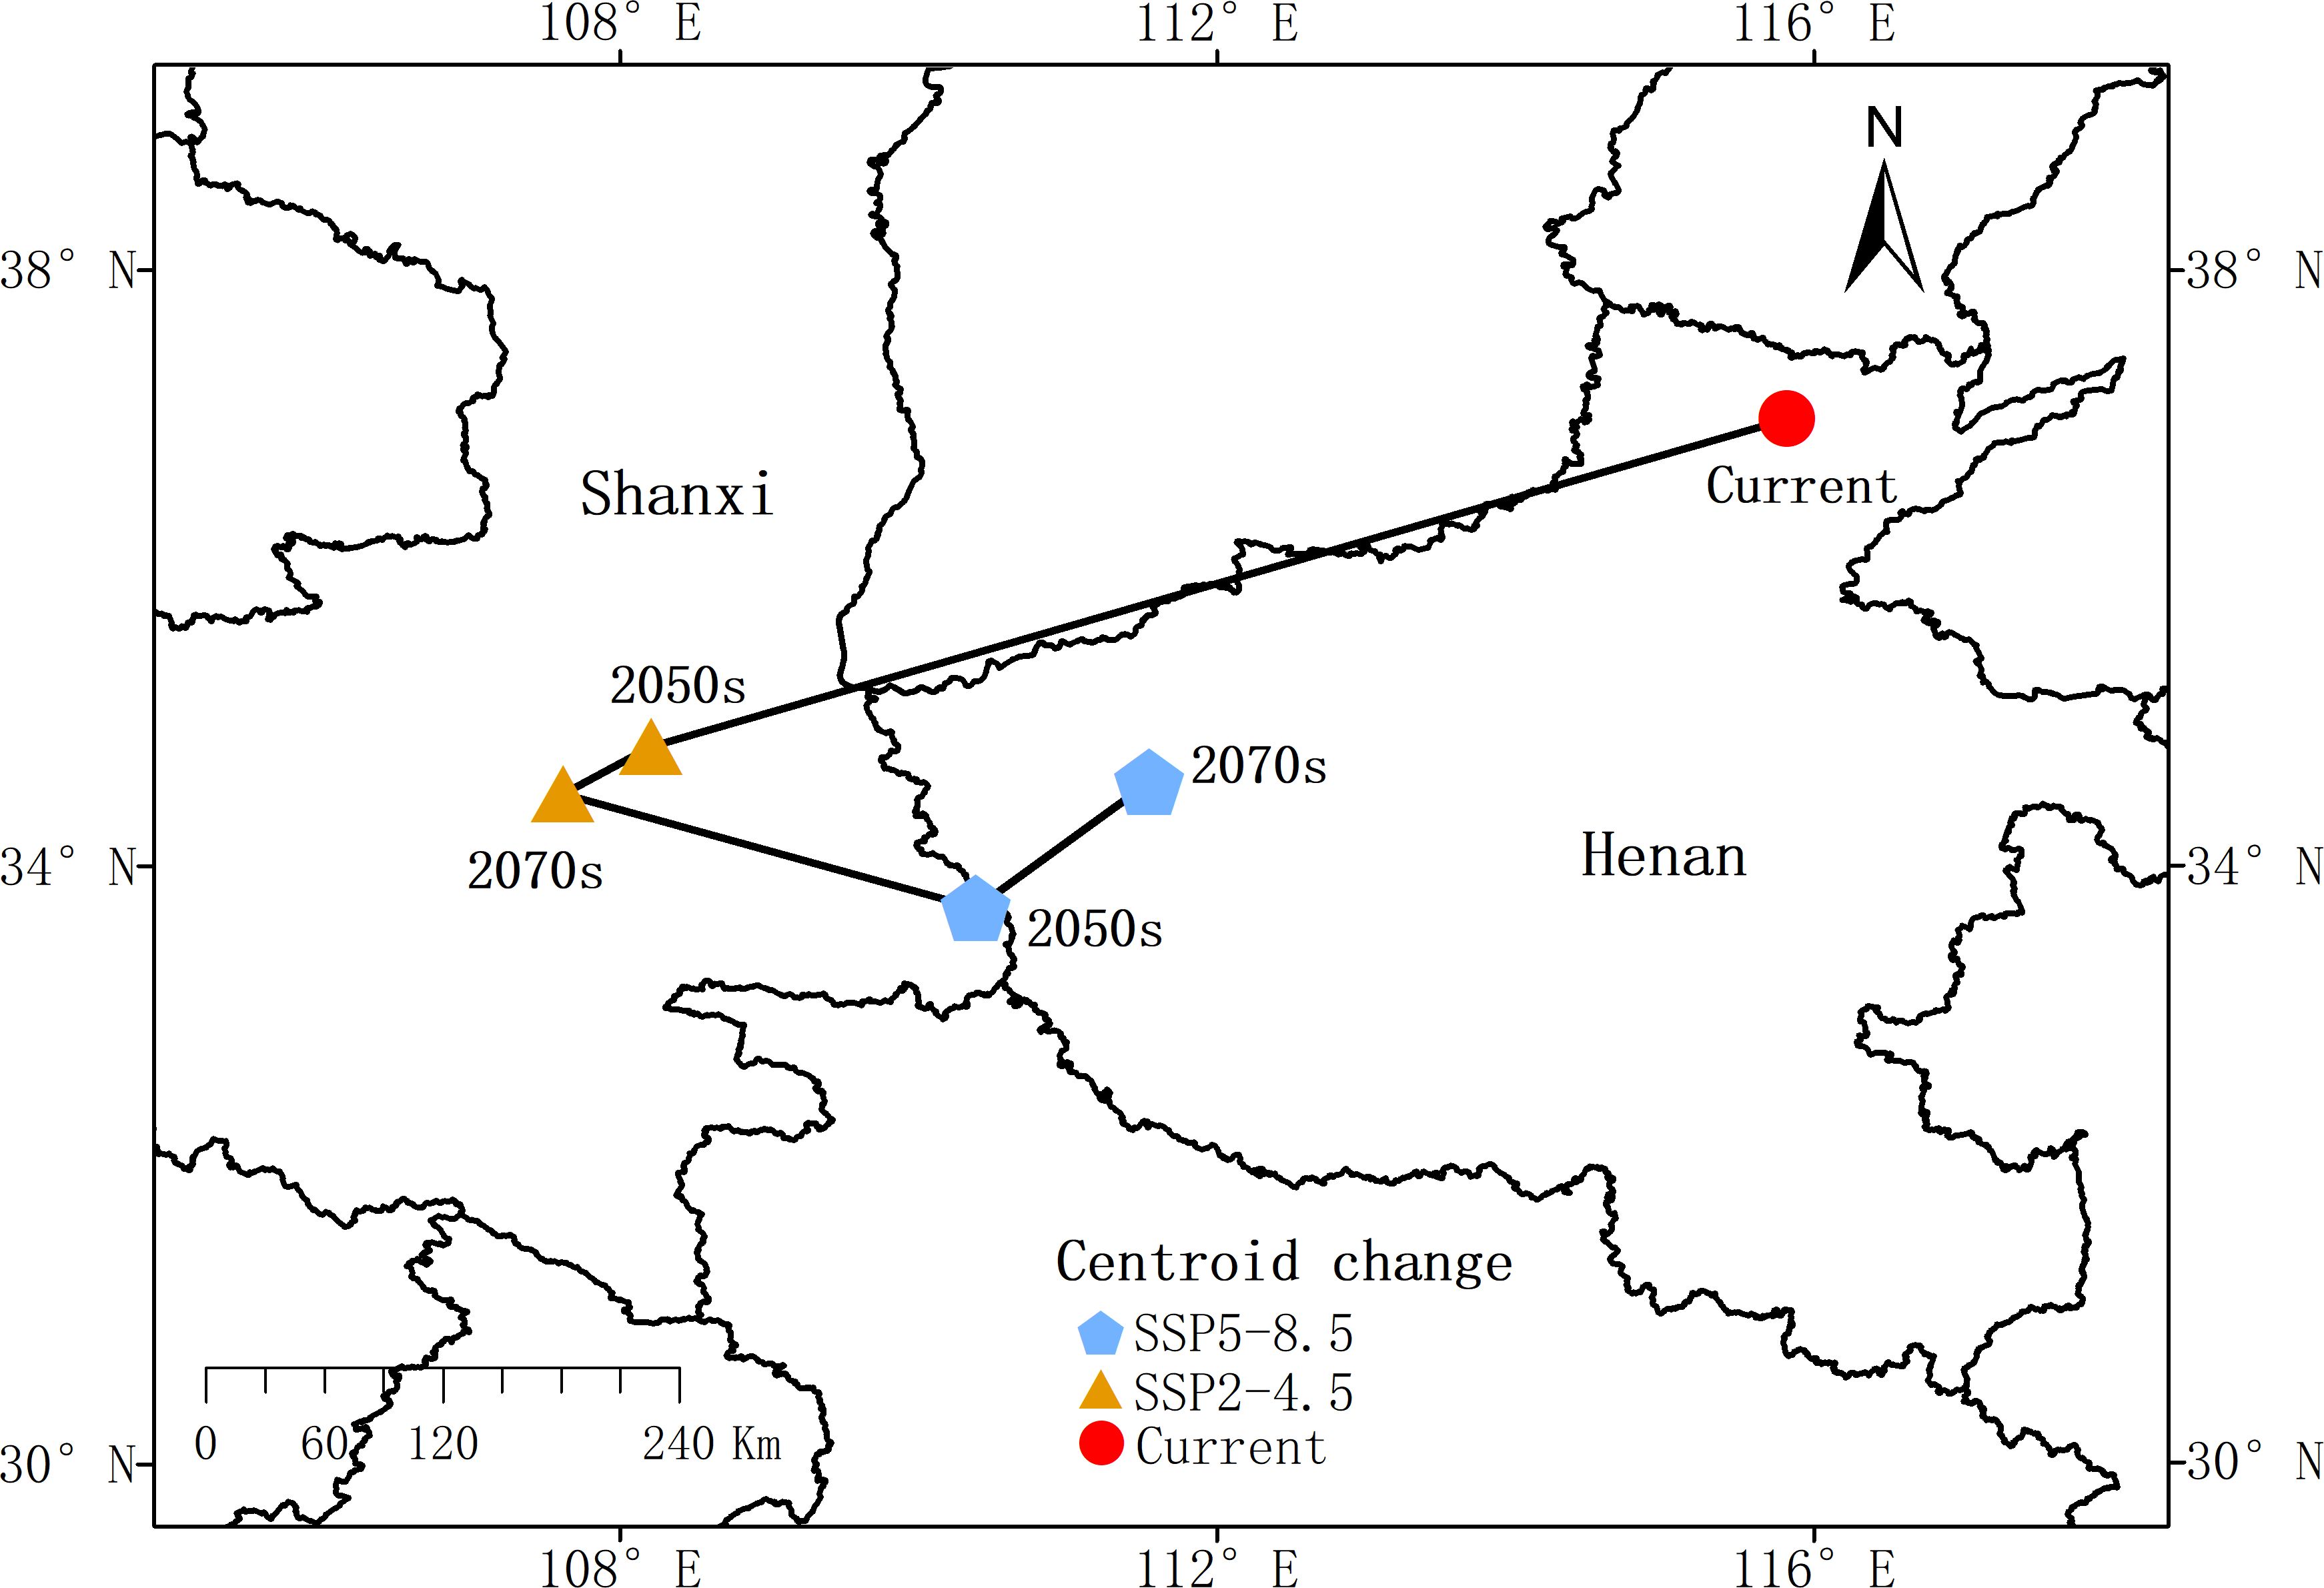
Figure 7. Map of the center of gravity shifts of P. chinensis suitable areas under future climate scenarios.
Under the more severe SSP585 scenario, the center of mass is projected to shift southwestward to Shangnan County, Shangluo City, Shaanxi Province, over a distance of approximately 420.01 km between 2041 and 2060. Subsequently, it is expected to move southeastward to Luoning County, Luoyang City, Henan Province, with an additional shift of about 322.98 km between 2061 and 2080. Overall, the center of mass of P. chinensis tends to shift southwestward. Notably, the SSP245 scenario predicts a longer shift distance compared to SSP585, primarily spanning Shaanxi and Henan provinces.
4 Discussion
4.1 Optimized performance of MaxEnt
Previous studies have demonstrated that optimizing model parameters can reduce complexity and minimize error rates during operations (Shi et al., 2024). In this study, the ENMeval toolkit in R was employed to optimize the initial MaxEnt parameters, utilizing filtered P. chinensis distribution data and key ecological factors, including climate, topography, and soil. The adjusted parameters are RM = 2.5 and FC = LQHPT. The results demonstrate that the mean value of AUC was 0.916 and the mean value of TSS was 0.608, both of which exceeded the ecological model validity threshold, which indicates the reliability of the model results.
4.2 Major environmental variables affecting the distribution of P. chinensis
The results showed that precipitation of the wettest quarter (Bio16), isothermality (Bio3), average November temperature (Tmean11), and standard deviation of temperature seasonality (Bio4) were the key environmental variables affecting the geographical distribution of P. chinensis with a total contribution of 83.3%. This shows that temperature and precipitation play a central role in regulating the growth rhythm and distribution pattern of P. chinensis. By analyzing the response curves, it was found that Bio16 at 307.5–506.9 mm, Bio3 at 16.2%–31.1%, Tmean11 at − 1.7°C or to 9.7°C, and Bio4 at 9.3°C—13.1°C were suitable for P. chinensis growth.
Temperature and precipitation are the main biological determinants of plant growth status, and there are differences in water and temperature requirements between plants, with drought and high temperatures reducing the efficiency of water uptake by plants (Punyasena et al., 2008; Bradie and Leung, 2017). The P. chinensis tends to grow in light, moderately rainy environments, is tolerant of cold, and wilts easily under hot, rainy conditions (Xu et al., 2023a). The P. chinensis has a shallow root system and has a significantly higher water requirement during its growth spurt. Adequate precipitation not only increases soil water content to promote root development but also provides the necessary conditions for photosynthesis and reproductive development, while excessive precipitation may lead to waterlogging of the soil, which induces diseases such as root rot and thus inhibits the expansion of its population (Fang et al., 2021). Bio3 and Bio4 together reflect the magnitude of intra-annual temperature fluctuations. As a temperate plant, P. chinensis is sensitive to temperature changes that affect dormancy lifting and growth initiation. A small diurnal temperature difference helps to avoid extreme temperature stress and maintain normal photosynthesis and metabolic activities (Khodorova and Boitel-Conti, 2013). Moderate seasonal variation in temperature is conducive to the successful completion of the entire process of growth, differentiation, reproduction, and entry into dormancy of P. chinensis between seasons. The P. chinensis is more likely to establish stable populations in more humid climates with less temperature fluctuation. Before entering winter dormancy, P. chinensis still requires some degree of nutrient accumulation and root activity. Suitable November temperatures help it to complete the synthesis and storage of nutrients, laying the foundation for winter dormancy and emergence in the following spring. If the temperature is too low, it may lead to passive early dormancy, which can negatively affect nutrient accumulation and growth in the following year. It is worth noting that there may be synergistic effects between these key variables. For example, in areas with moderate temperature seasonality and favorable November temperatures, P. chinensis can fully accumulate nutrients before winter. However, if temperature seasonality is too high, even if the late fall temperatures are suitable, the species’ growth may still be hindered by sharp temperature fluctuations throughout the year.
The state of plant growth and distribution is the result of the synergistic effect of multidimensional ecological factors (Zhou et al., 2025). Although climatic variables are often shown to be the dominant drivers, factors such as soil physicochemical properties and geomorphological and hydrological features likewise shape species’ ecological niche boundaries (Benning and Moeller, 2021). Therefore, when formulating resource maintenance strategies, priority can be given to monitoring the dynamic thresholds of key climatic parameters while establishing a multifactor synergistic early warning mechanism to safeguard the ecological adaptability of populations and ultimately realize the sustainable use of resources.
4.3 Changes in the suitability distribution of P. chinensis
Previous studies have identified northeastern China—comprising Jilin, Liaoning, Hebei, Shandong, and Henan provinces—as the primary distribution area of P. chinensis. This is consistent with the predictions made in this study. Analysis of habitat changes indicates that the total suitable area for P. chinensis shows a general increasing trend under both SSP245 and SSP585 scenarios. Under SSP245, P. chinensis is projected to experience the most significant increase in suitable area, with expansions of 25.40% (2050s) and 23.26% (2070s) compared to the current period. Under SSP585, the suitable area continues to expand relative to the current period but is reduced by 13.17% (2050s) and 12.86% (2070s) compared to SSP245.
This suggests that although warming may have expanded the habitat of P. chinensis to some extent, the stability of its habitat is more challenged under more extreme warming scenarios. The relatively mild temperature increases in the SSP245 scenario, coupled with a moderate increase in precipitation, may provide a more balanced mix of water and heat for P. chinensis, which is conducive to the maintenance of its growth rhythm and life-cycle processes. The SSP585 scenario has a greater temperature increase, which may lead to high-temperature stress and water deficit, limiting population expansion. In addition, as a perennial herb, seed germination and seedling emergence of P. chinensis are extremely sensitive to spring temperatures and soil moisture, and climate extremes will affect population renewal and dispersal. Climate change not only affects the extent of species’ habitats but also drives the displacement of their centers of distribution (Cheng et al., 2008). When climatic conditions are outside the appropriate range for a species to survive, changes in its geographical distribution will follow (Campos et al., 2023). By calculating the distance of the center of mass movement in different periods, it was found that the center of mass of P. chinensis showed a tendency to shift to the southwestern direction. The study suggests that a warming climate will drive some species to higher altitudes and latitudes, causing them to expand and contract (Zu et al., 2021; Nuñez et al., 2023). However, since species have different physiological characteristics, their responses in the face of climate change are not entirely uniform. This study demonstrates that the habitat of P. chinensis shifted towards lower rather than higher latitudes. Species shifts toward lower latitudes often result from deteriorating habitat conditions driven by climate change, compounded by geographical anomalies (Sun et al., 2020). Variations in migration direction and distance are often influenced by the magnitude of climate warming (Poggio et al., 2018). Although temperatures are rising in the northern high latitudes, they may be unfavorable to the expansion of P. chinensis due to ecological constraints such as soil, light, or phenology. The southwestern region is characterized by mountains and plateaus, which may provide diverse microclimatic conditions for P. chinensis. Therefore, P. chinensis may maintain its adaptation to its ecological niche by migrating to lower latitudes but higher altitudes.
Changes in the distribution areas of species are the result of a combination of factors, including climate change, ecological changes, human activities, species competition, and geographical factors. This phenomenon reflects the dynamic adaptive capacity of plants to environmental changes and also reminds us to pay attention to the potential impacts of ecosystem changes on biodiversity. In response to the dynamic change of species’ habitats under the high carbon emission scenario, we can prioritize the establishment of climate-adapted protected areas in the expansion areas of habitats, carry out habitat restoration in the contraction areas, and layout relocation and protection corridors along the migration path of the center of mass of the habitats to connect the fragmented habitats and reduce the risk of migration and extinction.
4.4 Limitations of the study
The present study has several limitations that should be considered when predicting the distribution pattern of P. chinensis. First, since the model was constructed using only distribution records from within China, it may not fully capture the physiological tolerance range of the species (Feeley and Silman, 2011). Second, although parameter optimization was performed using the ENMeval toolkit, model performance may still be influenced by the choice of feature combinations. Different climate models exhibit systematic biases due to variations in physical processes and parameterization schemes (Tett et al., 2022), which can reduce the accuracy of their reproduction of historical climate states and the reliability of their future projections (Zhu and Yang, 2020). The BCC-CSM2-MR model used in this study shows significant improvements in simulating seasonal mean precipitation in East Asia; however, its temperature simulation is less accurate, with larger errors in inter-monthly variations compared to the BCC-CSM1.1m model (Li et al., 2023). In addition, the MaxEnt model has some inherent limitations (Feng et al., 2019; Schnase et al., 2021). It assumes a static environmental response and does not account for dynamic adaptive processes, such as phenotypic plasticity. The model also presumes that species can freely migrate to all suitable habitats, but in reality, seed dispersal distance limitations and human land-use barriers can significantly constrain the actual dispersal ability of species (Mou et al., 2025). Furthermore, biotic interactions and interspecies competition also play essential roles in species distribution (Hooper et al., 2005; Wisz et al., 2013). These factors may introduce a directional bias in the predictions, potentially leading to an overestimation of the expansion trend of suitable areas.
Future research suggestions include the following: (1) Integrating transboundary distribution data with functional trait parameters to construct ecological niche models that cover the full range of species; (2) using CMIP6 multimodel ensembles and downscaling techniques to quantify climate sensitivity under different emission scenarios, thereby reducing the uncertainty of regional projections; and (3) coupling individual-based and adaptive dynamic models to simulate the role of phenotypic plasticity and gene flow on the boundary expansion. These measures will aid in identifying credible expansion areas and provide scientific support for risk assessment in conservation planning.
5 Conclusion
The primary distribution of P. chinensis is currently concentrated in northern and eastern China, including the provinces of Liaoning, Hebei, and Shandong. Future climate projections suggest a general expansion of suitable habitats for P. chinensis, with the most significant increase occurring under the SSP245 scenario. Among the 12 variables analyzed, precipitation of the wettest quarter, isothermality, average November temperature, and the standard deviation of temperature seasonality emerged as the most influential factors affecting the growth of P. chinensis. The center of mass of P. chinensis habitats exhibited a southwestward shift, primarily driven by climate change. This study analyzes the spatial response patterns of P. chinensis habitat distribution under climate change and provides scientific support for its habitat adaptation, cultivation, and sustainable resource utilization.
Data availability statement
The original contributions presented in the study are included in the article/Supplementary Material. Further inquiries can be directed to the corresponding authors.
Author contributions
YW: Formal analysis, Investigation, Methodology, Writing – original draft. LY: Methodology, Visualization, Software, Writing – original draft. HS: Formal analysis, Resources, Writing – original draft. RG: Formal analysis, Writing – original draft. QG: Investigation, Writing – original draft. LH: Methodology, Writing – original draft. ER: Software, Writing – original draft. JO: Data curation, Validation, Writing – original draft. RH: Funding acquisition, Supervision, Writing – review & editing. XT: Conceptualization, Validation, Writing – review & editing.
Funding
The author(s) declare that financial support was received for the research and/or publication of this article. This work was supported by the Research Funds of the Joint Research Centre for Chinese Herbal Medicine of Anhui of IHM (yjzx2023004) and Anhui University of Chinese Medicine (RH2400000921).
Conflict of interest
The authors declare that the research was conducted in the absence of any commercial or financial relationships that could be construed as a potential conflict of interest.
Generative AI statement
The author(s) declare that no Generative AI was used in the creation of this manuscript.
Publisher’s note
All claims expressed in this article are solely those of the authors and do not necessarily represent those of their affiliated organizations, or those of the publisher, the editors and the reviewers. Any product that may be evaluated in this article, or claim that may be made by its manufacturer, is not guaranteed or endorsed by the publisher.
Supplementary material
The Supplementary Material for this article can be found online at: https://www.frontiersin.org/articles/10.3389/fpls.2025.1538566/full#supplementary-material
References
Allouche, O., Tsoar, A., Kadmon, R. (2006). Assessing the accuracy of species distribution models: prevalence, kappa and the true skill statistic (TSS). J. Appl. Ecol. 43, 1223–1232. doi: 10.1038/s41598-024-57298-2
Amiri, M., Tarkesh, M., Shafiezadeh, M. (2022). Modelling the biological invasion of Prosopis juliflora using geostatistical-based bioclimatic variables under climate change in arid zones of southwestern Iran. J. Arid Land 14, 203–224. doi: 10.1007/s40333-022-0004-1
Barber, R. A., Ball, S. G., Morris, R. K., Gilbert, F. (2022). Target-group backgrounds prove effective at correcting sampling bias in Maxent models. Diversity Distributions 28, 128–141. doi: 10.111/ddi.13442
Benning, J. W., Moeller, D. A. (2021). Plant-soil interactions limit lifetime fitness outside a native plant’s geographic range margin. Ecology 102, e03254. doi: 10.1002/ecy.3254
Bradie, J., Leung, B. (2017). A quantitative synthesis of the importance of variables used in MaxEnt species distribution models. J. Biogeography 44, 1344–1361. doi: 10.1111/jbi.12894
Brown, J. L. (2014). SDMtoolbox: a python-based GIS toolkit for landscape genetic, biogeographic and species distribution model analyses. Methods Ecol. Evol. 5, 694–700. doi: 10.1111/2041-210X.12200
Burnham, K. P., Anderson, D. R. (2004). Multimodel inference: understanding AIC and BIC in model selection. Sociological Methods Res. 33, 261–304. doi: 10.1177/0049124104268644
Campos, J. C., Garcia, N., Alírio, J., Arenas-Castro, S., Teodoro, A. C., Sillero, N. (2023). Ecological niche models using MaxEnt in Google Earth Engine: Evaluation, guidelines and recommendations. Ecol. Inf. 76, 102147. doi: 10.1016/j.ecoinf.2023.102147
Cha, S., Qi, B., Hu, H., A, L., Yong, X., Ao, W., et al. (2024). Prediction of the potential distribution area of endangeredmedicinal plant Gymnadenia conopsea in China under thebackground of climate change. Chin. J. Appl. Ecol. 35(11):3023-3030. doi: 10.13287/j.1001-9332.202411.023
Cheng, L., Zhang, M., Zhang, P., Song, Z., Ma, Z., Qu, H. (2008). Silver complexation and tandem mass spectrometry for differentiation of triterpenoid saponins from the roots of Pulsatilla chinensis (Bunge) Regel. Rapid Commun. Mass Spectrometry 22, 3783–3790. doi: 10.1002/rcm.3801
Dormann, C., McPherson, J., Araújo, M., Bivand, R., Bolliger, J., Carl, G., et al. (2007). Methods to account for spatial autocorrelation in the analysis of species distributional data: A review. Ecography 30, 609–628. doi: 10.1111/j.2007.0906-7590.05171.x
Elith, J., Phillips, S. J., Hastie, T., Dudík, M., Chee, Y. E., Yates, C. J. (2011). A statistical explanation of MaxEnt for ecologists. Diversity distributions 17, 43–57. doi: 10.1111/j.1472-4642.2010.00725.x
Fang, Y., Zhang, X., Wei, H., Wang, D., Chen, R., Wang, L., et al. (2021). Predicting the invasive trend of exotic plants in China based on the ensemble model under climate change: A case for three invasive plants of Asteraceae. Sci. Total Environ. 756, 143841. doi: 10.1016/j.scitotenv.2020.143841
Feeley, K. J., Silman, M. R. (2011). Keep collecting: accurate species distribution modelling requires more collections than previously thought. Diversity Distributions 17, 1132–1140. doi: 10.1111/j.1472-4642.2011.00813.x
Feng, X., Park, D. S., Liang, Y., Pandey, R., Papeş, M. (2019). Collinearity in ecological niche modeling: Confusions and challenges. Ecol. Evol. 9, 10365–10376. doi: 10.1002/ece3.5555
Fick, S. E., Hijmans, R. J. (2017). WorldClim 2: new 1-km spatial resolution climate surfaces for global land areas. Int. J. climatology 37, 4302–4315. doi: 10.1002/joc.5086
Fitzpatrick, M. C., Gotelli, N. J., Ellison, A. M. (2013). MaxEnt versus MaxLike: empirical comparisons with ant species distributions. Ecosphere 4, 55. doi: 10.1890/ES13-00066.1
Glor, R. E., Warren, D. (2011). Testing ecological explanations for biogeographic boundaries. Evolution 65, 673–683. doi: 10.1111/j.1558-5646.2010.01177.x
Guo, Y., Zhang, S., Tang, S., Pan, J., Ren, L., Tian, X., et al. (2023). Analysis of the prediction of the suitable distribution of Polygonatum kingianum under different climatic conditions based on the MaxEnt model. Front. Earth Sci. 11. doi: 10.3389/feart.2023.1111878
Hirzel, A. H., Helfer, V., Metral, F. (2001). Assessing habitat-suitability models with a virtual species. Ecol. Model. 145, 111–121. doi: 10.1016/S0304-3800(01)00396-9
Hooper, D. U., Chapin, F. S., III, Ewel, J. J., Hector, A., Inchausti, P., Lavorel, S., et al. (2005). Effects of biodiversity on ecosystem functioning: a consensus of current knowledge. Ecol. Monogr. 75, 3–35. doi: 10.1016/j.drugalcdep.2010.01.006
Huang, E., Chen, Y., Yu, S. (2024). Climate factors drive plant distributions at higher taxonomic scales and larger spatial scales. Front. Ecol. Evol. 11. doi: 10.3389/fevo.2023.1233936
Khodorova, N. V., Boitel-Conti, M. (2013). The role of temperature in the growth and flowering of geophytes. Plants (Basel) 2, 699–711. doi: 10.3390/plants2040699
Li, J., Fan, G., He, Y. (2020). Predicting the current and future distribution of three Coptis herbs in China under climate change conditions, using the MaxEnt model and chemical analysis. Sci. Total Environ. 698, 134141. doi: 10.1016/j.scitotenv.2019.134141
Li, W., Ji, J., Tang, W., Rui, X., Chen, X., Jiang, M., et al. (2014). Characterization of an antiproliferative exopolysaccharide (LHEPS-2) from Lactobacillus helveticus MB2-1. Carbohydr. Polymers 105, 334–340. doi: 10.1016/j.carbpol.2014.01.093
Li, S., Quan, W., Wang, Z., Chen, Y., Su, T., Yan, P. (2023). Evaluation of the ability of BCC-CSM2-MR global climate model in simulating precipitation and temperature in East Asia. J. Arid Meteorology 41, 984–996. doi: 10.11755/j.issn.1006-7639(2023)-06-0984
Li, W., Shi, M., Huang, Y., Chen, K., Sun, H., Chen, J. (2019). Climatic change can influence species diversity patterns and potential habitats of Salicaceae plants in China. Forests 10, 220. doi: 10.3390/f10030220
Liu, C., Berry, P. M., Dawson, T. P., Pearson, R. G. (2005). Selecting thresholds of occurrence in the prediction of species distributions. Ecography 28, 385–393. doi: 10.1111/j.0906-7590.2005.03957.x
Low, B. W., Zeng, Y., Tan, H. H., Yeo, D. C. (2021). Predictor complexity and feature selection affect Maxent model transferability: Evidence from global freshwater invasive species. Diversity Distributions 27, 497–511. doi: 10.1111/ddi.13211
Moreno-Amat, E., Mateo, R. G., Nieto-Lugilde, D., Morueta-Holme, N., Svenning, J.-C., García-Amorena, I. (2015). Impact of model complexity on cross-temporal transferability in Maxent species distribution models: An assessment using paleobotanical data. Ecol. Model. 312, 308–317. doi: 10.1016/j.ecolmodel.2015.05.035
Mou, W., Jin, C., Hu, S., Zhou, L., Luo, M., Long, Y., et al. (2025). Human activities affect the future suitability of alien urban landscape species in China under climate change. J. Environ. Manage. 380, 124899. doi: 10.1016/j.jenvman.2025.124899
Muscarella, R., Galante, P. J., Soley-Guardia, M., Boria, R. A., Kass, J. M., Uriarte, M., et al. (2014). ENMeval: An R package for conducting spatially independent evaluations and estimating optimal model complexity for Maxent ecological niche models. Methods Ecol. Evol. 5, 1198–1205. doi: 10.1111/2041-210X.12261
Ni, M., Vellend, M. (2024). Soil properties constrain predicted poleward migration of plants under climate change. New Phytol. 241, 131–141. doi: 10.1111/nph.19164
Nuñez, T. A., Prugh, L. R., Lambers, J. H. R. (2023). Animal-mediated plant niche tracking in a changing climate. Trends Ecol. Evol. 38, 654–665. doi: 10.1016/j.tree.2023.02.005
Phillips, S. J., Anderson, R. P., Schapire, R. E. (2006). Maximum entropy modeling of species geographic distributions. Ecol. Model. 190, 231–259. doi: 10.1016/j.ecolmodel.2005.03.026
Poggio, L., Simonetti, E., Gimona, A. (2018). Enhancing the WorldClim data set for national and regional applications. Sci. Total Environ. 625, 1628–1643. doi: 10.1016/j.scitotenv.2017.12.258
Punyasena, S. W., Eshel, G., McElwain, J. C. (2008). The influence of climate on the spatial patterning of Neotropical plant families. J. Biogeography 35, 117–130. doi: 10.1111/j.1365-2699.2007.01773.x
Radosavljevic, A., Anderson, R. P. (2014). Making better Maxent models of species distributions: complexity, overfitting and evaluation. J. biogeography 41, 629–643. doi: 10.1111/jbi.12227
Remya, K., Ramachandran, A., Jayakumar (2015). Predicting the current and future suitable habitat distribution of Myristica dactyloides Gaertn. using MaxEnt model in the Eastern Ghats, India. Ecol. Eng. 82, 184–188. doi: 10.1016/j.ecoleng.2015.04.053
Ren, G., Chan, J. C., Kubota, H., Zhang, Z., Li, J., Zhang, Y., et al. (2021). Historical and recent change in extreme climate over East Asia. Climatic Change 168, 1–19. doi: 10.1007/s10584-021-03227-5
Schnase, J. L., Carroll, M. L., Gill, R. L., Tamkin, G. S., Li, J., Strong, S. L., et al. (2021). Toward a Monte Carlo approach to selecting climate variables in MaxEnt. PloS One 16, e0237208. doi: 10.1371/journal.pone.0237208
Shi, J., Xia, M., He, G., Gonzalez, N. C., Zhou, S., Lan, K., et al. (2024). Predicting Quercus gilva distribution dynamics and its response to climate change induced by GHGs emission through MaxEnt modeling. J. Environ. Manage. 357, 120841. doi: 10.1016/j.jenvman.2024.120841
Shi, X., Yin, Q., Sang, Z., Zhu, Z., Jia, Z., Ma, L. (2021). Prediction of potentially suitable areas for the introduction of Magnolia wufengensis under climate change. Ecol. Indic. 127, 107762. doi: 10.1016/j.ecolind.2021.107762
Sun, Y., Liu, J., Yu, H., Gong, C. (2010). Isolation and evaluation of immunological adjuvant activities of saponins from the roots of Pulsatilla chinensis with less adverse reactions. Int. Immunopharmacol. 10, 584–590. doi: 10.1016/j.intimp.2010.02.006
Sun, S., Zhang, Y., Huang, D., Wang, H., Cao, Q., Fan, P., et al. (2020). The effect of climate change on the richness distribution pattern of oaks (Quercus L.) in China. Sci. Total Environ. 744, 140786. doi: 10.1016/j.scitotenv.2020.140786
Tett, S. F. B., Gregory, J. M., Freychet, N., Cartis, C., Mineter, M. J., Roberts, L. (2022). Does model calibration reduce uncertainty in climate projections? J. Climate 35, 2585–2602. doi: 10.1175/JCLI-D-21-0434.1
Wang, E., Lu, Z., Rohani, E. R., Ou, J., Tong, X., Han, R. (2024). Current and future distribution of Forsythia suspensa in China under climate change adopting the MaxEnt model. Front. Plant Sci. 15. doi: 10.3389/fpls.2024.1394799
Wang, G., Wang, C., Guo, Z., Dai, L., Xue, F. (2020). Integrating Maxent model and landscape ecology theory for studying spatiotemporal dynamics of habitat: Suggestions for conservation of endangered Red-crowned crane. Ecol. Indic. 116, 106472. doi: 10.1016/j.ecolind.2020.106472
Warren, D. L., Seifert, S. N. (2011). Ecological niche modeling in Maxent: the importance of model complexity and the performance of model selection criteria. Ecol. Appl. 21, 335–342. doi: 10.1890/10-1171.1
Warren, D. L., Wright, A. N., Seifert, S. N., Shaffer, H. B. (2014). Incorporating model complexity and spatial sampling bias into ecological niche models of climate change risks faced by 90 California vertebrate species of concern. Diversity distributions 20, 334–343. doi: 10.1111/ddi.12160
Wisz, M. S., Pottier, J., Kissling, W. D., Pellissier, L., Lenoir, J., Damgaard, C. F., et al. (2013). The role of biotic interactions in shaping distributions and realised assemblages of species: implications for species distribution modelling. Biol. Rev. 88, 15–30. doi: 10.1111/j.1469-185X.2012.00235.x
Wouyou, H. G., Lokonon, B. E., Idohou, R., Zossou-Akete, A. G., Assogbadjo, A. E., Kakaï, R. G. (2022). Predicting the potential impacts of climate change on the endangered Caesalpinia bonduc (L.) Roxb in Benin (West Africa). Heliyon 8(3):e09022. doi: 10.1016/j.heliyon.2022.e09022
Wu, T., Lu, Y., Fang, Y., Xin, X., Li, L., Li, W., et al. (2019). The Beijing climate center climate system model (BCC-CSM): The main progress from CMIP5 to CMIP6. Geoscientific Model. Dev. 12, 1573–1600. doi: 10.5194/gmd-12-1573-2019
Xia, Y., Zhao, J., Ding, J., Xu, K., Zhou, X., Xiang, M., et al. (2024). Geographical distribution of two major quarantine fruit flies (Bactrocera minax Enderlein and Bactrocera dorsalis Hendel) in Sichuan Basin based on four SDMs. PeerJ 12, e16745. doi: 10.7717/peerj.16745
Xu, N., Liu, Y., Li, J., Su, W., Ma, W., Yao, N., et al. (2023a). Investigation on the associated plant resources of Pulsatilla chinensis ecological environments in Yanshan area. Biotic Resour. 45, 41–51. doi: 10.14188/j.ajsh.2023.01.005
Xu, Y., Zhu, R., Gao, L., Huang, D., Fan, Y., Liu, C., et al. (2023b). Predicting the current and future distributions of Pennisetum alopecuroides (L.) in China under climate change based on the MaxEnt model. PloS One 18, e0281254. doi: 10.1371/journal.pone.0281254
Zhang, B., Cai, C., Xie, Z., Yu, H., Liu, G., Lu, D., et al. (2024). Ecological Suitability of Paris polyphylla var. yunnanensis in China under the Situation of Climate Change. J. Plant Genet. Resour. 25, 1601–1612. doi: 10.13430/j.cnki.jpgr.20231226002
Zhang, L., Chen, X., Xin, X. (2019). Short commentary on CMIP6 scenario model intercomparison project (ScenarioMIP). Adv. Climate Change Res. 15, 519. doi: 10.12006/j.issn.1673-1719.2019.082
Zhang, J. M., Peng, X. Y., Song, M. L., Li, Z. J., Xu, X. Q., Wang, W. (2022). Effects of climate change on the distribution of wild Akebia trifoliata. Ecol. Evol. 12, e8714. doi: 10.1002/ece3.8714
Zhao, Z., Nian, M., Qiao, H., Li, B., Zheng, X. (2021). Pulsatilla chinensis: A review of traditional uses, phytochemistry and pharmacology research progress. Arabian J. Chem. 14, 103403. doi: 10.1016/j.arabjc.2021.103403
Zhou, H., Li, A., Luo, X., Wang, J., Xie, Y., Lin, Z., et al. (2025). Climate change impacts on the predicted geographic distribution of Betula tianschanica Rupr. Front. Plant Sci. 16. doi: 10.3389/fpls.2025.1528255
Zhu, Y., Yang, S. (2020). Evaluation of CMIP6 for historical temperature and precipitation over the Tibetan Plateau and its comparison with CMIP5. Adv. Climate Change Res. 11, 239–251. doi: 10.1016/j.accre.2020.08.001
Keywords: ArcGIS, ecological suitability zoning, future climate change, MaxEnt model, Pulsatilla chinensis
Citation: Wu Y, Yan L, Shen H, Guan R, Ge Q, Huang L, Rohani ER, Ou J, Han R and Tong X (2025) Potentially suitable geographical area for Pulsatilla chinensis Regel under current and future climatic scenarios based on the MaxEnt model. Front. Plant Sci. 16:1538566. doi: 10.3389/fpls.2025.1538566
Received: 03 December 2024; Accepted: 28 April 2025;
Published: 14 May 2025.
Edited by:
Raul Antonio Sperotto, Federal University of Pelotas, BrazilReviewed by:
Renata Retkute, University of Cambridge, United KingdomDandong Cheng, Northwest University, China
Copyright © 2025 Wu, Yan, Shen, Guan, Ge, Huang, Rohani, Ou, Han and Tong. This is an open-access article distributed under the terms of the Creative Commons Attribution License (CC BY). The use, distribution or reproduction in other forums is permitted, provided the original author(s) and the copyright owner(s) are credited and that the original publication in this journal is cited, in accordance with accepted academic practice. No use, distribution or reproduction is permitted which does not comply with these terms.
*Correspondence: Jinmei Ou, b2ptQGFodGNtLmVkdS5jbg==; Rongchun Han, aGFuckBhaHRjbS5lZHUuY24=; Xiaohui Tong, dHdlbnR5dG9uZ0Bob3RtYWlsLmNvbQ==
†These authors have contributed equally to this work
 Yanan Wu1†
 Emelda Rosseleena Rohani
 Rongchun Han
 Xiaohui Tong