 Wenze Liu1
 Shengwei Zhou1
 Yuxin Zheng1Wenchuan Hou1Leixia Chu1,2,3Ning Dong1,2,3
 Ruihang Zhang4Mengping Wang1Xupeng Gu1Jie Wan5Shouhua Liu6
 Linlin Yang1,2,3*Chengming Dong1,2,3*
- 1Henan Provincial Ecological Planting Engineering Technology Research Center of Daodi Herbs, School of Pharmacy, Henan University of Chinese Medicine, Zhengzhou, Henan, China
- 2Henan University of Chinese Medicine, The Engineering and Technology Center for Chinese Medicine Development of Henan, Zhengzhou, Henan, China
- 3Co-construction Collaborative Innovation Centre for Chinese Medicine and Respiratory Diseases by Henan & Education Ministry of PR China, Henan University of Chinese Medicine, Zhengzhou, Henan, China
- 4China Academy of Chinese Medical Sciences, Graduate School of China Academy of Chinese Medical Sciences, Beijing, China
- 5The First Affiliated Hospital of Henan University of Chinese Medicine, Zhengzhou, Henan, China
- 6Hongqiang Chinese Medicinal Herbs Planting Professional Cooperative, Shangqiu, Henan, China
Light is one of the most pivotal environmental factors in plant life activities and plays a crucial role in regulating the synthesis of plant secondary metabolites. However, there is no report on the response mechanism of F. multiflora to different light quality treatments. In this study, different light qualities were applied. Physiological characteristics and secondary metabolites of plants, including leaf area, chlorophyll, proline, physcion, emodi, THSG etc., were measured after 20-day light quality treatment. Subsequently, the FmARF gene family was identified and analyzed the expression under the impact of light quality. Results showed that the blue-light treatment group significantly increased the leaf area by 46.19% and chlorophyll content by 7.35%, decreased the plant height by 20.92%, and increased the THSG content in roots by 28.37% and in stems by 27.15%. The yellow-light treatment significantly increased the proline content by 94.47% and the soluble sugar content by 19.03%. The red-light treatment significantly increased the plant height by 83.56%. There are 37 FmARF genes in F. multiflora, which are classified into four sub-families. Whole-genome duplication and segmental duplication are the predominant expansion modes. The promoters are abundant in light and other response elements, and most genes show tissue-specific expression. Correlation prediction analysis revealed that in the stems, the content of stilbene glycoside was significantly negatively correlated with FmARF9 and 30, and free anthraquinone components such as physcion and emodin were significantly negatively correlated with FmARF2, 5 etc. In the roots, the content of stilbene glycoside was significantly negatively correlated with FmARF8, 9, 29, and positively correlated with FmARF17; physcion was negatively correlated with FmARF2, 5 etc., and positively correlated with FmARF8, 9 etc.; emodin was negatively correlated with FmARF2, 5 etc., and positively correlated with FmARF9, 15 etc. This study demonstrates that there are significant differences in the growth and development of F. multiflora under different light quality treatments. The FmARF gene family may mediate light quality regulation and metabolic synthesis pathways. This research provides a theoretical basis for the functional identification of key candidate genes for light regulation and the study of the molecular mechanism of light regulation in F. multiflora.
1 Introduction
Fallopia multiflora (Thunb.), a perennial herbaceous plant in the genus Fallopia of the family Polygonaceae, is medicinally used with its dried tuberous roots and stems. The dried tuberous roots exhibit effects in preventing and treating hyperlipidemia, atherosclerosis, ischemic stroke, neurological disorders, and other diseases (Zhang and Chen, 2018; Gao et al., 2025). F. multiflora-related preparations and washing products have a huge sales market and are used in multiple countries and regions for treating allergies and alopecia (Zhang et al., 2009).
Light quality, as a crucial environmental factor, is one of the key environmental signals regulating plant growth, development, and stress resistance. It influences plant morphological and physiological characteristics at the macroscopic level, as well as internal metabolites and enzyme activities at the microscopic level, through light of different wavelengths during plant growth and development (Soltani et al., 2023). Plant responses to external environmental factors are primarily regulated by transcription factors (TFs). As a class of essential regulatory factors universally present in plants, TFs participate in key physiological reactions such as stress regulatory networks and signal transduction pathways during light-quality-mediated plant growth (Niu et al., 2017). Among them, auxin response factors (ARFs) are regarded as core proteins regulating auxin-responsive genes, playing a vital role in multiple stages of plant growth and development (Tiwari et al., 2003; Garcia-Gonzalez et al., 2020). As key factors in the auxin signaling pathway, ARFs specifically bind to auxin response elements, thereby influencing the expression of auxin-responsive genes in plants (Yu et al., 2014). Studies have shown that ARFs have diverse biological functions and are crucial for regulating various aspects of plant growth and development. For example, Arabidopsis AtARF1 and AtARF2 regulate leaf and floral organ senescence (Guilfoyle and Hagen, 2007); AtARF7 and AtARF19 control lateral root formation (Wilmoth et al., 2005); rice OsARF7 is involved in regulating root development (Sun et al., 2025); overexpression of Phyllostachys edulis PeARF41 reduces the contents of hemicellulose, cellulose, and lignin, thereby inhibiting family secondary cell wall formation (Yang et al., 2025). However, research on the growth and development of F. multiflora under light quality regulation and the regulatory mechanism of the ARF gene family in F. multiflora growth and development has not been reported.
This study firstly explores the growth, development, and physiological-biochemical changes of F. multiflora under light quality regulation, and analyzes the content variations of emodin methyl ether, emodin, stilbene glycosides, and other substances. Additionally, bioinformatics methods are employed to screen and identify members of the ARF transcription factor gene family in F. multiflora, and to analyze their phylogenetic relationships, gene structures, physicochemical properties, etc. The expression characteristics of FmARF genes in roots, stems, and leaves of F. multiflora under different light qualities are analyzed by qRT−PCR, providing a theoretical basis for further research on the response mechanisms of F. multiflora at both macroscopic and microscopic levels under light quality regulation. Meanwhile, it also offers a theoretical foundation for the functional identification of key candidate genes involved in light regulation and the exploration of molecular mechanisms of light regulation in F. multiflora.
2 Materials and methods
2.1 Sample collection and processing protocols
The Fallopia multiflora (Thunb.) used in this experiment was obtained from the Engineering Technology Research Center for Ecological Planting of Authentic Medicinal Materials at Henan University of Chinese Medicine, Henan Province. The tissue-cultured seedlings were inoculated into a medium composed of 1/2MS, 0.1 mg·L-1 NAA, 0.1 mg·L-1 IAA, 6 g·L-1 agar, and 30 g·L-1 sucrose. After 15 days of cultivation in a photoperiod incubator maintained at 25 °C, 45% humidity, and a light intensity of 225 μmol·m-2·s-1, seedlings with 4−5 true leaves and a plant height of 1−2 cm were selected for treatment. Four treatment groups were established, including yellow light (Y: 590 nm, FWHM: 18.2 nm), white light (W: 450 nm (6500K), FWHM: 25.4 nm), blue light (B: 460 nm, FWHM: 19.5 nm), and red light (R: 660 nm, FWHM: 19.2 nm). All groups were subjected to a consistent light intensity of 225 μmol·m-2·s-1, and each group had 30 replicates. White light was used as the control group to investigate the core driving effects of monochromatic light on plant photosynthesis and photomorphogenesis. On the 20th day, uniform-growth roots, stems, and leaves tissue samples of F. multiflora under different light treatments were collected, immediately treated with liquid nitrogen, and then stored in a -80°C refrigerator.
2.2 Determination of growth and physiological indicators of F. multiflora
After 20 days of different light quality treatments, growth indices including fresh weight, leaf area, plant height, and color difference of leaf adaxial surface were measured. The contents of chlorophyll a (Chl a), chlorophyll b (Chl b), and carotenoids (Car) in F. multiflora leaves were determined by 95% ethanol extraction method: the 3rd fully expanded leaf from the top of the plant was selected. The main vein was removed, and the leaves were cut into pieces. A 0.2 g aliquot of the cut leaves was weighed, followed by the addition of 20 mL of 95% ethanol. The mixture was incubated in the dark for 24 h and inverted to mix evenly. Using 95% ethanol as the blank control, the absorbance was measured at wavelengths of 665 nm, 649 nm, and 470 nm.
The soluble sugar content was assayed using the Solarbio Plant Soluble Sugar Content Detection Kit (Product Lot: BC0030-50T/48s), and the proline content was measured with the Solarbio Proline (Pro) Content Detection Kit (Product Lot: BC0290-50T/48S).
Calculation Formula for Chlorophyll Content:
CChl a, CChl b, and CCar represent the total concentrations of chlorophyll a, chlorophyll b, and carotenoids, respectively, with the unit of mg·L-1.
2.3 Changes in secondary metabolite contents of F. multiflora
2.3.1 Sample preparation
After freeze-drying the stem and root samples of F. multiflora to constant weight and grinding them through a No. 3 sieve, 0.5 g of stem and root samples treated with different light qualities were taken, added to 10 ml of methanol-water solution (90:10, v/v), and subjected to ultrasonic treatment (power 300 W, frequency 40 kHz) for 30 min. After the conical flask was cooled, the weight loss was made up, and the solution was filtered to obtain the test sample.
2.3.2 Chromatographic conditions
Analysis was performed using an Agilent 1260 Infinity III(Column Type: Agilent ZORBAX SB-C18 4.6×250mm,5µm). The gradient elution system consisted of phosphoric acid water (0.1:99.9) (A) and acetonitrile (B), and separation was achieved using the following gradient elution program: 0–10 min: 80% A; 11–15 min: 70% A; 16–30 min: 55% A; 31–35 min: 20% A; 36–40 min: 10% A; 41–60 min: 90% A. The injection volume was 10 μL, the flow rate was 1 mL/min, and the system was operated at 30°C. The detection wavelengths were 320 nm and 222 nm.
2.3.3 Investigation of linear relationship
Methanol solutions containing physcion, emodin, and THSG were prepared and diluted to appropriate concentrations to establish standard curves. The standard regression equations for physcion, emodin, and THSG were Y = 79540X−34094 (R²=0.999, Linear Range:1-40µg·ml-1), Y = 56678X−33868 (R²=0.9993, Linear Range: 0.5-20µg·ml-1), and Y = 25739X−32767 (R²=0.9998, Linear Range: 2.5-200µg·ml-1), respectively. The peak areas obtained from the liquid phase of the three were substituted into the standard regression equations to obtain the compound concentrations and calculate the compound contents.
2.3.4 Precision experiment
An aliquot of the same test sample solution was precisely pipetted and injected consecutively for 6 times. The contents of THSG, emodin, and physcion were determined separately. Their relative standard deviations (RSDs) were calculated to be 0.56%, 1.26%, and 1.52%, respectively, indicating good instrument precision.
2.3.5 Reproducibility test
Six parallel aliquots of the test sample solution were prepared from the same batch of powdered medicinal material, following the established test sample solution preparation protocol. The contents of THSG, emodin, and physcion were determined separately, and their relative standard deviations (RSDs) were calculated to be 1.482578%, 2.089089%, and 2.4724%, respectively. These results confirmed good repeatability of the developed method.
2.3.6 Sample stability
An aliquot of the same test sample solution was precisely pipetted, and the contents of THSG, emodin, and physcion were determined at 0, 3, 6, 12, 24, and 48 hours, respectively. Their relative standard deviations (RSDs) were calculated to be 0.92%, 1.98%, and 1.86%, which indicated that the test sample solution exhibited good stability at room temperature within 48 hours.
2.3.7 Spiked recovery test
The herbal powder sample with a known content was accurately weighed and divided into 6 aliquots. A standard substance equivalent to 100% of the sample content was added to each aliquot. The test sample solutions were prepared following the method described in “Section 2.3.1”, and the recovery rates were calculated under the chromatographic conditions specified in “Section 2.3.2”.Results showed that the recovery rates of THSG, emodin, and physcion were 100.00%, 100.02%, and 100.01%, respectively, with relative standard deviations (RSD) of 2.93%, 1.45%, and 1.35%. These results indicate that the method has good accuracy.
2.4 Identification and bioinformatics analysis of the FmARF family
The whole-genome annotation files of F. multiflora (Zhao et al., 2023)were downloaded from the Figshare database (http://dx.doi.org/10.6084/m9.figshare.19720381), and the reference sequences of Arabidopsis thaliana AtARF gene family were obtained from the TAIR database (https://www.arabidopsis.org/). TBtools (Chen et al., 2020) was used for bidirectional BLAST between F. multiflora and Arabidopsis thaliana to preliminarily screen ARF protein sequences in F. multiflora; all protein sequences were downloaded from UniPort (https://www.uniprot.org/) as library sequences, and the screened protein sequences were subjected to Blast alignment again to obtain candidate genes. The Protein Paramter Calc tool of TBtools software was used to analyze the basic physicochemical properties of the FmARF transcription factor family.
2.5 Analysis of conserved motifs, domains, promoter cis-elements, and gene structures of FmARF genes
The conserved motifs in FmARF proteins were identified using the Simple MEME Wrapper tool in TBtools, with the motif number set to 10. Conserved domains were determined via the Batch CDD-Search tool on NCBI (https://www.ncbi.nlm.nih.gov/).
The 2,000 bp upstream sequences from the start codons of FmARF genes were extracted as promoter regions using the Gft/Gff3 Sequences Extract tool in TBtools. These sequences were submitted to the Plantcare database for cis-acting element prediction. The Gene Structure View (Advanced) function in TBtools was employed to visualize the combined data of domains, motifs, gene structures, and promoter elements.
2.6 Chromosomal localization and intra/intergroup collinearity analysis of the FmARF gene family
The gene density files were obtained using the Gene Density Profile tool in TBtools. The chromosomal location information of F. multiflora FmARF gene members was derived from genome annotation data, and their positions on chromosomes were visualized by Gene Location Visualize (Advanced).
Collinearity files between F. multiflora FmARF and Arabidopsis thaliana AtARF genes were generated using One Step MCScanX-Super Fast. Chromosomal gene density files were acquired via Gene Density Profile, while gene GC-ratio and GC-skew were obtained by Fasta Window stat. All these data were subjected to visual processing in the Advanced Circos tool.
2.7 Expression pattern analysis of FmARF family members
2.7.1 RNA extraction and cDNA synthesis
According to the prediction results of promoter cis-acting elements, gene sequences with promoters containing more light-responsive cis-acting elements were selected for expression pattern analysis. The total RNA of F. multiflora materials treated with different light qualities on day 20 was extracted using a plant polyphenol and polysaccharide total RNA extraction kit. cDNA was obtained by reverse transcription using the HiScript® III RT SuperMix for qPCR (+gDNA wiper) kit.
2.7.2 Quantitative real-time PCR
2.7.2.1 Primer design
Specific primers for 15 FmARF genes were designed using the online primer design program of Sangon Biotech (Table 1). The reference gene was PP2A, and the primer sequence information is shown in Table 1. All primers were synthesized by Shanghai Sangon Biotech Co., Ltd.
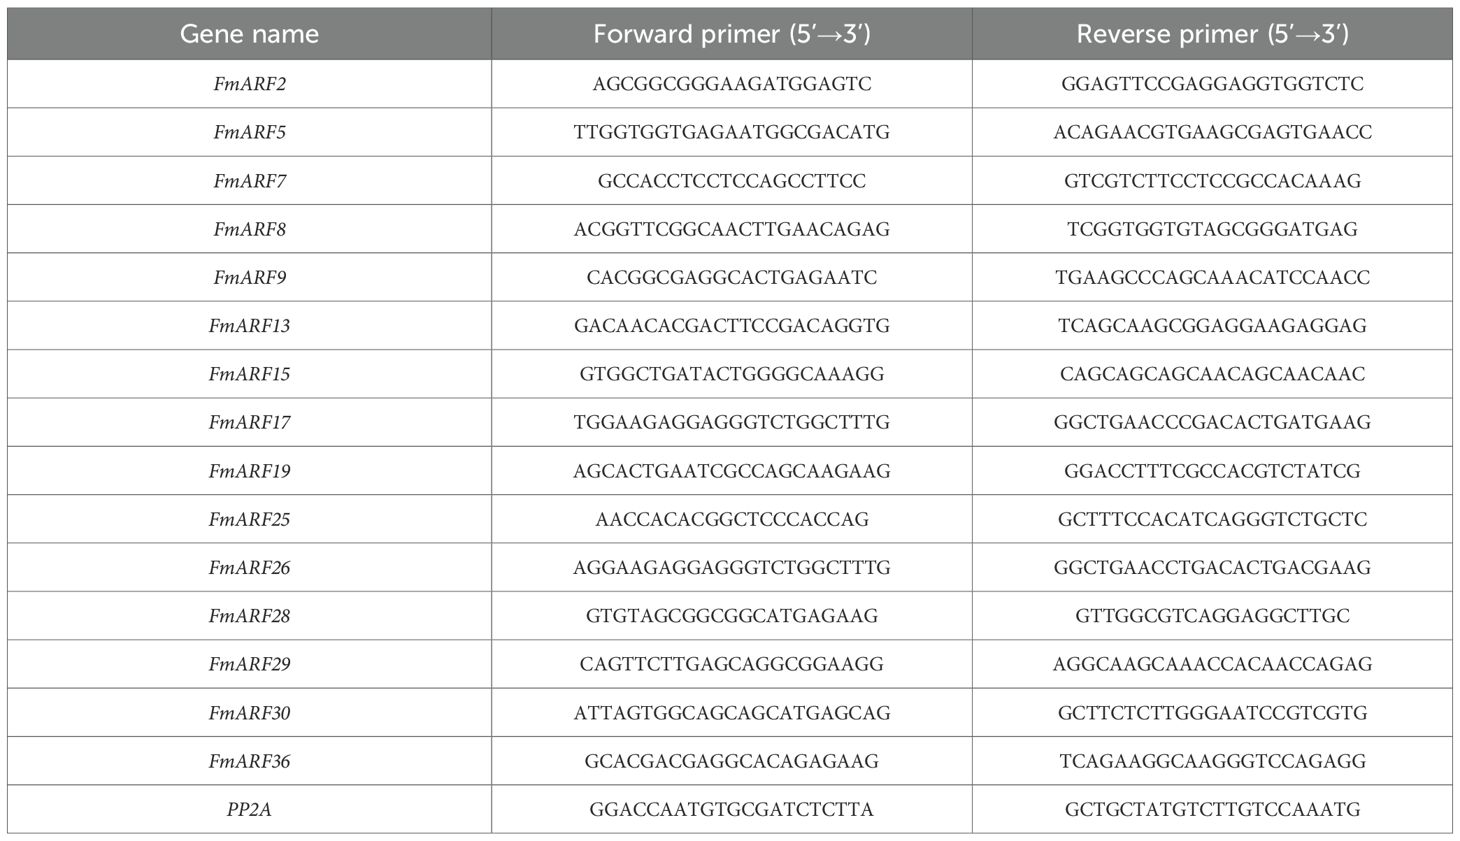
Table 1. F. multiflora ARF gene primer sequence.
2.7.2.2 Reaction system
7 μL ddH2O, 10 μL PowerTrack™ SYBR Green Master Mix, 1 μL forward primer, 1 μL reverse primer, and 1 μL cDNA.
2.7.2.3 Reaction program
UDG enzyme activation at 50 °C for 2 min, pre-denaturation at 95 °C for 2 min, followed by 40 cycles of denaturation at 95 °C for 15 s, annealing at 60 °C for 15 s, and extension at 72 °C for 60 s. Each sample was subjected to three biological replicates.
2.8 Data processing
Statistical analysis of qRT-PCR data was performed using Microsoft® Excel 2021. The relative expression levels of genes were calculated via the 2—ΔΔCt algorithm. One-way ANOVA and bar chart visualization were conducted using GraphPad Prism 9.5.0. Heatmap generation was executed with TBtools 2.0.
3 Results and analysis
3.1 Biomass changes of F. multiflora
The growth and development of F. multiflora changed under different light quality treatments (Figures 1A-C). Compared with white light, the leaf fresh weight, stem fresh weight, and root fresh weight under yellow light decreased by 41.09%, 16.31%, and 11.85%, respectively; under red light, the leaf fresh weight, stem fresh weight, and root fresh weight decreased by 21.23%, 33.33%, and 34.82%, respectively; there was no significant change in these indicators under blue light compared with white light.
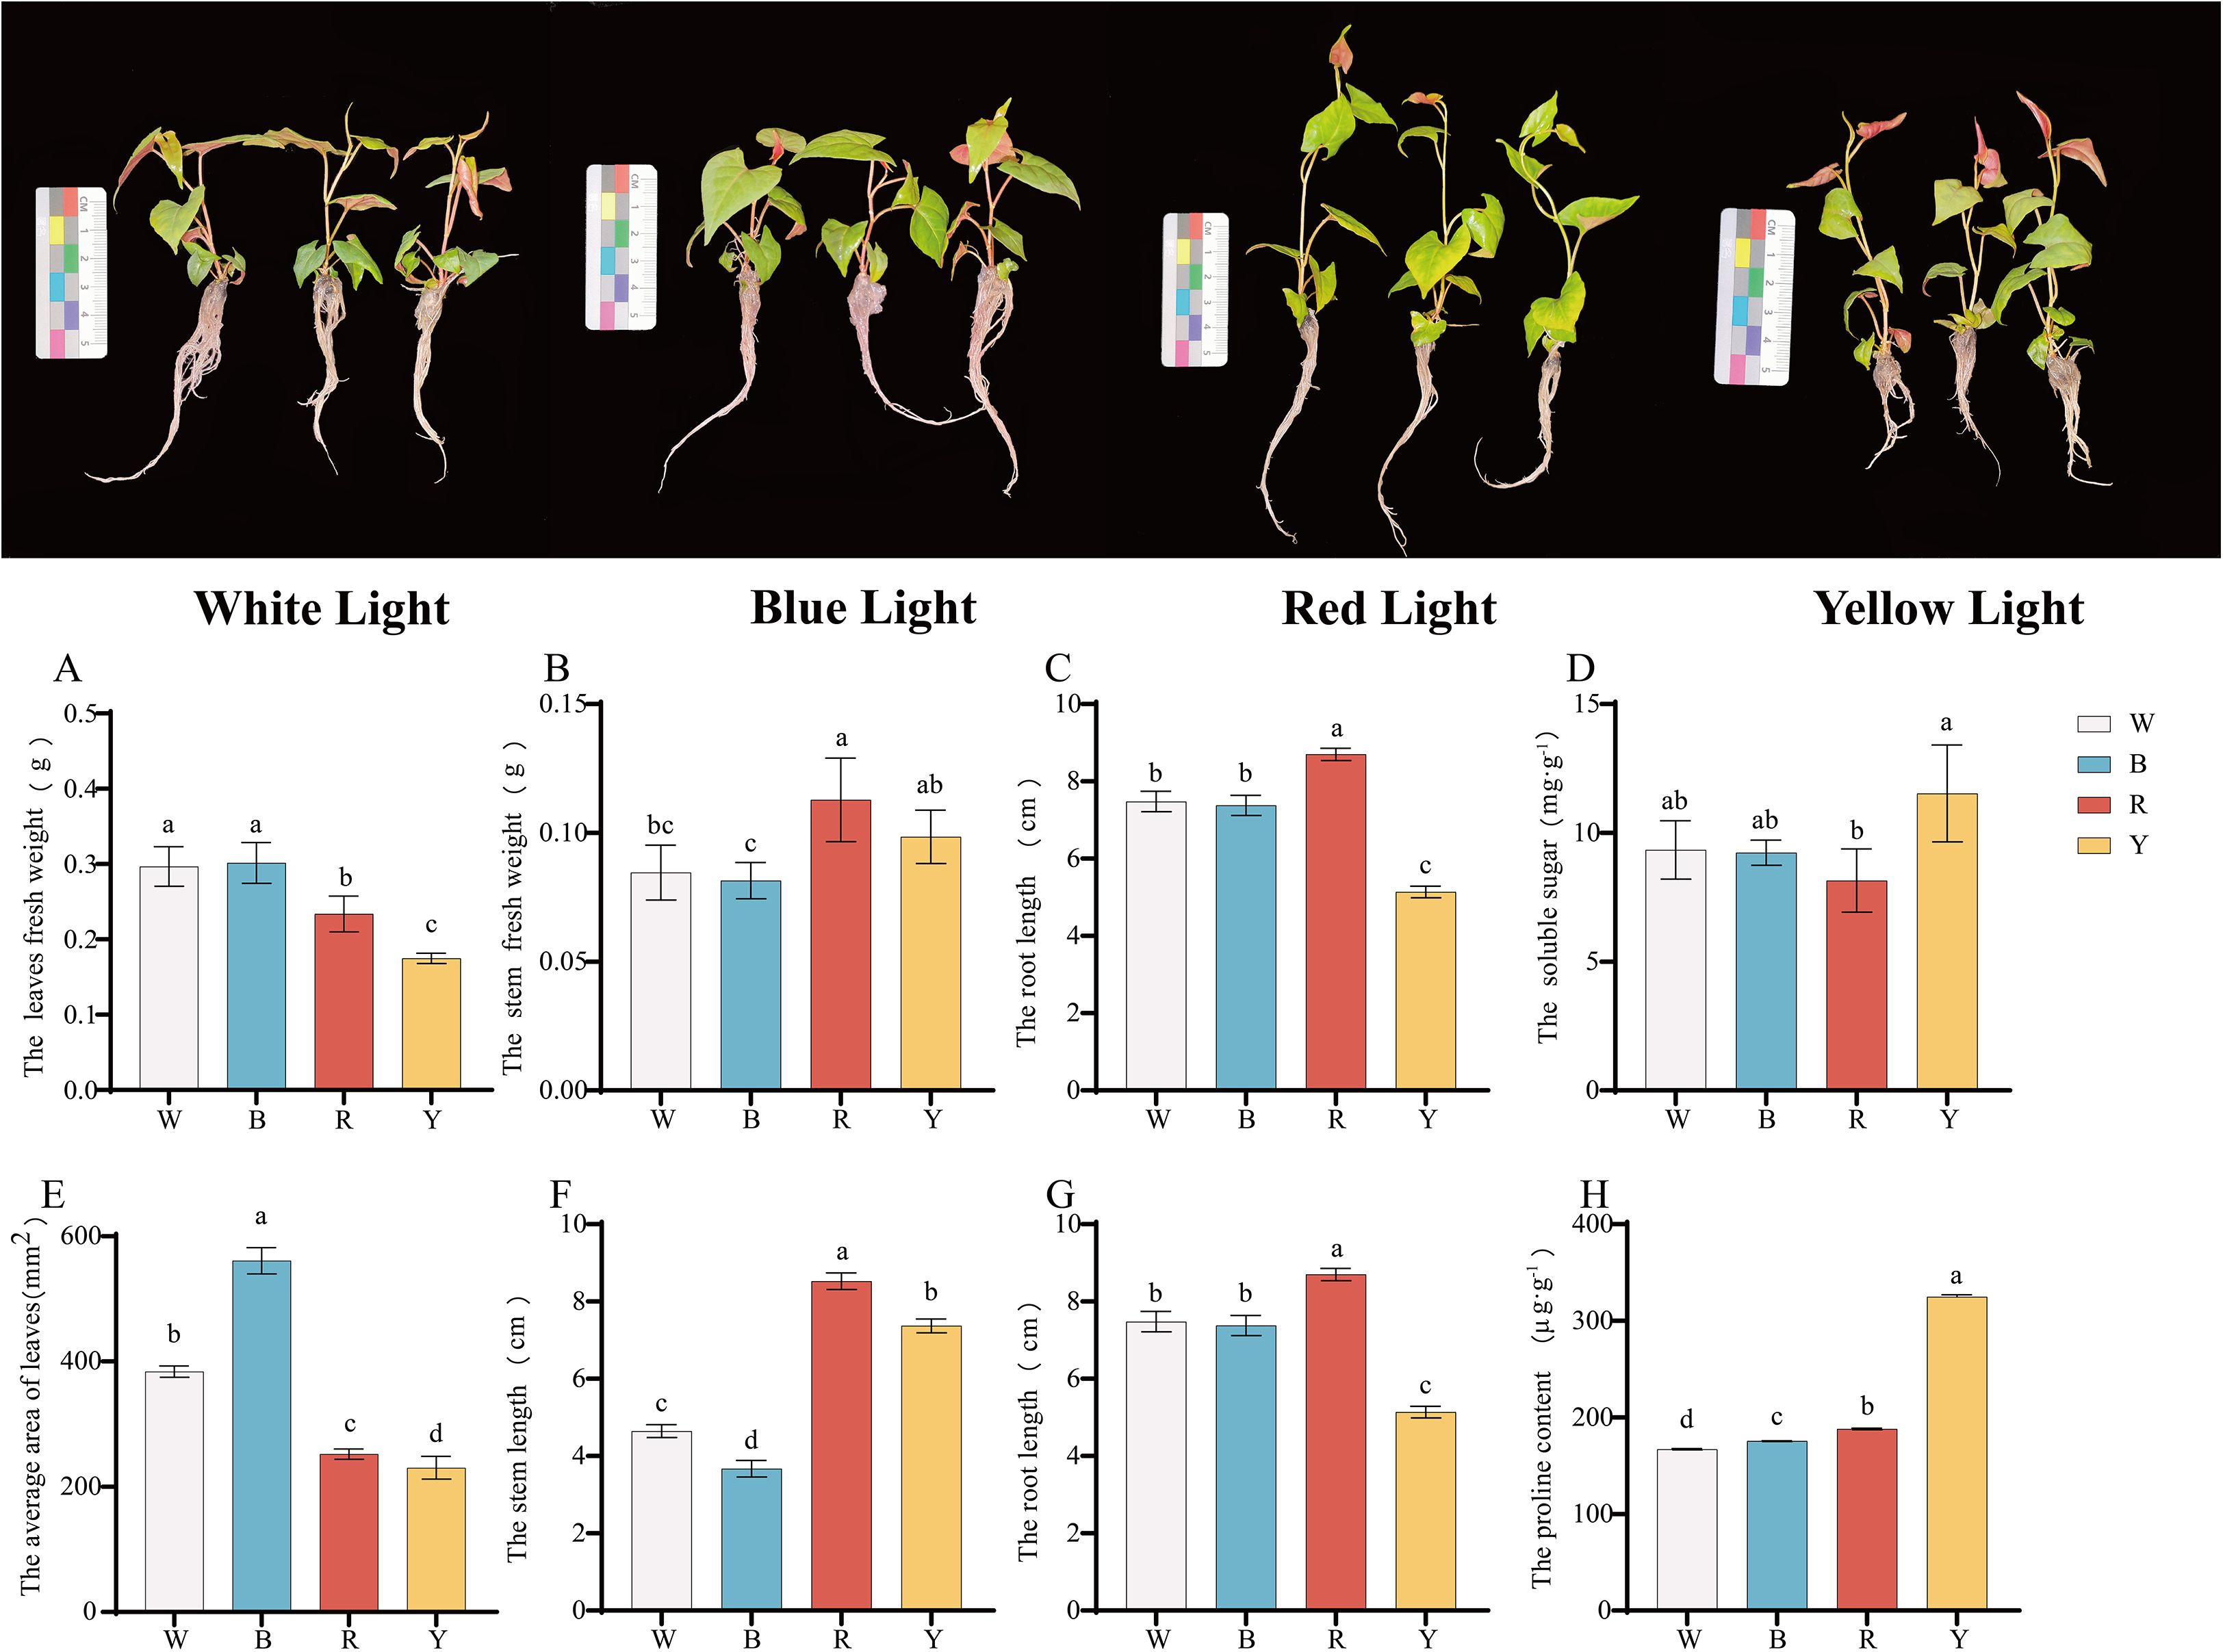
Figure 1. Growth and development changes and osmotic regulator contents in different tissues of F. multiflora under the white light (W), red light (R), yellow light (Y), and blue light (B). (A) Leaf fresh weight (g). (B) Stem fresh weight (g). (C) Root fresh weight (g). (D) Soluble sugar content (mg-g¹). (E) Leaf area (mm²). (F) Stem length (cm). (G) Root length (cm). (H) Proline content (µg-g¹). Values are presented as mean ± standard deviation [SD, n = 5 (A–C, E–G) or n = 3 (D, H)]. ANOVA results are indicated by a, b, c, d to show significant differences between groups (P < 0.05) using Duncan’s single-factor variance analysis.
The results indicated that different light quality treatments had a significant effect on regulating the growth and development of F. multiflora (P< 0.05). Specifically, red light and yellow light treatments significantly reduced the fresh weight of various tissues in F. multiflora (P< 0.05).
3.2 Agronomic trait changes of F. multiflora
The agronomic traits of F. multiflora were determined under different light quality treatments, and significant changes were observed in leaf area and stem length (Figures 1E, F, P< 0.05). Blue light treatment significantly promoted the increase in leaf area (P< 0.05), which was 46.19% higher than that under white light treatment. Both red light and yellow light significantly inhibited the increase in leaf area (P< 0.05). Among them, the leaf area under yellow light showed the greatest reduction compared with that under white light, with a decrease of 39.97%.
For stem length, the study indicated that the blue light treatment group had a significant inhibitory effect on stem length (P< 0.05), which was 20.92% lower than that under white light treatment; both yellow light and red light treatments exerted significant promoting effects on stem length (P< 0.05). Among these, the stem length under red light treatment increased the most, with an increase of 83.56%.
Root length was also studied under different light quality treatments (Figure 1G). The results showed that red light had a significant promoting effect on root length (P< 0.05), increasing by 16.31% compared with white light; yellow light had a significant inhibitory effect on root length (P< 0.05), decreasing by 31.30% compared with white light; there was no significant difference in root length between blue light and white light treatments.
3.3 Chlorophyll and color difference analysis of F. multiflora
The study revealed that light quality had a significant effect on the total chlorophyll content (Figure 2A). The blue light treatment group exhibited the highest chlorophyll content, which was 7.35% higher than that under white light. Chlorophyll content decreased under red light and yellow light treatments, with the yellow light treatment group showing the lowest chlorophyll content-14.62% lower than that under white light. Different light quality treatments mainly exerted a significant effect on chlorophyll a (Chl a) content, while their effects on chlorophyll b (Chl b) and carotenoid (Car) contents were relatively minor. Compared with other light quality treatments, blue light was more conducive to the accumulation of chlorophyll a (Chl a).
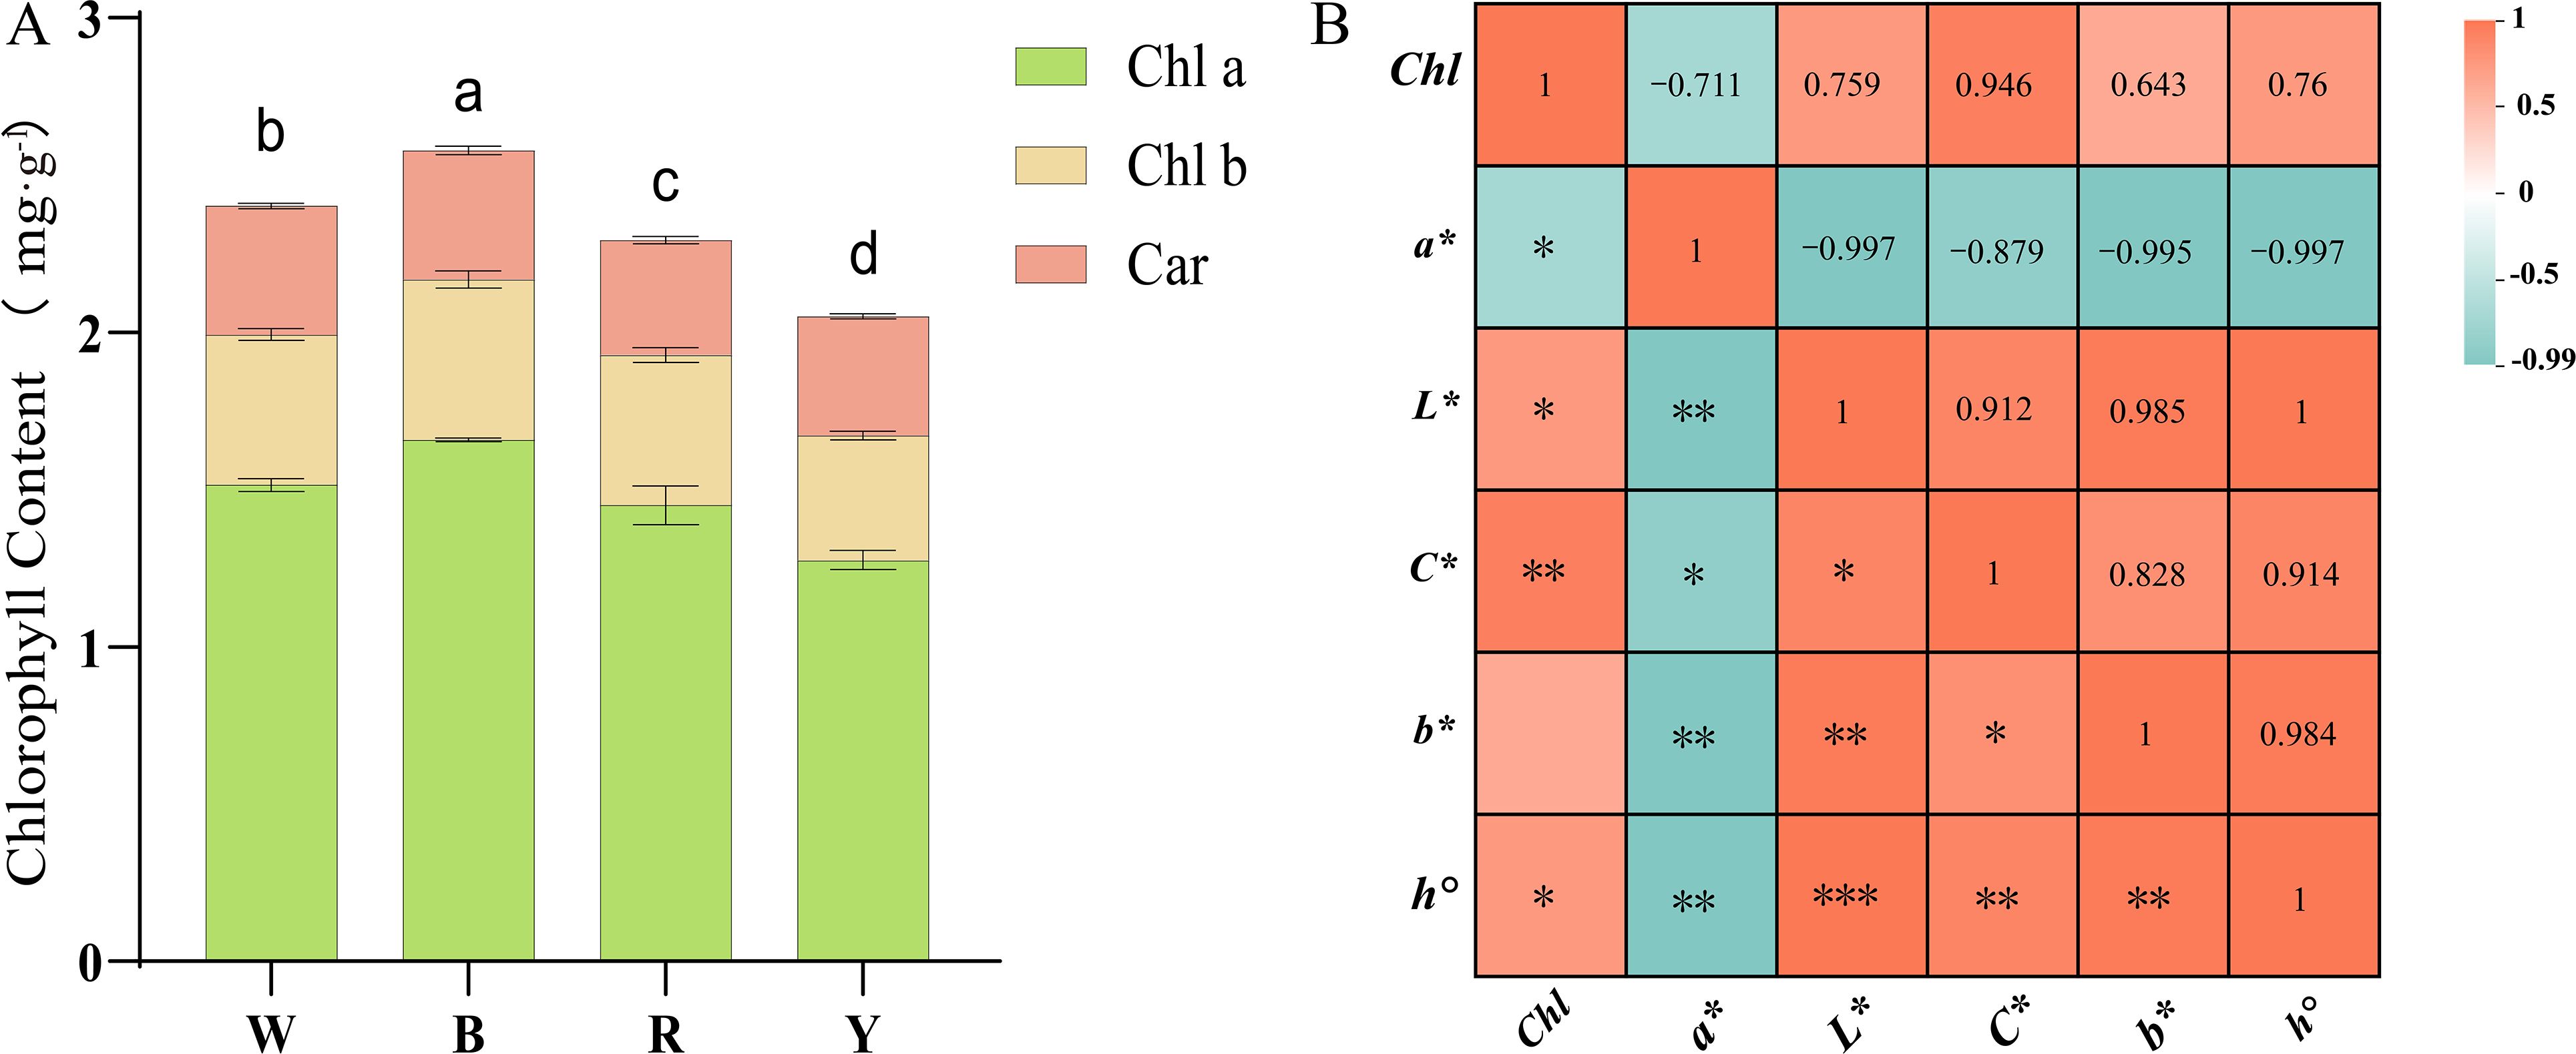
Figure 2. (A) Determination of chlorophyll content in F. multiflora under the white light (W), red light (R), yellow light (Y), and blue light (B); (B) Correlation analysis between chlorophyll content and chromaticity values of the upper surface of F. multiflora (The number represents the Pearson coefficient). Data are presented as mean ± standard deviation (SD, n = 3) ANOVA results are indicated by a, b, c, d and **" to show significant differences between groups. (P < 0.05 ; ***p = 0 **p < 0.01 ; *p < 0.05 ) using Duncan's single-factor variance analysis.
Quantitative analysis of color difference using a colorimeter revealed that the color difference parameter a* represents the red-green axis chromaticity (Table 2). The a* values on the adaxial leaf surface were all negative, with no significant differences among the four treatment groups. However, the blue light treatment group had a higher absolute a* value, indicating a greater tendency toward green. The color difference parameter b* represents the yellow-blue axis chromaticity. Leaf detection showed that b* values were all positive, indicating that leaves tended toward yellow. Significant differences in b* values existed among the four treatment groups. The yellow light treatment group had the largest positive absolute b* value, indicating a stronger tendency toward yellow, while the blue light treatment group had the smallest absolute b* value. The color difference parameter L* represents lightness. The yellow light treatment group had the highest L* value, indicating the highest brightness, whereas the blue light treatment group had the lowest brightness. The color difference parameter C* represents chroma. The yellow light treatment group had the largest C* value, suggesting that leaves became more vivid and saturated after yellow light treatment. The color difference parameter h° represents hue, where values closer to 180° indicate a closer proximity to green. The study found that the h° value of the blue light treatment group was 120.44, closest to 180, indicating greener leaves, while the h° value of the yellow light treatment group was closer to 90°, indicating yellower leaves.
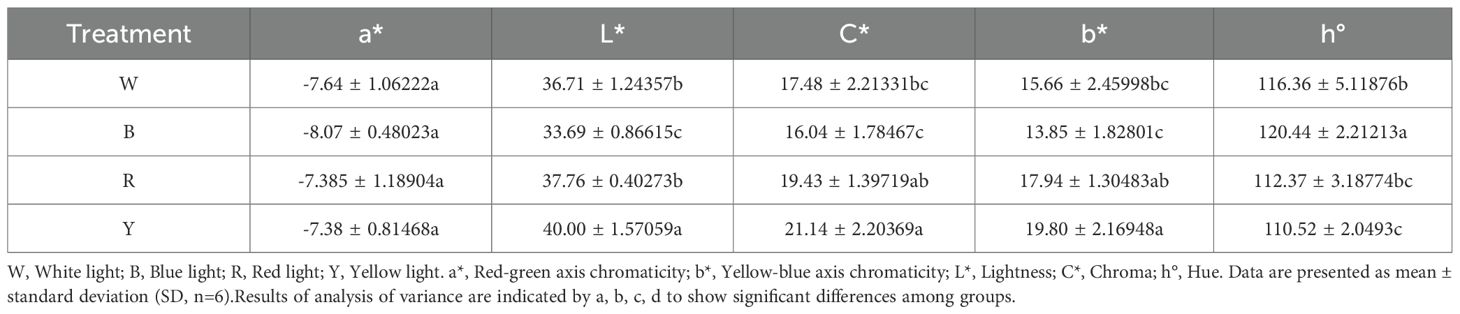
Table 2. Chromaticity values of the upper surface of F. multiflora leaves.
Correlation analysis between chlorophyll and color difference parameters was conducted (Figure 2B). The study revealed that the red-green axis chromaticity a* showed a significant negative correlation with all parameters (r<0, p<0.05). The smaller the a* value, the greener the F. multiflora leaves and the higher the chlorophyll and other index values. Meanwhile, chlorophyll content was correlated with all color difference parameters. Except for the non-significant correlation with the yellow-blue axis chromaticity b* (r=0.984, p>0.05), significant correlations were observed (r>0, p<0.05), indicating that when plant leaves exhibit vivid and bright green colors, chlorophyll content is the highest.
3.4 Analysis of osmotic adjustment substances
After different light quality treatments, the soluble sugar content of the plants changed (Figure 1D). The yellow light treatment group had the highest soluble sugar content (P< 0.05), while the red light treatment group had the lowest (P< 0.05). There was no significant difference in soluble sugar content between the blue light and white light treatment groups.
Regarding proline content (Figure 1H), the yellow light treatment group showed the highest value (324.8118 ± 2.18405 μg·g-1), which was extremely significantly higher than that of other treatment groups (P< 0.01) and 94.47% higher than that under white light. The proline content varied greatly among different treatment groups, indicating that different light quality treatments had a significant effect on the osmotic adjustment substances of F. multiflora.
3.5 Analysis of secondary metabolite contents
Different light quality treatments had significant effects on the formation and accumulation of secondary metabolites in the stems and roots of F. multiflora (Table 3). Analysis results of stems showed that blue light was conducive to the accumulation of THSG, emodin, and physcion contents in stems. Their contents were significantly higher than those in other treatment groups (P< 0.05), which were 27.15%, 13.56% and 4.09% higher than those under white light, respectively. Analysis of roots revealed that blue light promoted the accumulation of THSG content in roots, which was 28.38% higher than that under white light. Red light treatment was beneficial to the accumulation of emodin and physcion contents in roots.
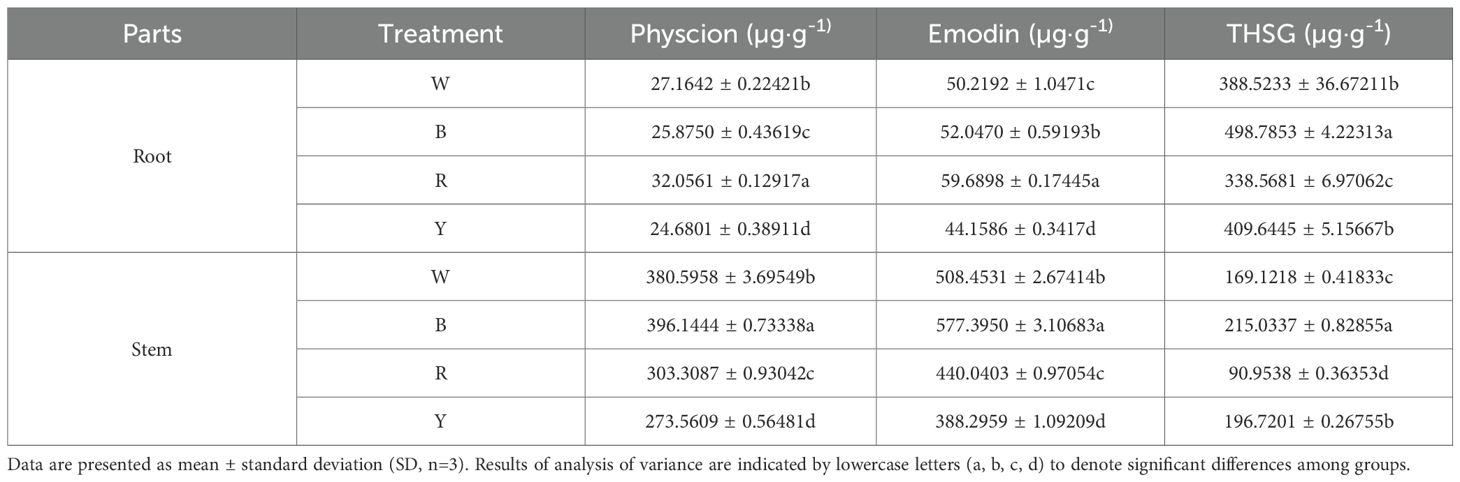
Table 3. Secondary metabolites of F. multiflora.
The results indicated that the contents of emodin and physcion in both stems and roots under yellow light treatment were significantly lower than those in the white light treatment group (P< 0.05). Additionally, the THSG contents in both stems and roots under red light treatment were significantly lower than those in the white light treatment group (P< 0.05).
3.6 Analysis of FmARF gene family members and their physicochemical properties
Through bidirectional BLAST analysis between F. multiflora and Arabidopsis thaliana, a total of 37 FmARF genes were identified in the F. multiflora genome and named FmARF1 to FmARF37. Prediction of their protein physicochemical properties (Table 4) revealed that FmARF14 encoded the shortest polypeptide chain with 358 amino acids, while FmARF14 encoded the longest with 1116 amino acids. The relative molecular masses ranged from 40,087.57 to 124,334.31 Da. Isoelectric point (pI) analysis indicated that 10 genes (FmARF2, 3, 4, 6, 8, 11, 18, 19, 22, 32) had pI values >7, classifying them as basic proteins, while the remaining genes had pI<7 (acidic proteins). Additionally, all family members exhibited negative grand average of hydropathicity (GRAVY) values, indicating hydrophilic properties. The instability index values for all members exceeded 40, classifying them as unstable proteins.
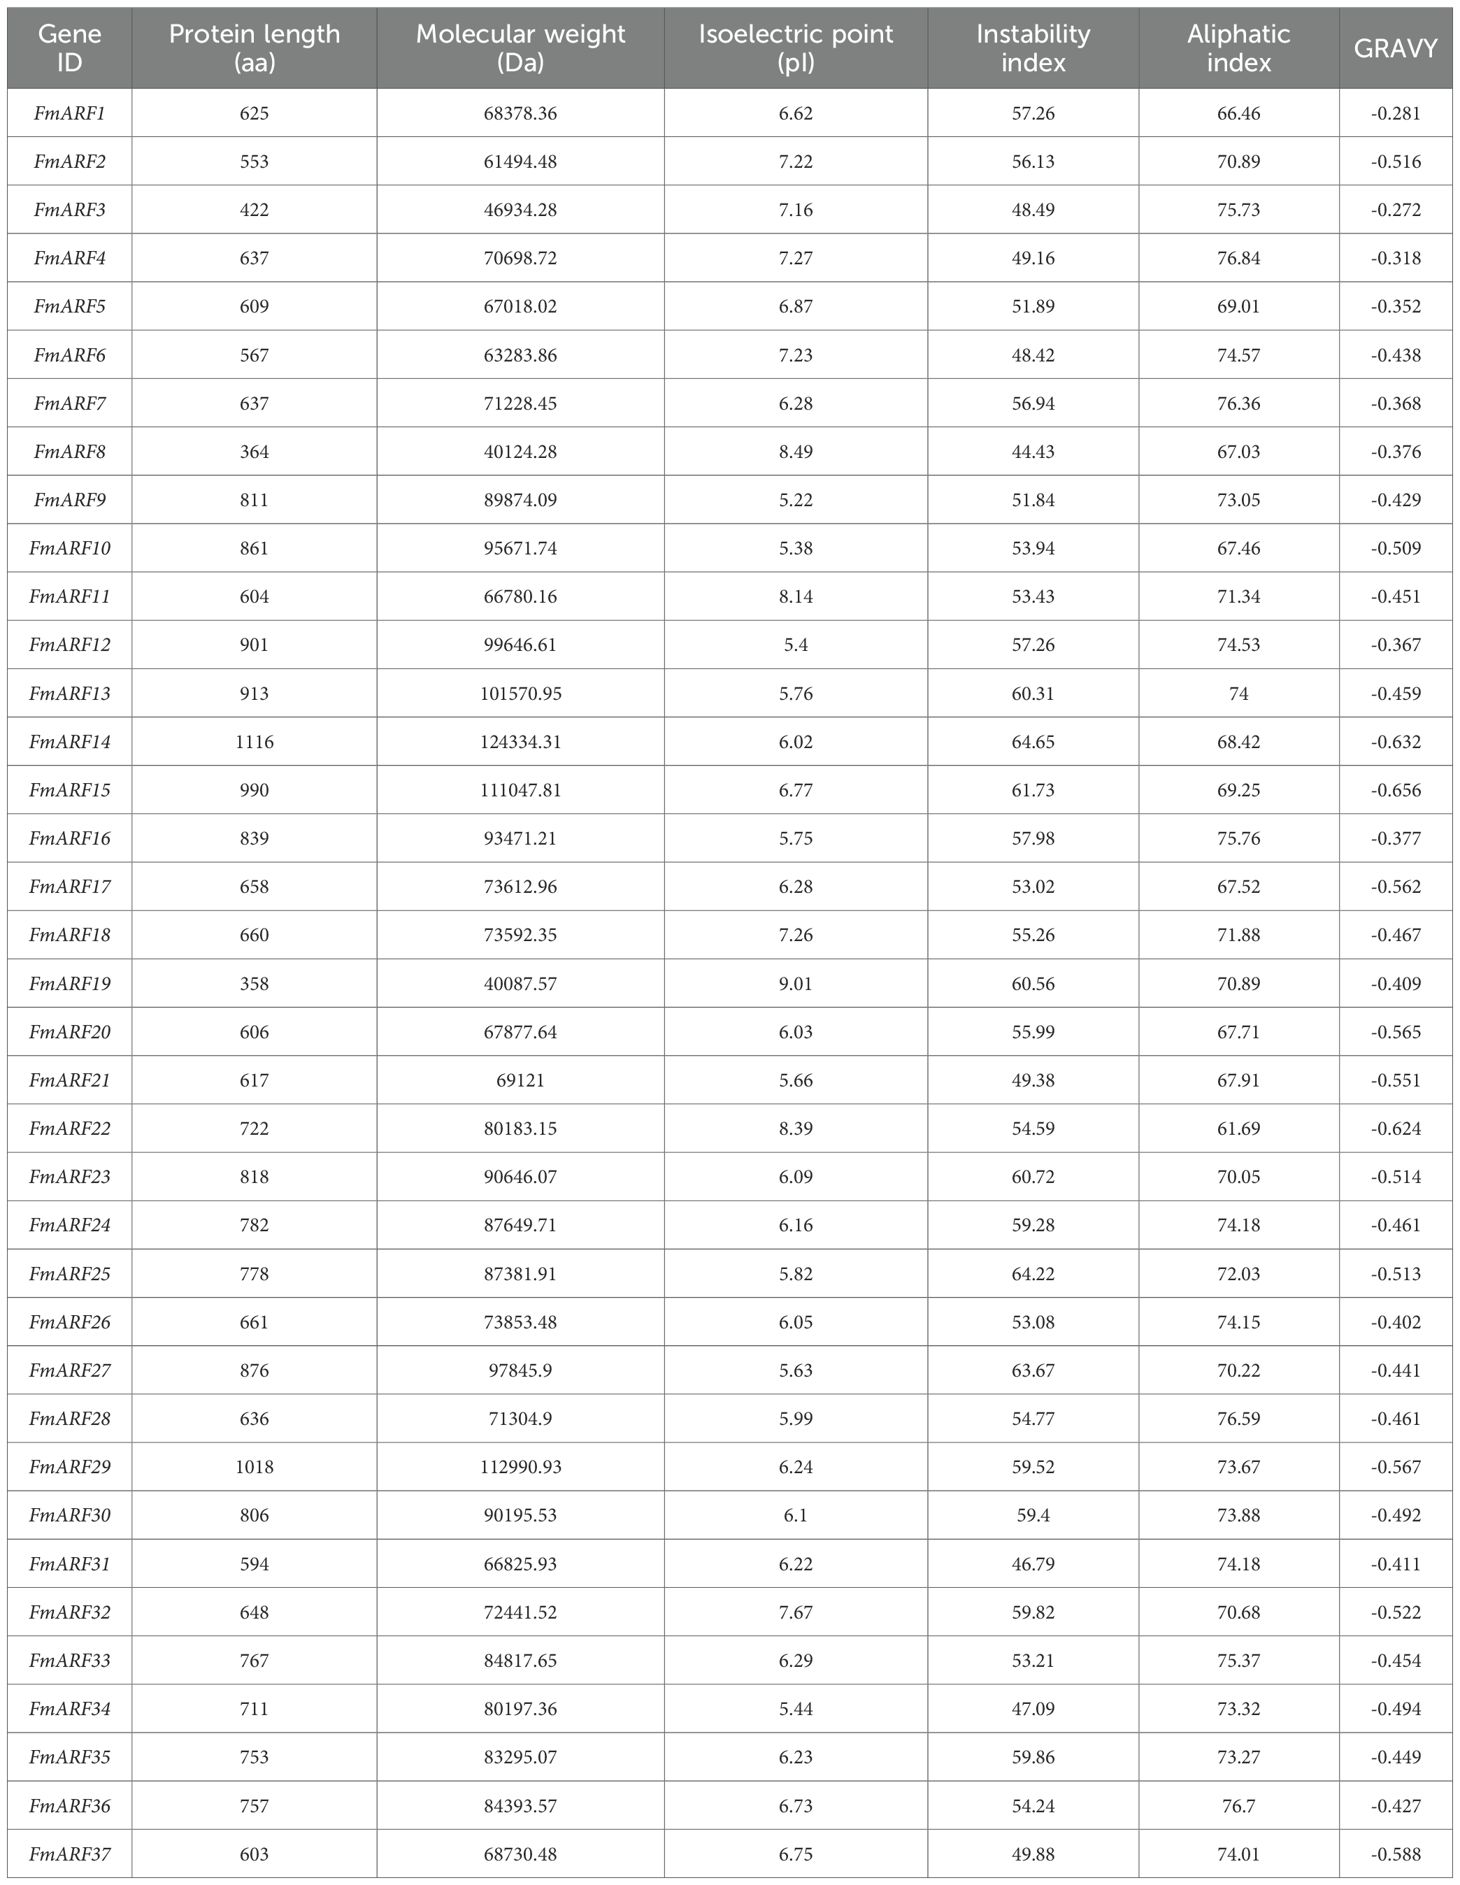
Table 4. Physicochemical properties of F. multiflora ARF protein family.
3.7 Phylogenetic analysis of the FmARF gene family
A maximum likelihood (ML) method was used to construct a phylogenetic tree by analyzing the ARF amino acid sequences of Arabidopsis thaliana and F. multiflora (Figure 3). According to the protein structures, the ARF proteins were divided into four subfamilies. The results showed that FmARF genes of F. multiflora were distributed in all subfamilies, with the largest number of members in Subfamily IV (14 FmARF members), followed by Subfamily III (11 FmARF members). Subfamily II had the fewest members (5 FmARF members), and subfamily I contained 7 FmARF members.
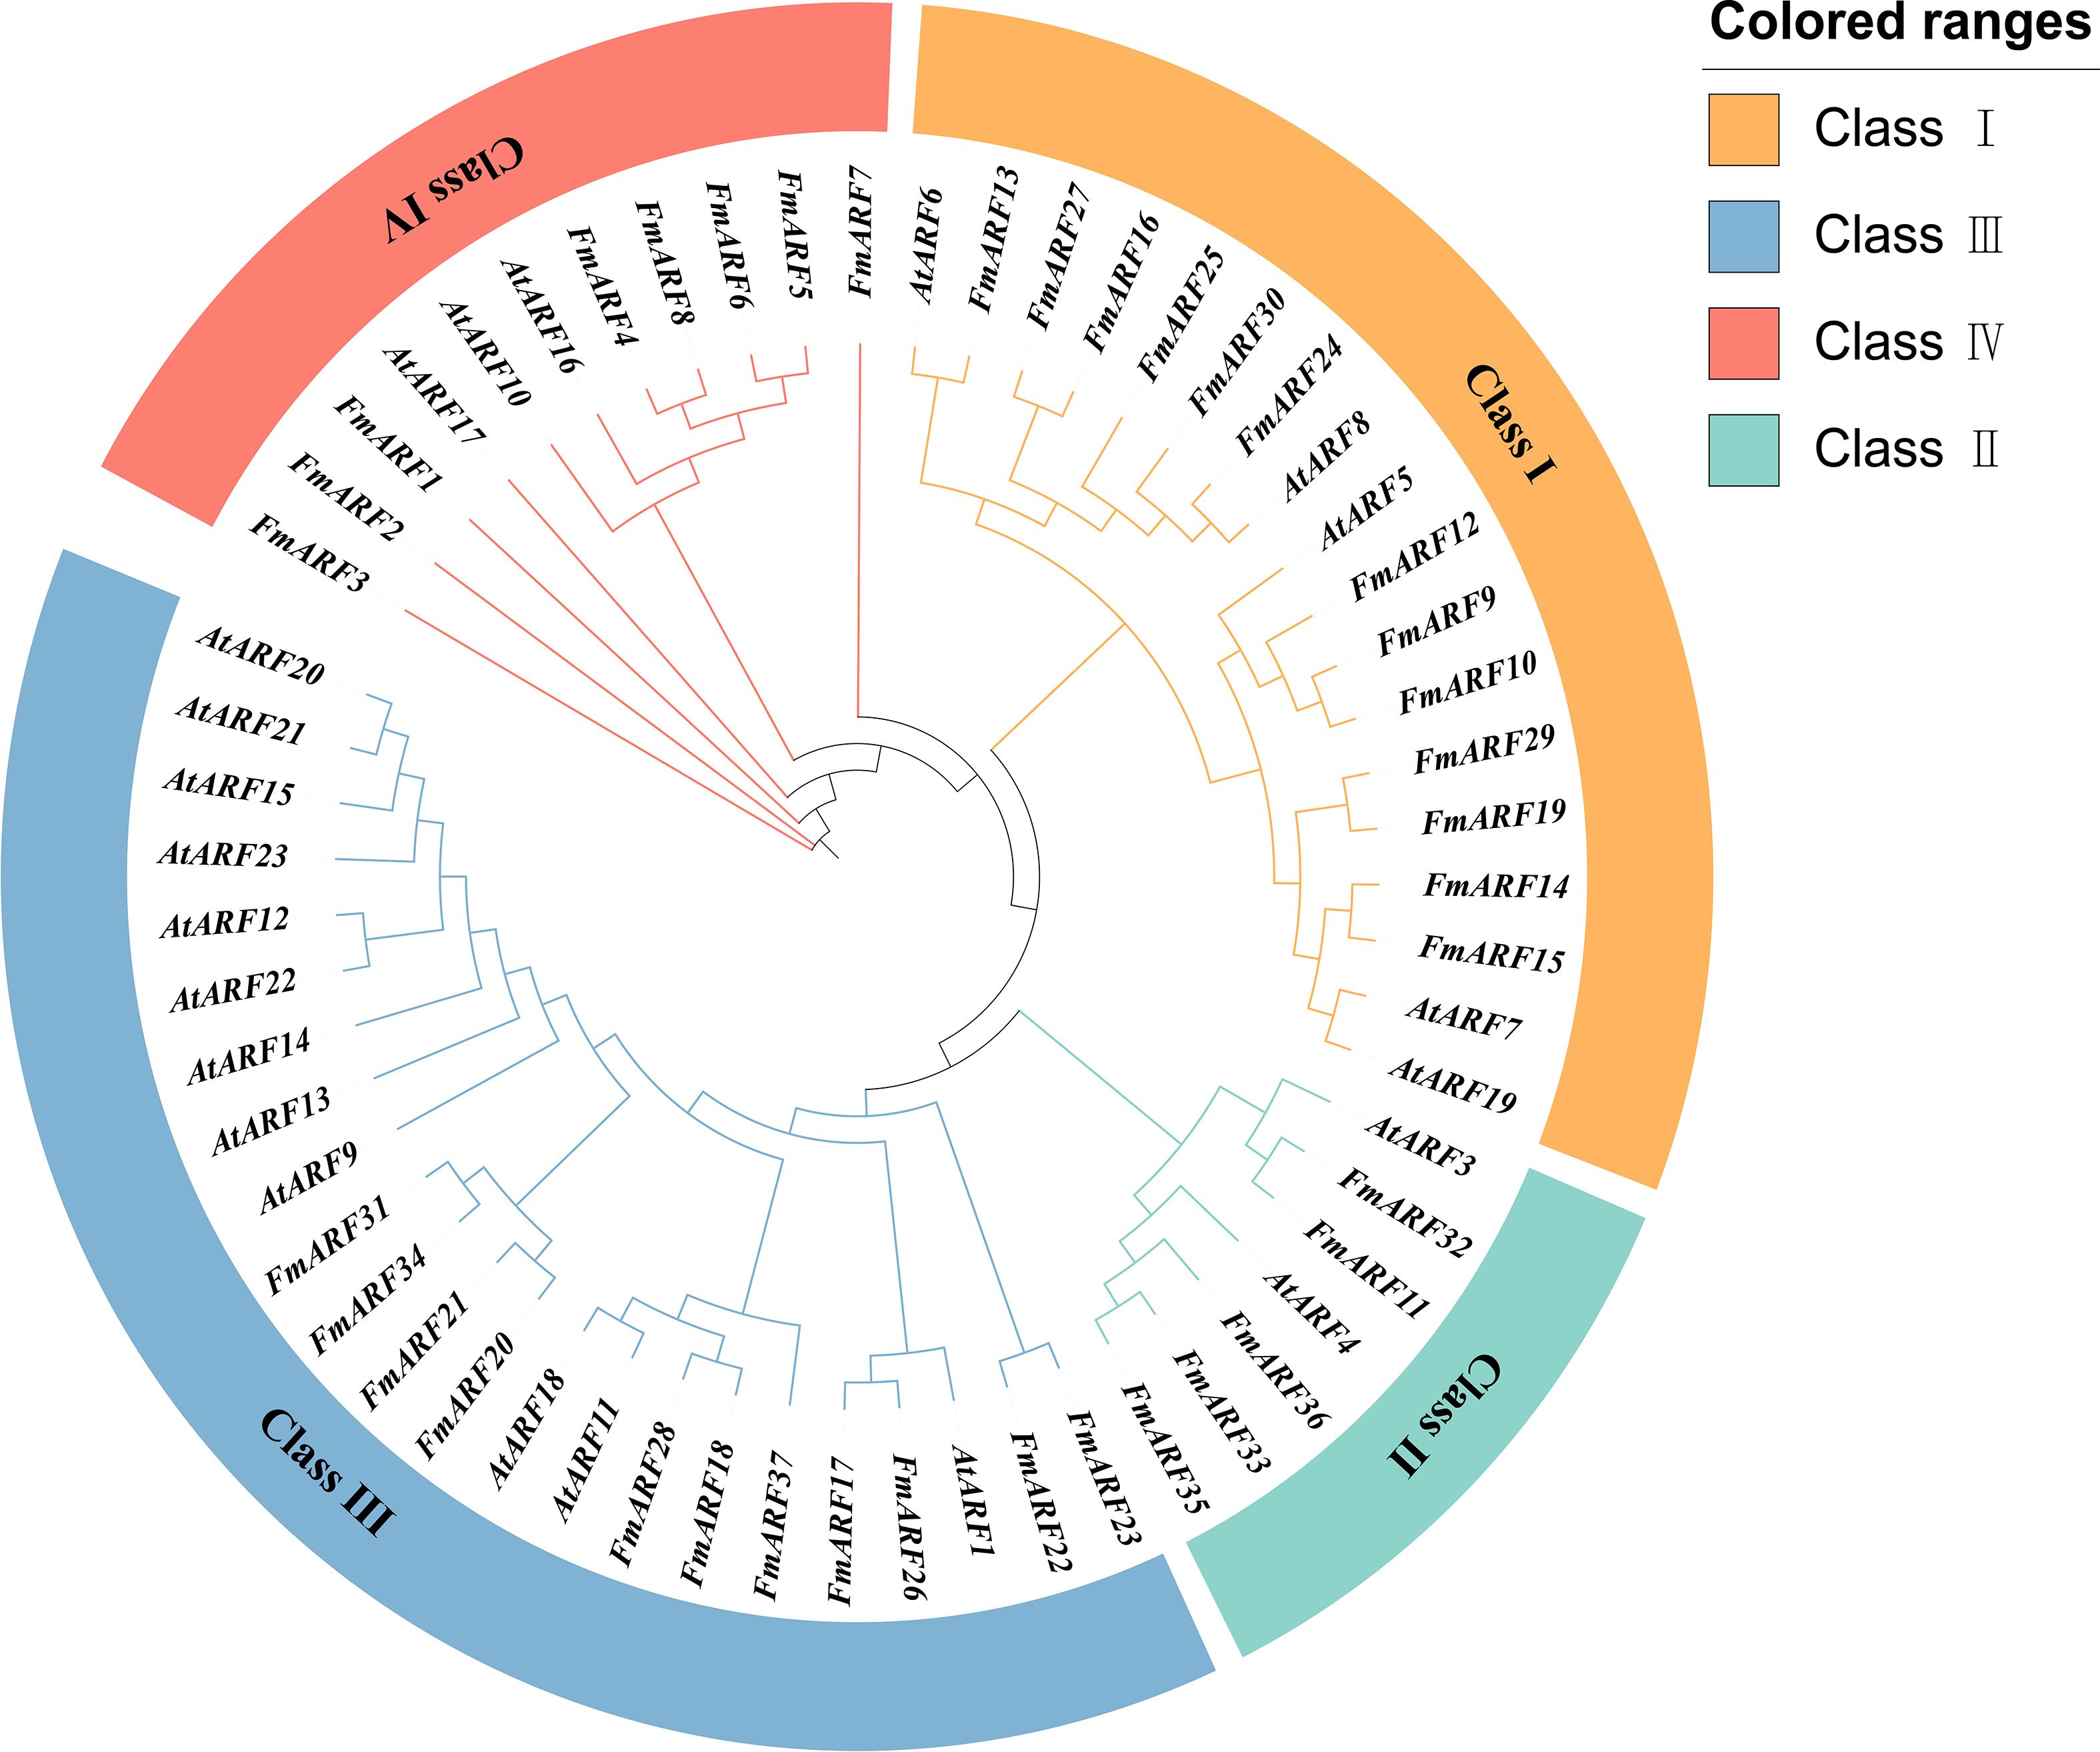
Figure 3. The phylogenetic tree of the ARF (Auxin Response Factor) gene family in F. multiflora. Orange, blue, red and cyan represent Class I, Class II, Class III and Class IV, respectively.
3.8 Analysis of conserved motifs and gene structures of FmARF transcription factors
Conserved domain analysis revealed that all 37 F. multiflora ARF proteins contained both Auxin_resp and B3 domains, indicating these are the most core conserved domains in FmARF proteins (Figure 4B). AUX_IAA, another critical component, was present in most FmARF proteins except for a few members (Figure 4A). Using the MEME suite, 10 conserved motifs (Motif 1–10) were predicted across the 37 FmARF proteins to dissect their structural diversity and evolutionary relationships. Among these motifs, Motif 1 was the longest, while Motif 8 was the shortest (Figure 4C). All FmARF proteins harbored Motif 3, 2, 1, 10, 6, 8, and 7, which collectively formed the most highly conserved regions. Specifically, Motif 2, Motif 1, Motif 10, and Motif 6 correspond to the B3 domain; Motif 8 and Motif 7 belong to the Auxin_resp domain; and Motif 9 and Motif 4 are associated with the AUX_IAA domain. Notably, subfamily IV lacked the AUX_IAA domain in all members except FmARF4, subfamily II lacked it except for FmARF35 and FmARF33, and subfamilies I and III contained it except for FmARF22, FmARF19, FmARF37, and FmARF15. These findings suggest that FmARF genes within the same subfamily exhibit structural conservation, whereas distinct subfamilies display pronounced structural divergence.
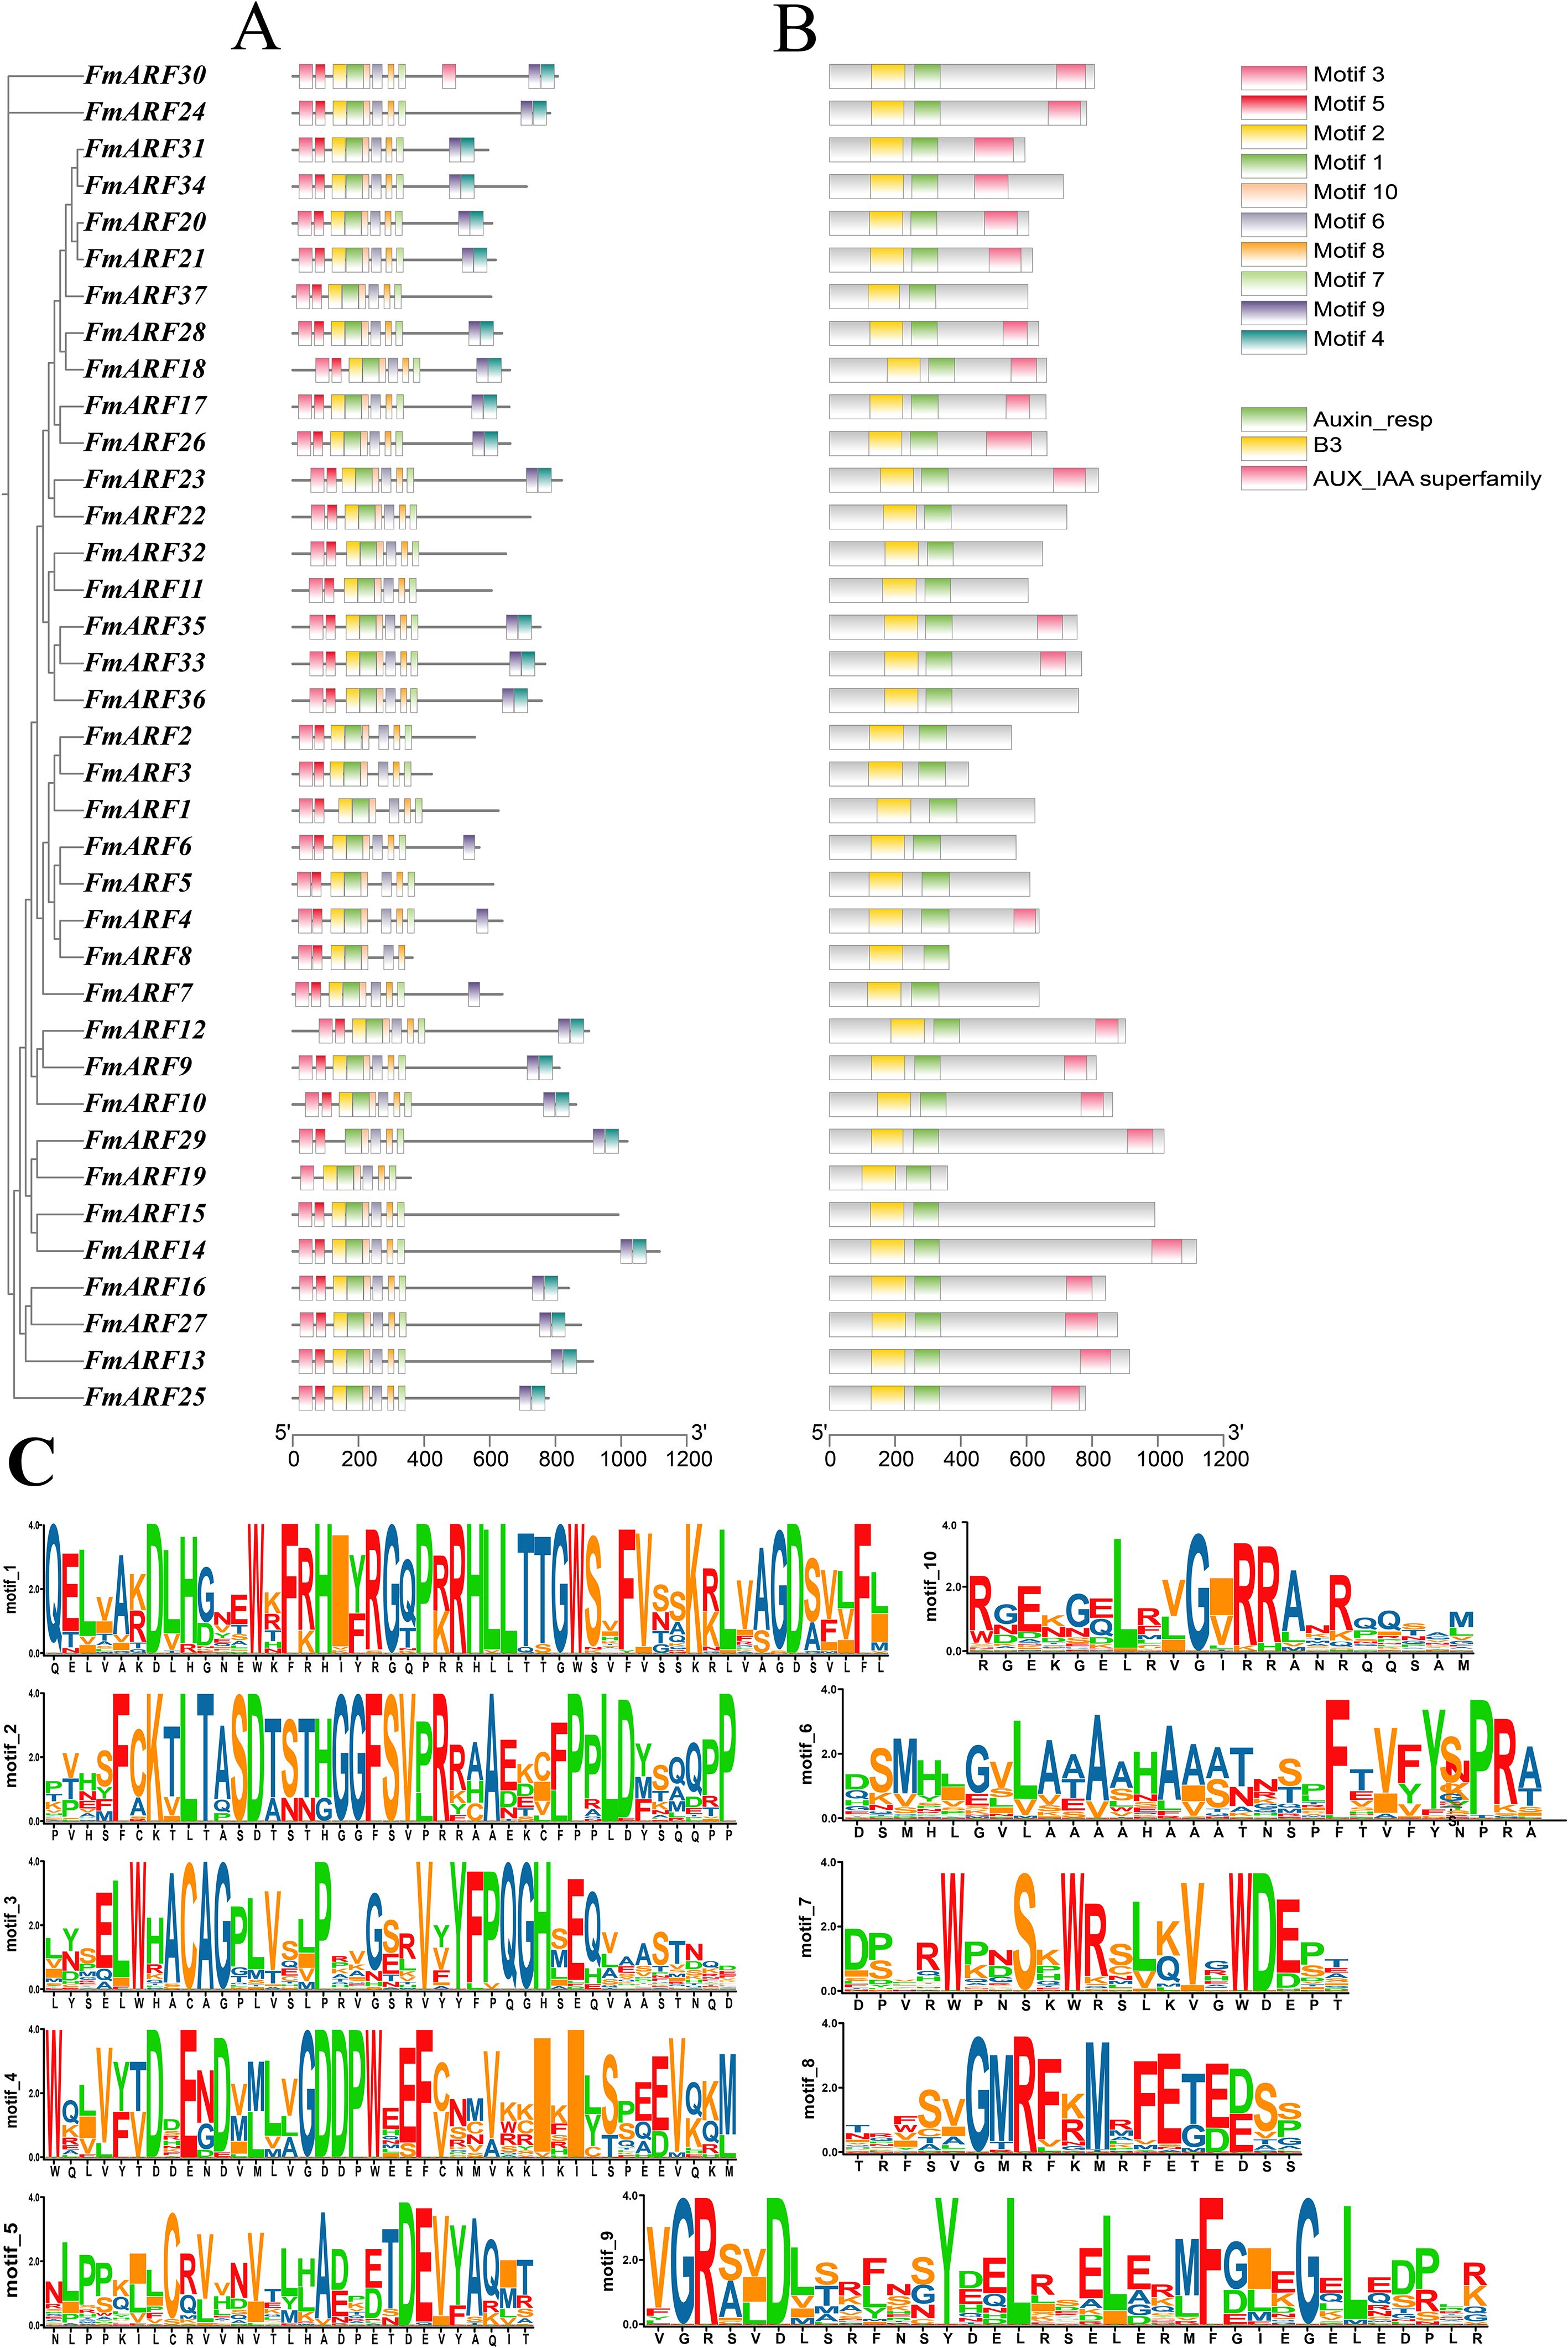
Figure 4. (A) Conserved motifs in FmARF proteins; (B) Exon-intron structure; (C) Amino acid composition of each motif.
3.9 Prediction of cis-acting elements and analysis of gene structures for FmARF transcription factors
The promoter prediction results showed that FmARF transcription factors were mainly involved in abiotic stress, hormone, and light regulation responses (Figure 5A). A total of 581 cis-elements were identified in all FmARF transcription factors, including light-responsive elements, methyl jasmonate-responsive elements, low-temperature responsive elements, etc. Among them, light-responsive elements accounted for the highest proportion at 48.70%, followed by methyl jasmonate-responsive elements at 15.31%. The numbers of the remaining seven types of responsive elements were similar, all accounting for less than 10%. Each gene contained 0 (FmARF18) to 26 (FmARF17) elements, with the number of types ranging from 0 to 7. Except for FmARF18, all FmARF transcription factor promoters contained light-responsive elements, among which FmARF29 and FmARF28 had a relatively large number of light-responsive elements. The fact that different FmARF transcription factors contain different types, numbers, and positions of promoter elements indicates that FmARF genes have different functions in plants to complete the process of plant growth and development.
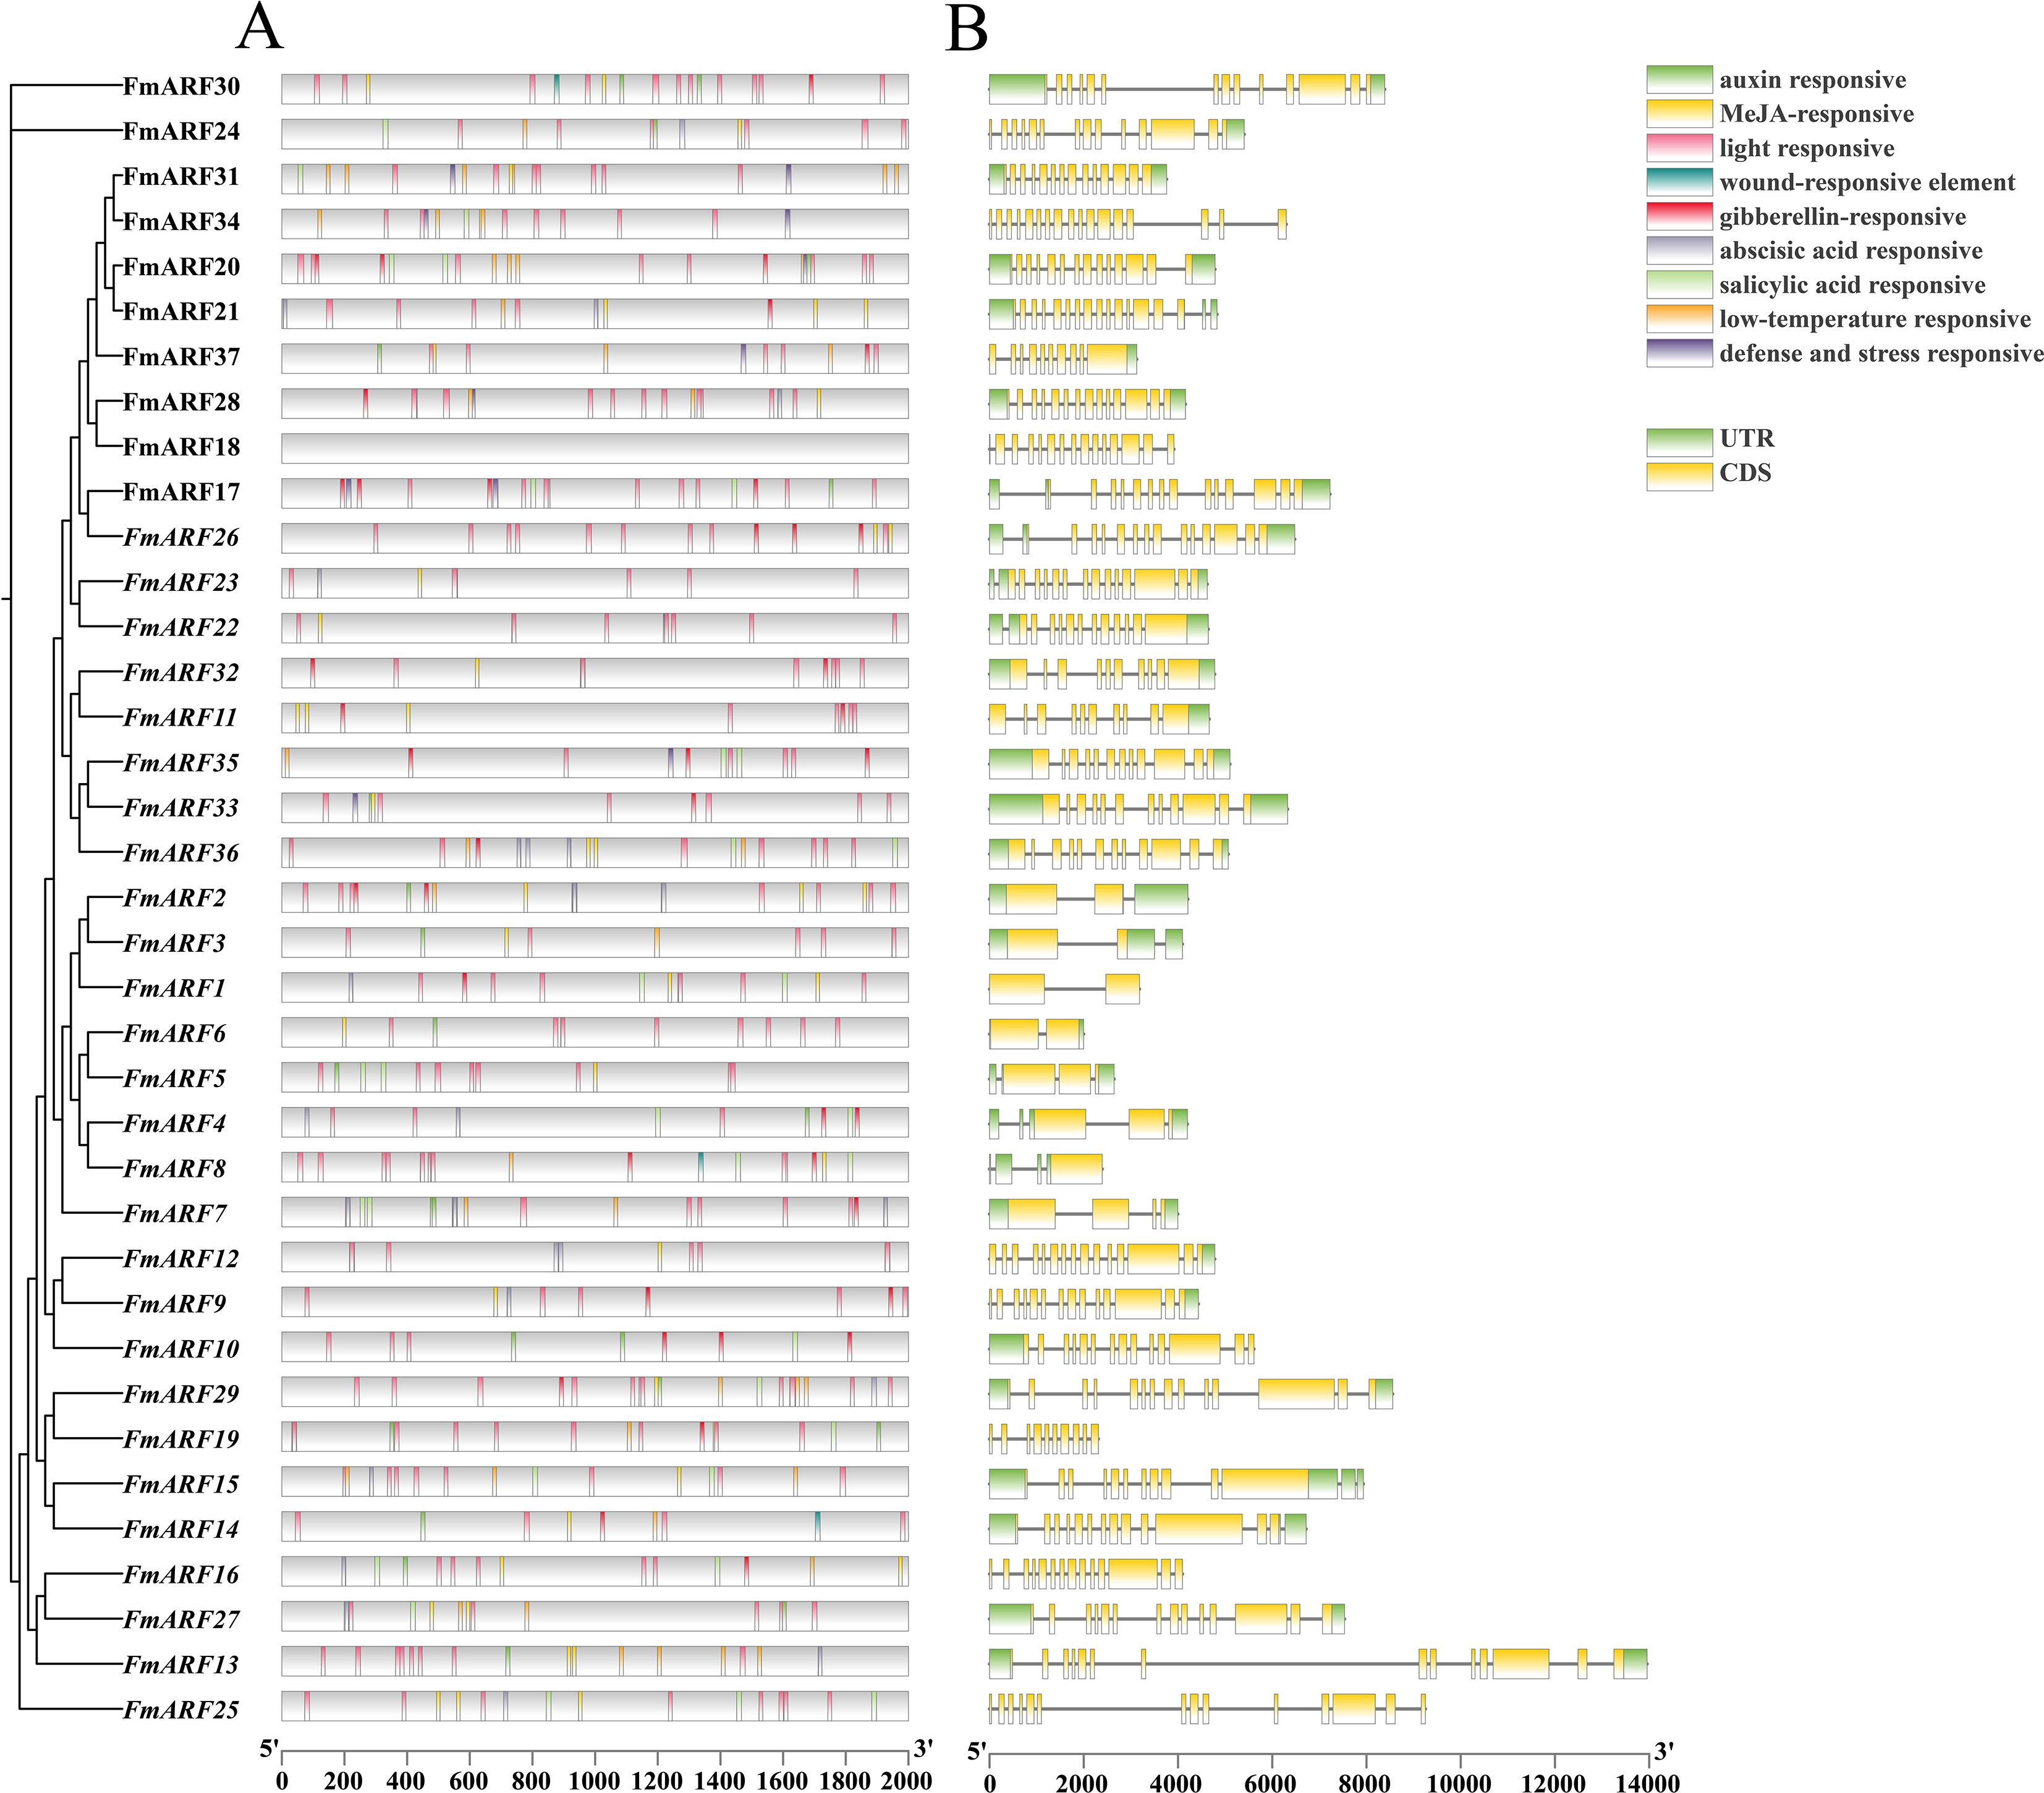
Figure 5. Analysis of cis-acting element of promoter (A) and gene structure (B) of F. muliflora ARF. The different types of cis-acting elements in the promoter region of the FmARFare represented by different colors.UTR and CDS represent untranslated regions and coding sequences, respectively.
Analysis of the FmARF gene structure revealed that the UTR distribution of the FmARF gene family was uneven (Figure 5B), with the number ranging from 0 (FmARF18, FmARF19, FmARF25, and FmARF34) to 4 (FmARF4, FmARF8, and FmARF15). Among them, the number of exons, introns, and CDS of subfamily IV (FmARF1-FmARF7) was 1-4, which was smaller and more different compared with other subfamilies. This reflects the diversification of genes, indicating that the genes of Subfamily IV are the most primitive ARF genes of F. multiflora. With the systematic evolution of F. multiflora, the genes have diversified and exercised new protein functions to adapt to new environmental changes.
3.10 Chromosomal localization and intra/inter-specific collinearity analysis of FmARF genes
According to the annotation file of F. multiflora, the genome assembly of F. multiflora consists of 11 chromosomes (Figure 6).Thirty-seven FmARF genes are unevenly distributed on 10 chromosomes, with the highest number (6 genes) located on Chr5. These results indicate that ARF genes in F. multiflora exhibit a dispersed distribution in the chromosome set.
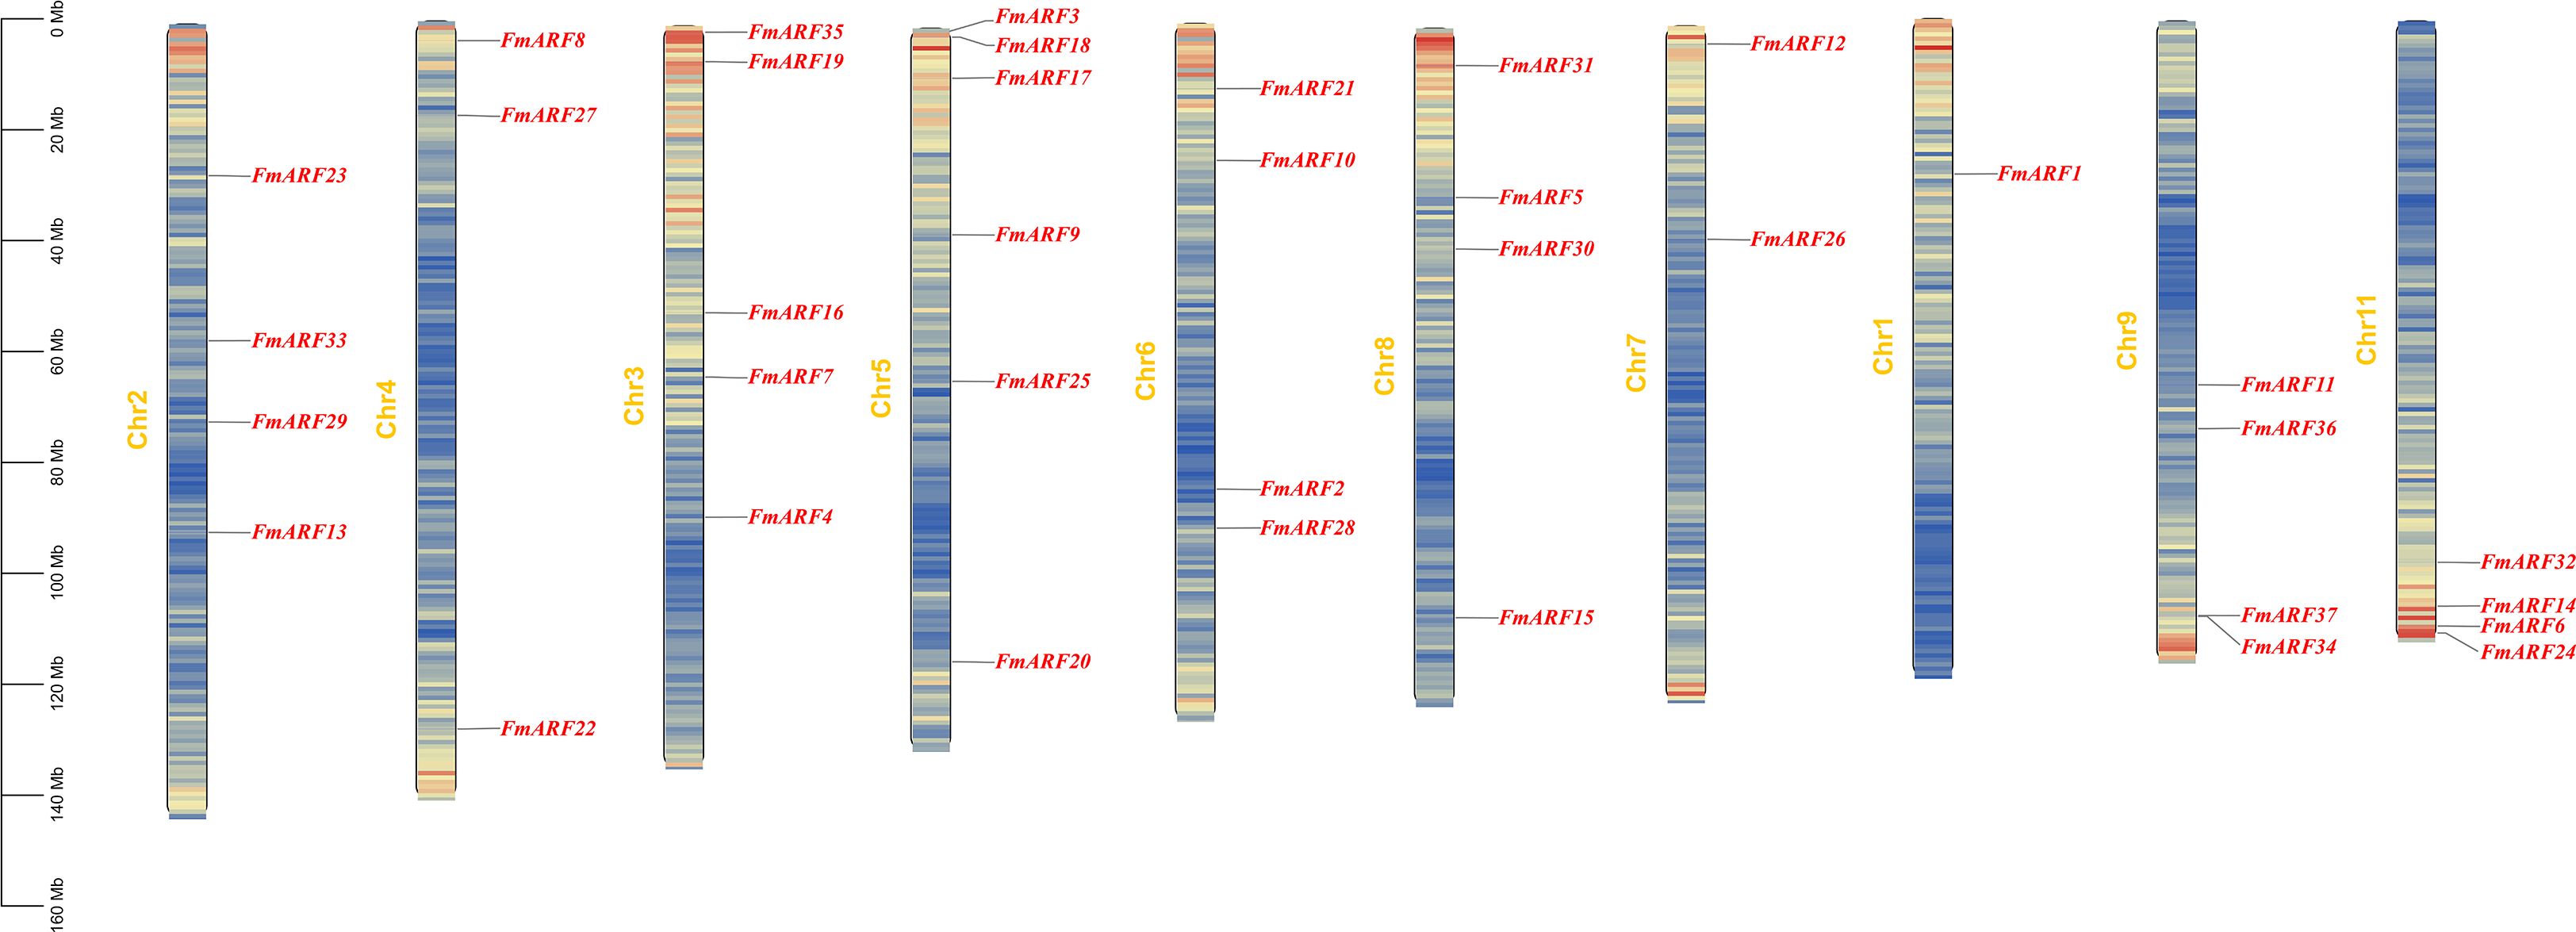
Figure 6. Distribution of F. multiflora ARF gene family on chromosomes.
Collinearity analysis of FmARF genes identified 22 pairs of collinear gene relationships (Table 5, Figure 7A), all resulting from whole-genome duplication and segmental duplication events, with no tandem duplication events detected. Analysis of these 22 FmARF gene pairs showed that the Ka/Ks ratios of all collinear gene pairs were less than 1. This suggests that they have undergone strong purifying selection pressure during evolution, leaning toward purifying selection.
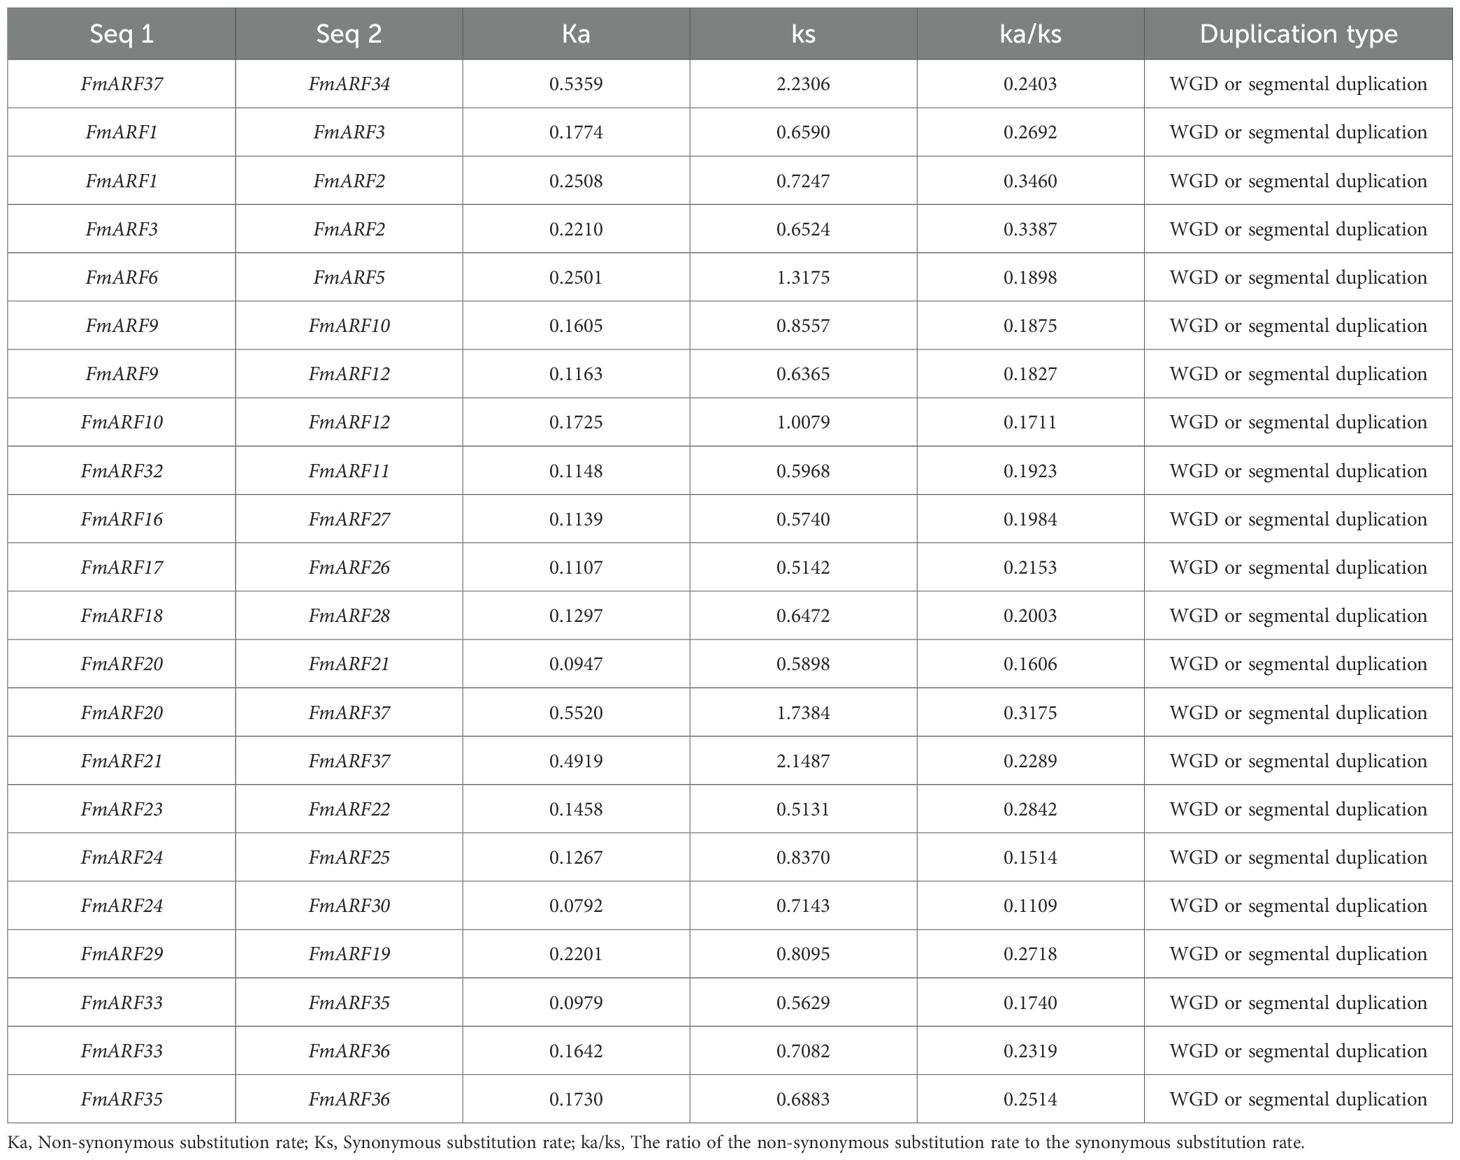
Table 5. Collinear relationship among Fm ARF genes within species.

Figure 7. Collinearity analysis. (A) Collinearity of the F. multiflora ARF gene family in chromosomes, The red line indicates collinearity of FmARF; brown and purple represent GC content offsets, with purple for G > C and brown for G < C; the heatmap shows gene density; cyan denotes GC content proportion; and Chr1-11 are chromosome names; (B) Correlation analysis of ARF genes between Arabidopsis thaliana and F. multiflora. Gray lines indicate collinearity between the genomes of Arabidopsis and F. multiflora, while red lines denote collinearity of ARF genes between the two species.
Through collinearity analysis between F. multiflora and Arabidopsis thaliana, the evolutionary relationships of ARF genes between the two species were explored (Figure 7B). As shown in the figure, a total of 19 homologous gene pairs were identified. Notably, FmARF3-6, 8, 9, 11, 13-15, 17, 19, 22-26, 29–34 had no homologous counterparts in A. thaliana, indicating that during the evolutionary process, F. multiflora has undergone stepwise changes in its ARF gene family to adapt to environmental factors, enabling new protein functions for environmental adaptation.
3.11 Expression pattern analysis of light-regulated FmARF genes
Quantitative real-time PCR (qRT-PCR) was employed to determine the expression patterns of 15 genes with abundant light-responsive-responsive cis-acting elements in roots, stems, and leaves of F. multiflora under different light quality treatments, using the corresponding tissues from the white light treatment group as controls. Results revealed significant variations in gene expression levels across treatments (Figure 8).
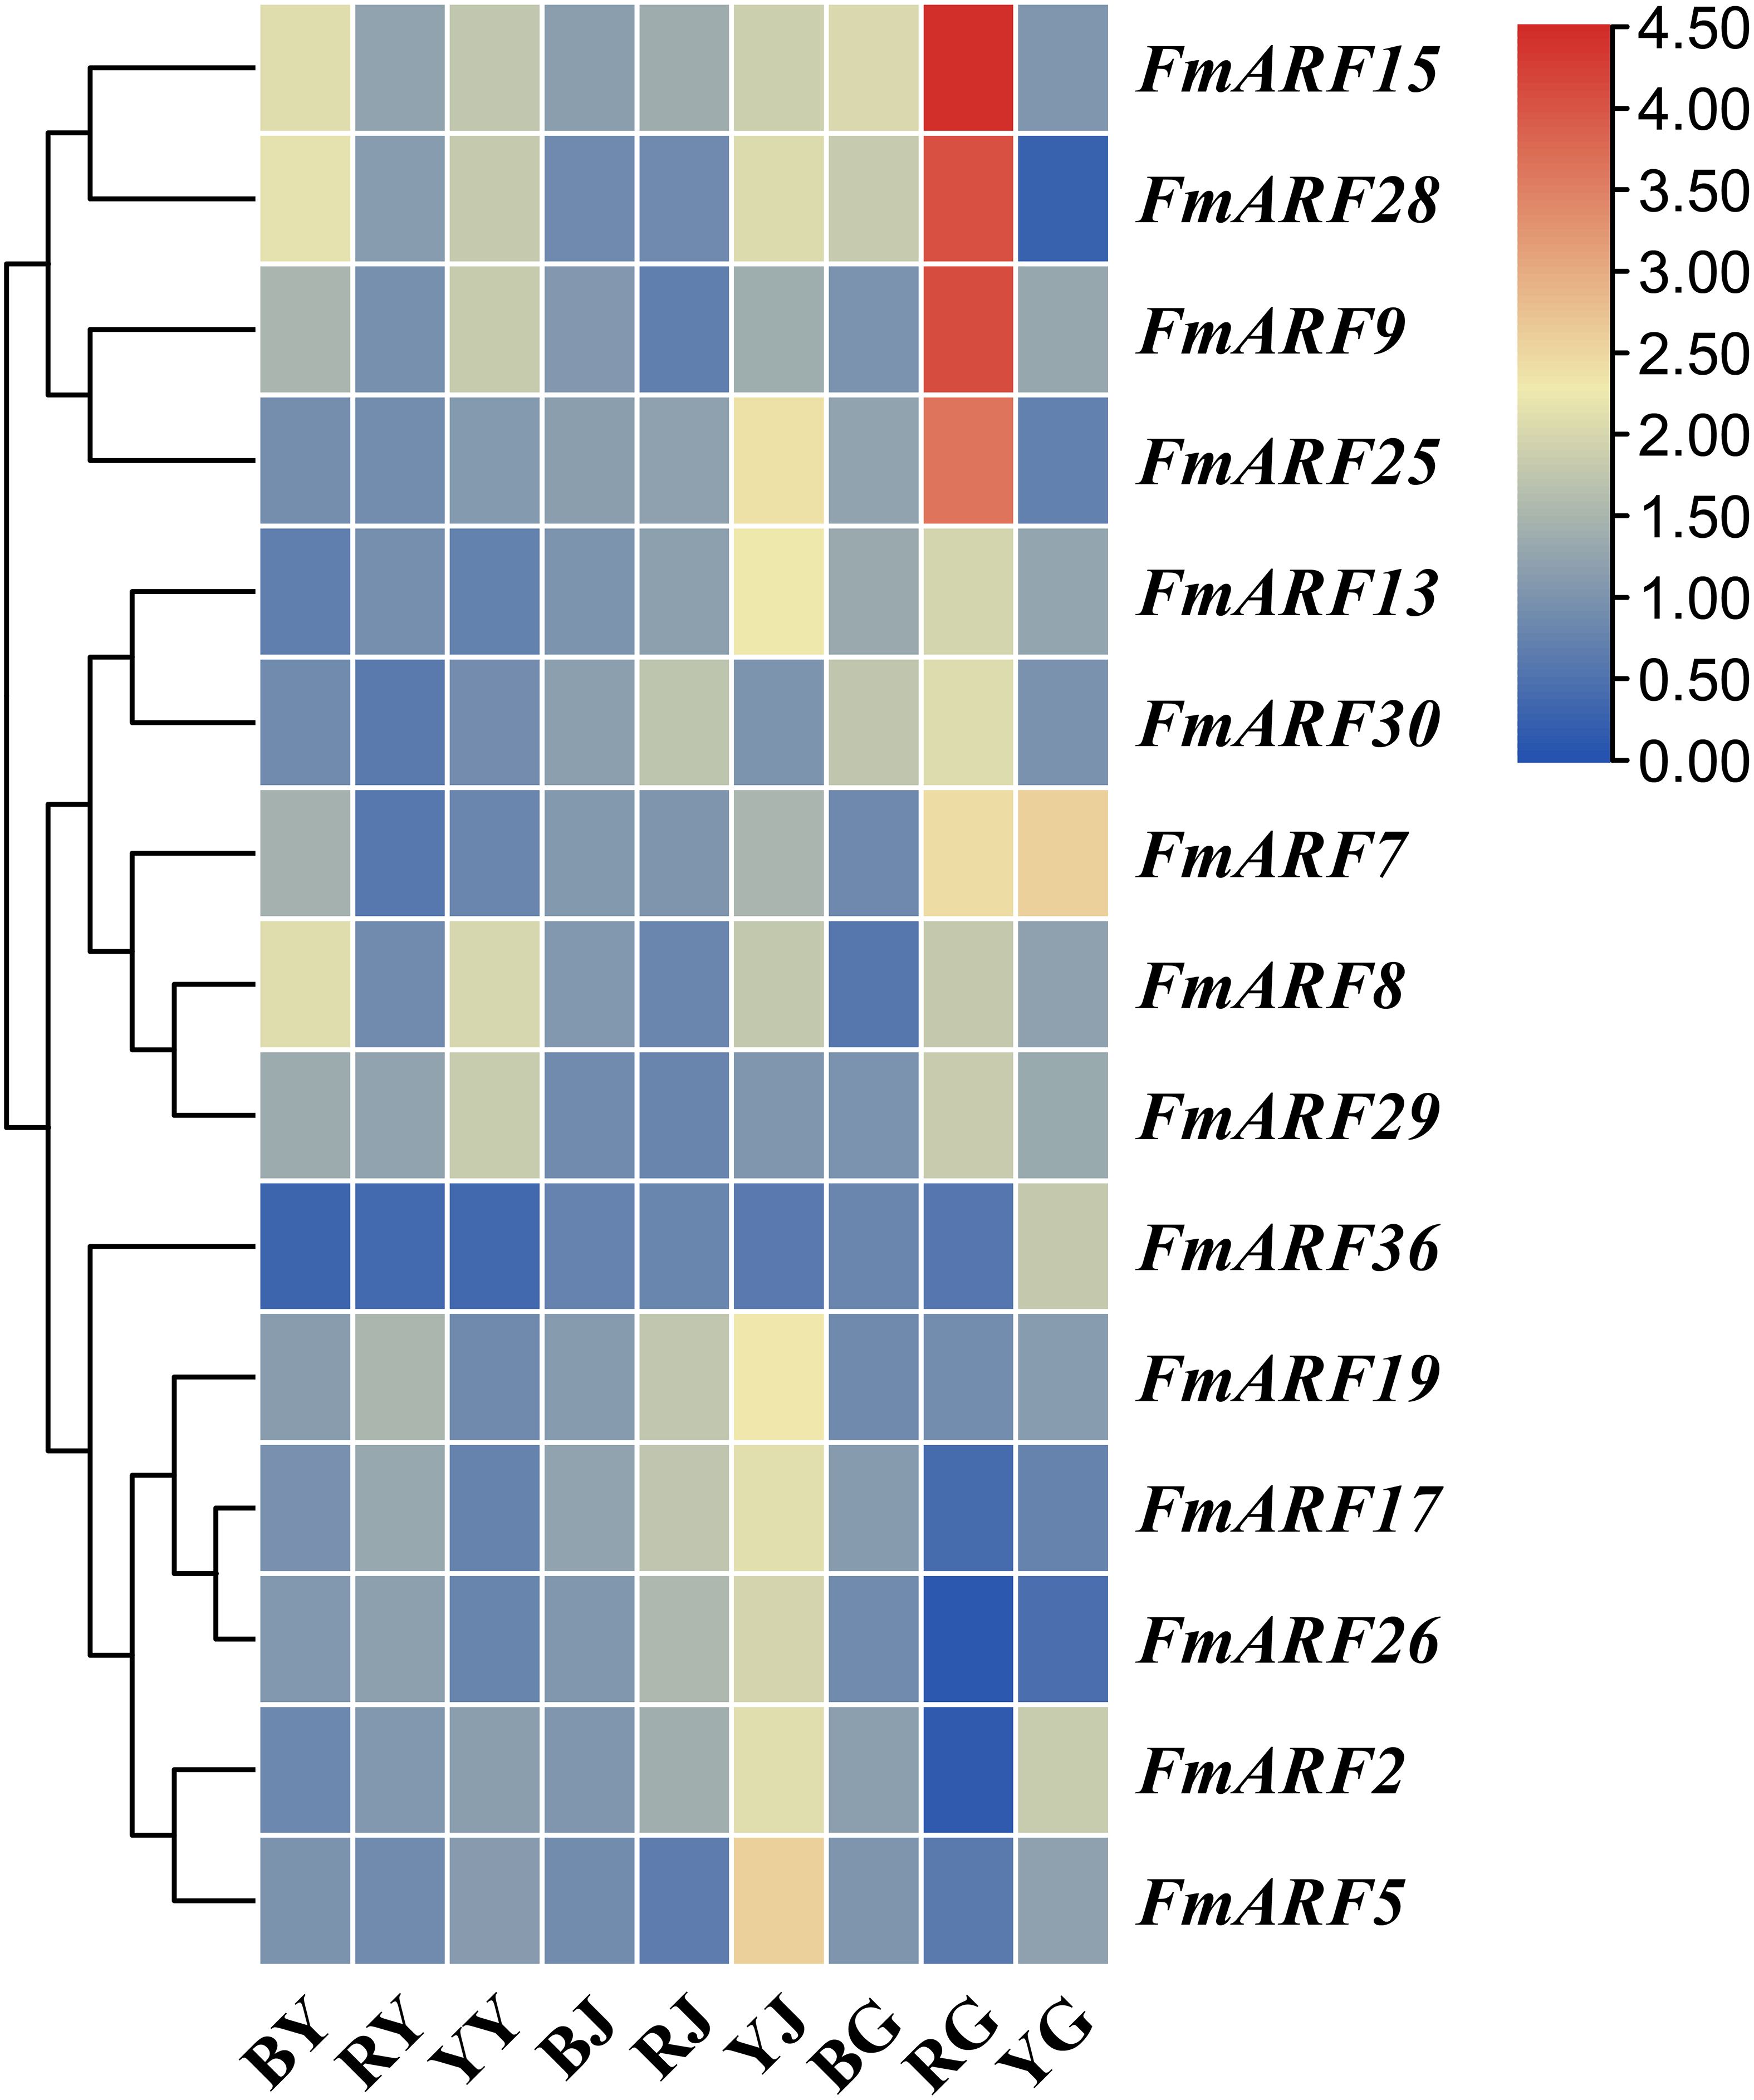
Figure 8. Heatmap of ARF gene family expression levels in F. multiflora under different light qualities. (BY: Leaf tissue treated with blue light; RY: Leaf tissue treated with red light; YY: Leaf tissue treated with yellow light; BJ: Stem tissue treated with blue light; RJ: Stem tissue treated with red light; YJ: Stem tissue treated with yellow light; BG: Root tissue treated with blue light; RG: Root tissue treated with red light; YG: Root tissue treated with yellow light.).
Notably, under diverse light qualities: FmARF36 expression in leaves and stems was significantly reduced compared to white light (P< 0.05); FmARF13 expression was elevated in roots and stems but decreased in leaves; FmARF15 expression was universally increased in all three tissues. Additionally, FmARF28, FmARF29, and other genes were upregulated in leaves; FmARF2, FmARF30, and others were upregulated in stems; FmARF9 and other genes were upregulated in roots, while FmARF26 and others were significantly downregulated in roots (P< 0.05). These findings suggest their potential key roles in mediating light quality regulation in distinct tissues.
Further analysis of the same tissue under varying light qualities demonstrated marked expression differences. For instance: blue light significantly increased FmARF8 and FmARF28 expression in leaves (P< 0.05); yellow light led to significantly higher expression of most genes in stems compared to other treatments (P< 0.05); red light induced extremely significant upregulation of FmARF9, FmARF15, and FmARF28 in roots (P< 0.01).
In summary, these results indicate that members of this gene family may participate in plant responses to different light wavelengths, regulating tissue development to adapt to light quality changes.
3.12 Regulatory network analysis of FmARF gene expression and physiological-biochemical indices
Correlation prediction analysis was conducted between total chlorophyll content, proline, leaf growth, leaf area, soluble sugar and gene expression indices in F. multiflora (Figure 9). Results showed that FmARF9 was correlated with most genes, soluble sugar (r=0.67) and proline (r=0.76) in leaves, and was significantly positively correlated with soluble sugar and proline (P<0.05). Specifically, leaf area (LSA) was extremely significantly negatively correlated with FmARF2 (r=-0.75, P<0.01) and extremely significantly positively correlated with FmARF7 (r=0.93, P<0.01). Chlorophyll (Chl) content was significantly positively correlated with FmARF19 (r=0.68, P<0.05) and extremely significantly negatively correlated with FmARF36 (r=-0.81, P<0.01). Proline (Pro) was significantly positively correlated with FmARF2, 5, 9, 25 and 29 (r>0, P<0.05), and significantly negatively correlated with FmARF17 and 26 (r<0, P<0.05). Soluble sugar (SS) was significantly positively correlated with FmARF5, 9 and 25(r>0, P<0.05), and significantly negatively correlated with FmARF17, 19 and 26 (r<0, P<0.05).
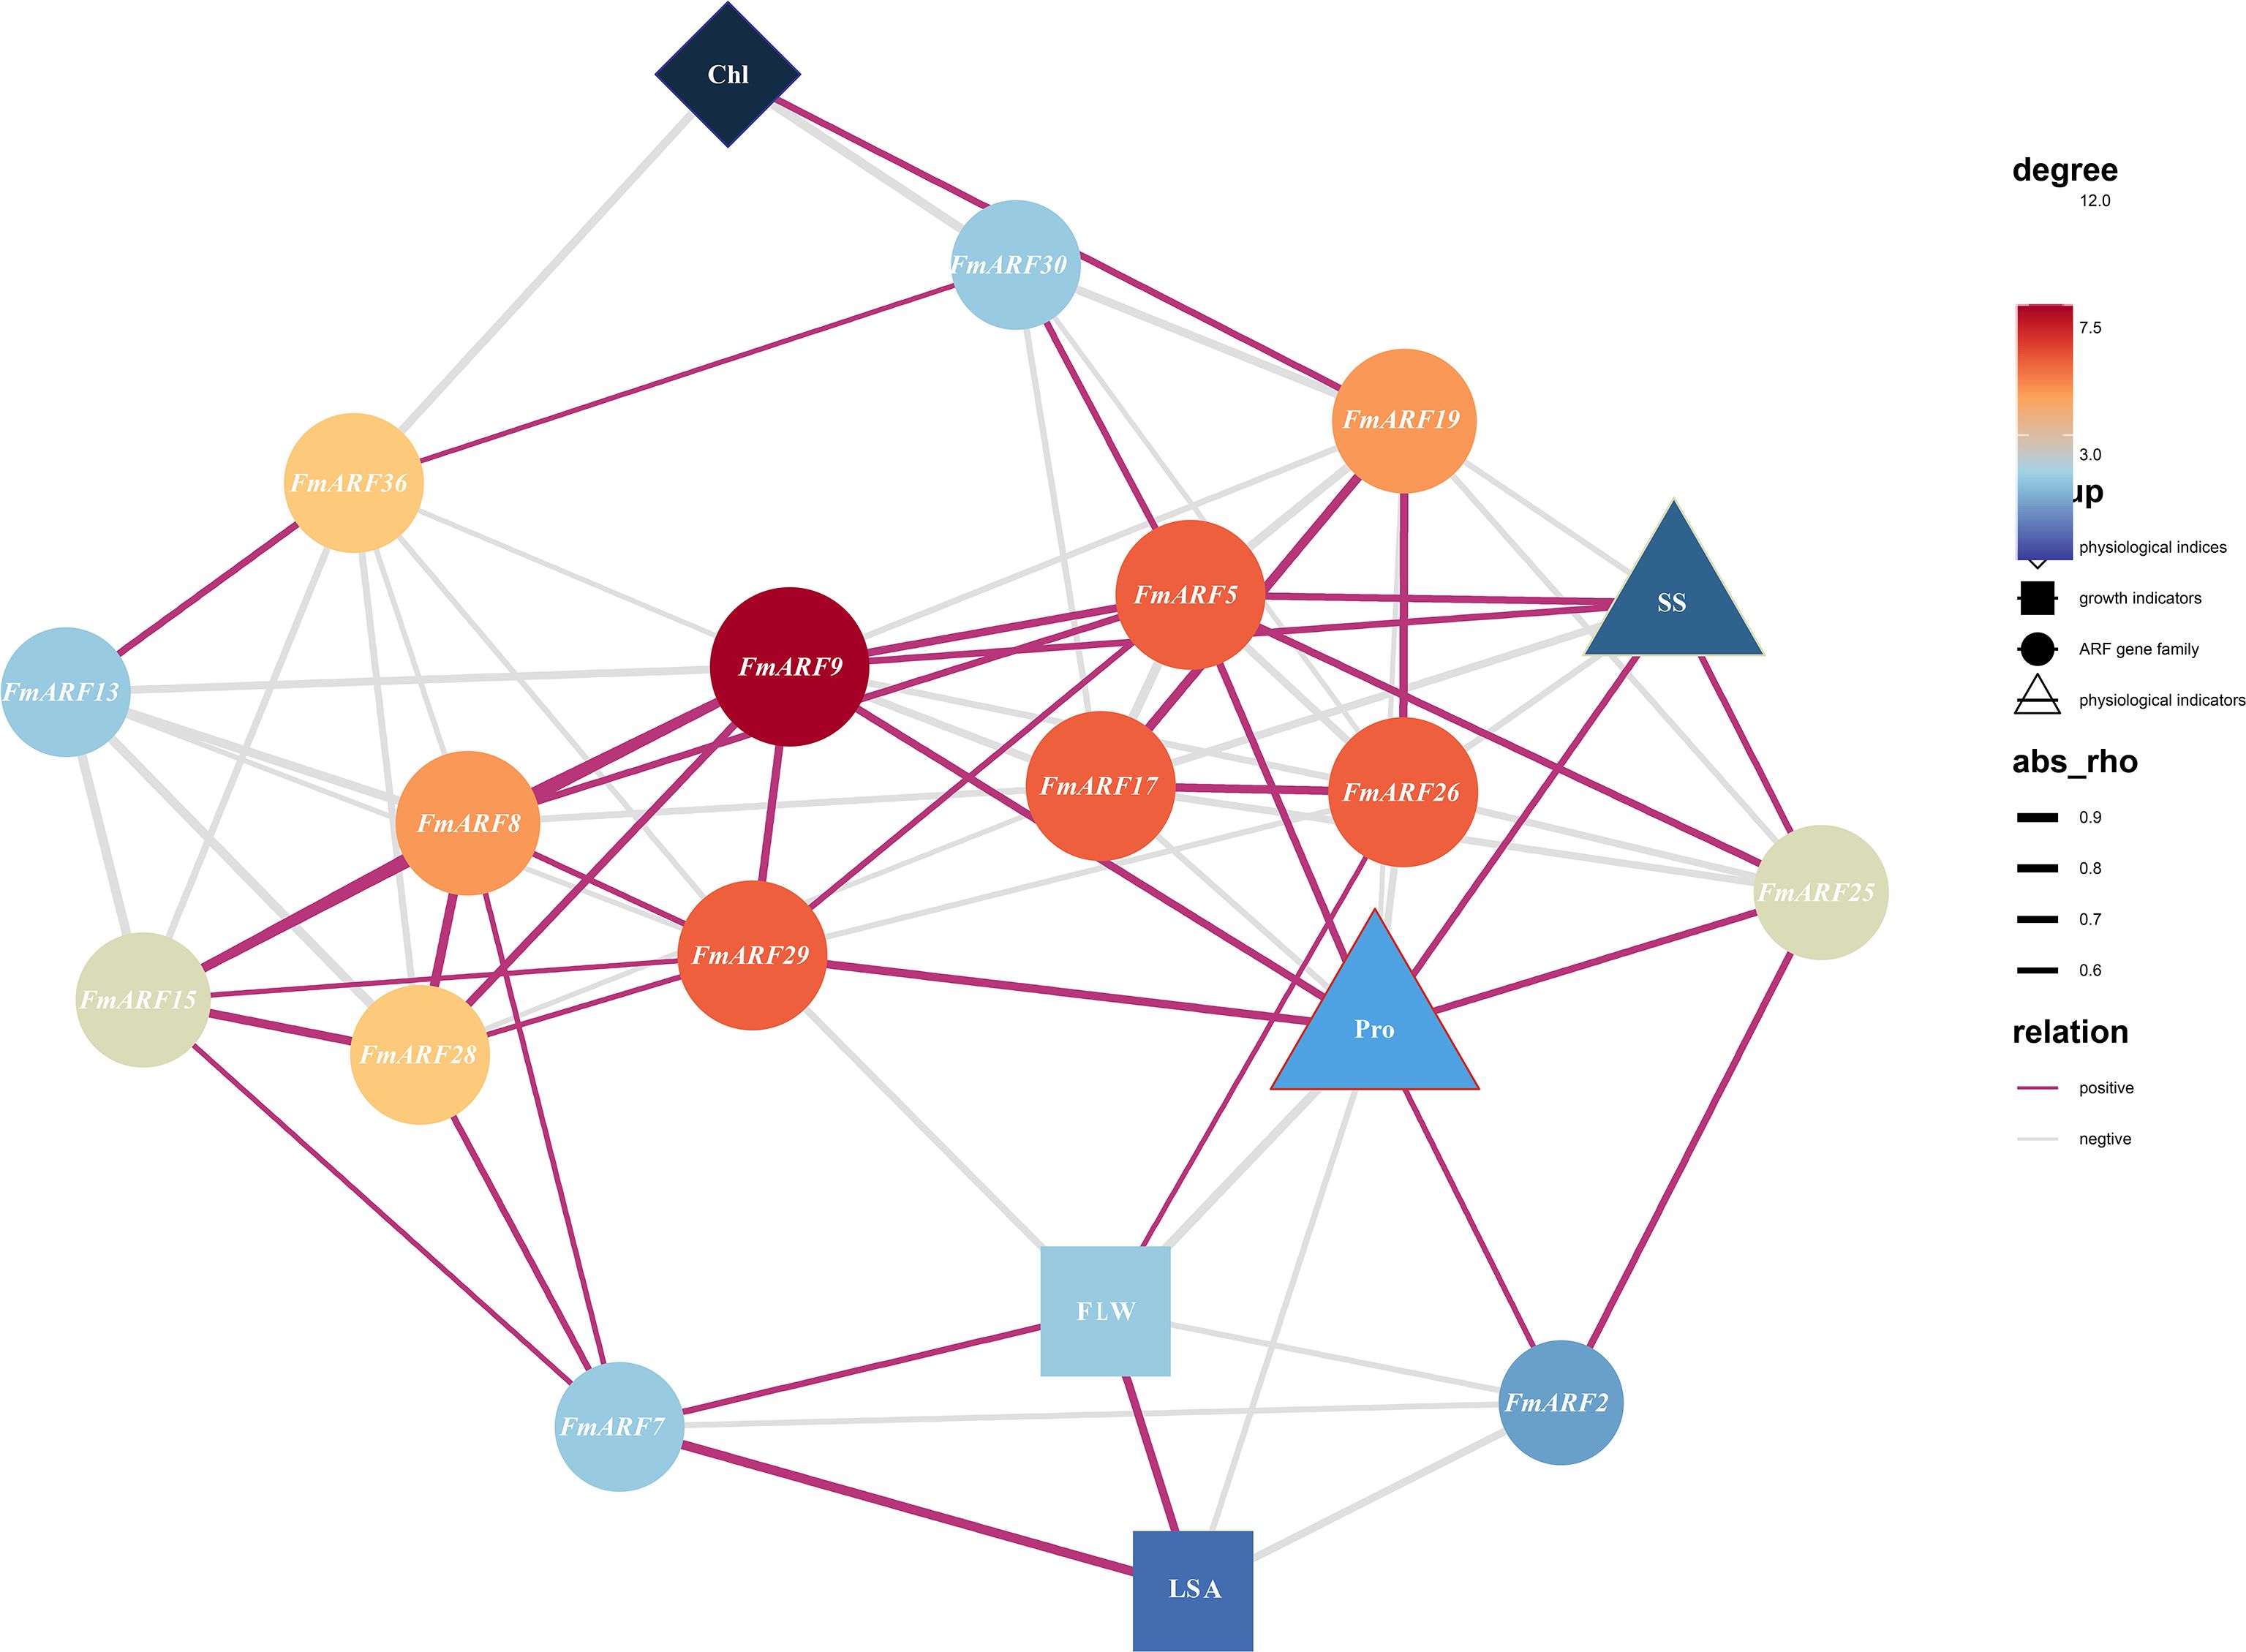
Figure 9. Correlation prediction analysis network heatmap of leaf growth, physiological and biochemical indices, and ARF gene family expression levels in F. multiflora. (Chl: Chlorophyll; Pro: Proline; SS: soluble sugar; FLW: Leaf fresh weight; LSA: Leaf area. The color and size of nodes correspond to the degree (connectivity). Nodes that are more orange-red in color and larger in size indicate that the corresponding gene has more associations with other elements).
Correlation Prediction Analysis was performed between stem growth (SFW), stem length (SL), physcion, emodin, THSG and gene expression indices in F. multiflora (Figure 10). Results indicated that FmARF8 was correlated with most genes, emodin, and THSG in stems. Specifically, stem length was significantly positively correlated with FmARF17, 19 and 26 (r>0, P<0.05), and significantly negatively correlated with FmARF2, 15 and 30 (r<0, P<0.05). Physcion showed extremely significant negative correlations with FmARF2, 13, 15, 17, 19, 25 and 26 (r<0, P<0.01), and significant negative correlations with FmARF5 and 28 (r<0, P<0.05). Emodin exhibited extremely significant negative correlations with FmARF2, 13, 15, 17, 19, 25, 26 and 28 (r<0, P<0.01), and a significant negative correlation with FmARF5 (r<0, P<0.05). THSG showed extremely significant negative correlations with FmARF30 (r<0, P<0.01) and significant negative correlations with FmARF9 (r<0,P<0.05).
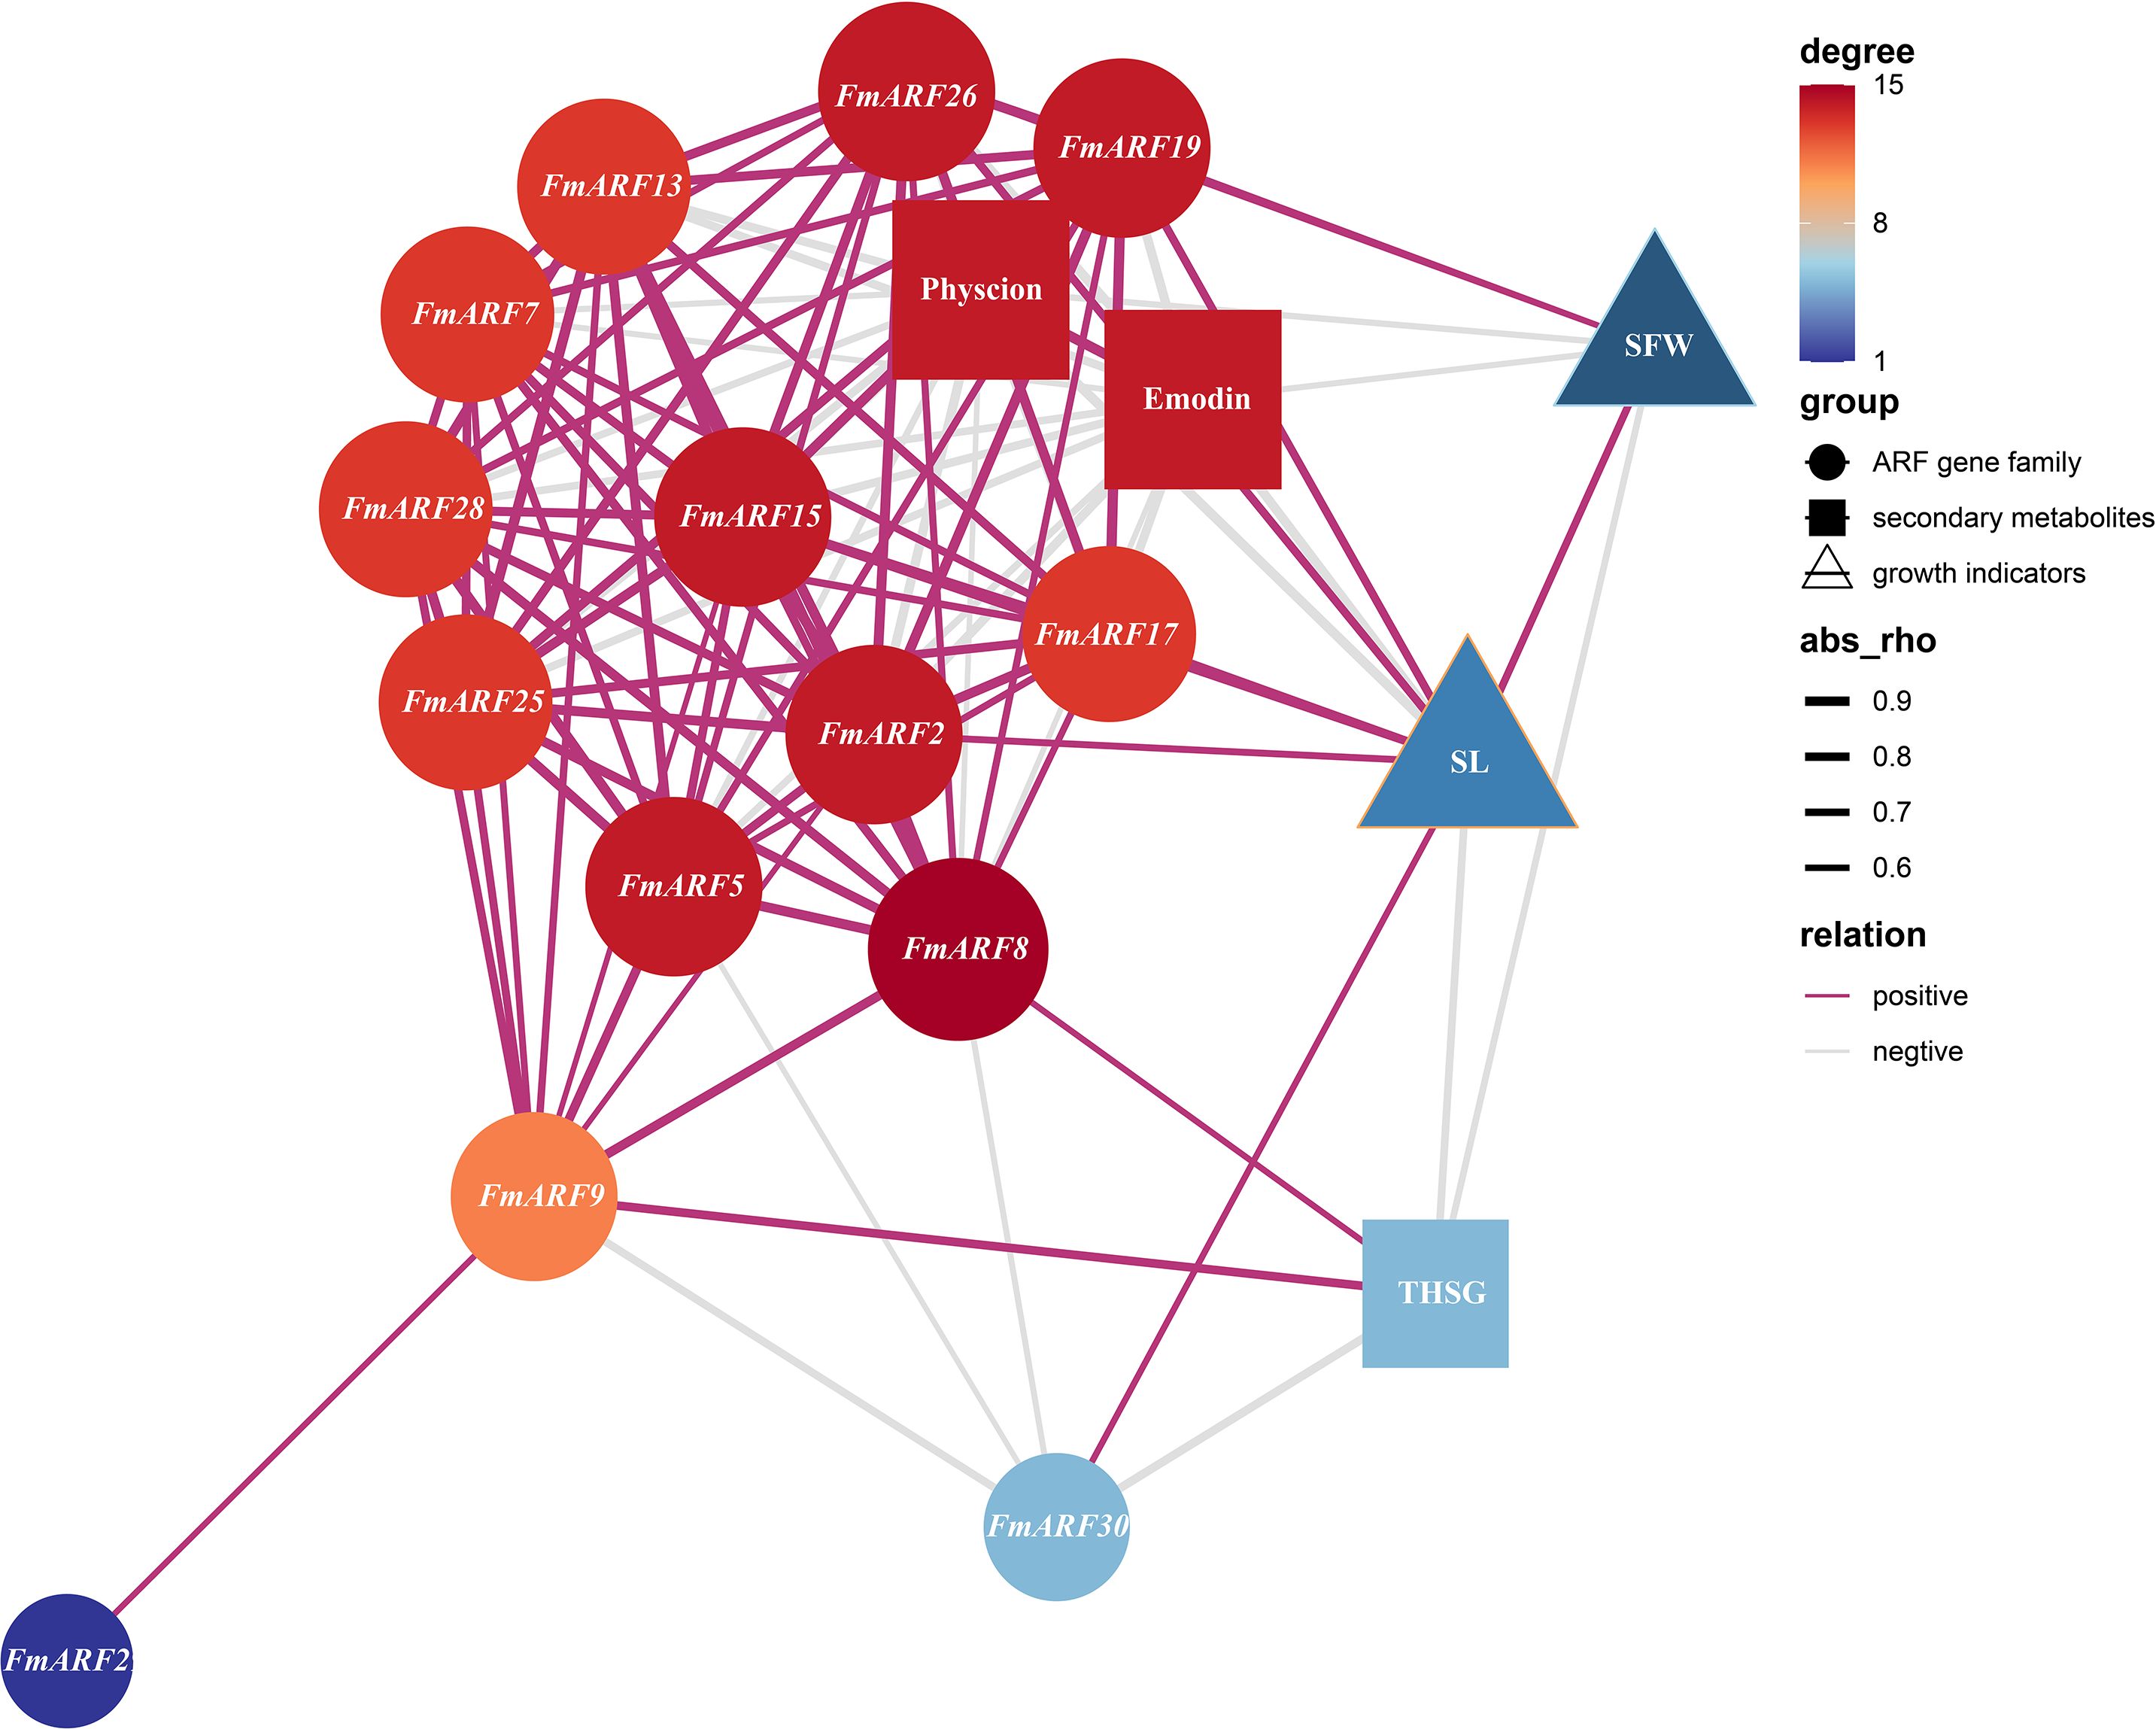
Figure 10. Correlation prediction analysis network heatmap of stem growth, secondary metabolites, and ARF gene family expression levels in F. multiflora. (SL: Stem length; SFW: Stem fresh weight. Nodes that are more orange-red in color and larger in size indicate that the corresponding gene has more associations with other elements).
Correlation prediction analysis was conducted between root growth parameters (root fresh weight, RFW; root length, RL) and secondary metabolite contents (physcion, emodin, THSG) against gene expression indices in F. multiflora (Figure 11). Results showed that FmARF9 was significantly associated with most genes and indices related to emodin and THSG in roots(P<0.05). Specifically, FmARF9 exhibited a significant negative correlation with THSG (r=-0.69, P<0.05) and extremely significant positive correlations with physcion and emodin (r>0, P<0.01).Root length (RL) displayed extremely significant positive correlations with FmARF15, FmARF25, and FmARF28 (r>0, P<0.01), significant positive correlations with FmARF9 and FmARF30 (r>0, P<0.05), and extremely significant negative correlations with FmARF2, FmARF15, FmARF19, and FmARF36 (r<0, P<0.01). Physcion exhibited extremely significant negative correlations with FmARF2, FmARF5, and FmARF36 (r<0, P<0.01), a significant negative correlation with FmARF17 (r=-0.69, P<0.05), extremely significant positive correlations with FmARF8, FmARF9, FmARF15, FmARF25and FmARF28 (r>0, P<0.01), and significant positive correlations with FmARF29 and FmARF30 (r>0, P<0.05). Emodin showed extremely significant negative correlations with FmARF2, FmARF5, and FmARF36 (r<0, P<0.01), a significant negative correlation with FmARF19 (r=-0.67, P<0.05), and extremely significant positive correlations with FmARF9, FmARF15, FmARF25, FmARF28 and FmARF30 (r>0, P<0.01). THSG demonstrated an extremely significant negative correlation with FmARF8 (r=-0.86, P<0.01), significant negative correlations with FmARF9 and FmARF29 (r<0, P<0.05), and an extremely significant positive correlation with FmARF17 (r=0.71, P<0.01).
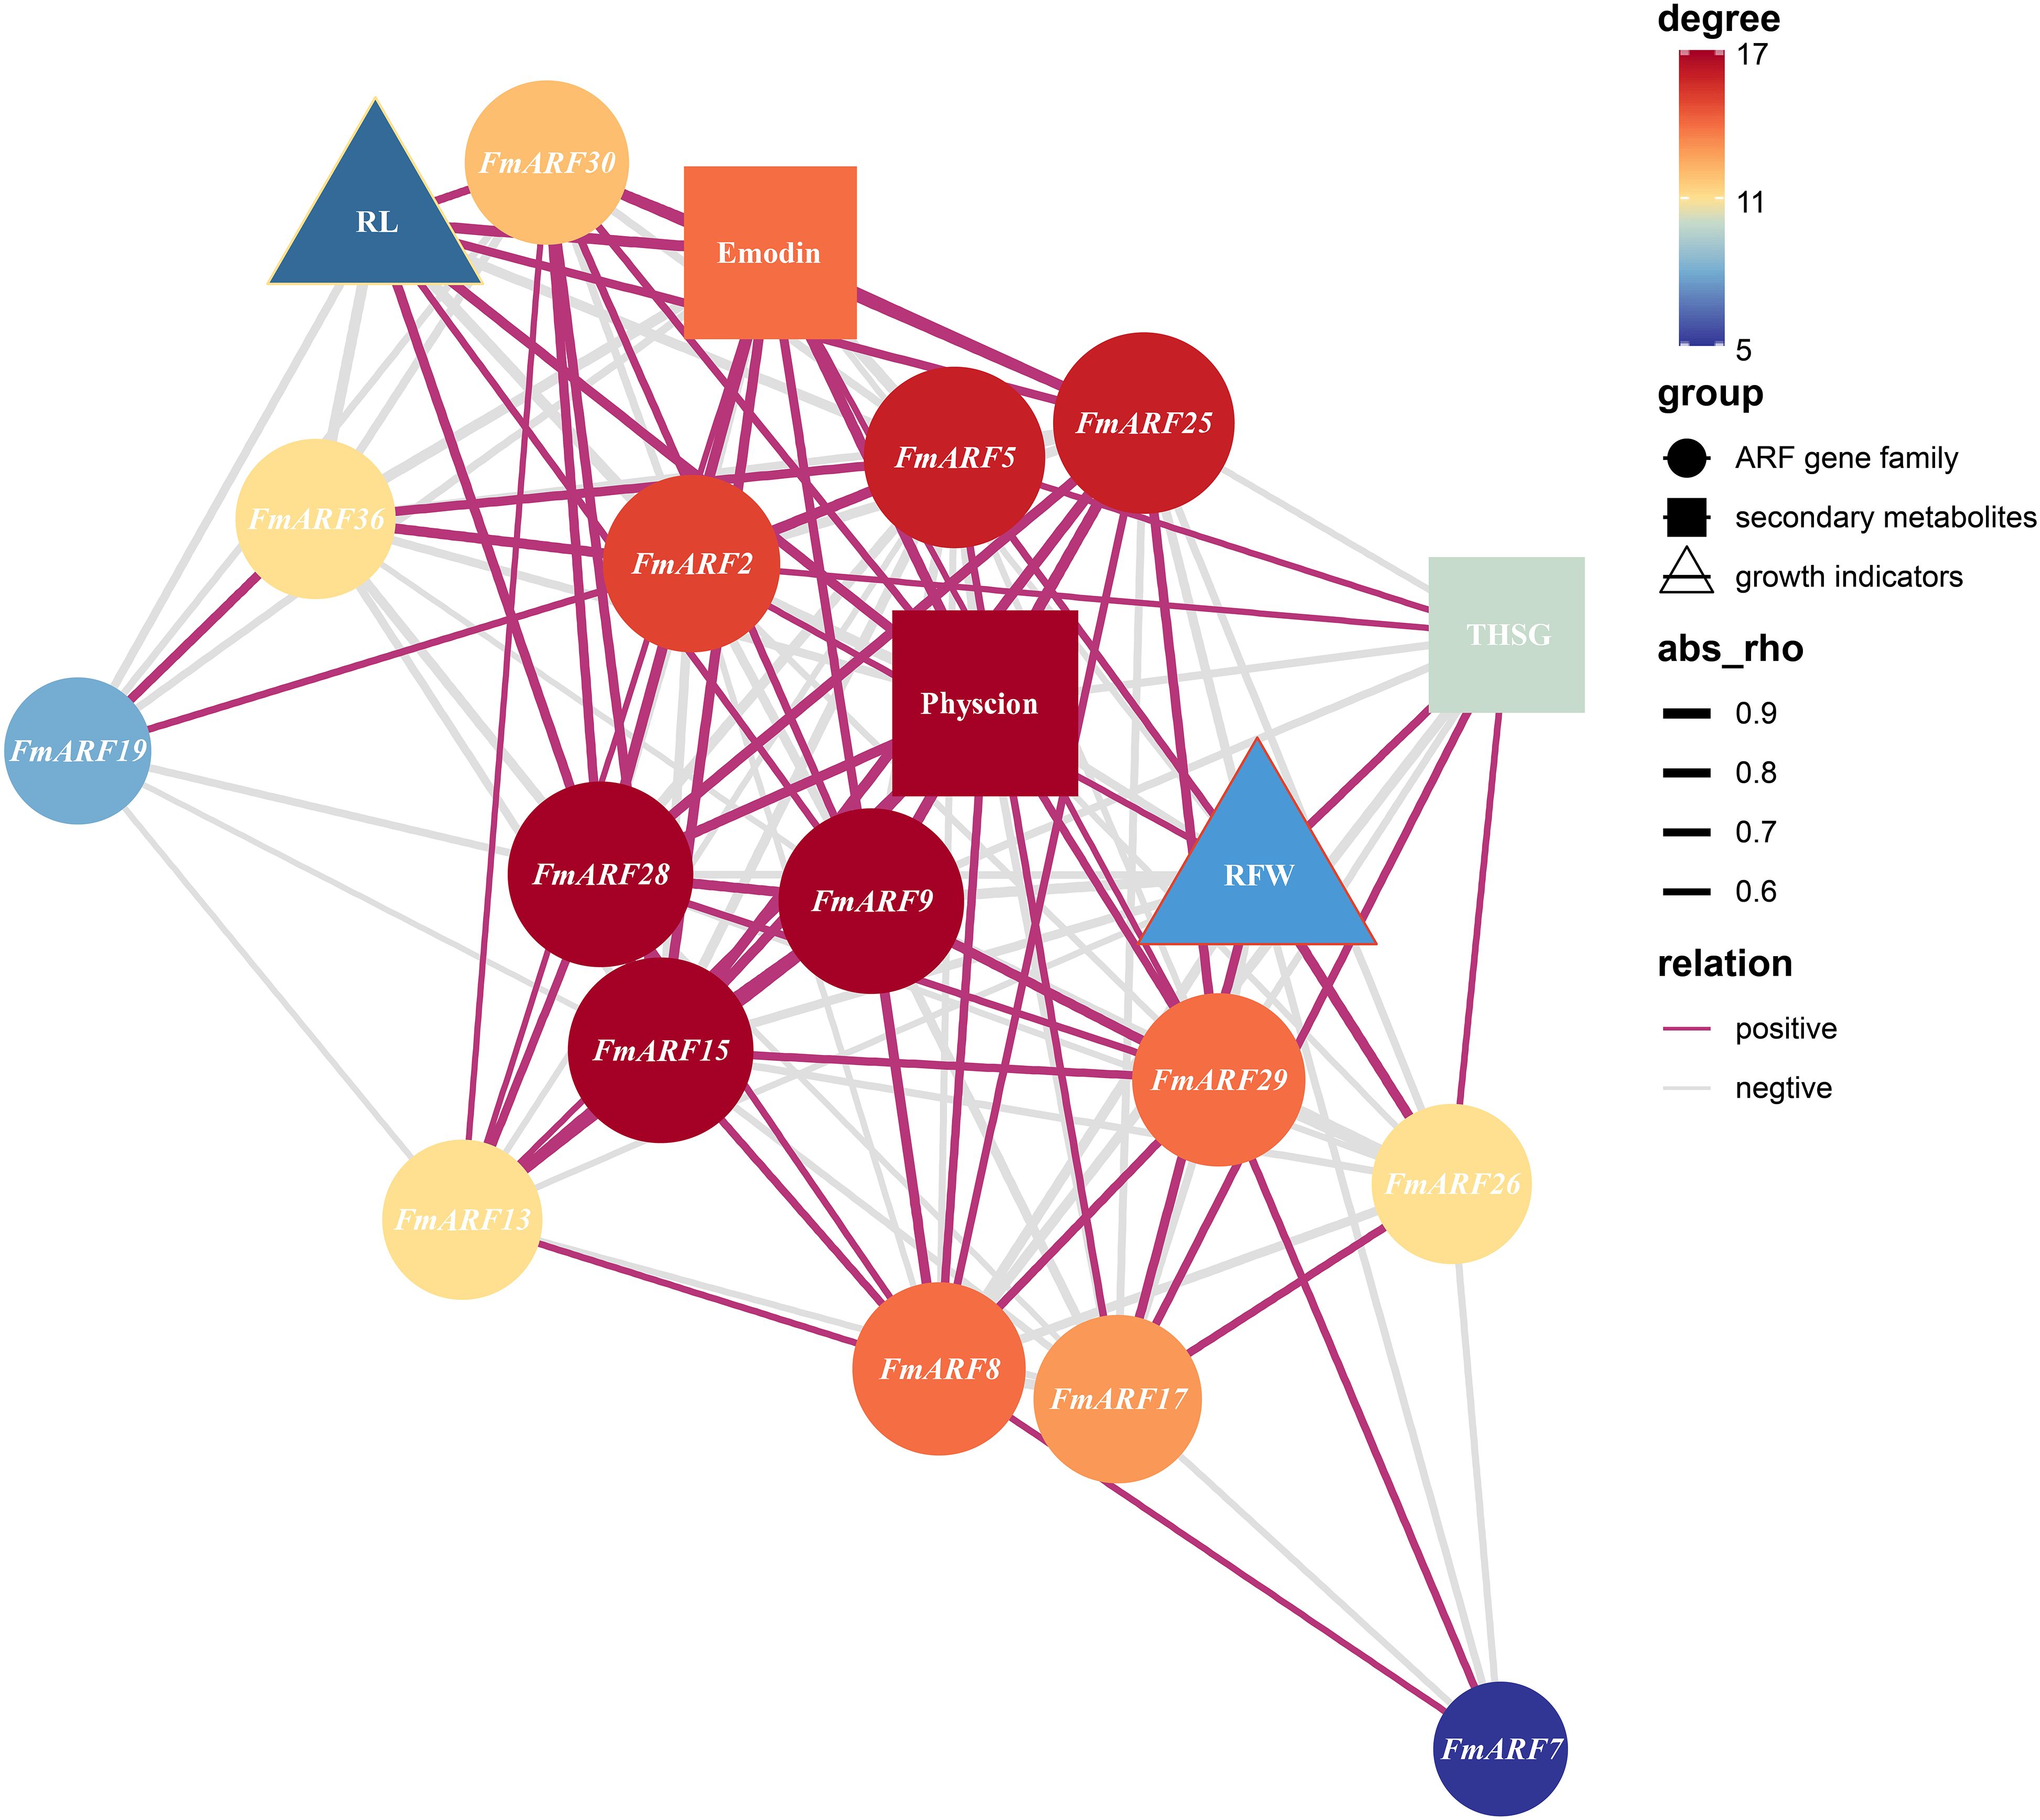
Figure 11. Correlation prediction analysis network heatmap of root growth, secondary metabolites, and ARF gene family expression levels in F. multiflora. (RL: Root length; RFW: Root fresh weight. Nodes that are more orange-red in color and larger in size indicate that the corresponding gene has more associations with other elements).
4 Discussion
In the field of plant photomorphogenesis research, F. multiflora—a medicinal plant with both shade-tolerant and sun-loving characteristics—has an unclear growth and development mechanism under different light qualities. This study first established white, blue, red, and yellow light treatment systems to systematically analyze the effects of various light qualities on plant morphogenesis, physiological-biochemical indices, and secondary metabolite accumulation in F. multiflora. Additionally, ARF gene family members were identified at the whole-genome level, and spatiotemporal expression patterns and functional differentiation of the ARF gene family under different light qualities were deeply explored through physiological index measurements and gene expression analyses. The research predicted the regulatory mechanisms by which F. multiflora adapts to light environmental changes from both phenotypic response and molecular regulatory network dimensions, providing critical evidence for improving cultivation ecological regulation strategies of F. multiflora. Meanwhile, it illuminates the potential action mechanisms of the ARF gene family in light signal transduction, offering insights for deepening the understanding of plant light signal transduction mechanisms.
As a key driver of plant carbon metabolism, light quality profoundly influences plant morphology, physiology, and various biochemical pathways by regulating light signal transduction (Rehman et al., 2024). Using white light as a reference, this study treated F. multiflora with red, blue, and yellow light to systematically analyze the regulatory effects of different light qualities on its growth and development. After 20 days of light treatment, the leaf area of the blue light group significantly increased by 46.19% compared with the white light group (P<0.05), while the leaf areas of the red and yellow light groups were significantly lower than that of the white light group, indicating that different light qualities significantly affect the growth and development of F. multiflora leaves. Blue light effectively promotes leaf growth, whereas red and yellow lights inhibit leaf area expansion. In terms of plant height, blue light significantly inhibited vertical growth by 20.92% (P<0.05), while red light significantly promoted plant height by 83.56% and also significantly enhanced root length (P<0.05). Studies on chlorophyll and leaf color difference showed that blue light-treated leaves were greener with the highest chlorophyll content, which was negatively correlated with the a* value, suggesting that blue light promotes chlorophyll synthesis (Liu and van Iersel, 2021). Measurements of osmotic adjustment substances revealed that proline, an important osmotic regulator in plants, accumulated significantly under yellow light to participate in redox reactions, scavenge reactive oxygen species, reduce oxidative damage, and enhance the antioxidant defense system. The change in proline content may be related to the plant light signal transduction pathway. As a specific light quality signal, yellow light may affect the expression of proline synthesis-related genes or metabolic pathways by activating or regulating certain photoreceptors and signal transduction pathways, leading to significant changes in proline content. Additionally, yellow light treatment increased the soluble sugar content in F. multiflora leaves, indicating that yellow light promotes plant growth and metabolism, indirectly facilitating soluble sugar accumulation. As an environmental signal, yellow light can be transmitted into cells through photoreceptors, causing changes in gene expression. Some genes related to sugar metabolism may be activated or inhibited under yellow light, affecting the synthesis, conversion, and accumulation of soluble sugars. Systematic studies on active components showed that light quality, as an important environmental regulator, significantly and differentially regulates the accumulation of secondary metabolites in F. multiflora (P<0.05). The contents of THSG, emodin, and physcion in stems under blue light were significantly higher than those in other treatment groups. Meanwhile, blue light specifically induced THSG biosynthesis in roots, with its content significantly higher than that in other light quality groups (P<0.05). Previous studies have shown that blue light can affect the expression of flavonoid biosynthesis-related genes in Epimedium sagittatum and promote flavonoid metabolite accumulation (Yang et al., 2022). Under different light qualities, significant changes in leaf morphology and chlorophyll content of Atropa belladonna occur, and red light significantly promotes the synthesis of tropane alkaloids (Gu et al., 2025). These results reveal the unique roles of different light quality treatments in inducing the accumulation of active components in medicinal plants, providing a theoretical basis for optimizing the light environment regulation strategies for medicinal plants.
Based on the changes in growth and physiological indices of F. multiflora under different light qualities, this study further analyzed the auxin response factor (ARF) gene family, a key component of the auxin signaling pathway, to explore its molecular response mechanisms and elaborate on the underlying mechanisms by which it affects plant growth and development at the molecular level. A total of 37 members of the ARF gene family were identified from the whole-genome data of F. multiflora. Compared with Arabidopsis thaliana (Guilfoyle and Hagen, 2007), rice (Wang et al., 2007), citrus (Li et al., 2015), quinoa (Wang et al., 2025), and tomato (Zouine et al., 2014), the FmARF gene family in F. multiflora contains a larger number of members. Gene duplication and differentiation are critical for gene family expansion and functional evolution. Collinearity analysis within the genome revealed that the duplication types of the FmARF gene family were primarily whole-genome duplication and segmental duplication, with no tandem duplication events detected, consistent with findings in plants such as ginseng (Yan et al., 2023). Analysis of 22 pairs of collinear FmARF genes showed that the Ka/Ks ratios of all collinear gene pairs were less than 1, suggesting that they have undergone strong purifying selection pressure during evolution, favoring purifying selection.
Analysis of conserved domains and gene structures revealed that the FmARF gene family in F. multiflora primarily harbors three major domains: an N-terminal B3-type DNA-binding domain (DBD), which exhibits strong conservation and directly binds to auxin response elements (AuxREs) (Szemenyei et al., 2008); a middle Auxin_resp domain (MR), whose amino acid composition determines whether ARF proteins act as activators or repressors; and a C-terminal dimerization domain (CTD) containing a PB1 (Phox and Bem1) module, which participates in regulating ARF binding to AuxREs and controls the expression of downstream auxin-responsive genes (Tiwari et al., 2003; Roosjen et al., 2018). The ARF gene family achieves precise responses to auxin signals through the collaborative action of these domains: the B3 domain determines the targeting of gene regulation, while the AUX-IAA and Auxin-resp domains control ARF activation timing via dynamic interactions with Aux/IAA proteins. This molecular mechanism enables plants to rapidly adjust processes such as cell growth and organ development in response to changes in auxin concentration.
Promoter prediction of the FmARF gene family in F. multiflora showed that FmARF transcription factors are primarily involved in abiotic stress, hormone, and light regulation responses, indicating that FmARF genes participate in related growth and development pathways to regulate the growth and development of F. multiflora. As a key factor directly regulating plant growth and development, the regulatory effect of light quality on the ARF gene family has been rarely reported. This study found that under different light quality treatments, the expression levels of ARF genes in different tissues of F. multiflora changed significantly. Most ARF genes in the leaves of the blue light treatment group showed significant expression changes, most ARF genes in the stems of the yellow light treatment group were significantly upregulated, and most genes in the roots of the red light treatment group were significantly upregulated. It is speculated that the responses of ARF genes in different tissues of F. multiflora vary significantly under different light quality treatments, indicating that these FmARF genes play different roles in different tissues under various environmental conditions. Studies have shown that ARF genes in sweet potato (Ipomoea batatas) exhibit tissue-specific expression (Pratt and Zhang, 2021),and this result is consistent with the low expression of FmARF8 in the roots of F. multiflora observed in this study. Different genes of the same gene family exhibit distinct expression patterns in different tissue parts of plants.
This study conducted correlation analysis between various growth and physiological indices of different tissues and the expression levels of light-regulated ARF genes. The results showed that most ARF genes exhibited negative correlations with the contents of emodin, physcion, THSG and other substances. In the stems of F. multiflora, THSG content was significantly negatively correlated with FmARF9 and FmARF30, while free anthraquinones such as physcion and emodin were significantly negatively correlated with FmARF2, FmARF5, FmARF13, FmARF15, FmARF17, FmARF19, FmARF25, FmARF26 and FmARF28. In the roots, THSG content was significantly negatively correlated with FmARF8, FmARF9 and FmARF29, but positively correlated with FmARF17; physcion was negatively correlated with FmARF2, FmARF5, FmARF17 and FmARF36, but positively correlated with FmARF8, FmARF9, FmARF15, FmARF25, FmARF28, FmARF29 and FmARF30; emodin was negatively correlated with FmARF2, FmARF5, FmARF19 and FmARF36, but positively correlated with FmARF9, FmARF15, FmARF25, FmARF28 and FmARF30. These strong correlations indicate that the expression of these genes is closely associated with tissue development in different organs and the accumulation of secondary metabolites, suggesting their potential roles in biosynthetic pathways. However, further functional verification is required to confirm whether a causal regulatory relationship exists. However, the correlations between gene expression and secondary metabolite accumulation vary among different tissues, and the mechanisms by which related synthetic pathways respond to these signals and regulate downstream gene expression remain unclear. Further experiments are needed to confirm the functions of these genes and their relationships with response pathways.
In summary, this study explored the growth, development, and physiological changes of F. multiflora under different light quality regulations. It was found that growth indices such as leaf area, plant height, and root length of F. multiflora showed significant variations under different light quality treatments. The proline content was the highest under yellow light treatment, indicating the strongest stress on F. multiflora. Blue light was conducive to the accumulation of THSG in roots and stems of F. multiflora, and could promote the accumulation of free anthraquinones such as emodin and physcion in stems.
To analyze the molecular mechanism of growth and development regulation in F. multiflora, this study conducted a comprehensive bioinformatics analysis of the ARF gene family in F. multiflora at the whole-genome level. A total of 37 FmARF genes were identified, which were divided into four subfamilies. The encoded amino acids ranged from 358 to 1116 aa in length, and the relative molecular masses of the proteins were distributed in the range of 40087.57 to 124334.31. All were hydrophilic unstable proteins. All FmARF genes contained Auxin_resp and B3 conserved domains. Expression pattern analysis showed that the expression pattern characteristics of FmARF genes varied in different environmental conditions and different tissue parts. Correlation analysis between growth, physiological and biochemical indices, and gene expression levels found that the ARF gene family was correlated with the synthesis of secondary metabolites such as physcion, emodin, and THSG in F. multiflora. However, further functional verification is required to confirm whether a causal regulatory relationship exists.
This study lays a theoretical foundation for further exploring the regulatory mechanism of different light qualities on the growth and development of F. multiflora and the functions of FmARF genes in F. multiflora.
Data availability statement
The original contributions presented in the study are included in the article/supplementary material. Further inquiries can be directed to the corresponding authors.
Author contributions
WL: Data curation, Methodology, Writing – original draft, Conceptualization, Formal analysis, Project administration, Validation. SZ: Project administration, Writing – original draft. YZ: Formal analysis, Writing – original draft. WH: Data curation, Writing – original draft. LC: Data curation, Writing – review & editing. ND: Funding acquisition, Writing – review & editing. RZ: Investigation, Validation, Writing – review & editing. MW: Investigation, Writing – original draft. XG: Writing – original draft, Methodology. JW: Software, Writing – original draft. SL: Writing – original draft, Funding acquisition. LY: Conceptualization, Methodology, Writing – review & editing. CD: Project administration, Resources, Supervision, Writing – original draft, Writing – review & editing.
Funding
The author(s) declared that financial support was received for this work and/or its publication. This research was supported by the Key Research and Development Program of Henan Province (grant numbers 251111310500, 231111312700 and 241111310200), the International Science and Technology Cooperation Projects in Henan Province (grant number 252102520068), the Postdoctoral Research Foundation of Henan Province (grant number HN2025075), the National Natural Science Foundation of China (grant numbers 82104329 and 32401226), the China Postdoctoral Science Foundation (grant number 2024T170252) and the Henan Youth Student Science Foundation Project (grant number 252300423976).
Acknowledgments
We thank the public database for the downloaded raw data.
Conflict of interest
The authors declare that the research was conducted in the absence of any commercial or financial relationships that could be construed as a potential conflict of interest.
Generative AI statement
The author(s) declare that no Generative AI was used in the creation of this manuscript.
Any alternative text (alt text) provided alongside figures in this article has been generated by Frontiers with the support of artificial intelligence and reasonable efforts have been made to ensure accuracy, including review by the authors wherever possible. If you identify any issues, please contact us.
Publisher’s note
All claims expressed in this article are solely those of the authors and do not necessarily represent those of their affiliated organizations, or those of the publisher, the editors and the reviewers. Any product that may be evaluated in this article, or claim that may be made by its manufacturer, is not guaranteed or endorsed by the publisher.
Supplementary material
The Supplementary Material for this article can be found online at: https://www.frontiersin.org/articles/10.3389/fpls.2025.1645778/full#supplementary-material
References
Chen, C., Chen, H., Zhang, Y., Thomas, H. R., Frank, M. H., He, Y. H., et al. (2020). Tbtools: an integrative toolkit developed for interactive analyses of big biological data. Mol. Plant 13, 1194–1202. doi: 10.1016/j.molp.2020.06.009
Gao, D., Yi, W., Liu, B., Zhang, C., Yang, C., Li, Z., et al. (2025). Tetrahydroxy stilbene glucoside rejuvenates aging hematopoietic stem cells with predilection for lymphoid differentiation via ampk and tet2. J. Adv. Res. 70, 515–529. doi: 10.1016/j.jare.2024.04.027
Garcia-Gonzalez, J., Kebrlova, S., Semerak, M., Lacek, J., Baby, I. K., Petrasek, J., et al. (2020). Arp2/3 complex is required for auxin-driven cell expansion through regulation of auxin transporter homeostasis. Front. Plant Sci. 11. doi: 10.3389/fpls.2020.00486
Gu, X., Yang, L., Zhang, D., Zhang, S., Zhou, S., Dong, N., et al. (2025). Manipulation of artificial light environment improves tropane alkaloids content in atropa belladonna l. Plant Physiol. Biochem. 223, 15. doi: 10.1016/j.plaphy.2025.109828
Guilfoyle, T. J. and Hagen, G. (2007). Auxin response factors. Curr. Opin. Plant Biol. 10, 453–460. doi: 10.1016/j.pbi.2007.08.014
Li, S., OuYang, W., Hou, X., Xie, L., Hu, C., Zhang, J. Z., et al. (2015). Genome - wide identification, isolation and expression analysis of auxin response factor (arf) gene family in sweet orange (citrus sinensis). Front. Plant Sci. 6. doi: 10.3389/fpls.2015.00119
Liu, J. and van Iersel, M. W. (2021). Photosynthetic physiology of blue, green, and red light: light intensity effects and underlying mechanisms. Front. Plant Sci. 12. doi: 10.3389/fpls.2021.619987
Niu, X., Guan, Y., Chen, S., and Li, H. (2017). Genome-wide analysis of basic helix-loop-helix (bhlh) transcription factors in brachypodium distachyon. BMC Genomics 18, 619. doi: 10.1186/s12864-017-4044-4
Pratt, I. S. and Zhang, B. (2021). Genome-wide identification of arf transcription factor gene family and their expression analysis in sweet potato. Int. J. Mol. Sci. 22, 13. doi: 10.3390/ijms22179391
Rehman, M., Pan, J., Mubeen, S., Ma, W., Luo, D., Cao, S., et al. (2024). Morpho-physio-biochemical, molecular, and phytoremedial responses of plants to red, blue, and green light: a review. Environ. Sci. pollut. Res. 20, 20772–20791. doi: 10.1007/s11356-024-32532-6
Roosjen, M., Paque, S., and Weijers, D. (2018). Auxin response factors: output control in auxin biology. J. Exp. Bot. 69, 179–188. doi: 10.1093/jxb/erx237
Soltani, S., Arouiee, H., Salehi, R., Nemati, S. H., Moosavi-Nezhad, M., Gurda, N. S., et al. (2023). Morphological, phytochemical, and photosynthetic performance of grafted tomato seedlings in response to different led light qualities under protected cultivation. Horticulturae 9, 18. doi: 10.3390/horticulturae9040471
Sun, C., Fan, K., Wang, X., Liu, H., Guo, N., Liu, W. Y., et al. (2025). The involvement of auxin response factor osarf7 in positively regulating root development by mediating the expression of oscrl1 in rice (oryza sativa l.). Plant Mol. Biol. 115, 15. doi: 10.1007/s11103-025-01570-0
Szemenyei, H., Hannon, M., and Long, J. A. (2008). Topless mediates auxin-dependent transcriptional repression during arabidopsis embryogenesis. Science 319, 1384–1386. doi: 10.1126/science.1151461
Tiwari, S. B., Hagen, G., and Guilfoyle, T. (2003). The roles of auxin response factor domains in auxin-responsive transcription. Plant Cell. 15, 533–543. doi: 10.1105/tpc.008417
Wang, D., Pei, K., Fu, Y., Sun, Z., Li, S., Liu, H. Q., et al. (2007). Genome - wide analysis of the auxin response factors (arf) gene family in rice (oryza sativa). Gene 394, 13–24. doi: 10.1016/j.gene.2007.01.006
Wang, B., Zhu, X., Song, X., Zhao, Y., Yang, D., Wang, W. T., et al. (2025). Identification of arf gene family and functional analysis of cqarf05 under drought and salt stress in quinoa. Sci. Rep. 15, 16. doi: 10.1038/s41598-025-89198-4
Wilmoth, J. C., Wang, S. C., Tiwari, S. B., Joshi, A. D., Hagen, G., Guilfoyle, T. J., et al. (2005). Nph4/arf7 and arf19 promote leaf expansion and auxin-induced lateral root formation. Plant J. 43, 118–130. doi: 10.1111/j.1365-313X.2005.02432.x
Yan, M., Yan, Y., Wang, P., Wang, Y., Piao, X., Di, P., et al. (2023). Genome-wide identification and expression analysis of auxin response factor (arf) gene family in panax ginseng indicates its possible roles in root development. Plants 12, 19. doi: 10.3390/plants12233943
Yang, K., Zhang, H., Sun, L., Zhang, Y., Gao, Z., Song, X. Z., et al. (2025). Identification and characterization of the auxin-response factor family in moso bamboo reveals that pearf41 negatively regulates second cell wall formation. Plant Physiol. Biochem. 219, 11. doi: 10.1016/j.plaphy.2024.109395
Yang, L., Zhou, S., Hou, Y., Ji, B., Pei, L., Su, X. H., et al. (2022). Blue light induces biosynthesis of flavonoids in epimedium sagittatum (sieb. Et zucc.) Maxim. Leaves, a study on a light-demanding medicinal shade herb. Ind. Crop Prod. 187, 12. doi: 10.1016/j.indcrop.2022.115512
Yu, H., Soler, M., Mila, I., Clemente, H. S., Savelli, B., Dunand, C., et al. (2014). Genome - wide characterization and expression profiling of the auxin response factor (arf) gene family in eucalyptus grandis. PloS One 9, 13. doi: 10.1371/journal.pone.0108906
Zhang, L. and Chen, J. (2018). Biological effects of tetrahydroxystilbene glucoside: an active component of a rhizome extracted from polygonum multiflorum. Oxid. Med. Cell. Longev. 2018, 15. doi: 10.1155/2018/3641960
Zhao, Y., Yang, Z., Zhang, Z., Yin, M., Chu, S., Tong, Z. Z., et al. (2023). The first chromosome-level fallopia multiflora genome assembly provides insights into stilbene biosynthesis. Hortic. Res. 10, 14. doi: 10.1093/hr/uhad047
Zhang, L., Yang, X. H., and Deng, Y. Y. (2009). Evaluation and consideration on safety information abroad of polygonum multiflorum and its preparations. Chin. J. Chin. Mater. Med. 34. 2414–8. doi: 10.3321/j.issn:1001-5302.2009.18.034
Keywords: Fallopia multiflora (Thunb.), light quality, physiological and biochemical indices, genome-wide analysis, gene expression, secondary metabolism, molecular regulation
Citation: Liu W, Zhou S, Zheng Y, Hou W, Chu L, Dong N, Zhang R, Wang M, Gu X, Wan J, Liu S, Yang L and Dong C (2025) Analysis of growth variations and expression patterns of auxin response factor gene family in Fallopia multiflora under different light qualities. Front. Plant Sci. 16:1645778. doi: 10.3389/fpls.2025.1645778
Received: 31 July 2025; Accepted: 25 November 2025; Revised: 23 October 2025;
Published: 10 December 2025.
Edited by:
Aamir W. Khan, The University of Missouri, United StatesReviewed by:
Qiming Wang, Hunan Agricultural University, ChinaChen Meixiang, Fujian Agriculture and Forestry University, China
Copyright © 2025 Liu, Zhou, Zheng, Hou, Chu, Dong, Zhang, Wang, Gu, Wan, Liu, Yang and Dong. This is an open-access article distributed under the terms of the Creative Commons Attribution License (CC BY). The use, distribution or reproduction in other forums is permitted, provided the original author(s) and the copyright owner(s) are credited and that the original publication in this journal is cited, in accordance with accepted academic practice. No use, distribution or reproduction is permitted which does not comply with these terms.
*Correspondence: Linlin Yang, eWFuZ2xsLWhhdGNtQGhhY3RjbS5lZHUuY24=; Chengming Dong, ZGNtMzcxQHNvaHUuY29t