 Yajin Chen
 Xiaoxi Du
 Lei Pan
 Qiyuan Huang
 Zhigang Hao
- 1Hainan Key Laboratory for Biosafety Monitoring and Molecular Breeding in Off-Season Reproduction Regions, Sanya Research Institute and Institute of Tropical Bioscience and Biotechnology, Chinese Academy of Tropical Agricultural Sciences, Sanya, Hainan, China
- 2School of Mathematics and Statistics, Qingdao University, Qingdao, China
- 3Hainan Seed Industry Laboratory, Sanya, Hainan, China
- 4Key Laboratory of Integrated Pest Management on Crops in Northwestern Oasis, Ministry of Agriculture and Rural Affairs, National Plant Protection Scientific Observation and Experiment Station of Korla, Xinjiang Key Laboratory of Agricultural Biosafety, Institute of Plant Protection, Xinjiang Uygur Autonomous Region Academy of Agricultural Sciences, Urumqi, China
Papaya (Carica papaya L.) has a very high economic value, making it one of the “three major tropical herbaceous fruit trees” alongside banana and pineapple. However, it faces major challenges due to limited genetic diversity resulting from monocultures and barriers to interspecific hybridization, which seriously affect yield, quality, and disease resistance. To elucidate phylogenetic relationships among diverse cultivars and facilitate marker-assisted selection in breeding, we sequenced and analyzed the chloroplast genomes of 17 representative papaya cultivars, including commercial cultivars (e.g., ‘Guangmi’ and ‘Tainong’) and agricultural cultivars, by Illumina sequencing technology. The chloroplast genome showed a conserved tetrad-loop structure encoding 131 functional genes, and phylogenetic analyses using maximum likelihood (ML) revealed their evolutionary relationships and resolved two major clades. Whole-chloroplast genome sequence alignment analysis identified hypervariable non-coding regions, enabling the development of three high-resolution molecular markers (trnG–trnR, rbcL–accD, and rpl12–rps19). The three markers effectively distinguished key breeding lines (YZ1 and Tainong), providing a robust toolkit for germplasm innovation and marker-assisted breeding in papaya. This study not only provides a theoretical foundation and technical means for the genetic improvement of papaya but also serves as a reference for research on chloroplast resources in other tropical fruit trees.
1 Introduction
The genus Carica, a key economic group within the family Caricaceae (Avila-Hernandez et al., 2023), includes the model species Carica papaya L. (Supplementary Figure S1), renowned as the “king of fruits” due to its rich vitamin content (Leitao et al., 2022), proteolytic enzymes (Dominguez et al., 2006; Gomes et al., 2010), and medicinal properties (Haber et al., 2023). Although several species of the family Caricaceae were regionally cultivated, for example, Vasconcellea pubescens (Lemus-Mondaca et al., 2024), C. papaya is the only cultivated member of the genus Carica. The cross-incompatibility makes papaya highly vulnerable to pathogens and environmental stresses on account of its limited interspecies genetic diversity (Chávez-Pesqueira and Núñez-Farfán, 2017). Widely cultivated in tropical regions, papaya faces significant challenges in disease resistance breeding due to complex genetic backgrounds among species and cultivars, morphological plasticity, and frequent artificial hybridization leading to resistance gene introgression (Madronero et al., 2018; Mumo et al., 2020; Premchand et al., 2023). These factors complicate germplasm identification and hinder disease resistance breeding. While the nuclear genome of papaya has been extensively studied (Yue et al., 2022), research on its organellar genomes—particularly chloroplast (cpDNA)—remains limited (Lin et al., 2020).
Organellar genomes, originating from endosymbiotic events during early eukaryotic evolution, are critical for understanding plant evolution and adaptation (Hao et al., 2024a). The chloroplast genome, derived from cyanobacteria, typically exhibits a circular double-stranded structure (120–160 kb) with conserved gene arrangements, including photosynthesis-related genes (e.g., psbA and rbcL), transcription–translation machinery (e.g., rRNA and tRNA), and metabolic genes. Structural variations, such as expansions/contractions of inverted repeat (IR) regions, drive genome size diversity (Lin et al., 2024). The organellar genomes, owing to maternal inheritance (with rare exceptions), moderate evolutionary rates, and strong selective constraints on functional genes serve as invaluable tools for phylogenetic reconstruction, population genetics, and molecular marker development (Hao et al., 2024b). For example, novel molecular markers were developed by screening hypervariable regions from chloroplast genomes of four artificial Taxodium hybrids, accelerating breeding programs in this genus (Yue et al., 2023). Chloroplast genomics of seven Panax species enabled the development of 18 coding sequence (CDS)-derived species-specific Single Nucleic Polymorphism (SNP) markers for precise identification and cultivar authentication (Nguyen et al., 2020). Three hypervariable regions (petA–psbJ, ndhF–rpl32, and ycf1) were validated as candidate markers for distinguishing Arnebiae Radix and its substitutes (Wang et al., 2025). Molecular markers, including Amplified Fragment Length Polymorphism (AFLPs), Simple Sequence Repeats (SSRs), and Random Amplified Polymorphic DNA separately (RAPDs), and subsequently converted Sequence Characterized Amplified Region (SCARs), have been developed to differentiate the sex of C. papaya (Somsri et al., 1997; Deputy et al., 2002; Vashistha et al., 2016; Bui et al., 2024). To characterize the genetic diversity of species under the family Caricaceae, molecular markers were employed, which eventually resulted in the relocation of several members and the founding of the genus Vasconcellea (Kanchana-udomkan et al., 2014). The genetic polymorphism among different papaya varieties was revealed by a genome-wide SSR atlas (Vidal et al., 2014). Regional papaya cultivars in Sri Lanka were investigated for genetic diversity using SSR and Inter Simple Sequence Repeat (ISSR) markers (Warnakula et al., 2017). The practical molecular marker for distinguishing different cultivars remains unavailable. Chloroplast genomes, with their maternal inheritance, structural conservation, and balanced mutation rates, offer unique advantages for species identification and studies of adaptive evolution. Although recent advances highlight their role in identifying markers (Zheng et al., 2025), research on Carica cpDNAs remains scarce. These knowledge gaps impede the development of molecular markers for breeding.
This study aims to address the limitations of SSR and ISSR markers in discriminating different papaya cultivars by analyzing chloroplast genomes of 17 Carica varieties and cultivars. Our objectives are twofold: 1) to characterize the structural conservation and adaptive evolution of Carica cpDNAs and 2) to identify hypervariable regions associated with variety identification for marker development. The findings will facilitate marker-assisted selection, support intellectual property protection in breeding, and shed light on the evolutionary theories of Carica chloroplast genomes, bridging critical gaps between genomic insights and practical breeding applications.
2 Result
2.1 Assembly and annotation of chloroplast genomes
The Illumina HiSeq 2000 platform generated sequence data files totaling 4,963,041,000 to 6,473,551,500 bases per sequenced C. papaya genome. Through chloroplast genome assembly of sequencing data, we obtained circular chloroplast genomes for all 17 Carica species, as shown in Figure 1.
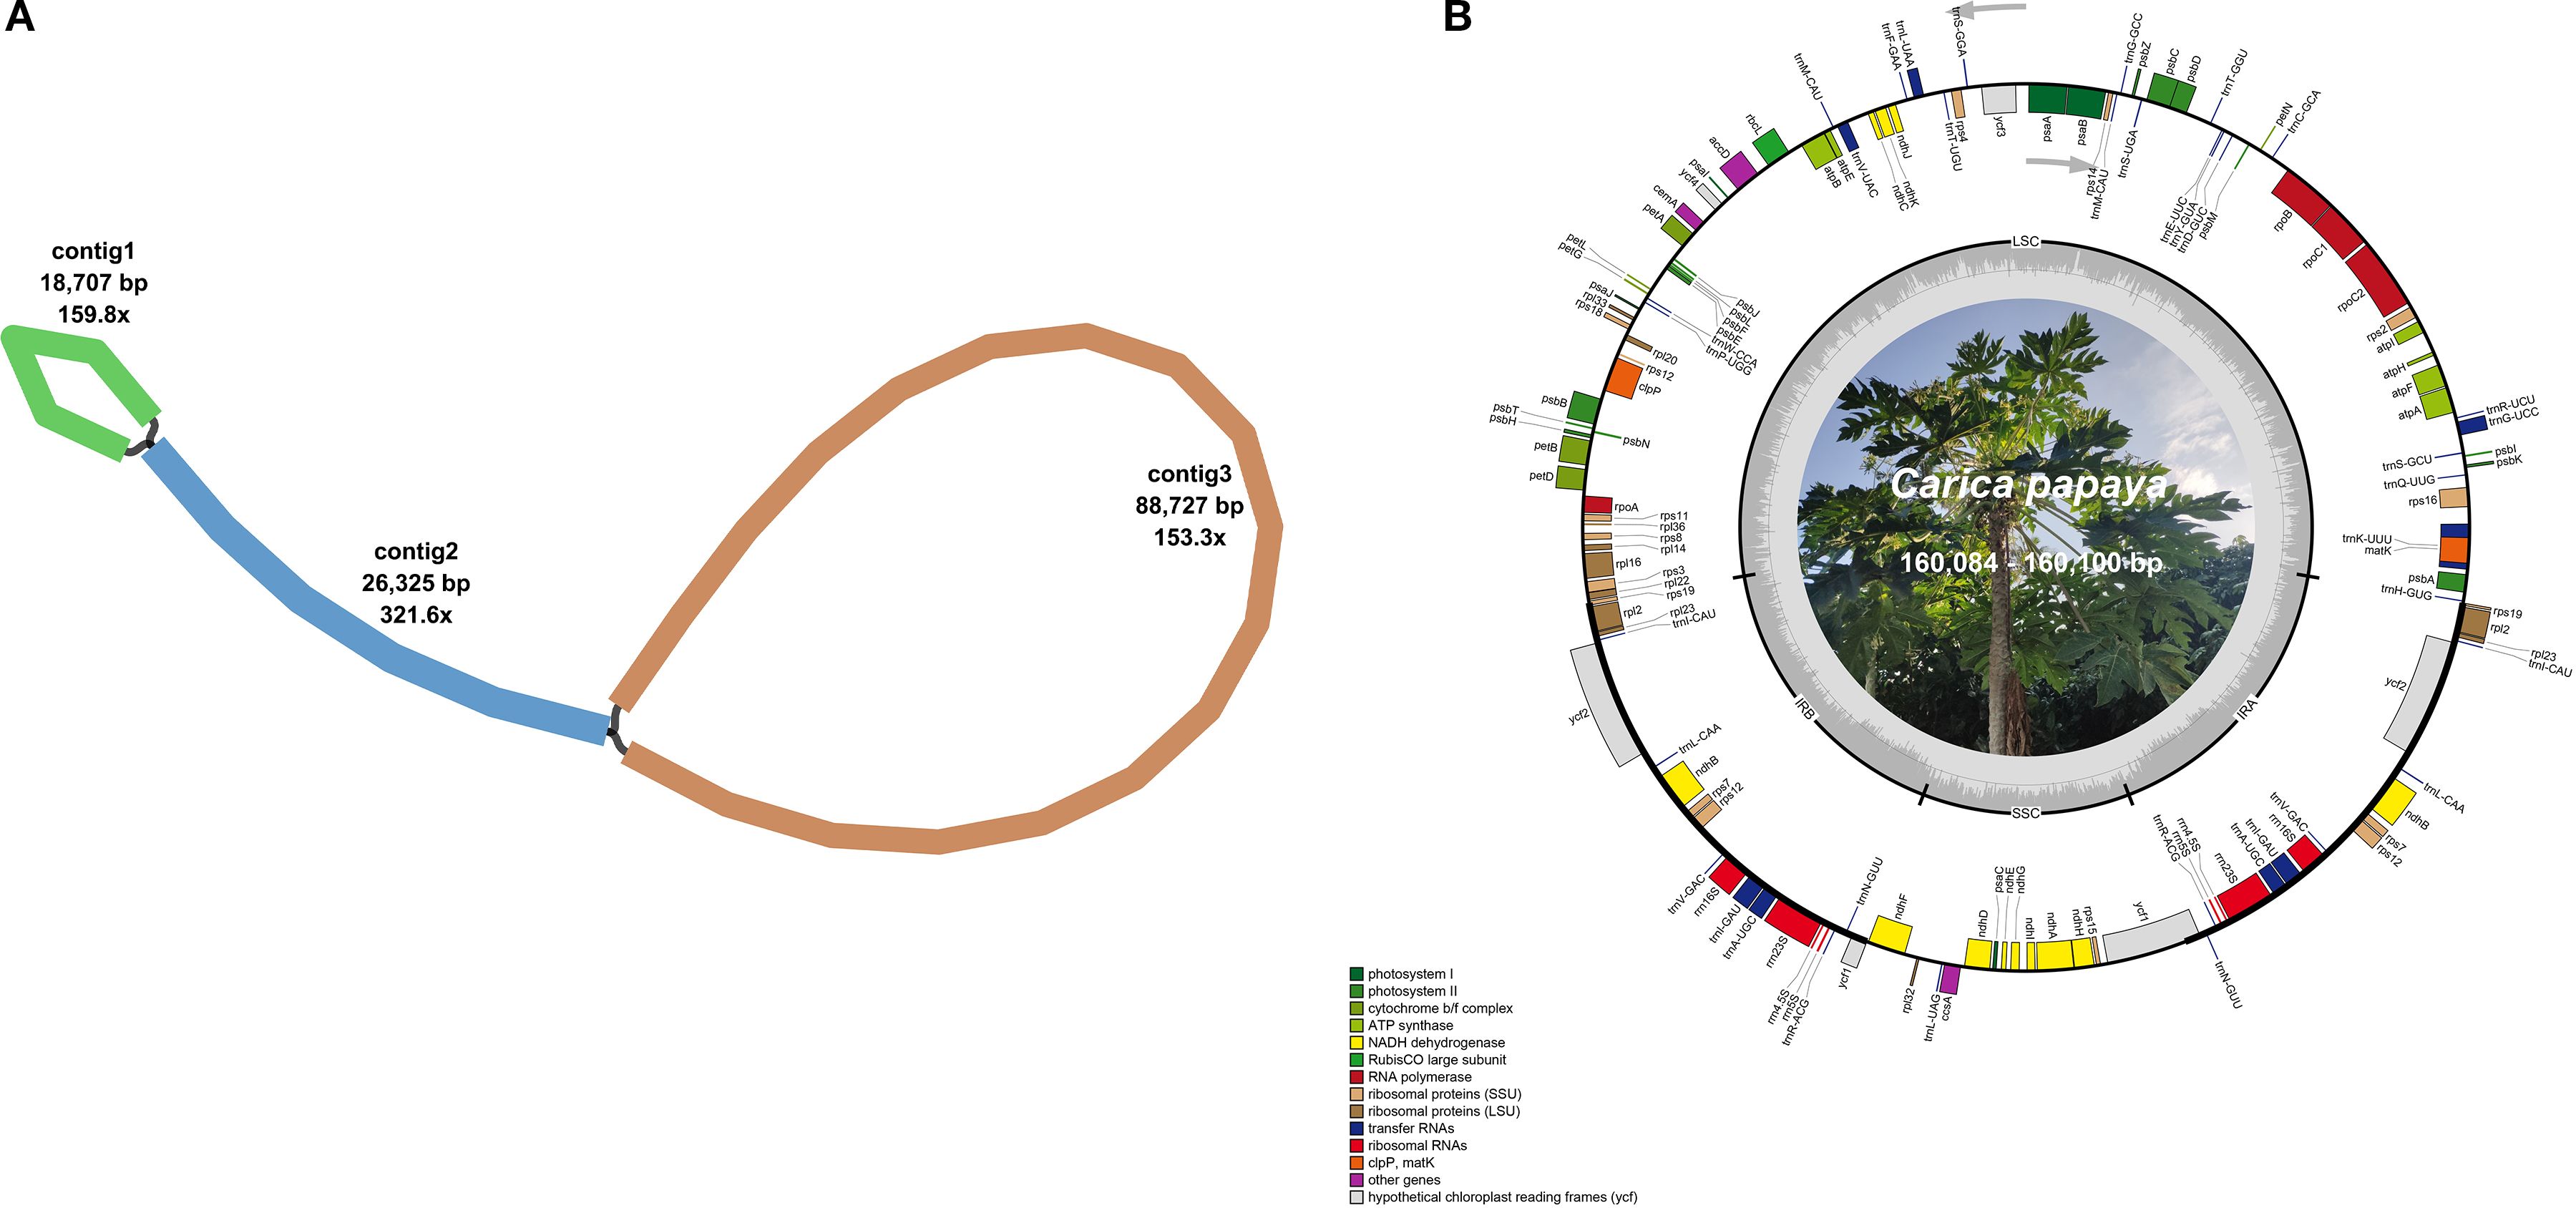
Figure 1. The graphic assembly and chloroplast genome maps of 17 Carica accessions. (A) The graphic plastomes consist of three contigs of different lengths, and they are connected to each other. The lengths of the three contigs are 18,707, 26,325, and 88,727 bp. Contig 2 is the repetitive sequence. (B) The genome map of the Carica plastomes. The figure shows the master circle of the Carica plastomes.
Based on sequence analysis, these papaya accessions were classified into two distinct types: Type 1 (160,084 bp; Guanine and Cytosine (GC) 36.89%), comprising eight accessions with identical sequences, and Type 2 (160,100 bp; GC 36.89%), represented by nine accessions exhibiting full sequence identity (Table 1). The chloroplast genomes of these 17 Carica accessions exhibited a conserved circular structure, annotated with 78 unique protein-coding genes (eight multi-copy), 29 tRNA genes (eight multi-copy), and four rRNA genes (all multi-copy). Protein-coding genes were classified into 15 functional families (Table 2). Although both chloroplast genome types exhibited conserved lengths and GC content within their respective groups, no differences were observed in gene content or copy numbers.
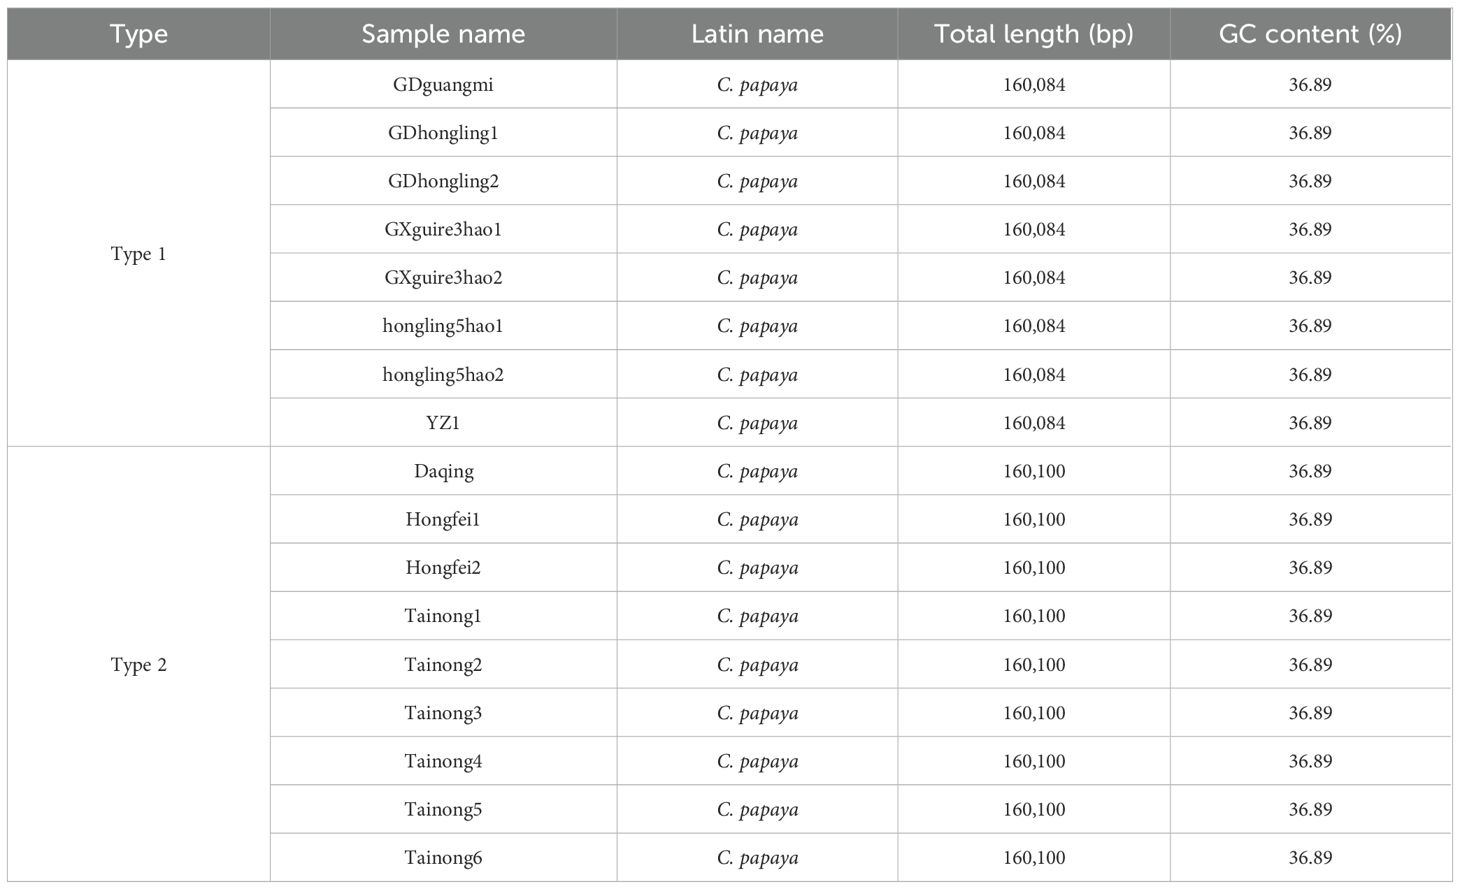
Table 1. Chloroplast genome architectures of two papaya types (Carica papaya).
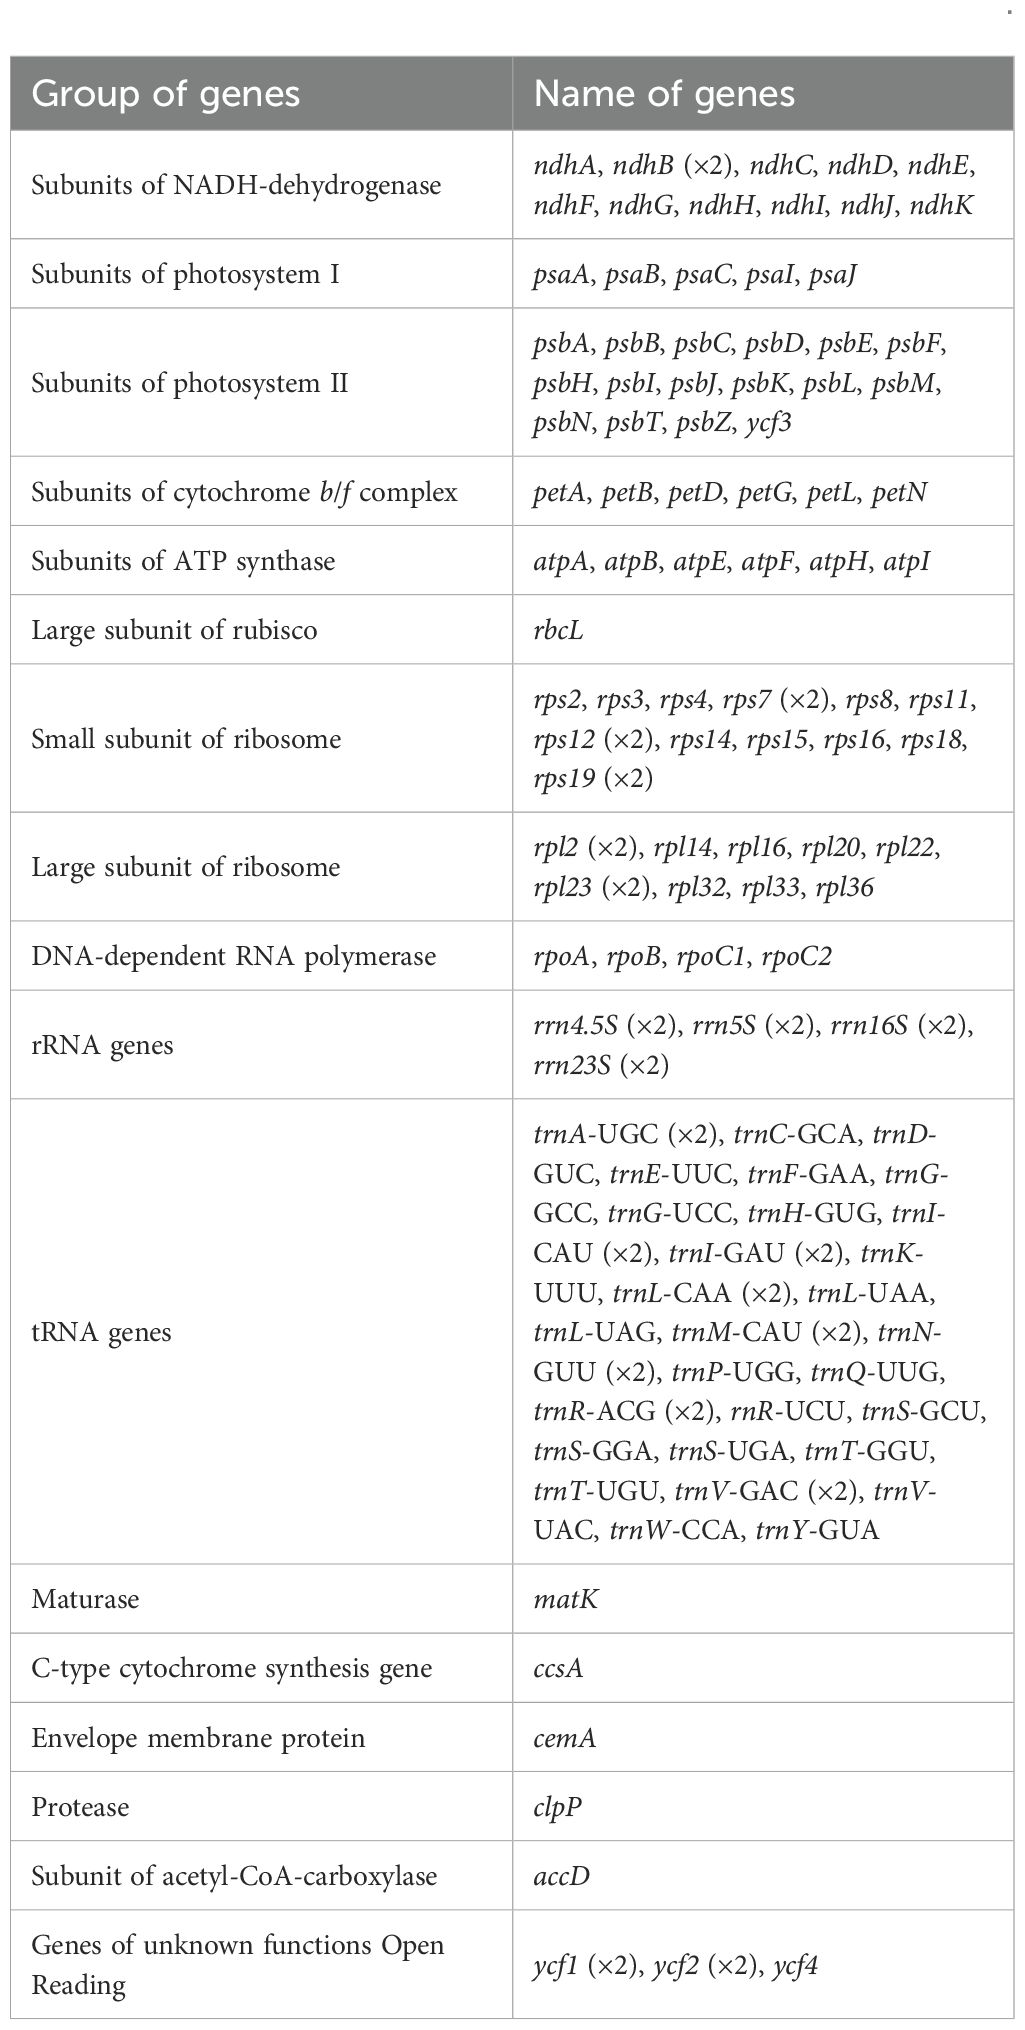
Table 2. Gene composition in the chloroplast genome of Carica papaya.
2.2 Codon usage bias
Codon usage bias analysis was performed on 78 unique protein-coding genes (PCGs) from the chloroplast genomes of two types of C. papaya varieties. The usage patterns of synonymous codons for each amino acid are detailed in Supplementary Table S1. Codon preference was assessed using the Relative Synonymous Codon Usage (RSCU) value. Codons with an RSCU value greater than 1.00 were considered preferentially used by their corresponding amino acid.
As illustrated in Figure 2, the majority of chloroplast PCGs exhibited widespread codon usage bias. The notable exceptions were the start codon (AUG, encoding methionine) and the codon for tryptophan (UGG), both of which consistently showed an RSCU value of exactly 1.00. This is expected, as each has only a single synonymous codon. A striking example of strong codon preference was observed for the amino acid leucine (Leu). In both types of chloroplast genomes, Leu showed an extremely high preference for the codon UUA. This codon consistently achieved the highest RSCU value across all analyzed PCGs, reaching 1.98 in both chloroplast types. This represents a 5.2-fold preference over the least-used synonymous codons CUG and CUC (RSCU = 0.36–0.38), indicating strong selection for AT-rich codons compatible with the chloroplast's low GC content (36.89%). The identical bias pattern in both chloroplast types underscores the evolutionary conservation of translational optimization mechanisms.
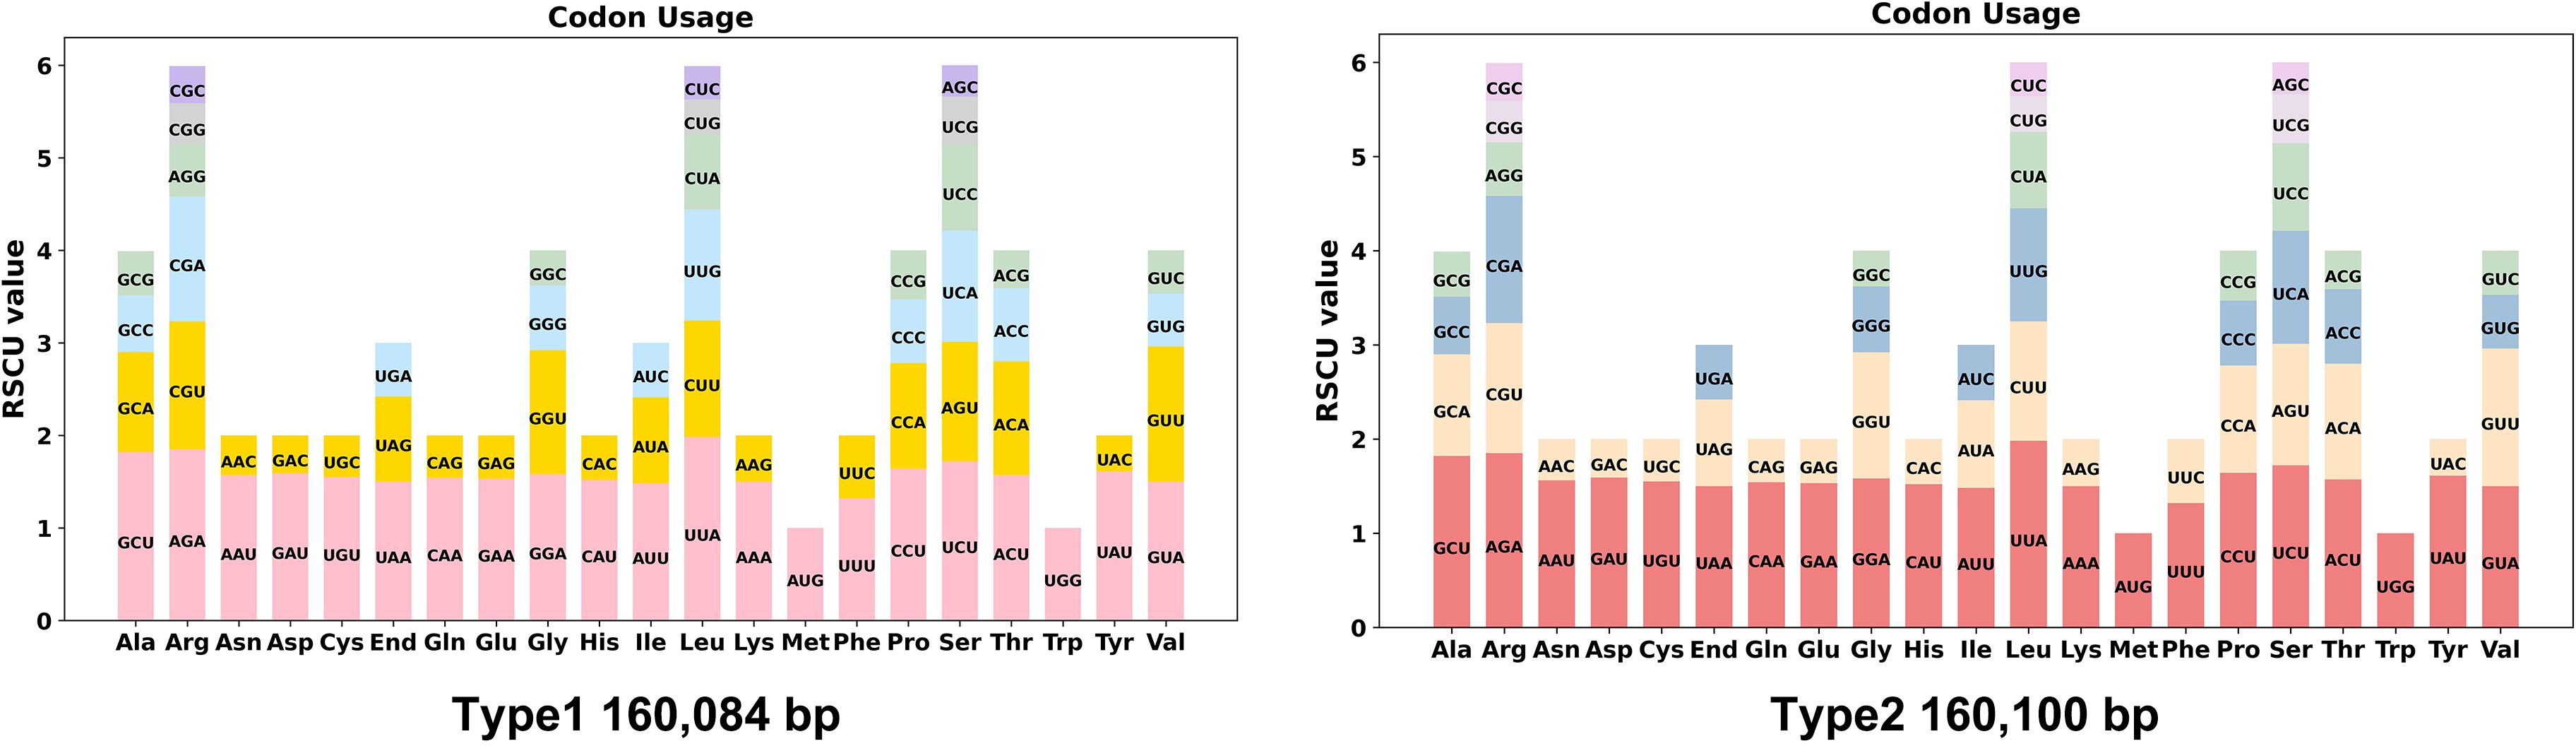
Figure 2. Codon preference analysis of two types of chloroplast genomes. Codon families are shown on the x-axis. RSCU values are the number of times a particular codon is observed relative to the number of times that codon would be expected for uniform synonymous codon usage. RSCU, Relative Synonymous Codon Usage.
2.3 Repeat sequence analysis
Comparative analysis revealed 99 and 103 SSRs in Type 1 and Type 2 chloroplast genomes, respectively. Both genomes exhibited similar distributions: monomeric and dimeric SSRs dominated (68.69% in Type 1 and 68.93% in Type 2), with thymine (T) monomers being the most prevalent (54.55% of Type 1 monomers and 56.90% in Type 2). Only one hexameric SSR was detected per genome. Tandem repeat analysis identified 61 repeats in Type 1 and 59 in Type 2, confirming conserved genomic architecture between types (Figure 3A, Supplementary Table S2).
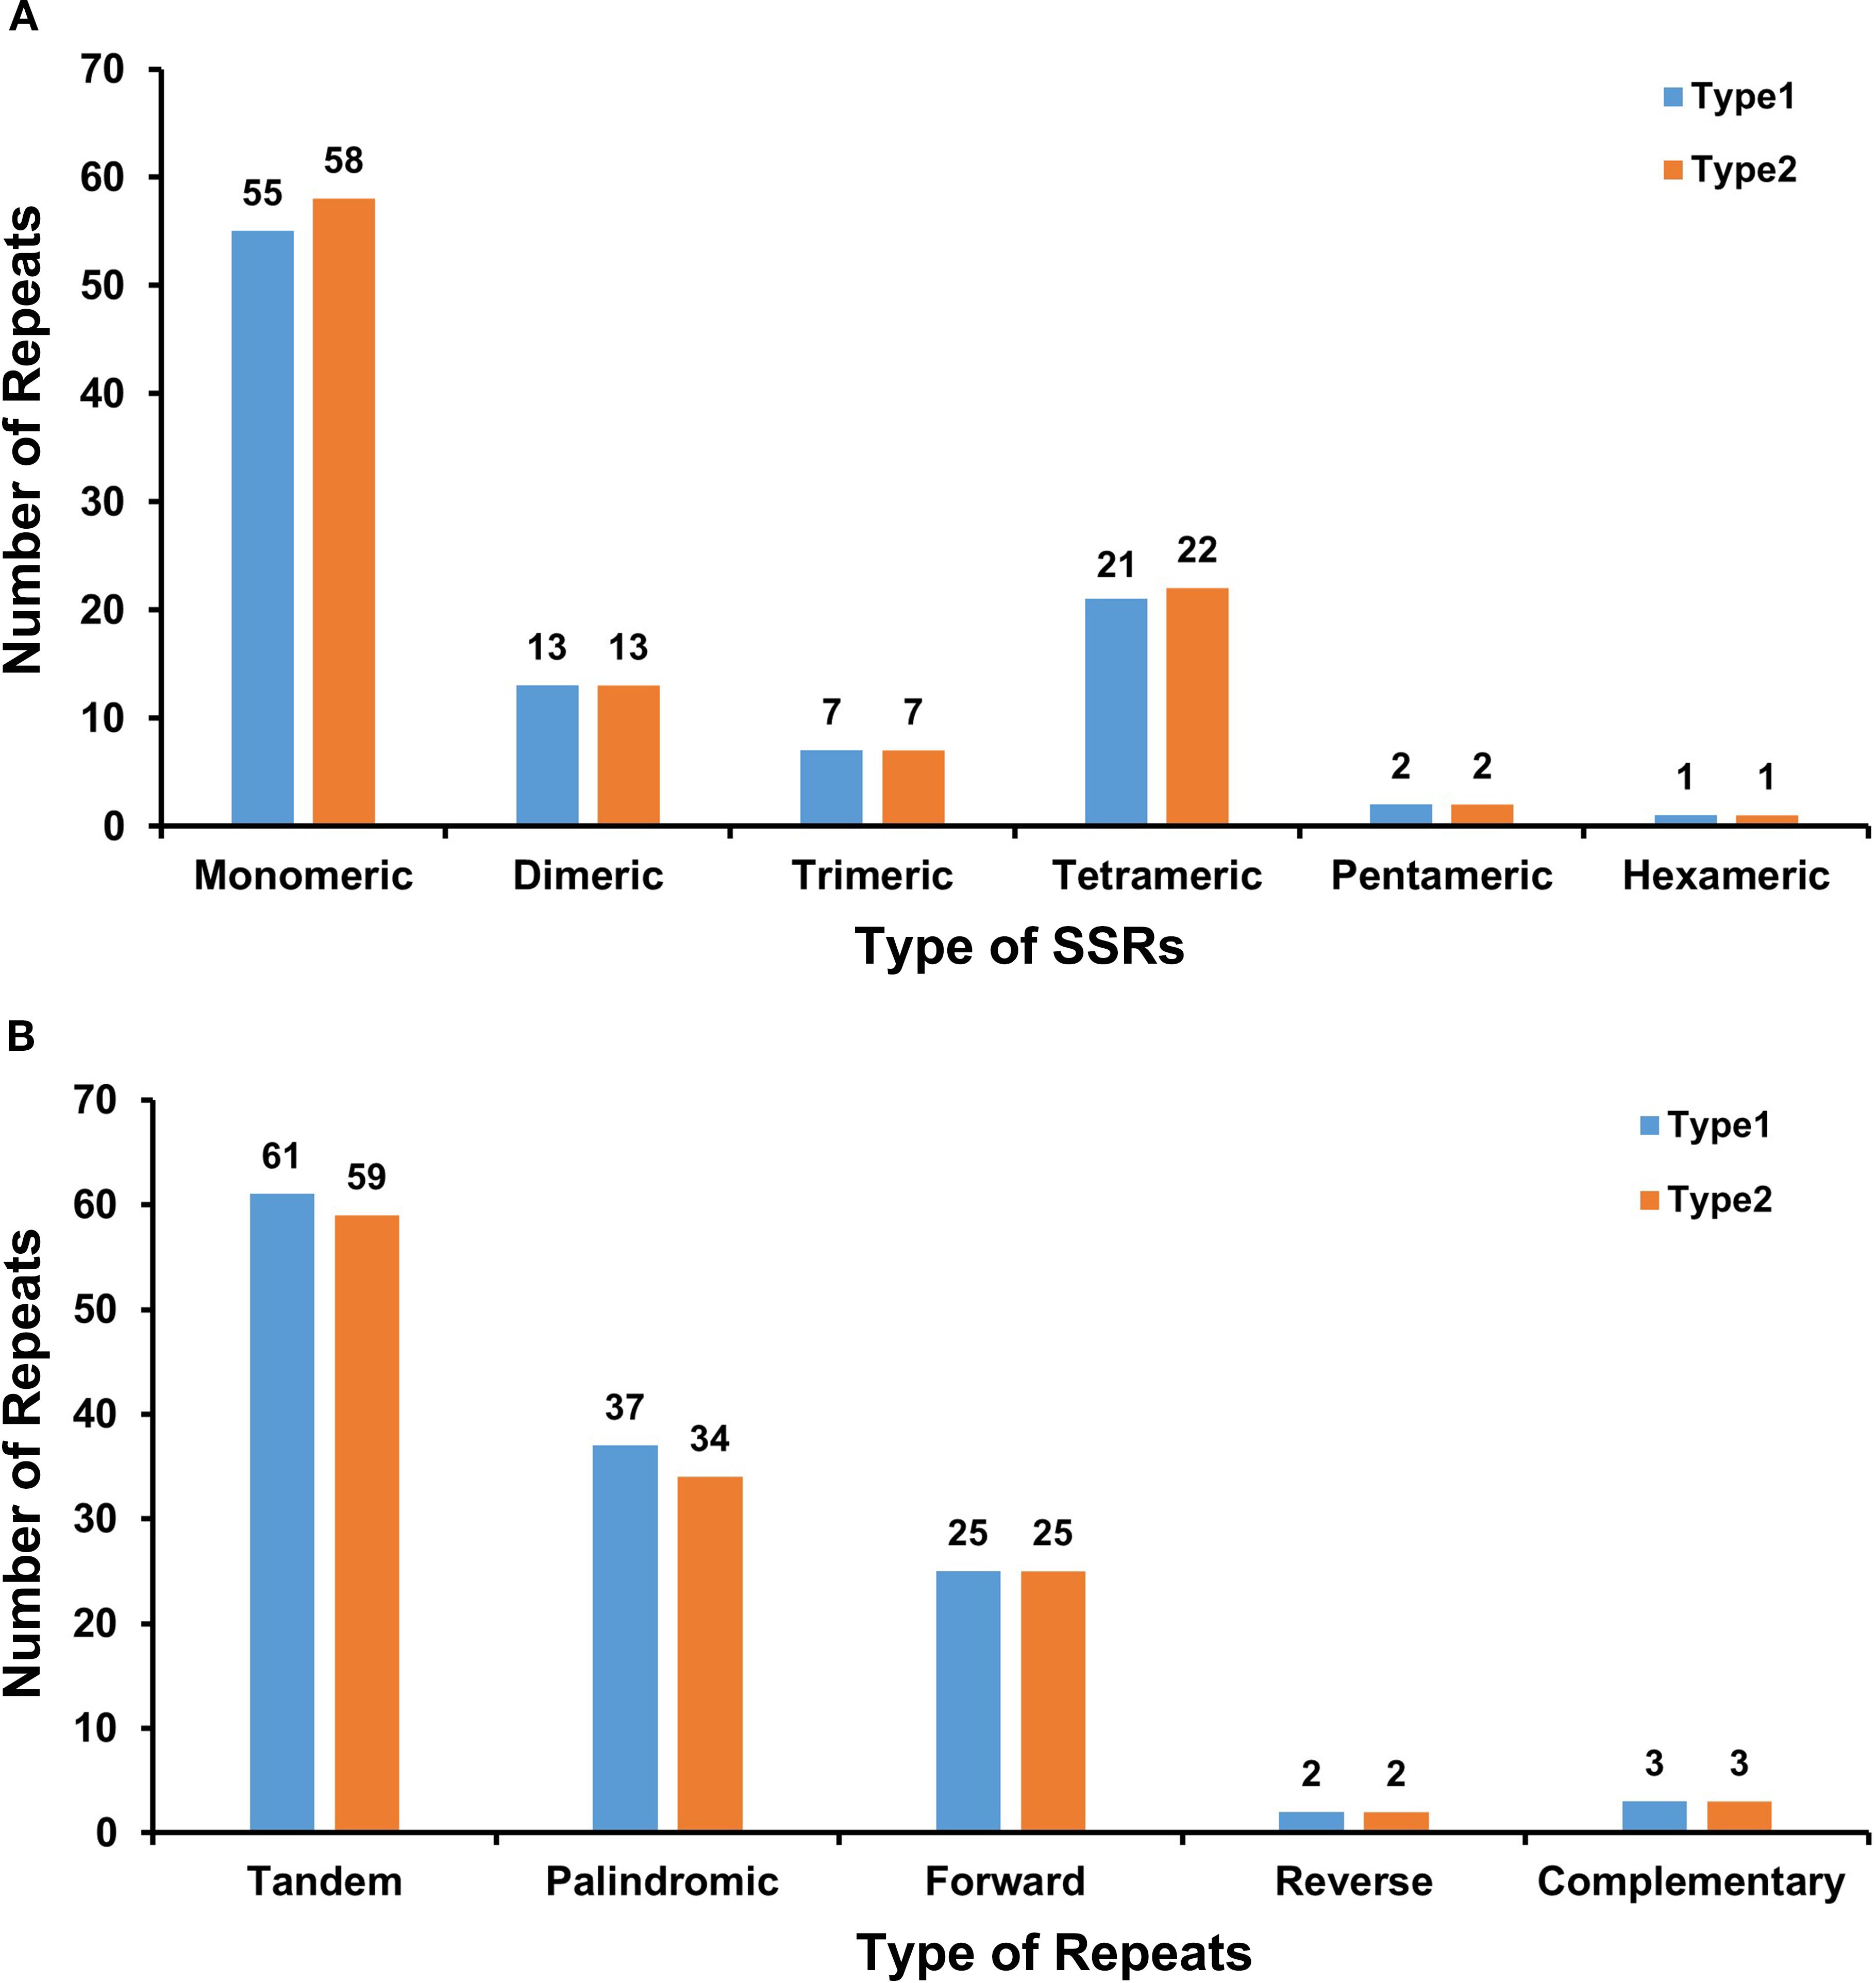
Figure 3. Comparative analysis of repeat sequences in two chloroplast genome types. (A) The number of SSRs of each type, with monomeric being the most and hexameric being the least. X-axis, SSR types; Y-axis, number of repeat units. Colors: Type 1 (blue), Type 2 (orange), and Type 3 (yellow). (B) The identified dispersed repeats (≥30 bp). X-axis, repeat sequence types; Y-axis, number of repeat elements. The green ribbons represent the forward repeats, the yellow ribbons represent the palindromic repeats, the red ribbons represent the complementary repeats, and the blue ribbons represent the reverse repeats. The detailed information about dispersed repeats can be found in Supplementary Table S2.
Dispersed repeats ≥30 bp showed parallel patterns: Type 1 contained 67 repeat pairs (37 palindromic, 25 forward, 2 reverse, and 3 complementary), while Type 2 had 64 pairs (34 palindromic, 25 forward, 2 reverse, and 3 complementary). Both genomes shared identical maximum lengths for key repeats—26,325 bp for palindromic and 60 bp for forward repeats—indicating structural conservation at repeat boundaries (Figure 3B, Supplementary Tables S3, S4).
2.4 Phylogenetic analysis
A maximum likelihood phylogenetic tree was constructed based on the complete chloroplast genomes and 78 shared protein-coding genes using two Vasconcellea species (Vasconcellea carvalhoae and Vasconcellea cundinamarcensis) as outgroups. The resulting topology, presented in Figure 4, is consistent with the Angiosperm Phylogeny Group (APG) classification and clearly resolves two major clades. However, the topology of the ITS tree showed incongruence with the chloroplast tree (Supplementary Figure S3).
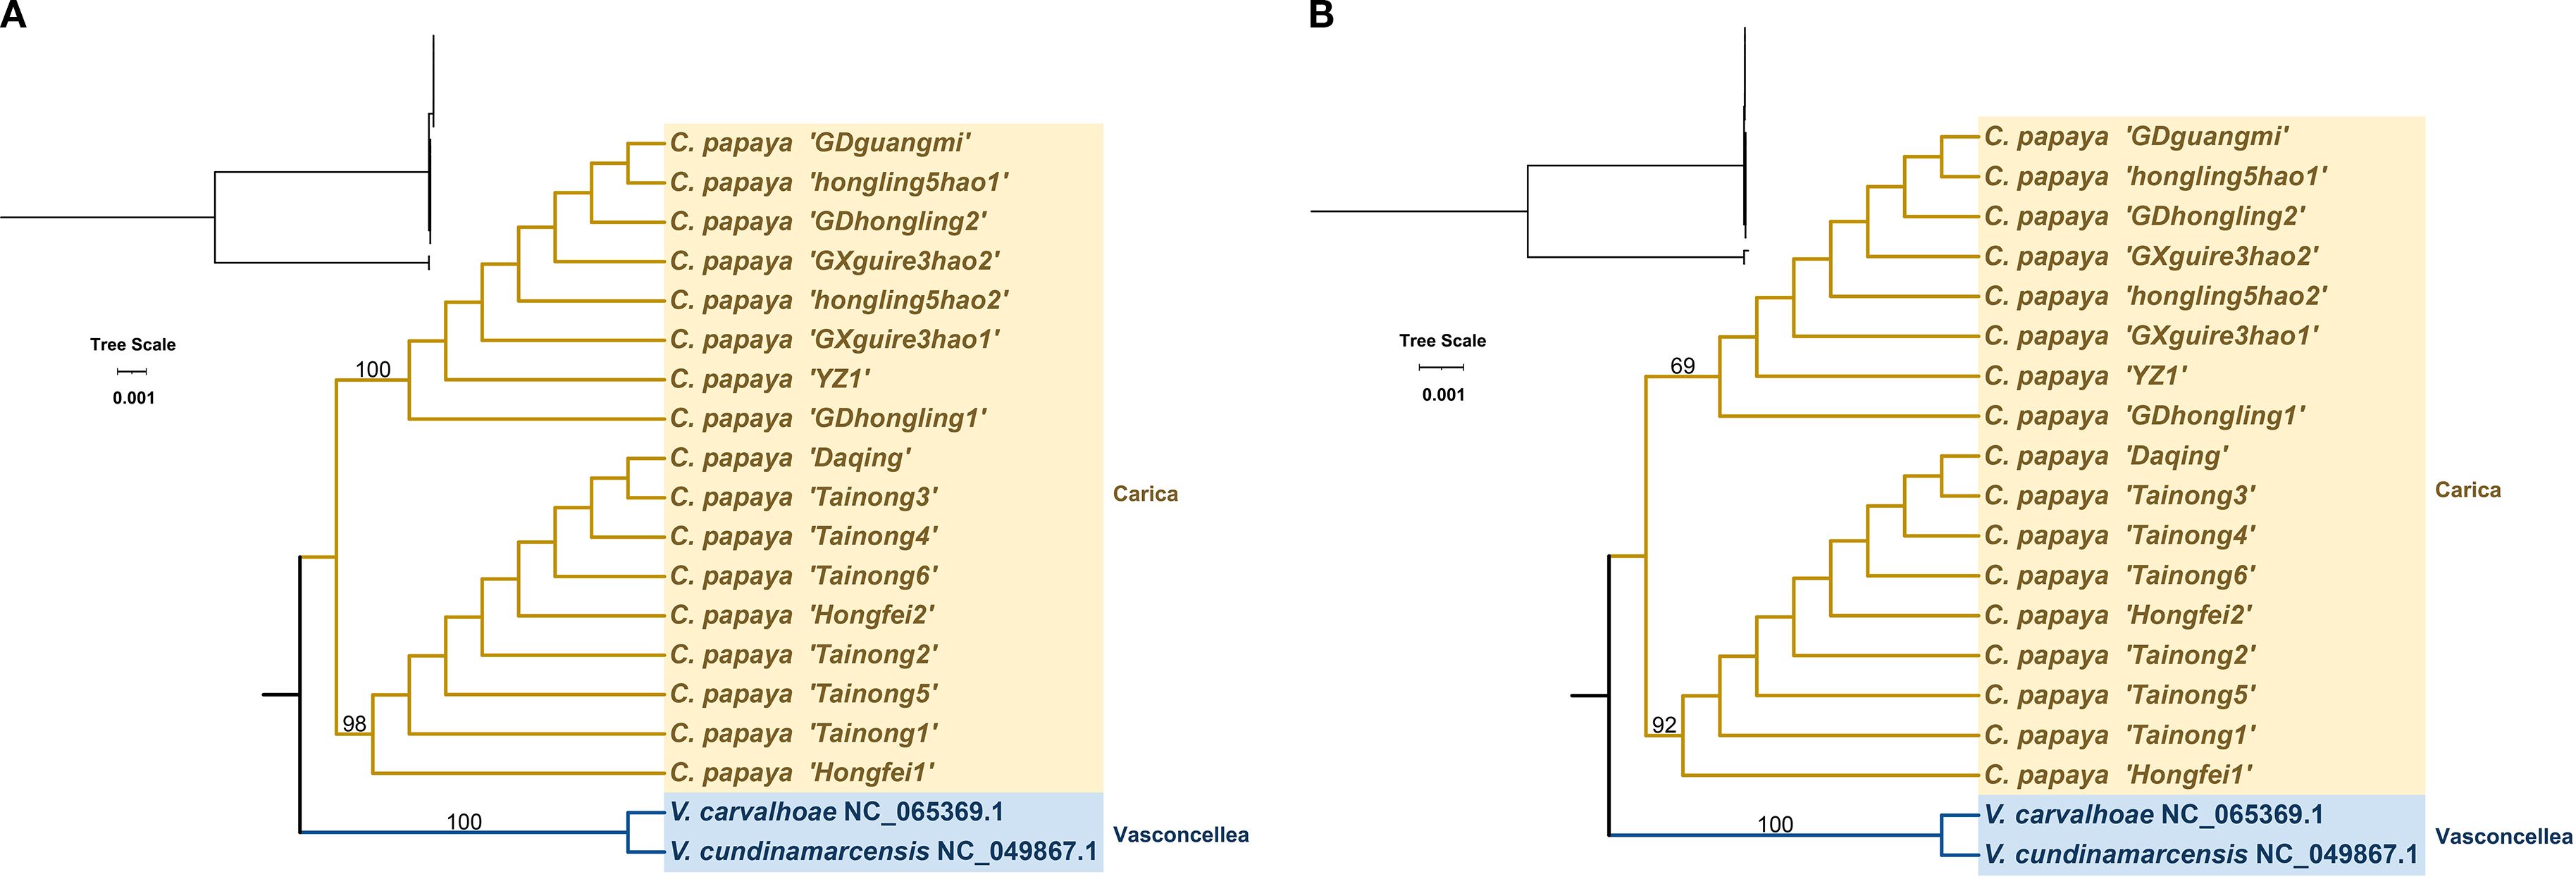
Figure 4. Phylogenetic trees of Carica papaya cultivars and related species based on complete chloroplast genome sequences (A) and conserved protein-coding sequences (CDS) (B). Vasconcelles species were used as outgroups.
Type 1 includes eight accessions (GDguangmi, GDhongling1, GDhongling2, GXguire3hao1, GXguire3hao2, hongling5hao1, hongling5hao2, and YZ1) with identical chloroplast genomes. These genomes are 160,084 bp in length and have a GC content of 36.89%. Type 2 comprises nine accessions (Daqing, Hongfei1, Hongfei2, Tainong1, Tainong2, Tainong3, Tainong4, Tainong5, and Tainong6), which also share identical chloroplast sequences. These genomes are slightly longer at 160,100 bp, with the same GC content of 36.89%.
2.5 IR region expansion/contraction analysis
The chloroplast genomes of Carica varieties exhibited four IR–Single Copy (SC) boundaries (LSC-IRb, IRb-SSC, SSC-IRa, and IRa-LSC). Comparative analysis identified seven genes (rpl22, rps19, rpl2, ycf1, ndhF, trnH, and psbA) spanning or adjacent to IR–SC boundaries. Interestingly, rps19 and ycf1 showed conserved boundary-spanning structures across all 17 varieties. While IR lengths remained invariant (26,325 bp), minor variations in large single-copy (LSC)/small single-copy (SSC) lengths were observed among cultivars (Figure 5, Table 3). The 16-bp expansion of the IR region in Type 2 chloroplast genomes specifically resulted from ycf1 extension into IRb (penetrating 15 bp deeper than in Type 1), while rps19 uniformly expanded 8 bp into the LSC across all varieties. Critically, all cultivars within Type 1 (n = 8) and Type 2 (n = 9) exhibited identical IR boundaries, confirming the strict evolutionary conservation of inverted repeat architecture within each lineage.
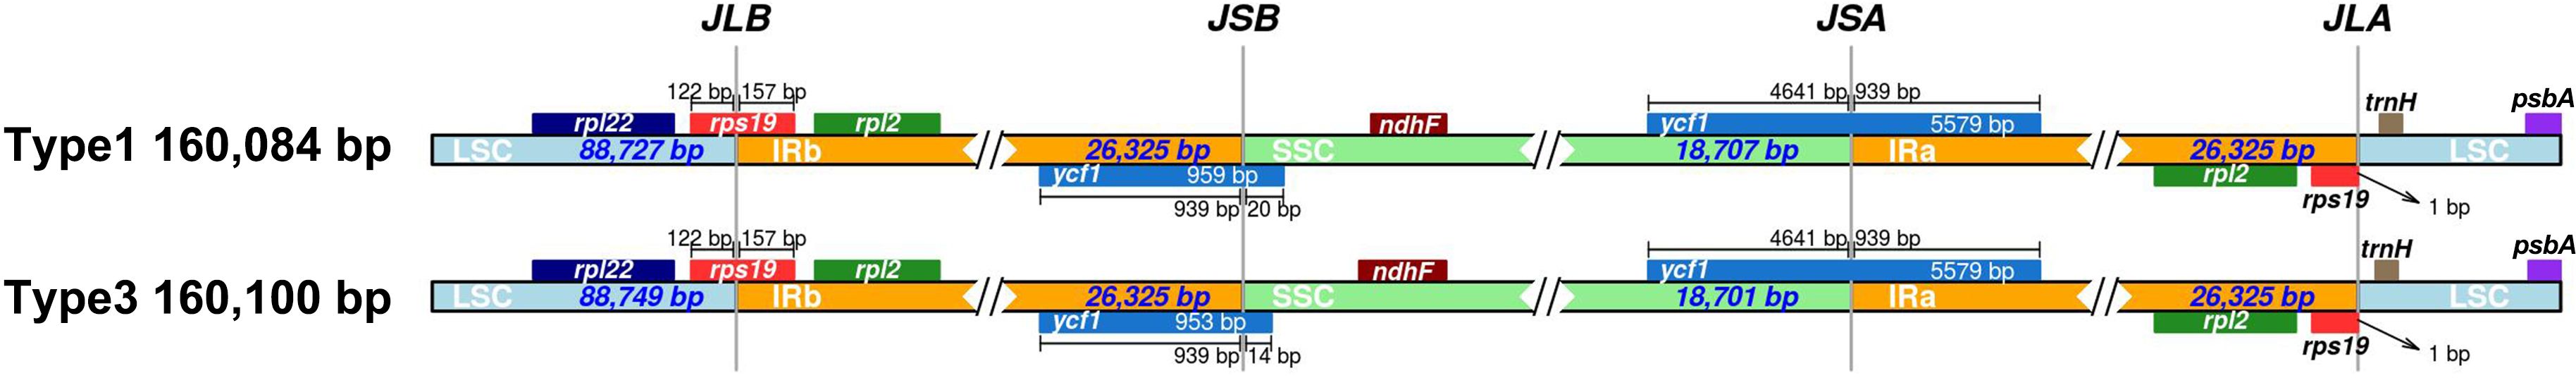
Figure 5. LSC/SSC/IR junction comparisons across two papaya types. Genes located near the boundaries are shown above or below the main line. JLB, JSB, JSA, and JLA denote the junctions of LSC/IRb, IRb/SSC, SSC/IRa, and IRa/LSC, respectively. JLB, junction of LSC/IRb (large single copy/inverted repeat b). JSB, junction of IRb/SSC (inverted repeat b/small single copy). JSA, junction of SSC/IRa (small single copy/inverted repeat a). JLA, junction of IRa/LSC (inverted repeat a/large single copy). LSC, large single-copy region. SSC, small single-copy region. Ira and IRb, inverted repeat regions a and b (the two copies of the repeat sequence in the chloroplast genome).
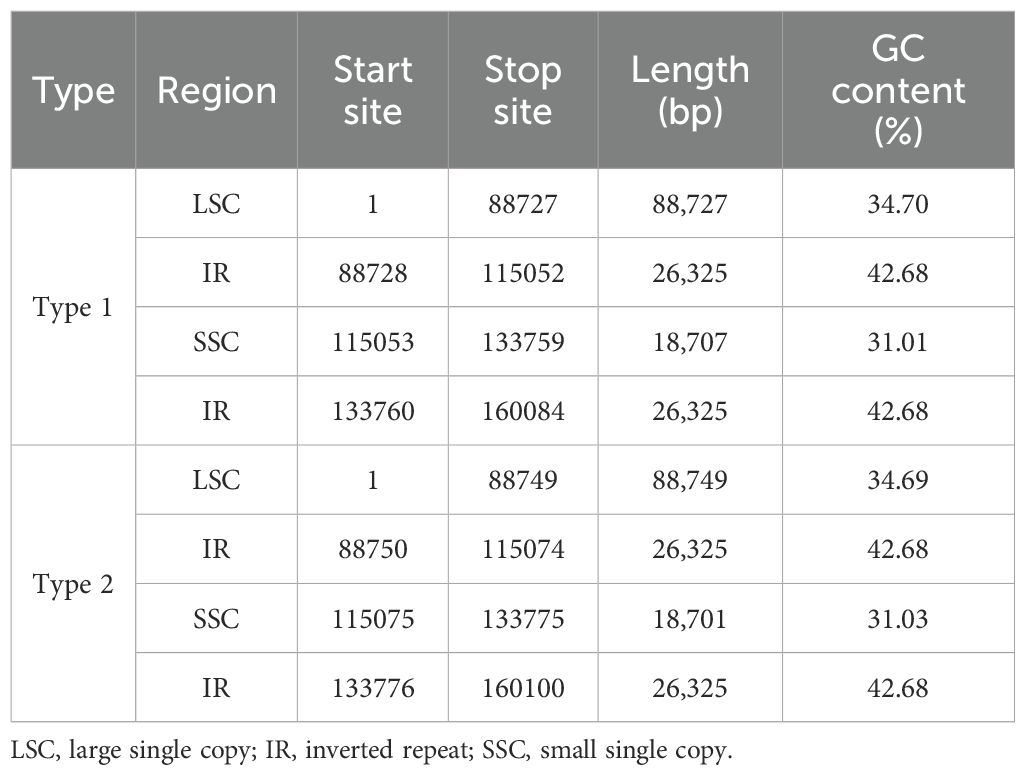
Table 3. Genomic characteristics of two papaya chloroplast types.
2.6 Nucleotide diversity (Pi) analysis
Sliding window analysis (window, 400 bp; step, 200 bp) using DnaSP v6.0 identified four hypervariable regions (ccsA–ndhD, ndhD, psbC, and ycf1; Pi > 0.002), highlighting the overall conservatism of Carica chloroplast genomes. LSC and SSC regions exhibited higher Pi values than IRs.
Genome-wide nucleotide diversity analysis across 17 Carica chloroplast genomes revealed pronounced regional heterogeneity in polymorphism distribution. The IR regions exhibited absolute conservation, while the LSC region showed moderate variation. Strikingly, the SSC compartment demonstrated substantial diversity. Four hypervariable regions (ccsA–ndhD, ndhD, psaC, and ycf1; Pi > 0.002) were exclusively localized within the SSC region.
Among the identified hypervariable zones, the ccsA–ndhD intergenic spacer (IGS) displayed peak polymorphism (Pi = 0.01324), representing the most divergent non-coding region. Protein-coding genes ycf1, psaC, and ndhD (Pi = 0.00397) contained significant genic variations. These regions collectively constitute the primary mutation hotspots driving interspecific differentiation. mVISTA alignment confirmed greater sequence divergence in non-coding regions, with IRs showing >99% similarity (Figure 6, Supplementary Table S5).
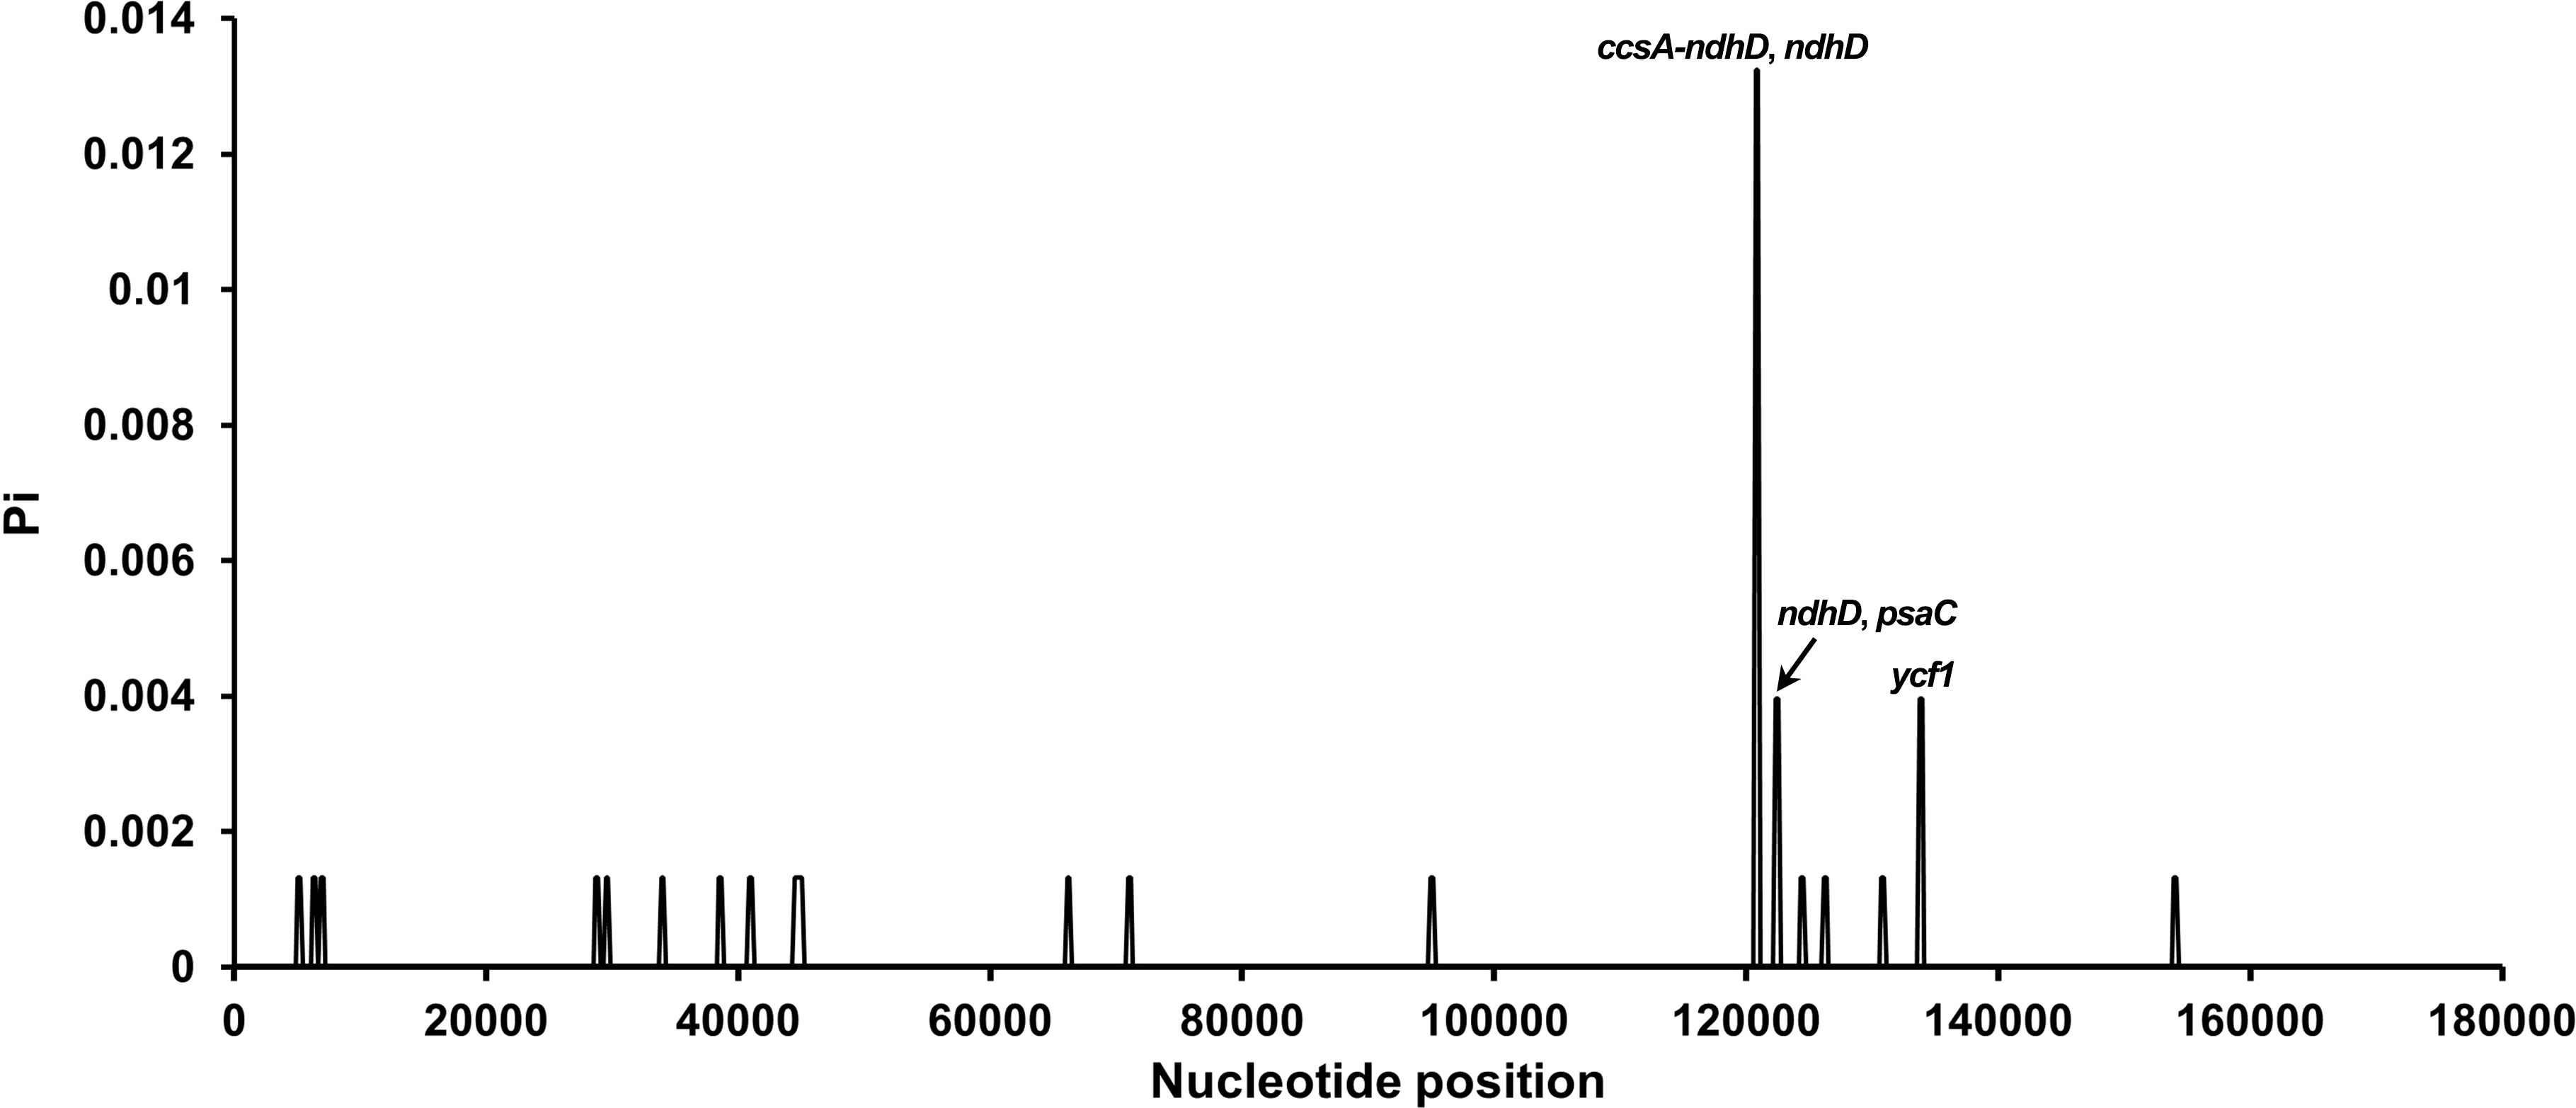
Figure 6. Sliding window analysis of nucleotide diversity (Pi) in 17 Carica chloroplast genomes. Each point represents nucleotide diversity calculated per 400-bp window. Peaks of diversity are annotated with corresponding gene names: ccsA–ndhD and ndhD, ndhD and psaC, and ycf1.
2.7 Synteny analysis
Whole-genome alignments using Mauve v2.4.0 demonstrated near-perfect structural conservation across 17 Carica chloroplast genomes, with identical gene order preserved in all LSC, IR, and SSC regions and no detectable inversions, translocations, or large InDels. The sole structural variation was a 16-bp Type 2-specific expansion at the IRb/SSC boundary. Phylogenetic congruence between synteny patterns and maximum likelihood trees underscores structural stability as a hallmark of chloroplast evolution in Caricaceae, with micro-variations at junctional regions providing molecular footprints of domestication history (Figure 7, Supplementary Figure S3).
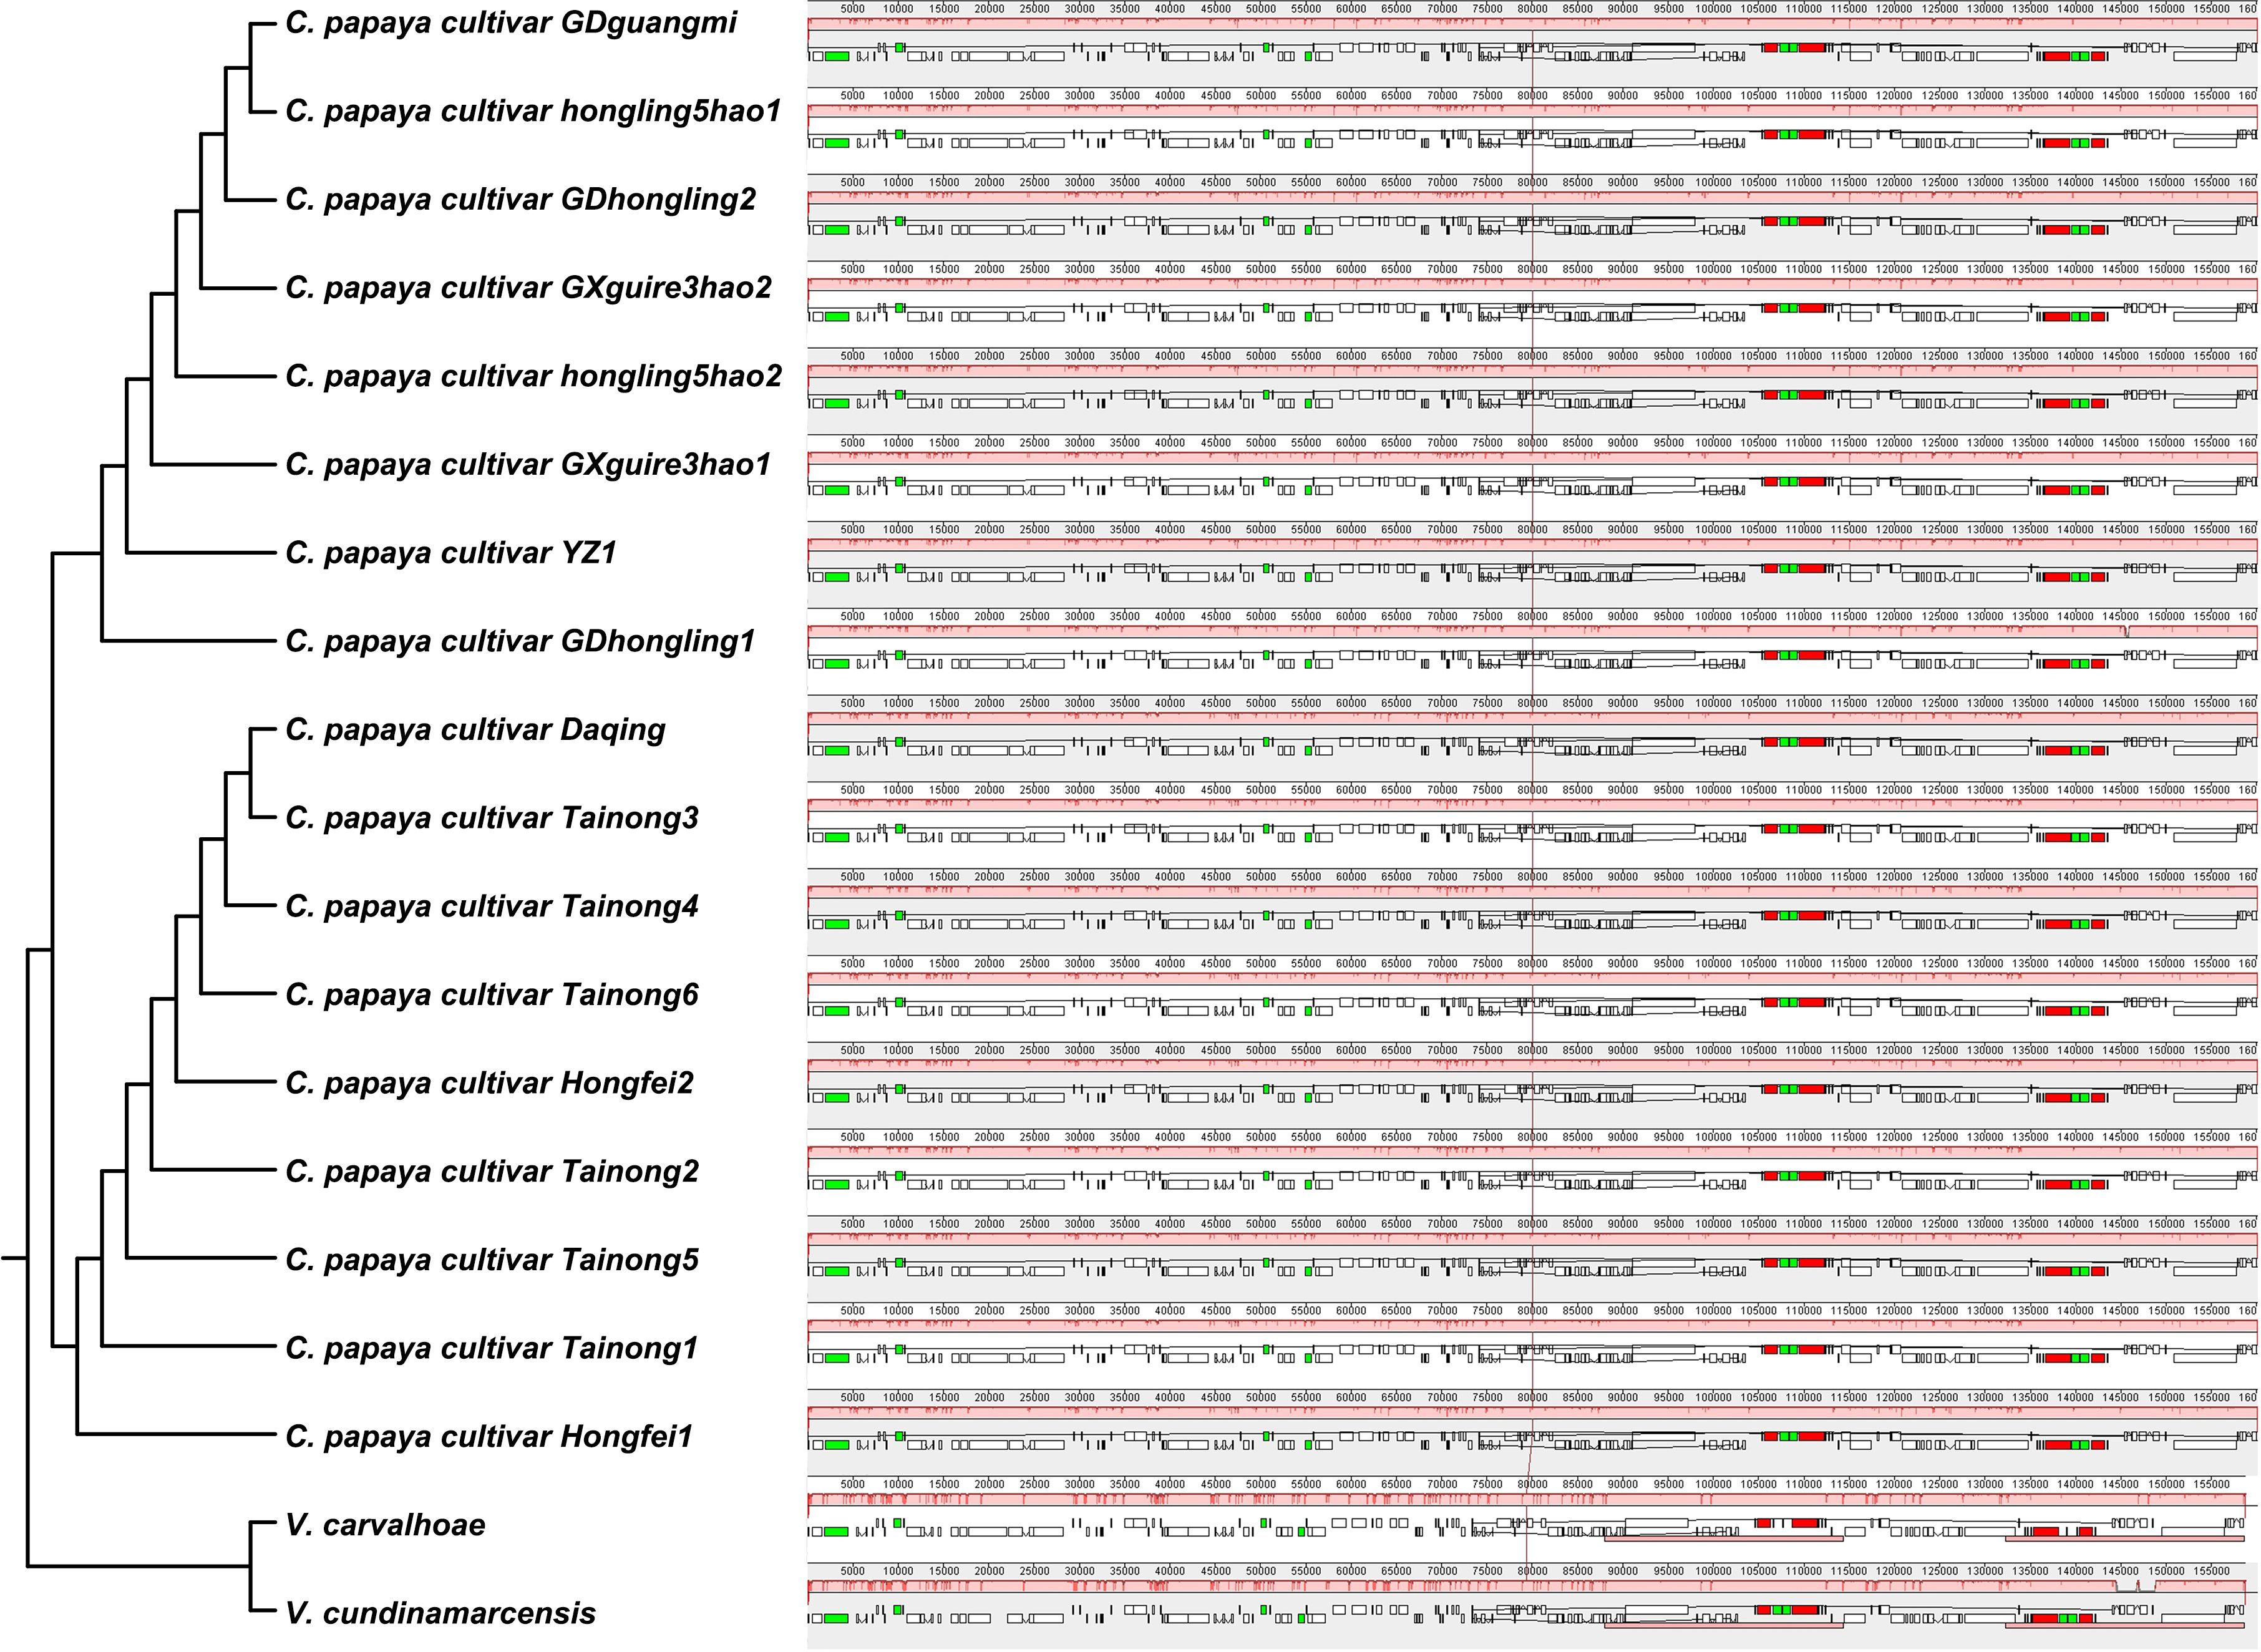
Figure 7. Whole-genome alignments of two chloroplast types (Mauve). The colorful bars indicate the mitogenomes, and the ribbons show the homologous sequences between the adjacent varieties. The blue ribbons indicate regions with homology, and the red ribbons indicate where the inversion occurred. The homologous blocks less than 0.5 kb in length are not retained, and regions that fail to have a homologous block indicate that they are unique to the varieties.
2.8 Molecular marker development
Hypervariable non-coding regions (trnG–trnR, rbcL–accD, and rpl12–rps19) were prioritized for marker design. Three primer pairs were synthesized based on the left and right flanks of InDels and tested by PCR amplification on YZ1, Tainong, and Daqing (Supplementary Table S6). Specific fragments were successfully amplified by the following primer pairs: CPP-2F + CPP-2R and CPP-4F + CPP-4R. As expected, the sizes of specific PCR products were between 100 and 500 bp (Figure 8A). Three InDels discovered above were confirmed by Sanger sequencing of the PCR product, enabling the discrimination of hybrid cultivars undetectable by morphology (Figure 8B).
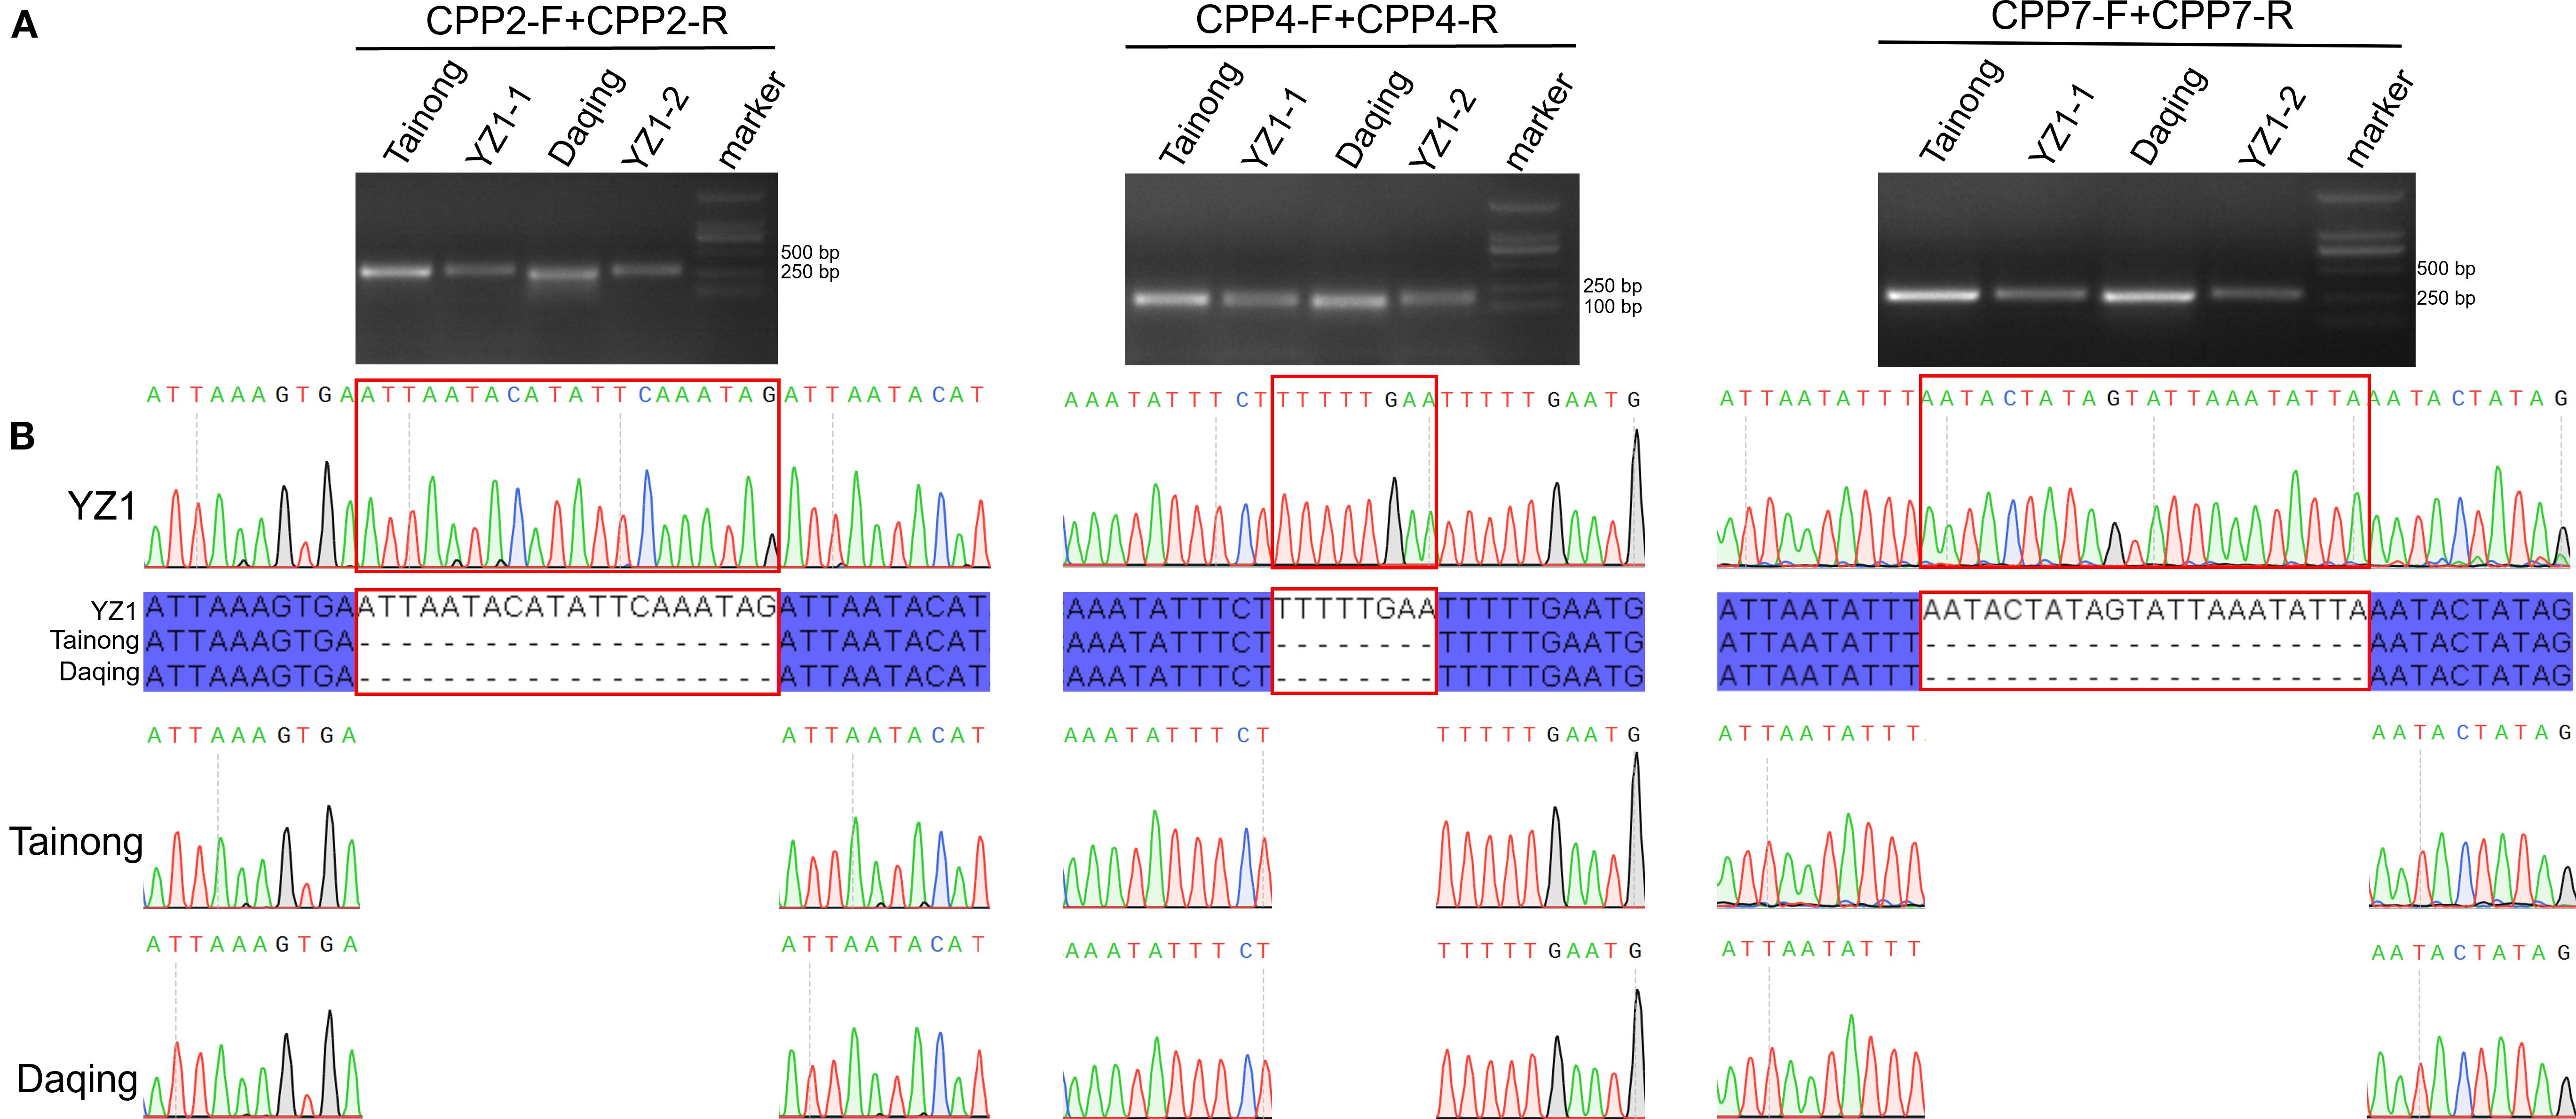
Figure 8. The alignment of the molecular markers of the PCR products amplified using the primers. (A) Barcode verification of four papaya varieties by PCR amplification using selected primer pairs. Marker lane was the DL2000 marker. (B) Sanger sequencing chromatogram of specific PCR product identified by gel electrophoresis.
3 Discussion
3.1 The conservative papaya chloroplast genome harbors evolutionary drivers for disease resistance
Since the chloroplast genome is critical to papaya biology, the papaya chloroplast genome was investigated through high-throughput genome sequencing with experimental validation in 17 varieties. In earlier studies, attempts were made for chloroplast genome assembly by mostly undertaking next-generation sequencing (Lin et al., 2024). The main purpose of this work was to decipher the chloroplast genomes of multiple commercial cultivars and traditional landraces of papaya (C. papaya). As mentioned in the Introduction, chloroplast genomes are highly conserved across plant species (Hao et al., 2024a). This study reveals a high degree of conservation in Carica chloroplast genomes, characterized by stable gene synteny, invariant IR lengths (26,325 bp across all 19 varieties), and low nucleotide diversity (only four regions with Pi > 0.002). However, dynamic IR boundary shifts, as evidenced by the transboundary distribution of ycf1 and rps19. Ycf1 (Tic214) was previously reported as a transmembrane subunit of the chloroplast TIC (translocon at the inner chloroplast membrane) complex, which transports cytosolic proteins into the chloroplast and collaborates with TOC (translocon at the outer chloroplast membrane) (Liu et al., 2023). Given the fundamental position of chloroplasts in plant immunity, the successful widespread cultivation of papaya in tropical regions implies that ycf1 may play roles in adaptability by regulating defense and stress responses, such as reactive oxygen species, Ca2+, salicylic acid, and jasmonic acid (Xing et al., 2025; Liu et al., 2024).
3.2 Efficacy of molecular markers and their potential in breeding
The rbcL–accD, rpl12–rps19, and trnG–trnR marker combinations achieved 100% accuracy in distinguishing disease-resistant and susceptible cultivars, especially those among the Tainong clade and YZ1 clade, demonstrating the utility of chloroplast markers in papaya germplasm screening. However, the overall low genetic diversity of papaya chloroplast genomes may arise from genetic bottlenecks during domestication or convergent selection for environmental adaptation. To explore the linkage of the markers to the nuclear genome, the ITS region was analyzed and found extremely conserved, making it unsuitable for developing molecular markers among these cultivars (Supplementary Figure S3). Interestingly, hypervariable regions (ycf1) located in LSC/SSC regions (Pi > IRs) highlight the role of non-coding sequence variation in adaptive divergence. While these markers are effective, sole reliance on chloroplast data may inadequately resolve complex agronomic trait networks (Huang et al., 2024; Wang et al., 2024). Integration with nuclear loci through multi-omics approaches is critical for comprehensive profiling.
The presence of such phylogenetic topology is a unique finding. We report a novel phylogenetic topology revealing unexpected evolutionary relationships in C. papaya. Our results provide compelling evidence through Illumina sequencing and experiments. The molecular markers presented here are a cost-effective detection protocol. Phylogenetic congruence with APG classifications supports the monophyly of Carica, yet limited interspecific divergence may reflect recent domestication or gene flow driven by artificial selection for resistance traits. Unfortunately, no correlation of agronomic traits and geographical origins of cultivars among the two clades and the molecular markers was found. Further work focusing on the mechanisms shaping important agronomic traits, including fruit size, fruit color, and papaya ringspot virus (PRSV) resistance, using Genome-Wide Association Studies (GWAS) on different cultivars and Quantitative Trait Locus (QTL) on Recombinant Inbred Line (RILs) is needed.
3.3 Limitations and gaps in genetic diversity resolution
Our results are encouraging and should be validated in a large variety. The focus on cultivated varieties, with limited inclusion of wild relatives, likely underestimates natural genetic diversity within the genus. Although analyses of the papaya chloroplast genome are extensively documented, research on mitochondria-associated information remains limited. Analyses restricted to chloroplast genomes preclude insights into nuclear–mitochondrial interactions influencing disease resistance. The hypothesized link between ycf1 and environmental adaptation remains untested via functional assays (e.g., gene knockout or overexpression), limiting our mechanistic understanding.
3.4 Translating genomic insights into applications
An important question for future work is to focus on the following areas: combining chloroplast, mitochondrial, and nuclear genomes to construct multi-layered phylogenetic networks, elucidating horizontal gene transfer; employing CRISPR/Cas9 to create ycf1 mutants and validate its role in environmental adaptation; and developing hybrid marker panels (chloroplast-nuclear) to enhance resolution in cultivar identification and breeding.
Achieving durable and broad-spectrum resistance to multiple pathogens is continually being pursued in crop breeding (Li et al., 2020; Ning and Wang, 2018). PRSV and papaya leaf-distortion mosaic virus (PLDMV) are devastating pathogens in papaya cultivation and could lead to over 60% yield loss (Kung et al., 2009; Maoka and Hataya, 2005). Natural resistance to PRSV exists in Carica cauliflora, Carica pubescens, and Carica quercifolia. However, cultivated species C. papaya exhibits hybrid incompatibility with the wild species, making it difficult to introduce PRSV resistance through hybrid breeding. Species-specific PRSV resistance has been achieved by introducing conserved target sequences of CP, NIb, and Hc-Pro into cultivated papayas (Ferreira et al., 2002). Due to the genetic instability of RNA viruses, target sequence-dependent RNAi-induced PRSV resistance is highly prone to loss (Zhao et al., 2015; Tuo et al., 2013). The lack of PLDMV resistance in cultivated papayas has led to the prevalence of the virus during recent years (Zhao et al., 2016). Discovering and incorporating PRSV/PLDMV resistance to create elite cultivars will be highly desirable (Hu et al., 2023). The molecular markers developed in this study realized the marker-assisted selection and aggregation of resistance to different pathogens in cultivated papayas.
Additionally, exploring chloroplast-encoded viral response elements (e.g., non-coding RNAs) could identify novel targets for disease resistance. While this study establishes a framework for chloroplast-driven breeding in tropical crops, interdisciplinary collaboration is essential to translate genomic discoveries into practical agricultural solutions.
4 Methods
4.1 Plant materials and DNA preparation
C. papaya plants used in this study were obtained from farmlands in Yazhou District, Sanya, China, and the germplasm resources nursery maintained by the Chinese Academy of Tropical Agricultural Sciences (near 18°23′21.4″N, 109°09′51.5″E). Chloroplast DNA was extracted from fresh leaf tissue and used to construct 350-bp paired-end libraries, which were sequenced on the Illumina NovaSeq 6000 platform (PE150 strategy) (Verstraeten et al., 2025). DNA was extracted using Cetyltrimethylammonium bromide (CTAB) and trichloromethane:isopentanol, precipitated by isopropanol, rinsed with 75% ethanol, and dissolved in distilled water. The same leaf tissue was stored in a freezer at −80 °C. Seeds were collected and preserved for germplasm at 16 °C.
4.2 Genome sequencing, assembly, and annotation
Raw reads were used for the assembly of chloroplast genomes using GetOrganelle v1.7.5 with default parameters (Jin et al., 2020). Genome annotation was performed using CPGAVAS2 (Shi et al., 2019), followed by manual correction of annotation errors in Apollo v3.0 (Lewis et al., 2002). The tRNA and rRNA genes were predicted using tRNAscan-SE (Chan et al., 2021) and BLASTn (Chen et al., 2015), respectively. Chloroplast genome maps were visualized using CPGView and OGDRAW (Greiner et al., 2019; Liu et al., 2023).
4.3 Nucleotide diversity analysis, phylogenetic analysis, and IR boundary dynamics
Genome sequences were aligned with MAFFT v7 (Katoh and Standley, 2013), and nucleotide diversity (Pi) was calculated using DnaSP v6.0 (Rozas et al., 2017) with a sliding window approach (window, 500 bp; step, 100 bp). Sequence similarity across chloroplast genomes was assessed using mVISTA in ShuffleLAGAN mode (Frazer et al., 2004). Multiple alignment and phylogenetic analysis were conducted and visualized using MEGA 12, iTOL, IQ-TREE and PhyloSuite (Kumar et al., 2024; Letunic and Bork, 2024; Minh et al., 2020; Zhang et al., 2020). IRscope was used for visualizing LSC, SSC, and IR boundaries (Amiryousefi et al., 2018). Whole-genome alignments of chloroplast sequences were performed using Mauve to detect structural rearrangements and assess synteny (Darling et al., 2004). ITS2 sequences were obtained by processing raw sequencing data using ITSxpress for region extraction (Einarsson and Rivers, 2024; Rivers et al., 2018), followed by VSEARCH for merging, quality filtering, and dereplication (Rognes et al., 2016).
4.4 Molecular marker development
Primer design was conducted using NCBI Primer-BLAST (Ye et al., 2012). Primers were synthesized by BioSune Biotechnology Co., Ltd., Chunshen Rd., Minhang District, Shanghai, China. PCR amplification was performed using 2 × Rapid Taq Plus Master Mix (Dye Plus) purchased from Nanjing Vazyme Biotech Co., Ltd., Kechuang Rd., Nanjing, China, optimized via temperature gradient screening for annealing temperature, and extending at 72 °C for 1 min following the user manual. PCR products were separated by 1.5% (w/v) agarose gel electrophoresis at 120 V. Specific bands were excised, purified, and subsequently validated through Sanger sequencing using a 3730xl DNA Analyzer by Beijing Tsingke Biotech Co., Ltd., 3 Jinghai Rd., Daxing District, Beijing, China. Primer sequences are listed in Supplementary Table 1.
Data availability statement
The datasets presented in this study can be found in online repositories. The names of the repository/repositories and accession number(s) can be found in the article/Supplementary Material.
Author contributions
YC: Writing – original draft, Software, Methodology, Writing – review & editing. XD: Writing – review & editing, Resources, Supervision, Formal analysis. LP: Formal analysis, Writing – original draft, Methodology. QH: Writing – original draft, Formal analysis, Resources. ZH: Supervision, Writing – review & editing, Visualization, Formal analysis, Funding acquisition.
Funding
The research was supported by the Project of Sanya Yazhou Bay Science and Technology City, Grant No. SCKJ-JYRC-2023-66; Chinese Academy of Tropical Agricultural Sciences, Grant No. 1630052024006; Hainan Seed Industry Laboratory, Grant No. B23C10004.
Acknowledgments
We sincerely thank the experimental personnel for the bioinformatics analysis at the MitoRun research group, which participated in this project.
Conflict of interest
The authors declare that the research was conducted in the absence of any commercial or financial relationships that could be construed as a potential conflict of interest.
Generative AI statement
The author(s) declare that no Generative AI was used in the creation of this manuscript.
Any alternative text (alt text) provided alongside figures in this article has been generated by Frontiers with the support of artificial intelligence and reasonable efforts have been made to ensure accuracy, including review by the authors wherever possible. If you identify any issues, please contact us.
Publisher’s note
All claims expressed in this article are solely those of the authors and do not necessarily represent those of their affiliated organizations, or those of the publisher, the editors and the reviewers. Any product that may be evaluated in this article, or claim that may be made by its manufacturer, is not guaranteed or endorsed by the publisher.
Supplementary material
The Supplementary Material for this article can be found online at: https://www.frontiersin.org/articles/10.3389/fpls.2025.1686914/full#supplementary-material
References
Amiryousefi, A., Hyvonen, J., and Poczai, P. (2018). IRscope: an online program to visualize the junction sites of chloroplast genomes. Bioinformatics 34, 3030–3031. doi: 10.1093/bioinformatics/bty220
Avila-Hernandez, J. G., Cardenas-Aquino, M., Camas-Reyes, A., and Martinez-Antonio, A. (2023). Sex determination in papaya: Current status and perspectives. Plant Sci. 335, 111814. doi: 10.1016/j.plantsci.2023.111814
Bui, T. L., Truong, N. T., and Do, T. K. (2024). The application of molecular marker in papaya sex determination: From the laboratory to the field. Sci. Hortic. 327, 112872. doi: 10.1016/j.scienta.2024.112872
Chan, P. P., Lin, B. Y., Mak, A. J., and Lowe, T. M. (2021). tRNAscan-SE 2.0: improved detection and functional classification of transfer RNA genes. Nucleic Acids Res. 49, 9077–9096. doi: 10.1093/nar/gkab688
Chávez-Pesqueira, M. and Núñez-Farfán, J. (2017). Domestication and genetics of papaya: A review. Front. Ecol. Evol. 5, 155. doi: 10.3389/fevo.2017.00155
Chen, Y., Ye, W., Zhang, Y., and Xu, Y. (2015). High speed BLASTN: an accelerated MegaBLAST search tool. Nucleic Acids Res. 43, 7762–7768. doi: 10.1093/nar/gkv784
Darling, A. C., Mau, B., Blattner, F. R., and Perna, N. T. (2004). Mauve: multiple alignment of conserved genomic sequence with rearrangements. Genome Res. 14, 1394–1403. doi: 10.1101/gr.2289704
Deputy, J. C., Ming, R., Ma, H., Liu, Z., Fitch, M. M., Wang, M., et al. (2002). Molecular markers for sex determination in papaya ( Carica papaya L.). Theor. Appl. Genet. 106, 107–111. doi: 10.1007/s00122-002-0995-0
Dominguez, D. M. P., Sinisterra, J. V., Tsai, S. W., and Alcantara, A. R. (2006). Carica papaya lipase (CPL): an emerging and versatile biocatalyst. Biotechnol. Adv. 24, 493–499. doi: 10.1016/j.biotechadv.2006.04.002
Einarsson, S. V. and Rivers, A. R. (2024). ITSxpress version 2: software to rapidly trim internal transcribed spacer sequences with quality scores for amplicon sequencing. Microbiol. Spectr. 12, e60124. doi: 10.1128/spectrum.00601-24
Ferreira, S. A., Pitz, K. Y., Manshardt, R., Zee, F., Fitch, M., and Gonsalves, D. (2002). Virus Coat Protein Transgenic Papaya Provides Practical Control of Papaya ringspot virus in Hawaii. Plant Dis. 86, 101–105. doi: 10.1094/PDIS.2002.86.2.101
Frazer, K. A., Pachter, L., Poliakov, A., Rubin, E. M., and Dubchak, I. (2004). ISTA: computational tools for comparative genomics. Nucleic Acids Res. 32, W273–W279. doi: 10.1093/nar/gkh458
Gomes, M. T., Ribeiro, H. A., Lopes, M. T., Guzman, F., and Salas, C. E. (2010). Biochemical comparison of two proteolytic enzymes from Carica candamarcensis: structural motifs underlying resistance to cystatin inhibition. Phytochemistry 71, 524–530. doi: 10.1016/j.phytochem.2009.12.018
Greiner, S., Lehwark, P., and Bock, R. (2019). OrganellarGenomeDRAW (OGDRAW) version 1.3.1: expanded toolkit for the graphical visualization of organellar genomes. Nucleic Acids Res. 47, W59–W64. doi: 10.1093/nar/gkz238
Haber, R. A., Garcia, R. D., Hernandez, J. N., Jamieson, S., Mondal, A., and Bishayee, A. (2023). Papaya (Carica papaya L.) for cancer prevention: Progress and promise. Crit. Rev. Food Sci. Nutr. 63, 10499–10519. doi: 10.1080/10408398.2022.2079607
Hao, Z., Zhang, Z., Jiang, J., Pan, L., Zhang, J., Cui, X., et al. (2024a). Complete mitochondrial genome of Melia azedarach L., reveals two conformations generated by the repeat sequence mediated recombination. BMC Plant Biol. 24, 645. doi: 10.1186/s12870-024-05319-7
Hao, Z., Zhang, Z., Zhang, J., Cui, X., Li, J., Luo, L., et al. (2024b). The complete mitochondrial genome of Aglaia odorata, insights into its genomic structure and RNA editing sites. Front. Plant Sci. 15, 1362045. doi: 10.3389/fpls.2024.1362045
Hu, X. H., Shen, S., Wu, J. L., Liu, J., Wang, H., He, J. X., et al. (2023). A natural allele of proteasome maturation factor improves rice resistance to multiple pathogens. Nat. Plants 9, 228–237. doi: 10.1038/s41477-022-01327-3
Huang, J., Hu, X., Zhou, Y., Peng, Y. J., and Liu, Z. (2024). Phylogeny, genetic diversity and population structure of fritillaria cirrhosa and its relatives based on chloroplast genome data. Genes 15, 730. doi: 10.3390/genes15060730
Jin, J. J., Yu, W. B., Yang, J. B., Song, Y., DePamphilis, C. W., Yi, T. S., et al. (2020). GetOrganelle: a fast and versatile toolkit for accurate de novo assembly of organelle genomes. Genome Biol. 21, 241. doi: 10.1186/s13059-020-02154-5
Kanchana-udomkan, C., Ford, R., and Drew, R. (2014). “Molecular markers in papayas,” in Genetics and genomics of papaya. Eds. Ming, R. and Moore, P. H. (Springer New York, New York, NY), 355–375.
Katoh, K. and Standley, D. M. (2013). MAFFT multiple sequence alignment software version 7: improvements in performance and usability. Mol. Biol. Evol. 30, 772–780. doi: 10.1093/molbev/mst010
Kumar, S., Stecher, G., Suleski, M., Sanderford, M., Sharma, S., and Tamura, K. (2024). MEGA12: molecular evolutionary genetic analysis version 12 for adaptive and green computing. Mol. Biol. Evol. 41, msae263. doi: 10.1093/molbev/msae263
Kung, Y. J., Bau, H. J., Wu, Y. L., Huang, C. H., Chen, T. M., and Yeh, S. D. (2009). Generation of transgenic papaya with double resistance to Papaya ringspot virus and Papaya leaf-distortion mosaic virus. Phytopathol. 99, 1312–1320. doi: 10.1094/PHYTO-99-11-1312
Leitao, M., Ribeiro, T., Garcia, P. A., Barreiros, L., and Correia, P. (2022). ). Benefits of fermented papaya in human health. Foods 11, 563. doi: 10.3390/foods11040563
Lemus-Mondaca, R., Puente-Diaz, L., Cifuentes, A., Lizama, K., and Gonzalez, P. (2024). Chilean papaya (Vasconcellea pubescens): A native fruit with a high health-promoting functional potential. Antioxidants 13, 1521. doi: 10.3390/antiox13121521
Letunic, I. and Bork, P. (2024). Interactive Tree of Life (iTOL) v6: recent updates to the phylogenetic tree display and annotation tool. Nucleic Acids Res. 52, W78–W82. doi: 10.1093/nar/gkae268
Lewis, S. E., Searle, S. M., Harris, N., Gibson, M., Lyer, V., Richter, J., et al. (2002). Apollo: a sequence annotation editor. Genome Biol. . 3, H82. doi: 10.1186/gb-2002-3-12-research0082
Li, W., Deng, Y., Ning, Y., He, Z., and Wang, G. L. (2020). Exploiting broad-spectrum disease resistance in crops: from molecular dissection to breeding. Annu. Rev. Plant Biol. 71, 575–603. doi: 10.1146/annurev-arplant-010720-022215
Lin, L., Hao, Z., Zhou, L., Liu, W., Liu, N., Wang, K., et al. (2024). Elucidating phylogenetic relationships within the genus Curcuma through the comprehensive analysis of the chloroplast genome of Curcuma viridiflora Roxb. 1810 (Zingiberaceae). Mitochondrial DNA Part B-Resour. 9, 371–375. doi: 10.1080/23802359.2024.2329674
Lin, Z., Zhou, P., Ma, X., Deng, Y., Liao, Z., Li, R., et al. (2020). Comparative analysis of chloroplast genomes in Vasconcellea pubescens A.DC. and Carica papaya L. Sci. Rep. 10, 15799. doi: 10.1038/s41598-020-72769-y
Liu, J., Gong, P., Lu, R., Lozano-Duran, R., Zhou, X., and Li, F. (2024). Chloroplast immunity: A cornerstone of plant defense. Mol. Plant 17, 686–688. doi: 10.1016/j.molp.2024.03.012
Liu, H., Li, A., Rochaix, J. D., and Liu, Z. (2023). Architecture of chloroplast TOC-TIC translocon supercomplex. Nature 615, 349–357. doi: 10.1038/s41586-023-05744-y
Liu, S., Ni, Y., Li, J., Zhang, X., Yang, H., Chen, H., et al. (2023). CPGView: A package for visualizing detailed chloroplast genome structures. Mol. Ecol. Resour. 23, 694–704. doi: 10.1111/1755-0998.13729
Madronero, J., Rodrigues, S. P., Antunes, T., Abreu, P., Ventura, J. A., Fernandes, A., et al. (2018). Transcriptome analysis provides insights into the delayed sticky disease symptoms in Carica papaya. Plant Cell Rep. 37, 967–980. doi: 10.1007/s00299-018-2281-x
Maoka, T. and Hataya, T. (2005). The Complete Nucleotide Sequence and Biotype Variability of Papaya leaf distortion mosaic virus. Phytopathol. 95, 128–135. doi: 10.1094/PHYTO-95-0128
Minh, B. Q., Schmidt, H. A., Chernomor, O., Schrempf, D., Woodhams, M. D., von Haeseler, A., et al. (2020). IQ-TREE 2: new models and efficient methods for phylogenetic inference in the genomic era. Mol. Biol. Evol. 37, 1530–1534. doi: 10.1093/molbev/msaa015
Mumo, N. N., Mamati, G. E., Ateka, E. M., Rimberia, F. K., Asudi, G. O., Boykin, L. M., et al. (2020). Metagenomic analysis of plant viruses associated with papaya ringspot disease in carica papaya L. @ in Kenya. Front. Microbiol. 11, 205. doi: 10.3389/fmicb.2020.00205
Nguyen, V. B., Linh, G. V., Waminal, N. E., Park, H. S., Kim, N. H., Jang, W., et al. (2020). Comprehensive comparative analysis of chloroplast genomes from seven Panax species and development of an authentication system based on species-unique single nucleotide polymorphism markers. J. Ginseng Res. 44, 135–144. doi: 10.1016/j.jgr.2018.06.003
Ning, Y. and Wang, G. L. (2018). Breeding plant broad-spectrum resistance without yield penalties. Proc. Natl. Acad. Sci. U. S. A. 115, 2859–2861. doi: 10.1073/pnas.1801235115
Premchand, U., Mesta, R. K., Devappa, V., Basavarajappa, M. P., Venkataravanappa, V., Narasimha, R. L., et al. (2023). Survey, detection, characterization of papaya ringspot virus from southern India and management of papaya ringspot disease. Pathogens 12, 824. doi: 10.3390/pathogens12060824
Rivers, A. R., Weber, K. C., Gardner, T. G., Liu, S., and Armstrong, S. D. (2018). ITSxpress: Software to rapidly trim internally transcribed spacer sequences with quality scores for marker gene analysis. F1000Res 7, 1418. doi: 10.12688/f1000research.15704.1
Rognes, T., Flouri, T., Nichols, B., Quince, C., and Mahe, F. (2016). VSEARCH: a versatile open source tool for metagenomics. PEERJ 4, e2584. doi: 10.7717/peerj.2584
Rozas, J., Ferrer-Mata, A., Sanchez-DelBarrio, J. C., Guirao-Rico, S., Librado, P., Ramos-Onsins, S. E., et al. (2017). ). DnaSP 6: DNA sequence polymorphism analysis of large data sets. Mol. Biol. Evol. 34, 3299–3302. doi: 10.1093/molbev/msx248
Shi, L., Chen, H., Jiang, M., Wang, L., Wu, X., Huang, L., et al. (2019). CPGAVAS2, an integrated plastome sequence annotator and analyzer. Nucleic Acids Res. 47, W65–W73. doi: 10.1093/nar/gkz345
Somsri, S., Fletcher, R. J., Jobin, M., Drew, R., Lawson, W., and Graham, M. W. (1997). “Developing molecular markers for sex prediction in papaya (Carica papaya L.),” in International symposium on biotechnology of tropical and subtropical species part 2, vol. 461. Brisbane, Queensland (Australia): International Society for Horticultural Science, 141–148.
Tuo, D., Shen, W., Yan, P., Li, C., Gao, L., Li, X., et al. (2013). Complete genome sequence of an isolate of papaya leaf distortion mosaic virus from commercialized PRSV-resistant transgenic papaya in China. Acta Virol. 57, 452–455. doi: 10.4149/av_2013_04_452
Vashistha, P., Yadav, A., Dwivedi, U. N., and Yadav, K. (2016). Genetics of sex chromosomes and sex-linked molecular markers in papaya (Carica papaya L.). Mol. Plant Breed. 7, 1–18. doi: 10.5376/mpb.2016.07.0028
Verstraeten, L., Fokias, K., Saerens, G., and Bekaert, B. (2025). Cost-effective optimisation and validation of the VISAGE enhanced tool assay on the Illumina NovaSeq 6000 platform. Forensic Sci. Int.-Genet. 78, 103299. doi: 10.1016/j.fsigen.2025.103299
Vidal, N. M., Grazziotin, A. L., Ramos, H. C. C., Pereira, M. G., and Venancio, T. M. (2014). Development of a gene-centered SSR atlas as a resource for papaya (Carica papaya) marker-assisted selection and population genetic studies. PloS One 9, e112654. doi: 10.1371/journal.pone.0112654
Wang, Z. Y., Hu, Y., Lv, Y. W., Xiao, Y., He, Z. H., Wu, C., et al. (2024). Population structure and genetic diversity of the toona ciliata (Meliaceae) complex assayed with chloroplast DNA markers. Genes 15, 320. doi: 10.3390/genes15030320
Wang, S., Wang, Y., Sun, J., Cui, X., Li, E., Wang, R., et al. (2025). Comparative chloroplast genome analyses provide new insights into molecular markers for distinguishing Arnebiae Radix and its substitutes (tribe Lithospermeae, Boraginaceae). Phytomedicine 136, 156338. doi: 10.1016/j.phymed.2024.156338
Warnakula, W., Kottearachchi, N., and Yakandawala, K. (2017). Morphological, SSR and ISSR marker based genetic diversity assessment of mountain papaya germplasm in comparison with Carica papaya. J. Natl. Sci. Found. Sri Lanka 45, 255–264. doi: 10.4038/jnsfsr.v45i3.8190
Xing, J., Pan, J., and Yang, W. (2025). Chloroplast protein translocation complexes and their regulation. J. Integr. Plant Biol. 67, 912–925. doi: 10.1111/jipb.13875
Ye, J., Coulouris, G., Zaretskaya, I., Cutcutache, I., Rozen, S., and Madden, T. L. (2012). Primer-BLAST: a tool to design target-specific primers for polymerase chain reaction. BMC Bioinf. 13, 134. doi: 10.1186/1471-2105-13-134
Yue, M., Chen, H., Xuan, L., Yang, Y., Chong, X., Li, M., et al. (2023). Novel molecular markers for Taxodium breeding from the chloroplast genomes of four artificial Taxodium hybrids. Front. Genet. 14, 1193023. doi: 10.3389/fgene.2023.1193023
Yue, J., VanBuren, R., Liu, J., Fang, J., Zhang, X., Liao, Z., et al. (2022). SunUp and Sunset genomes revealed impact of particle bombardment mediated transformation and domestication history in papaya. Nat. Genet. 54, 715–724. doi: 10.1038/s41588-022-01068-1
Zhang, D., Gao, F., Jakovlic, I., Zou, H., Zhang, J., Li, W. X., et al. (2020). PhyloSuite: An integrated and scalable desktop platform for streamlined molecular sequence data management and evolutionary phylogenetics studies. Mol. Ecol. Resour. 20, 348–355. doi: 10.1111/1755-0998.13096
Zhao, H., Jia, R. Z., Zhang, Y. L., Zhu, Y. J., Zeng, H. C., Kong, H., et al. (2016). Geographical and Genetic Divergence Among Papaya ringspot virus Populations Within Hainan Province, China. Phytopathology 106, 937–944. doi: 10.1094/PHYTO-05-15-0111-R
Zhao, G., Yan, P., Shen, W., Tuo, D., Li, X., and Zhou, P. (2015). Complete genome sequence of papaya ringspot virus isolated from genetically modified papaya in hainan island, China. Genome Announc. 3, e01056–e01015. doi: 10.1128/genomeA.01056-15
Keywords: Carica papaya L., chloroplast genome, genetic diversity, molecular markers, evolutionary relationship
Citation: Chen Y, Du X, Pan L, Huang Q and Hao Z (2025) Comparative analysis of chloroplast genomes in Carica species reveals evolutionary relationships of papaya and the development of efficient molecular markers. Front. Plant Sci. 16:1686914. doi: 10.3389/fpls.2025.1686914
Received: 16 August 2025; Accepted: 11 September 2025;
Published: 14 October 2025.
Edited by:
Peng Wang, Jiangsu Province and Chinese Academy of Sciences, ChinaReviewed by:
Yanxiang Lin, Fujian University of Traditional Chinese Medicine, ChinaPan Xu, Lanzhou University, China
Copyright © 2025 Chen, Du, Pan, Huang and Hao. This is an open-access article distributed under the terms of the Creative Commons Attribution License (CC BY). The use, distribution or reproduction in other forums is permitted, provided the original author(s) and the copyright owner(s) are credited and that the original publication in this journal is cited, in accordance with accepted academic practice. No use, distribution or reproduction is permitted which does not comply with these terms.
*Correspondence: Xiaoxi Du, ZHV4aWFveGlAaXRiYi5vcmcuY24=; Zhigang Hao, MTA2NzMyMzk2MEBxcS5jb20=
†These authors have contributed equally to this work and share first authorship