 Jing Luo
 Zaiqiang Yang*
 Chunying Li
- Jiangsu Key Laboratory of Agricultural Meteorology, School of Applied Meteorology, Nanjing University of Information Science and Technology, Nanjing, China
This study was conducted to investigate the effects of nitrogen application on growth, photosynthetic performance, nitrogen metabolism activities, and fruit quality of tomato plants under high-temperature (HT) stress. Three levels of daily minimum/daily maximum temperature were adopted during the flowering and fruiting stage, namely control (CK; 18°C/28°C), sub-high temperature (SHT; 25°C/35°C), and high-temperature (HT; 30°C/40°C) stress. The levels of nitrogen (urea, 46% N) were set as 0 (N1), 125 (N2), 187.5 (N3), 250 (N4), and 312.5 (N5) kg hm2, respectively, and the duration lasted for 5 days (short-term). HT stress inhibited the growth, yield, and fruit quality of tomato plants. Interestingly, short-term SHT stress improved growth and yield via higher photosynthetic efficiency and nitrogen metabolism whereas fruit quality was reduced. Appropriate nitrogen application can enhance the high-temperature stress tolerance of tomato plants. The maximum net photosynthetic rate (PNmax), stomatal conductance (gs), stomatal limit value (LS), water-use efficiency (WUE), nitrate reductase (NR), glutamine synthetase (GS), soluble protein, and free amino acids were the highest in N3, N3, and N2, respectively, for CK, SHT, and HT stress, whereas carbon dioxide concentration (Ci), was the lowest. In addition, maximum SPAD value, plant morphology, yield, Vitamin C, soluble sugar, lycopene, and soluble solids occurred at N3-N4, N3-N4, and N2-N3, respectively, for CK, SHT, and HT stress. Based on the principal component analysis and comprehensive evaluation, we found that the optimum nitrogen application for tomato growth, yield, and fruit quality was 230.23 kg hm2 (N3-N4), 230.02 kg hm2 (N3-N4), and 115.32 kg hm2 (N2), respectively, at CK, SHT, and HT stress. Results revealed that the high yield and good fruit quality of tomato plants at high temperatures can be maintained by higher photosynthesis, nitrogen efficiency, and nutrients with moderate nitrogen.
1 Introduction
Tomato (Solanum lycopersicum L.) is one of the most widely grown, consumed, and produced crops in the greenhouse worldwide (Liu and Wang, 2020). It has attracted attention due to its rich Vitamin C and other nutrients, especially lycopene, which is related to its effects as a natural antioxidant (Alenazi et al., 2020; Imran et al., 2020).
Global warming has continued to raise concerns in recent years (Marlon et al., 2021; Hoffmann et al., 2022). The effect of global warming may cause irreversible damage to the growth and development of plants (Mathur et al., 2014; Ezquer et al., 2020). Tomato is a temperature-loving crop and is sensitive to temperature throughout fertility (Birje et al., 2020; Hao et al., 2020). The optimum growth temperature of tomatoes is between 18°C and 32°C (Berry and Bjorkman, 1980; Van Ploeg and Heuvelink, 2005). Prolonged exposure to temperature exceeding this range will restrict the growth and production of tomatoes more frequently and seriously (Bertin et al., 2000; Nicola et al., 2009). Therefore, global warming will negatively affect the growth and productivity of tomato plants, especially in the summer seasons.
High temperature (HT) has adverse effects on photosynthesis, such as significantly reducing the maximum net photosynthetic rate (PNmax), apparent quantum efficiency (AQE), and light-compensation point (LCP), and significantly increasing the light-saturation point (LSP) (Djanaguiraman et al., 2020; Li et al., 2023). Previous studies demonstrated that gas exchange and photosynthesis had marked reduction under HT stress due to the inhibition of chloroplast and photosystem II (PSII) activity (Salvucci and Crafts-Brandner, 2004; Allakhverdiev et al., 2008). HT stress also reduces nitrogen metabolism via lower photosynthesis, resulting in the loss of nutrients (Prasad et al., 2008; Hammer et al., 2018). In addition, HT stress also influences morphological symptoms in tomato plants after the decline of photosynthesis and metabolism appear. It is well known that HT stress can reduce cell division and restrict cell elongation, thereby delaying plant growth (Ashraf and Harris, 2004; Camejo et al., 2005). Since plants cannot maintain some fundamental processes, HT stress may severely affect plant growth, yield, and fruit quality (Wahid et al., 2007; Bita and Gerats, 2013).
Although high temperatures have many adverse effects on plants, nitrogen application can enhance high-temperature stress tolerance (James et al., 2018). First, nitrogen can increase the photosynthesis and the scavenging capacity of reactive oxygen species, which in turn improves leaves to resist high-temperature adversity (Liu et al., 2019). Second, the smooth and efficient functioning of the nitrogen metabolic system in the leaves is ensured with increased nitrogen application, improving the nitrogen metabolism, and reducing the damage caused by HT stress (Iqbal et al., 2020; Ru et al., 2022). Specifically, excessive nitrogen application at high-temperature stress will exacerbate the damage to plants, which is characterized by lower yield (Peng et al., 2017).
Plants will continue to be challenged by HT stress in the future. Temperature and nitrogen both play important roles in plant growth (Sun et al., 2012; Alvar-Beltrán et al., 2019). However, to our knowledge, little is known about the effects of nitrogen application on tomato growth, development, and fruit quality under HT stress. In our study, we hypothesize that appropriate nitrogen would effectively increase the photosynthetic progress, and nitrogen metabolism and further affect the yield and fruit quality of tomato plants. Our objectives were (1) to compare the growth, photosynthetic performance, nitrogen metabolism activities, and fruit quality of tomatoes under different temperatures, (2) to investigate the effects of nitrogen application on the growth, yield, and fruit quality of tomatoes under high-temperature stress, (3) to determine the optimum nitrogen level to be applied under different high-temperature conditions, hoping to provide scientific contribution for high yield and good fruit quality of tomatoes in the greenhouse.
2 Materials and methods
2.1 Plant material and experimental treatments
The experiments were conducted in a Venlo-type greenhouse of the Nanjing University of Information Science and Technology (NUIST) from March 2022 to August 2022. Tomato seedlings (Solanum lycopersicum L., “Caesar”) were planted into pots of 30 cm (height) × 30 cm (upper diameter) × 25 cm (lower diameter) filled with peat soil: perlite: vermiculite = 2:1:1 (v/v/v). The soil was a medium loam with pH=7.4, 12.93 g kg-1organic carbon (C), 22.29 g kg-1 organic matter content, 69.36 mg kg-1 effective phosphorus (P), 13.80 mg L-1 available potassium (K), and 0.13% total nitrogen (N). To ensure proper soil nutrient content, base fertilizers were applied in phosphorus (calcium superphosphate, 12%P2O5, 200 kg hm2) and potassium (potassium sulfate, 52%K2O, 300 kg hm2). Five levels of nitrogen (urea, 46%N) were set as 0 (0N, N1), 125 (0.5N, N2), 187.5 (0.75N, N3), 250 (1.0N, N4), and 312.5 (1.25N, N5) kg hm2 (250 kg hm2 as the percentage of standard nutrient requirements (Yang et al., 2017; Wang et al., 2020)). The ratio of nitrogen was 30%:30%:20%:20% at the seedling, flowering and fruiting, green ripening, and color change stages, respectively.
Uniform-sized tomato seedlings with one young fruit were chosen to conduct high-temperature and nitrogen experiments during the flowering and fruiting stage. Three levels of daily minimum/daily maximum temperature were adopted, namely control (CK; 18°C/28°C), sub-high temperature (SHT; 25°C/35°C), and high-temperature (HT; 30°C/40°C) stress, and the duration lasted for 5 days. All seedlings were divided into 15 groups with each group containing 9 pots (Table 1). Plants uptaking nitrogen after 5 days were moved into artificial climate chambers (BDW 40, Conviron, Canada). During the treatment, the relative humidity was set at 50-80%, and the light was 6:00-18:00 (daytime) with photosynthetic active radiation between 0 to 1000 μmol m-2 s-1.
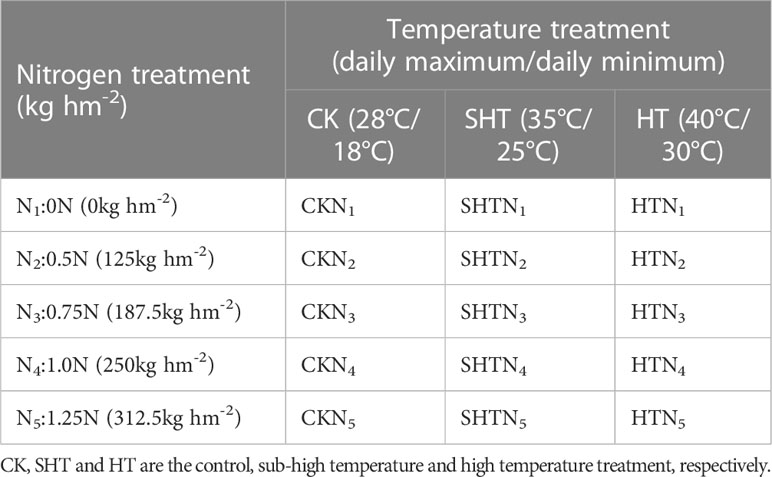
Table 1 Treatment combination of nitrogen level and temperature level for tomato in the greenhouse.
After the treatments, all plants were removed to the Velno-type greenhouse for the recovery period. Measurements were taken with 3 random pots at the end of treatments and conducted on the third to fifth functional leaves. Additionally, to measure the fruit quality, three tomato fruits of relatively uniform size and without mechanical damage were chosen at maturity for each treatment. Water is supplied twice a day during the treatment and at least every two days (in most cases once or twice a day) during the seedling and recovery stages. All plants were irrigated to 80% field capacity (monitoring by soil moisture content tester) to avoid water deficiency.
2.2 The methods of measurement
2.2.1 Gas exchange parameters and SPAD value
Gas exchange parameters, including the stomatal conductance (gs) and intercellular carbon dioxide concentration (Ci), were measured by an LI-6400XT photosynthesis system (LI-COR Inc., Lincoln, NE, USA) from 9:00-11:00. The leaf chamber temperature was set to 25°C, the relative humidity was set to 65%, and the CO2 concentration was kept at 390 μmol mol–1. Photosynthetically active radiation (PAR) was set to 1800, 1600, 1400, 1200, 1000, 800, 600, 400, 200, 150, 100, 50, and 0 μmol m-2 s-1, respectively. The stomatal limit (Ls) value was determined by equation (1).
Where Ca indicates the atmospheric CO2 concentration.
And
The PNmax was obtained by the photosynthesis-light response curves based on the photosynthetic electron transport of photosystem II in C3 and C4 species (Ye, 2012; Ye et al., 2013).
SPAD value was measured by Chlorophyll Meter Model (SPAD-502, Konica Minolta, Japan).
2.2.2 Nitrogen metabolism and nutrients
The third to fifth function leaves were picked from the top of tomato plants, frozen rapidly with liquid nitrogen for 15 min, and then store at -20°C for measurement. Nitrate reductase (NR, EC 1.6.6.1) was determined according to the method of Miflin and Habash (2002). NR can be expressed in terms of the amount of nitroso-nitrogen produced, which has a maximum absorption peak at 540nm. Glutamine synthetase (GS, EC 2.7.7.42) activity was measured using the method of Du et al. (2008). One unit of GS activity was determined by the absorbance values at 540 nm using the spectrophotometer (UV-1800, Shimadzu, Japan). The NR and GS activities were calculated per germ of fresh weight (FW).
Soluble protein was determined by the coomassie brilliant blue method (Sedmak and Grossberg, 1977), which was measured by the absorbance of the solution at 595 nm, and the protein content was found by the standard curve. The content of free amino acids was determined by the ninhydrin chromogenic method according to Friedman (2004), which was colorimetric at 570 nm.
2.2.3 Morphological characters
Plant height, stem diameter, main root length, and leaf area were measured by tape ruler, electronic vernier caliper, rule, and leaf area meter (LI-3100C, Li-Cor, Inc., USA), respectively. Plant height growth, stem diameter height growth, and leaf area index (LAI) were calculated as:
Where 0d and 5d are the value measured at 0d and 5d, respectively.
2.2.4 Fruit quality
Extrinsic quality (single fruit weight, fruit length, maximum and minimum fruit diameter, etc.) and intrinsic quality (Vitamin C, anthocyanin, organic acid content, and soluble sugar content, etc.) are two aspects of fruit quality (Ashalley, 2014). Fruit hardness, single fruit weight, and maximum and minimum fruit diameter were measured by fruit hardness meter (GY-4, Aipli, China), electronic balance (ES-220D, China), and electronic Vernier caliper, respectively. Fruit shape index and yield were calculated as:
The content of Vitamin C (VC), titratable acid, and soluble sugar was determined by the 2,6-dichloroindophenol titrimetric (JAOAC, 1984), micro alkaline titration (Wei, 2020), and the anthrone method (Wei, 2020), respectively. Lycopene was determined according to Zhao et al. (2022). Nitrate (NO3-) was determined according to Wang et al. (2017). Soluble solids were measured by a hand-held refractometer (ATC, Aipli, China).
2.3 Statistical analysis
2.3.1 Variance analysis
All data were the mean ± standard deviation (SD) of 3 biological replications. SPSS 24.0 (SPSS, Chicago, IL, USA) for one–way analysis of variance (ANOVA), interaction analysis, Duncan’s multiple comparisons (at P=0.05), correlation analysis, and principal component analysis.
2.3.2 Principal component analysis
The indicators of tomato photosynthesis, nitrogen metabolism, nutrients, growth, and fruit quality were evaluated by correlation analysis and principal component analysis. The comprehensive index (CI) is constructed by the indicators with high contribution rates and most of the information in principal component analysis (Li et al., 2019). The standardized values, weights, and comprehensive index are calculated as follows.
This study uses the opposite difference approach (8) to normalize the indicators so that their ranges were between [0,1].
Where is the standardized value of the ith indicator, (i=1, 2, 3, …, 23); is the minimum value of the ith indicator; is the maximum value of the ith indicator.
The weight of the indicators in Principal Component Ak can be calculated as:
Where is the weight of the ith indicator in Ak, (k=1, 2, …., p); is the loadings of the ith indicator in Ak; is the eigenvalues of Ak.
The results of the comprehensive index in Principal Component Ak are obtained as:
Where is the comprehensive index of Ak.
The results of comprehensive evaluation in Principal Component analysis are obtained as:
Where is the contribution rate of Principal Component Ak; is the weight of Principal Component Ak.
3 Results
3.1 Effects of nitrogen application on gas exchange parameters and SPAD value under high-temperature stress
High-temperature (HT) stress had negative impacts on the gas exchange parameters of tomato leaves, which was characterized by the decrease in PNmax, gs, LS, and WUE but the increase in Ci (Table 2). Compared to the CK and HT, the PNmax, gs, LS, and WUE in the SHT group increased significantly, but the Ci was reduced significantly (P<0.05). The PNmax, gs, LS, Ci, and WUE were significantly influenced by appropriate nitrogen applications under different temperature treatments. Maximum PNmax, gs, LS and WUE occurred at CKN3, SHTN3, and HTN2, respectively, whereas the Ci was the lowest. PNmax, gs, and WUE in HTN2 were lower than those of the CKN3. However, those parameters significantly increased by 15.54%, 22.45%, and 13.96%, respectively, under SHTN3. LS showed no significant difference among CKN3, SHTN3, and HTN2. Furthermore, Ci under HTN2 was 5.43% higher than that of CKN3, but no significant differences between CKN3 and SHTN3 (P>0.05).
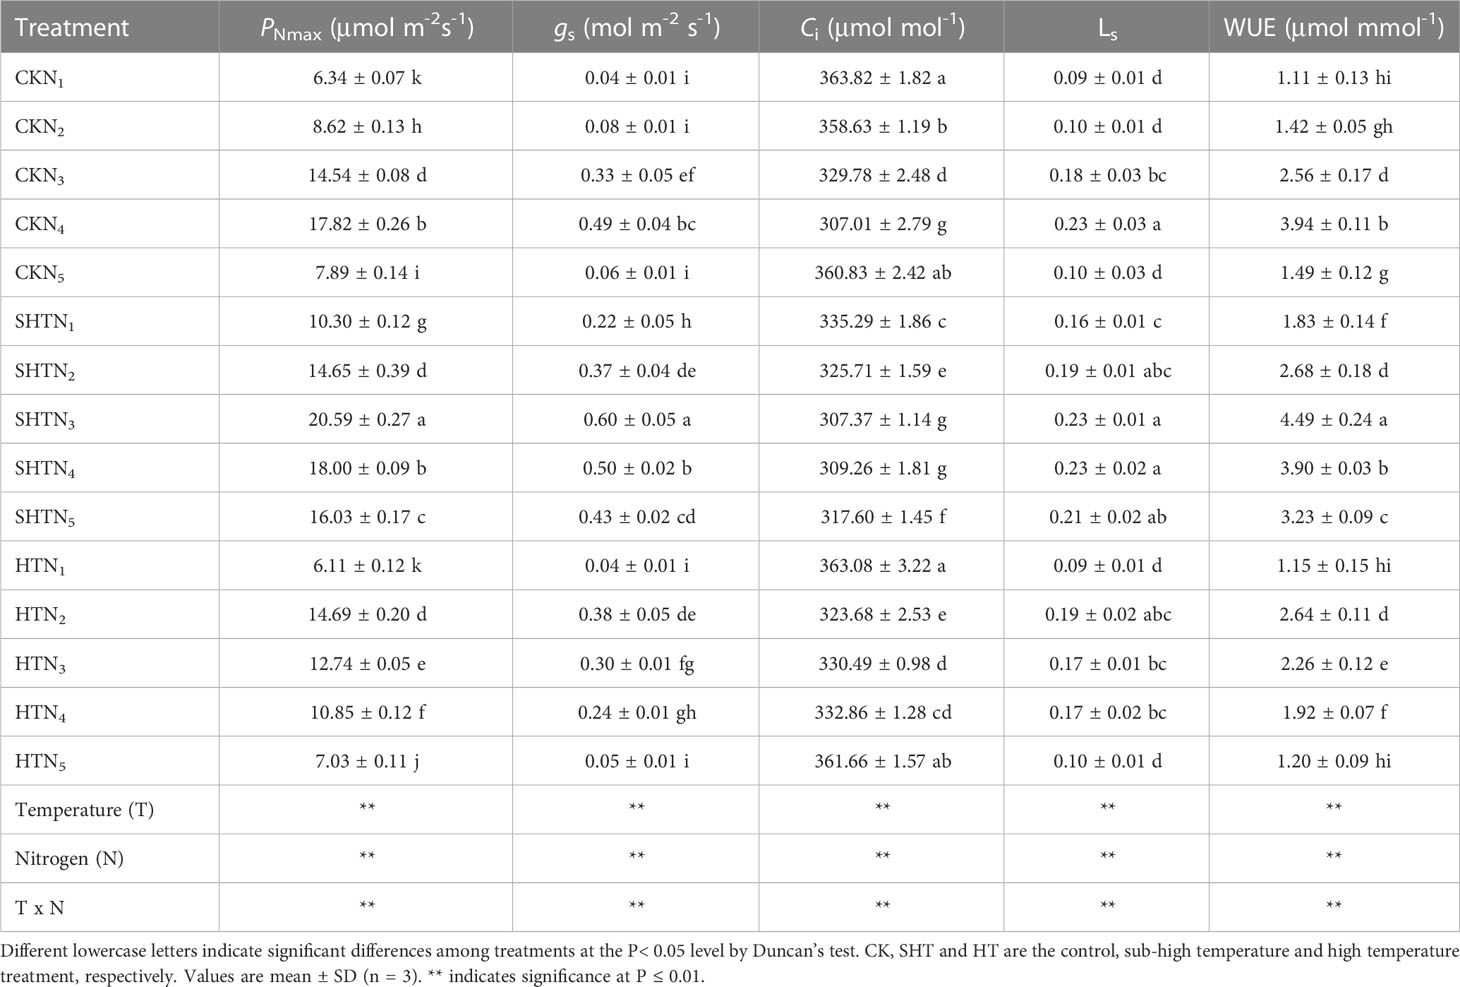
Table 2 Effects of nitrogen application on gas exchange parameters of tomato leaves under high-temperature stress.
The SPAD value was also influenced by HT stress (Figure 1). Meanwhile, appropriate nitrogen application significantly mitigated the effects of HT stress on SPAD value, with a marked improvement in CKN3, SHTN4, and HTN2. SPAD value under CKN3 was 13.70% higher than that of HTN2, while no significant difference with SHTN3.
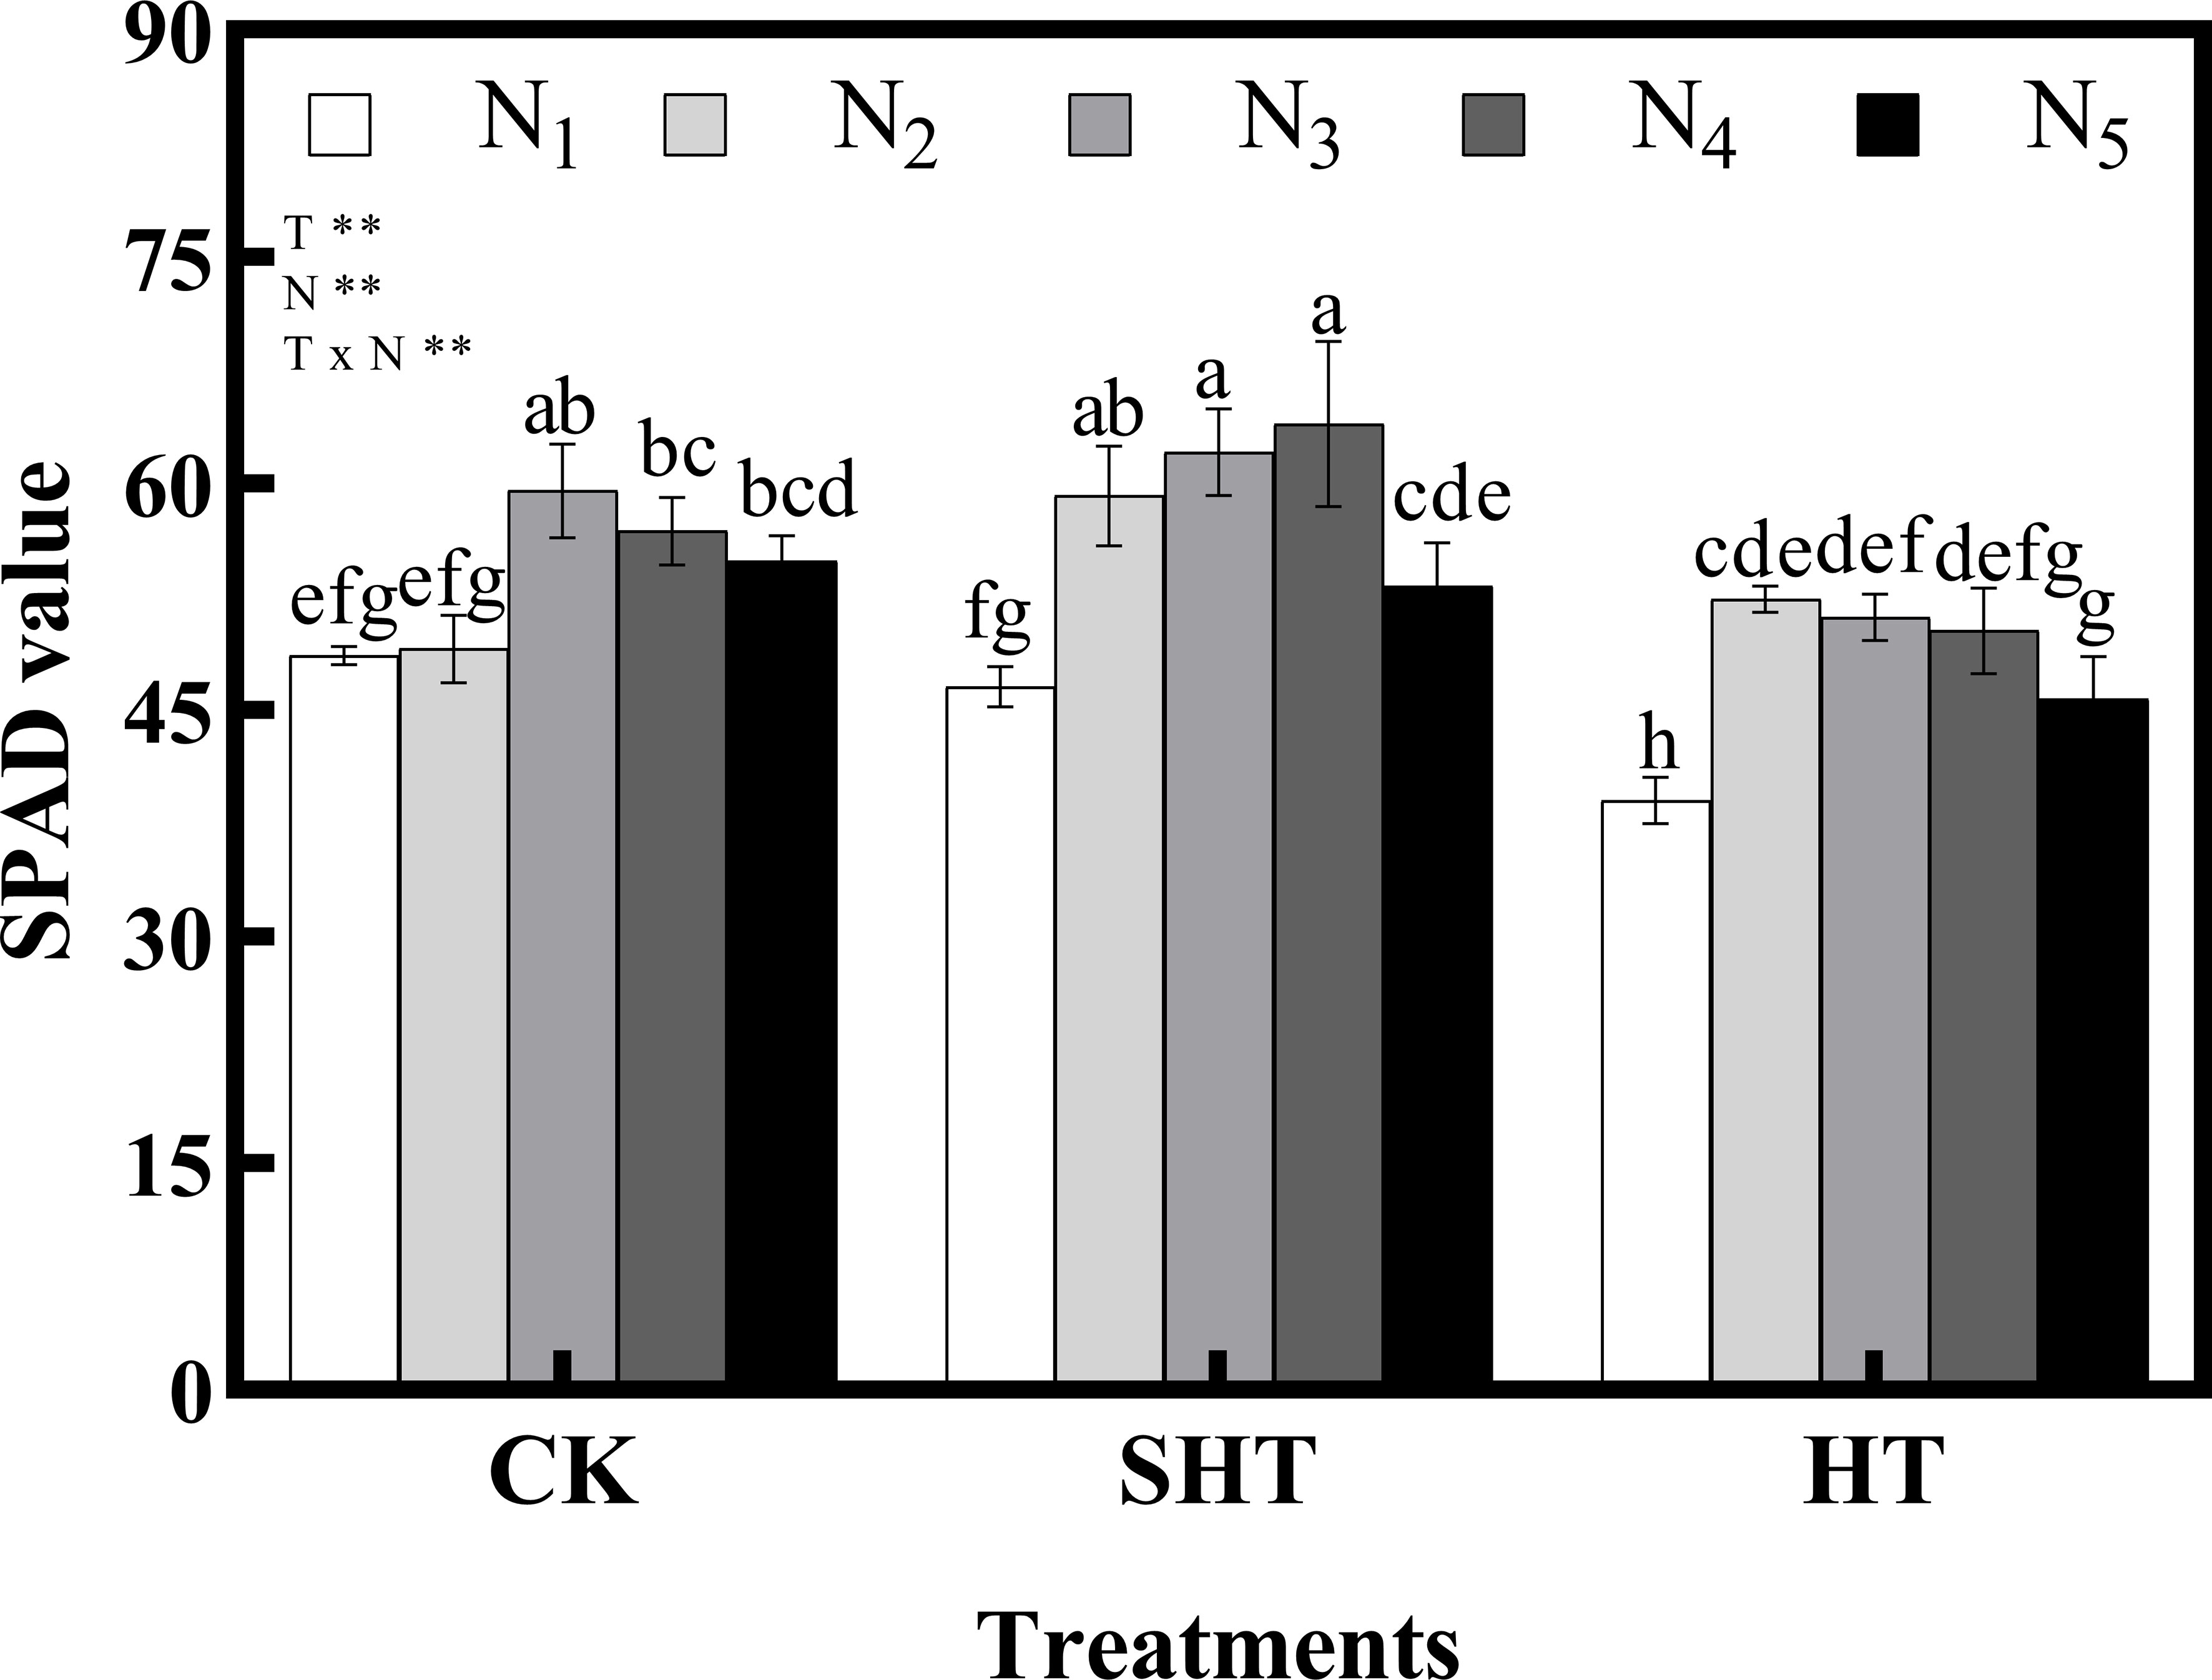
Figure 1 Effects of nitrogen application on SPAD value of tomato leaves under high-temperature stress. Different lowercase letters indicate significant differences among treatments at the P< 0.05 level by Duncan’s test. CK, SHT and HT are the control, sub-high temperature and high temperature treatment, respectively. T, temperature; N, nitrogen. Values are mean ± SD (n = 3). ** indicates significance at P ≤ 0.01.
3.2 Response of nitrogen application on nitrogen metabolism and nutrients to high-temperature stress
The responses of nitrogen application on nitrogen metabolism and nutrients to HT stress were shown in Figure 2. The NR, GS, soluble protein, and free amino acids in CK were significantly greater than in HT but were lower than in SHT, without nitrogen application. Appropriate nitrogen application significantly increased the contents of NR, GS, soluble protein, and free amino acids in the leaves of tomato plants. The NR, GS, soluble protein and free amino acids were highest in CKN3, SHTN3, and HTN2, respectively. Compared to CKN3, the activity of NR and GS was greater than HTN2, whereas was significantly reduced by 21.26% and 17.14%, respectively, under SHTN3. Similar to NR and GS, free amino acids decreased significantly by 11.91% in HTN2 but improved significantly by 2.19% in SHTN3. Soluble protein under CKN3 was 14.90% lower than that of SHTN3. However, for soluble protein, there was no significant difference between CKN3 and HTN2 treatments.
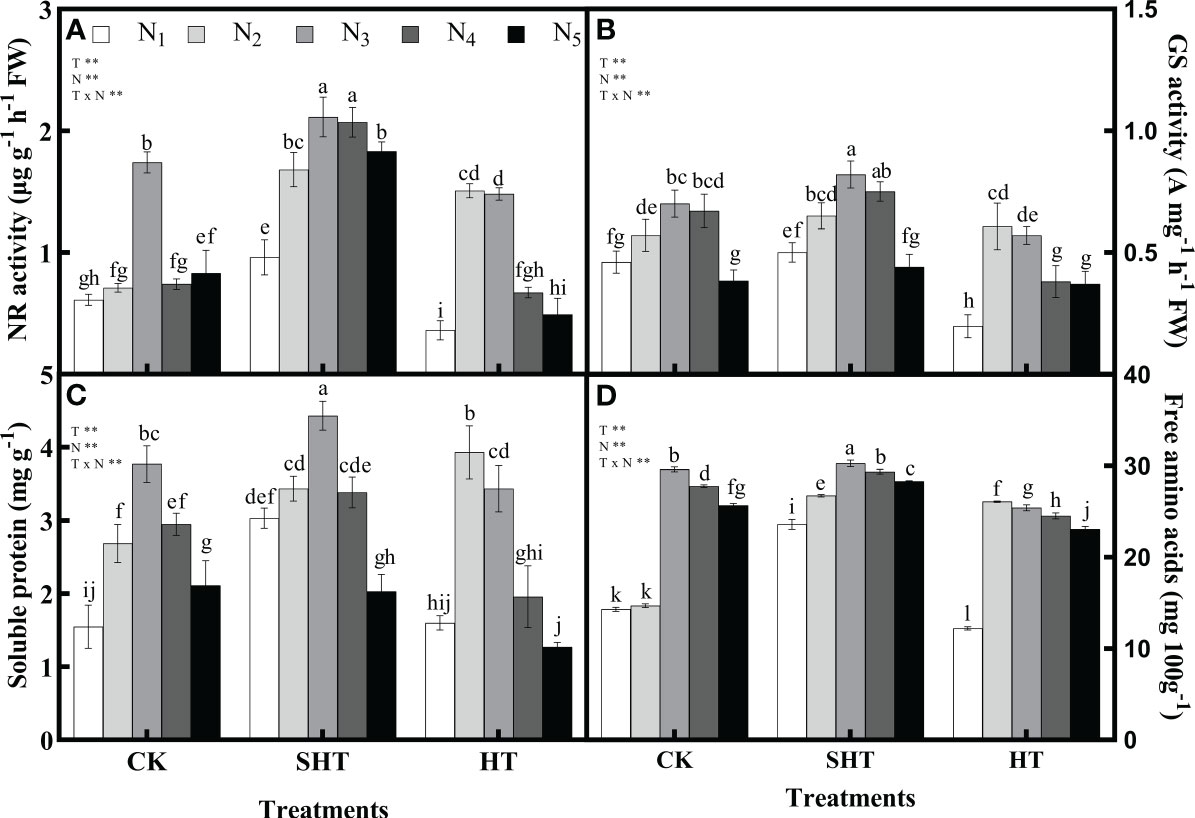
Figure 2 Effects of nitrogen application on the nitrate reductase (NR) activity (A), glutamine synthetase (GS) activity (B), soluble protein (C), and free amino acids (D) in tomato leaves under high-temperature stress. Different lowercase letters indicate significant differences among treatments at the P< 0.05 level by Duncan’s test. CK, SHT and HT are the control, sub-high temperature and high temperature treatment, respectively. T, temperature; N, nitrogen. Values are mean ± SD (n = 3). ** indicates significance at P ≤ 0.01.
3.3 Effects of nitrogen application on morphological characters under high-temperature stress
HT stress was reflected in the morphological characters (Table 3). Without nitrogen application, compared to CK, the plant height growth, stem diameter growth, main root length, and LAI were inhibited under HT, whereas were improved under SHT. Nitrogen application significantly affected the morphological characters of tomato plants under high-temperature stress. The plant height growth in CK increased with the increase of N1-N3, while they decreased with a further increase of N4-N5. Maximum plant height growth occurred at CKN3, SHTN4, and HTN3, respectively. Similarly, stem diameter growth was the highest in CKN3, SHTN3, and HTN3. The stem diameter growth in the CKN3 was greater than that of the HTN3, while significantly decreasing by 57.89% under the SHTN3. The main root length and LAI also had appropriate nitrogen application under different temperature treatments. Compared to CK, the maximum main root length and LAI were significantly reduced by 6.76% and 20.29%, respectively, under HT conditions. In contrast, these two indicators under SHT were significantly increased by 3.72% and 50.72%, respectively, compared to the CK group.
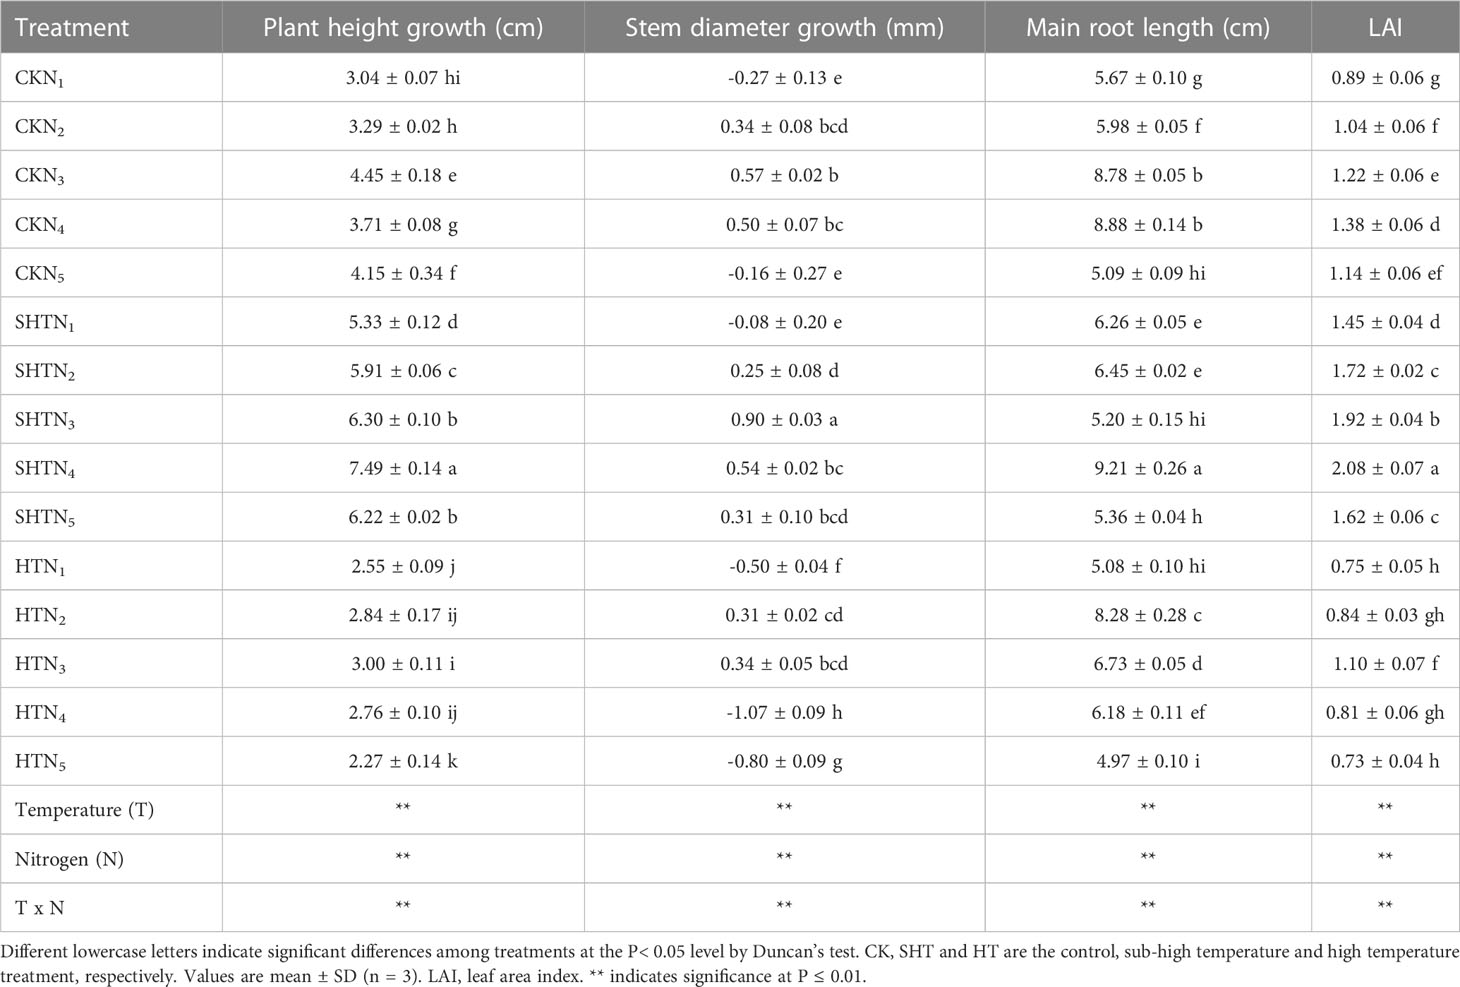
Table 3 Effects of nitrogen application on morphological characters of tomato leaves under high-temperature stress.
3.4 Response of nitrogen application on fruit quality to high-temperature stress
The effects of nitrogen application on fruit shape index, fruit hardness, and yield of tomatoes under HT stress were shown in Table 4. The fruit shape index showed no significant difference among treatments of N2-N3 except N4-N5. However, fruit hardness was no significant difference among different temperature treatments. The yield in CK was significantly greater than in HT but was no significant difference in SHT, without nitrogen application. Appropriate nitrogen application could enhance high-temperature stress tolerance. The yield was the highest in N4 under CK and SHT treatment, while the highest occurred at N2 under HT treatment. Compared to HTN2, the yield was significantly increased by 104.54% and 110.04%, respectively, for CKN4 and SHTN4 treatments.
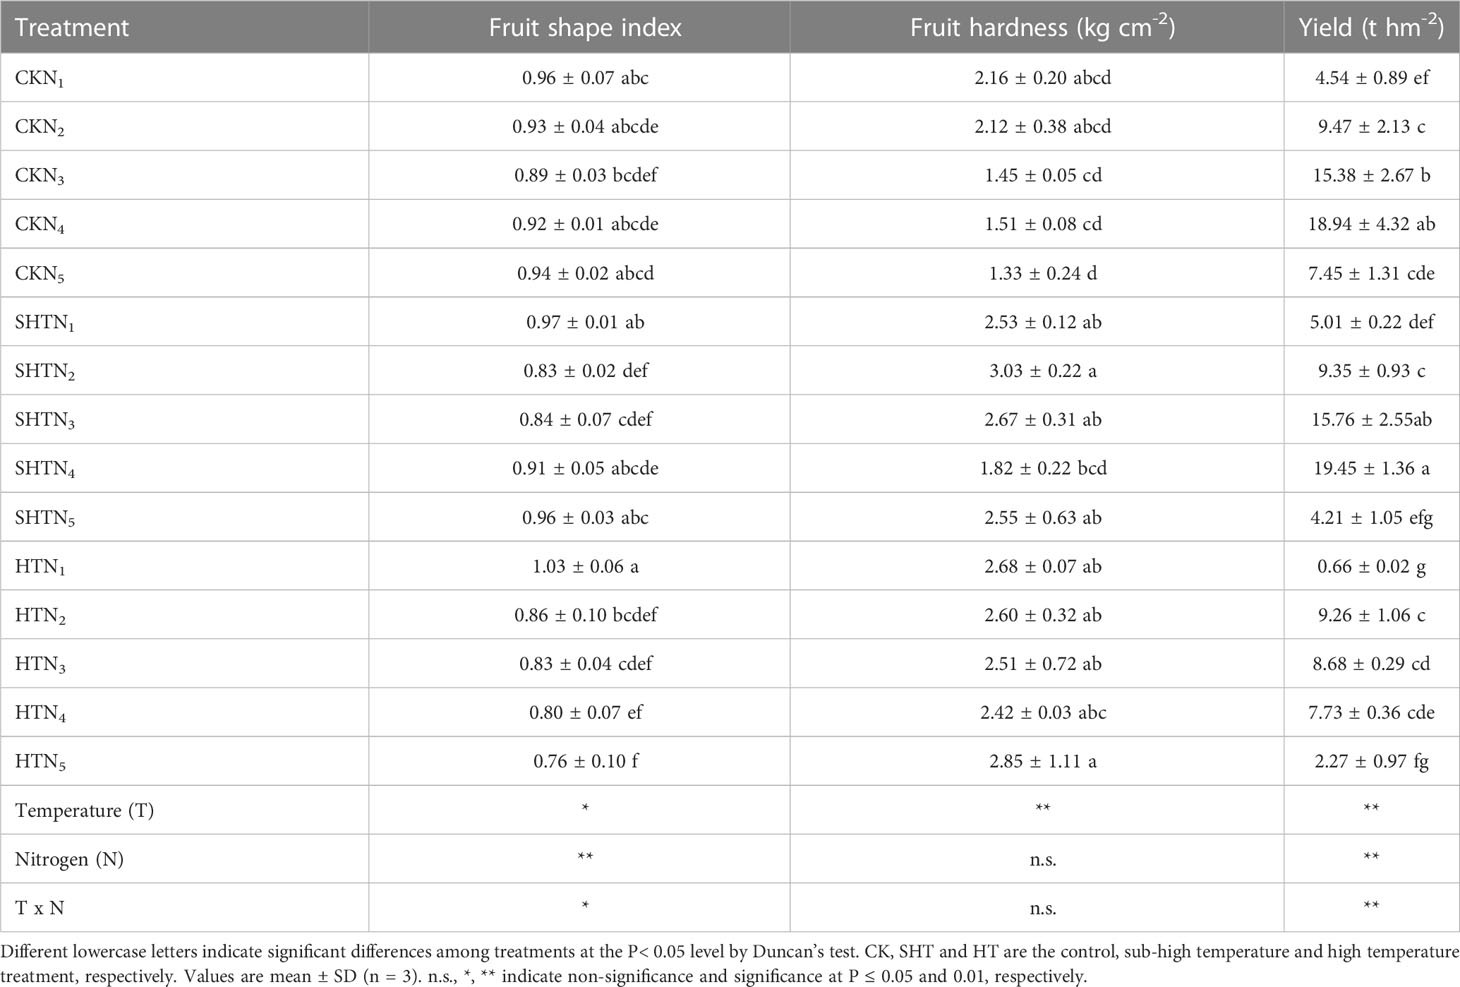
Table 4 Effects of nitrogen application on external quality of tomato fruit under high-temperature stress.
HT stress inhibited the intrinsic quality of tomato fruit, while nitrogen application could significantly reduce the negative effects of HT stress (Figure 3). The VC, soluble sugar, lycopene, and soluble solids in CK and SHT increased with the increase of N1-N4, while they decreased with a further increase of N5. However, these four indicators in HT increased with the increase of N1-N3, while they decreased with a further increase of N4-N5. Maximum VC occurred at N4, N4, and N3, respectively, for CK, SHT, and HT conditions. Compared to CKN4, the VC was significantly decreased by 17.68% and 20.47%, respectively, for SHTN4 and HTN3 treatments. Similarly, the contents of soluble sugar, lycopene, and soluble solids in the SHT and HT groups were lower than those of the CK group. On the contrary, the titratable acid and NO3- were lowest in N3/N4, N3/N4, and N2/N3, respectively, for CK, SHT, and HT conditions. However, minimum titratable acid and NO3- were no significant differences among treatments.
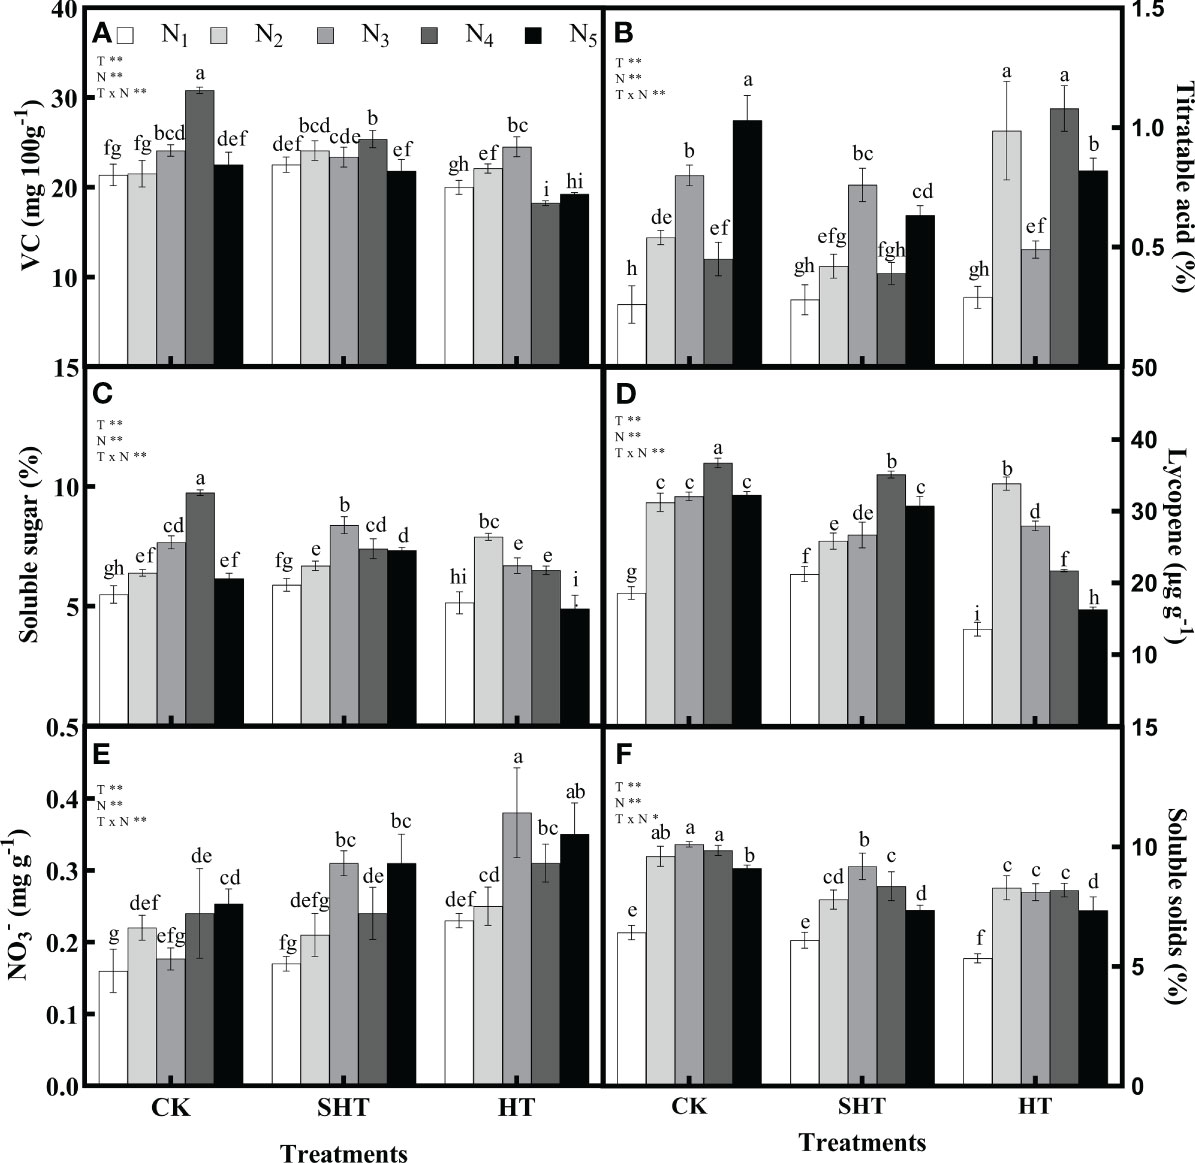
Figure 3 Effects of nitrogen application on the Vitamin C (VC; A), titratable acid (B), soluble sugar (C), lycopene (D), nitrate (NO3-; E), and soluble solids (F) of tomato fruit under high-temperature stress. Different lowercase letters indicate significant differences among treatments at the P < 0.05 level by Duncan's test. CK, SHT and HT are the control, sub-high temperature and high temperature treatment, respectively. T, temperature. N, nitrogen. Values are mean ± SD (n = 3). ** indicates significance at P ≤ 0.01.
3.5 Comprehensive evaluation of tomato yield, fruit quality, and related traits under different treatments
3.5.1 Correlation analysis between different traits
Figure 4 showed that there were different degrees of positive and negative correlations between the trait indicators of the different treatments. The absolute values of the correlation coefficients for most indicators ranged from 0.60 to 0.98. Gas exchange parameters and SPAD value were highly significantly correlated (P<0.01), with the absolute values of the correlation coefficients ranging from 0.60 to 0.98. It can be assumed that the gas exchange parameters and SPAD value provide 60% to 98% of the common information. Similarly, indicators of nitrogen metabolism and nutrients had a highly significant positive correlation, providing 61% to 81% of the common information. The majority of morphological characters showed highly significant positive correlations, with correlation coefficients ranging from 0.45 to 0.59. Furthermore, the correlation coefficients for yield, VC, soluble sugar, soluble solids, and lycopene among the fruit quality varied from 0.47 to 0.77, giving 47% to 77% of the common information.
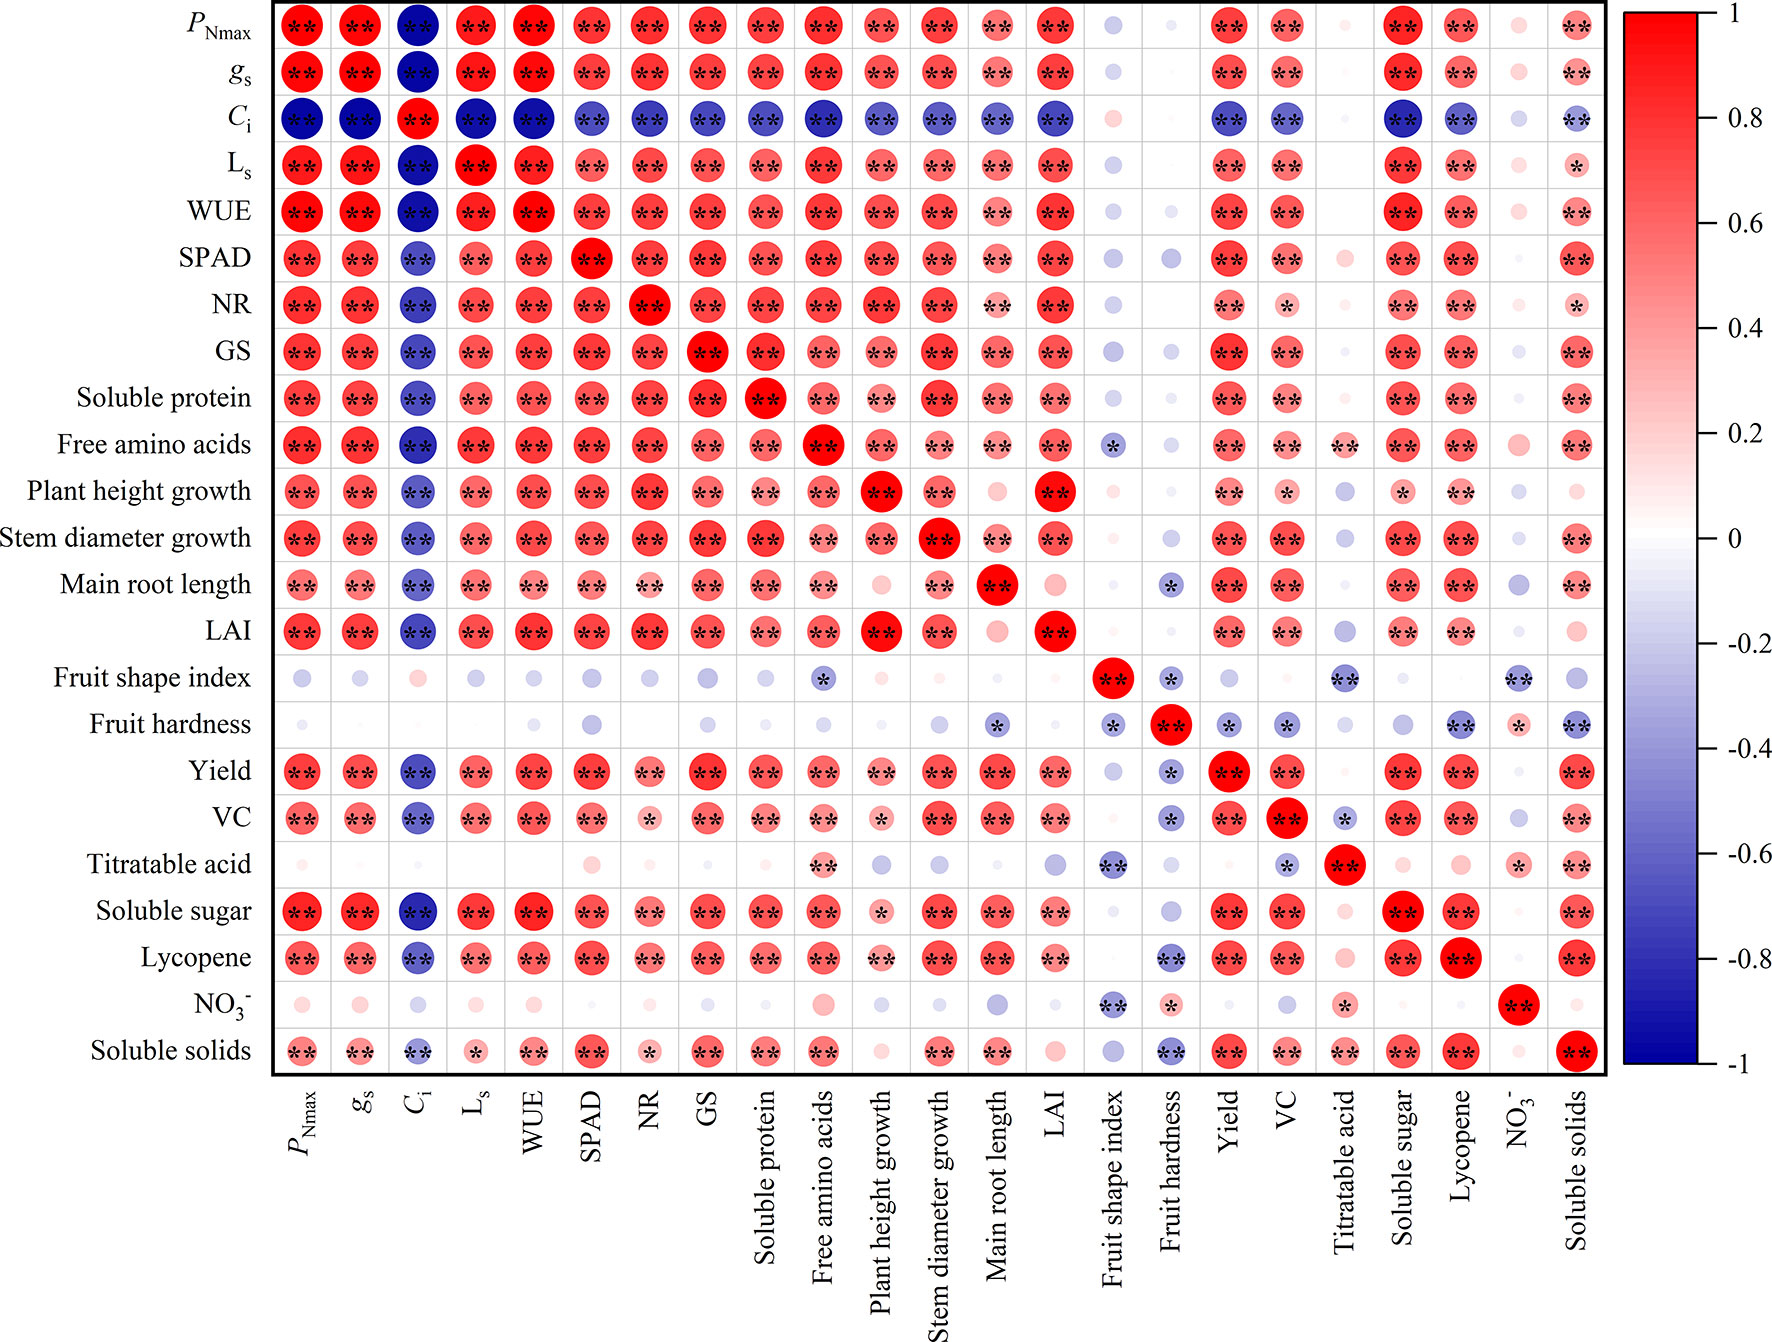
Figure 4 Correlation analysis among leaves and fruit indexes of tomato (n = 45). PNmax, the maximum net photosynthetic rate. gs, stomatal conductance. Ci, carbon dioxide concentration. LS, stomatal limit value. WUE, water-use efficiency. NR, nitrate reductase. GS, glutamine synthetase. LAI, leaf area index. VC, Vitamin C; NO3-, nitrate. * and ** indicate the statistical significance exceeding 95% and 99%, respectively.
The 23 indicators measured contained a great deal of information and were highly correlated with each other. However, they were not suitable for determining indicators of nitrogen regulation under HT stress. Therefore, a principal component analysis was introduced to reduce the number of indicators to a few aggregated indicators for further analysis, without losing too much information.
3.5.2 Principal component and fitting analysis
The principal component analysis of the 23 indicators showed that the cumulative variance contribution of the first four components had reached 86.255%, satisfying the principle of eigenvalues greater than 1 and cumulative contribution greater than 85% (Table 5). Table 5 showed that the first principal component could characterize 58.676% of the information, with PNmax, WUE, gs, Ci, Ls, SPAD value, GS, soluble sugar, yield, stem diameter growth, NR, free amino acids, soluble protein, LAI, and lycopene having larger absolute values of the eigenvectors. PNmax is the strongest indicator of photosynthesis and has the largest eigenvector, containing information common with gs, WUE, Ci, Ls, and SPAD value. Thus, PNmax was selected. GS can represent NR, free amino acids, and soluble protein as an indicator of the strength of nitrogen metabolism and be therefore selected. Similarly, yield, stem diameter growth, soluble sugar, and lycopene were selected. The larger absolute values of eigenvectors in the second principal components were fruit shape index, NO3- and titratable acid. However, the third and fourth principal components were fruit hardness and soluble solids, plant height growth and main root length, respectively.
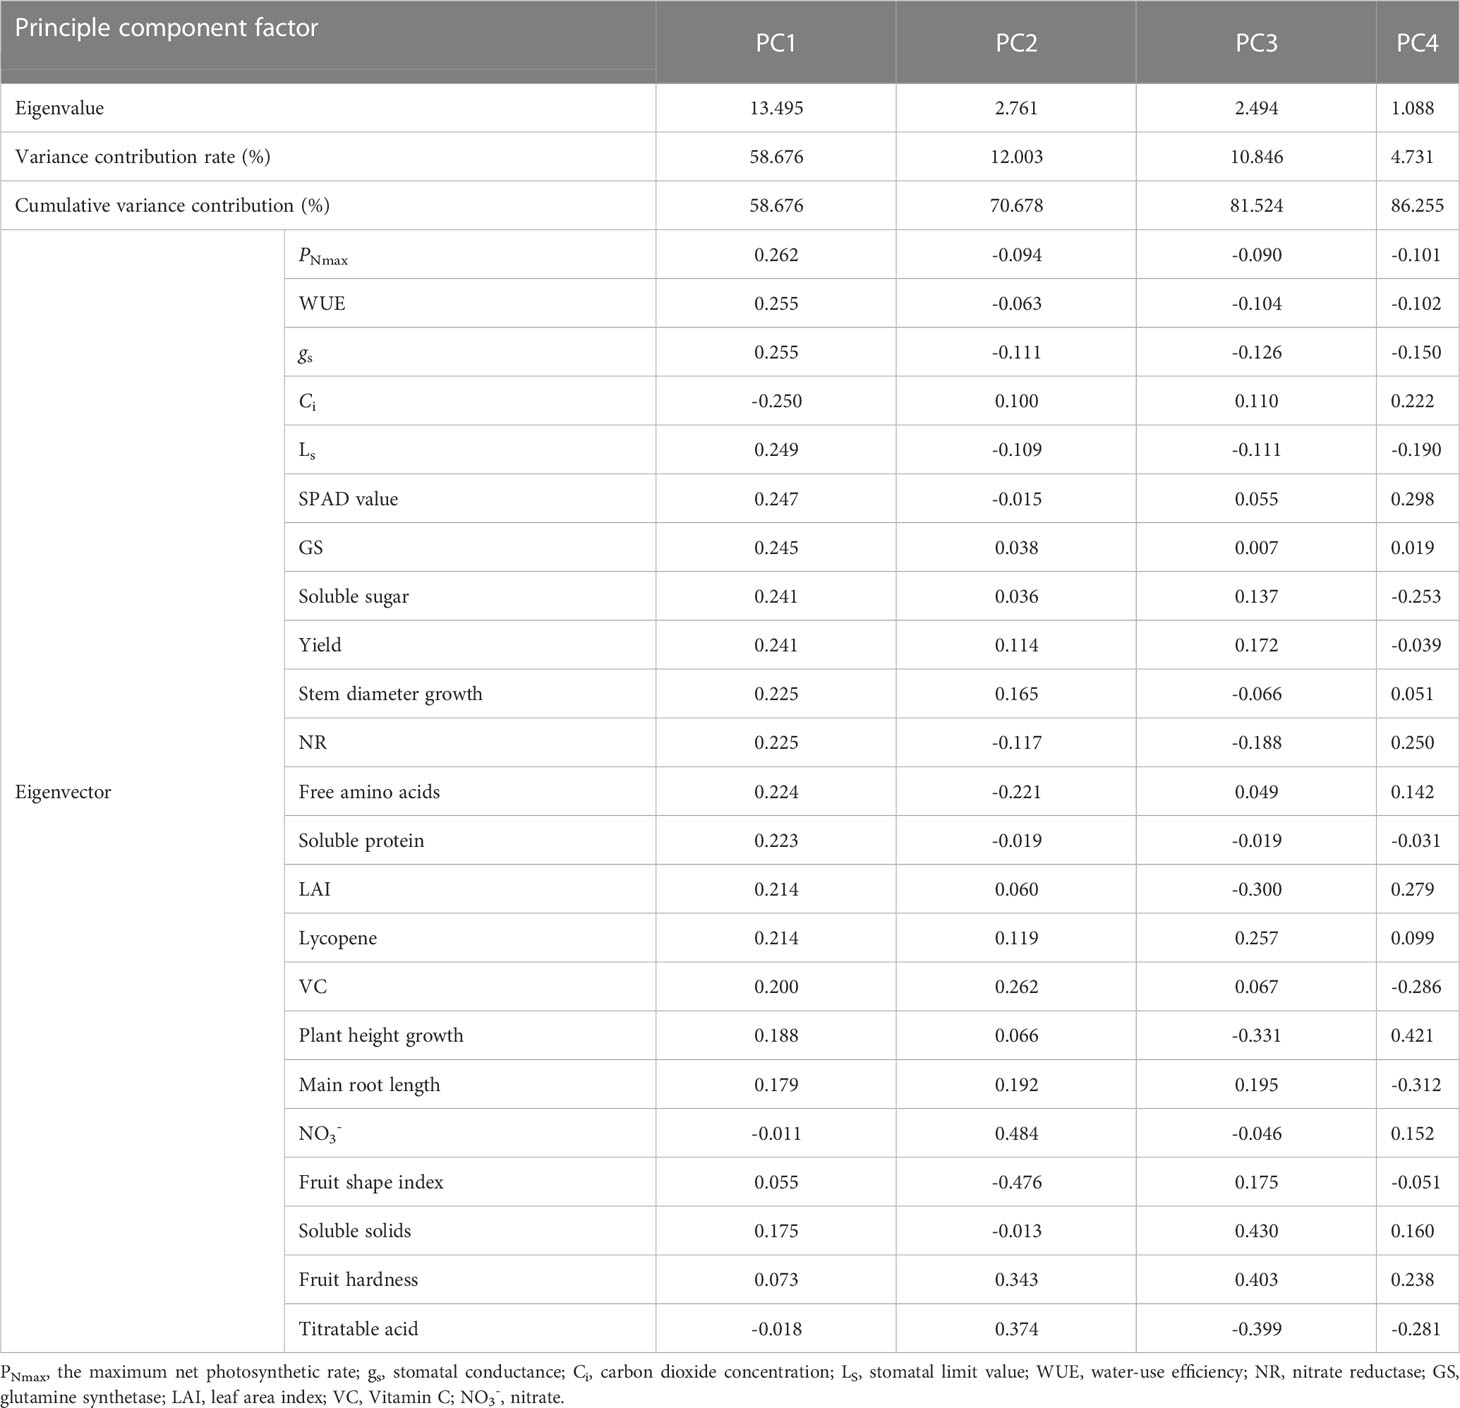
Table 5 Contribution rate of principle components and eigenvectors of each index.
Although the four principal components above combined most of the indicator information, the characteristic information overlapped to some extent, and the number of input parameters was large. Therefore, further screening was needed. PNmax, yield, soluble sugar, GS, stem diameter growth, and lycopene were selected to construct the CI, considering the correlation, the contribution of principal component analysis and eigenvectors, the biological significance of the indicators and the ease of determination.
Soluble sugar, GS, yield, PNmax, stem diameter growth, and lycopene were again subjected to principal component analysis and the eigenvectors obtained were 0.419, 0.417, 0.416, 0.413, 0.400, and 0.384, respectively (Table 6). The standardized indicators and eigenvectors were used to CI under different treatments.
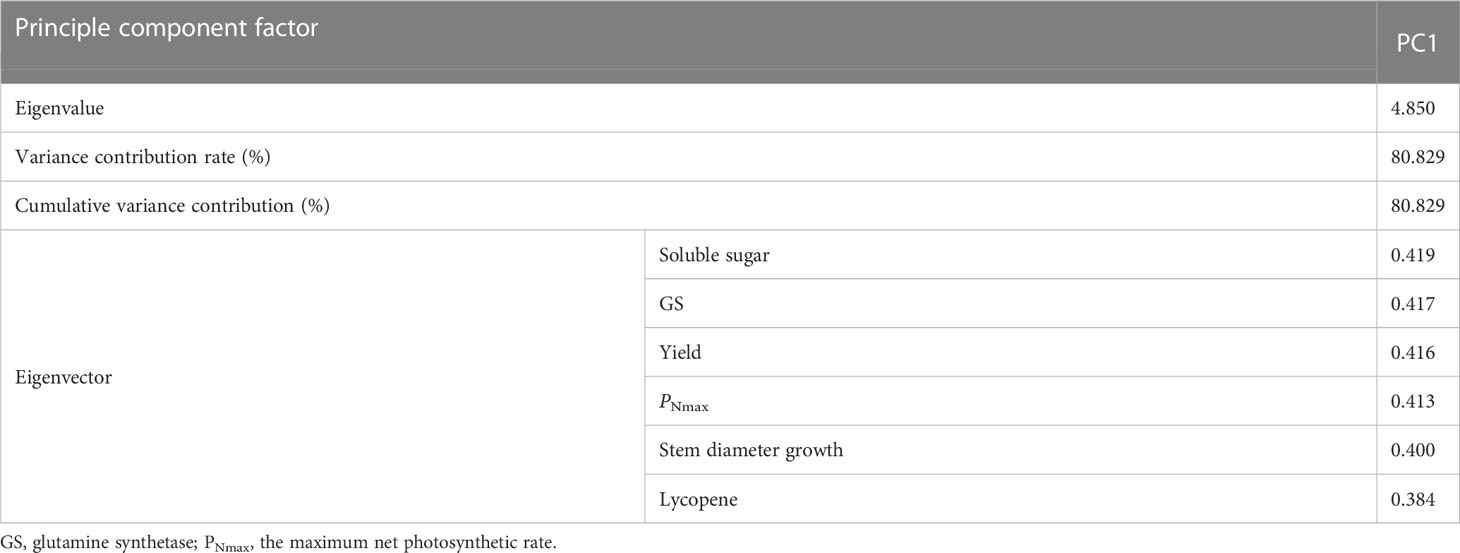
Table 6 Contribution of principal components and eigenvectors of each index after the secondary screening.
The CI was highest at moderate nitrogen application under different temperatures, decreasing at low and high nitrogen applications (Figure 5). The response fits the regression models:
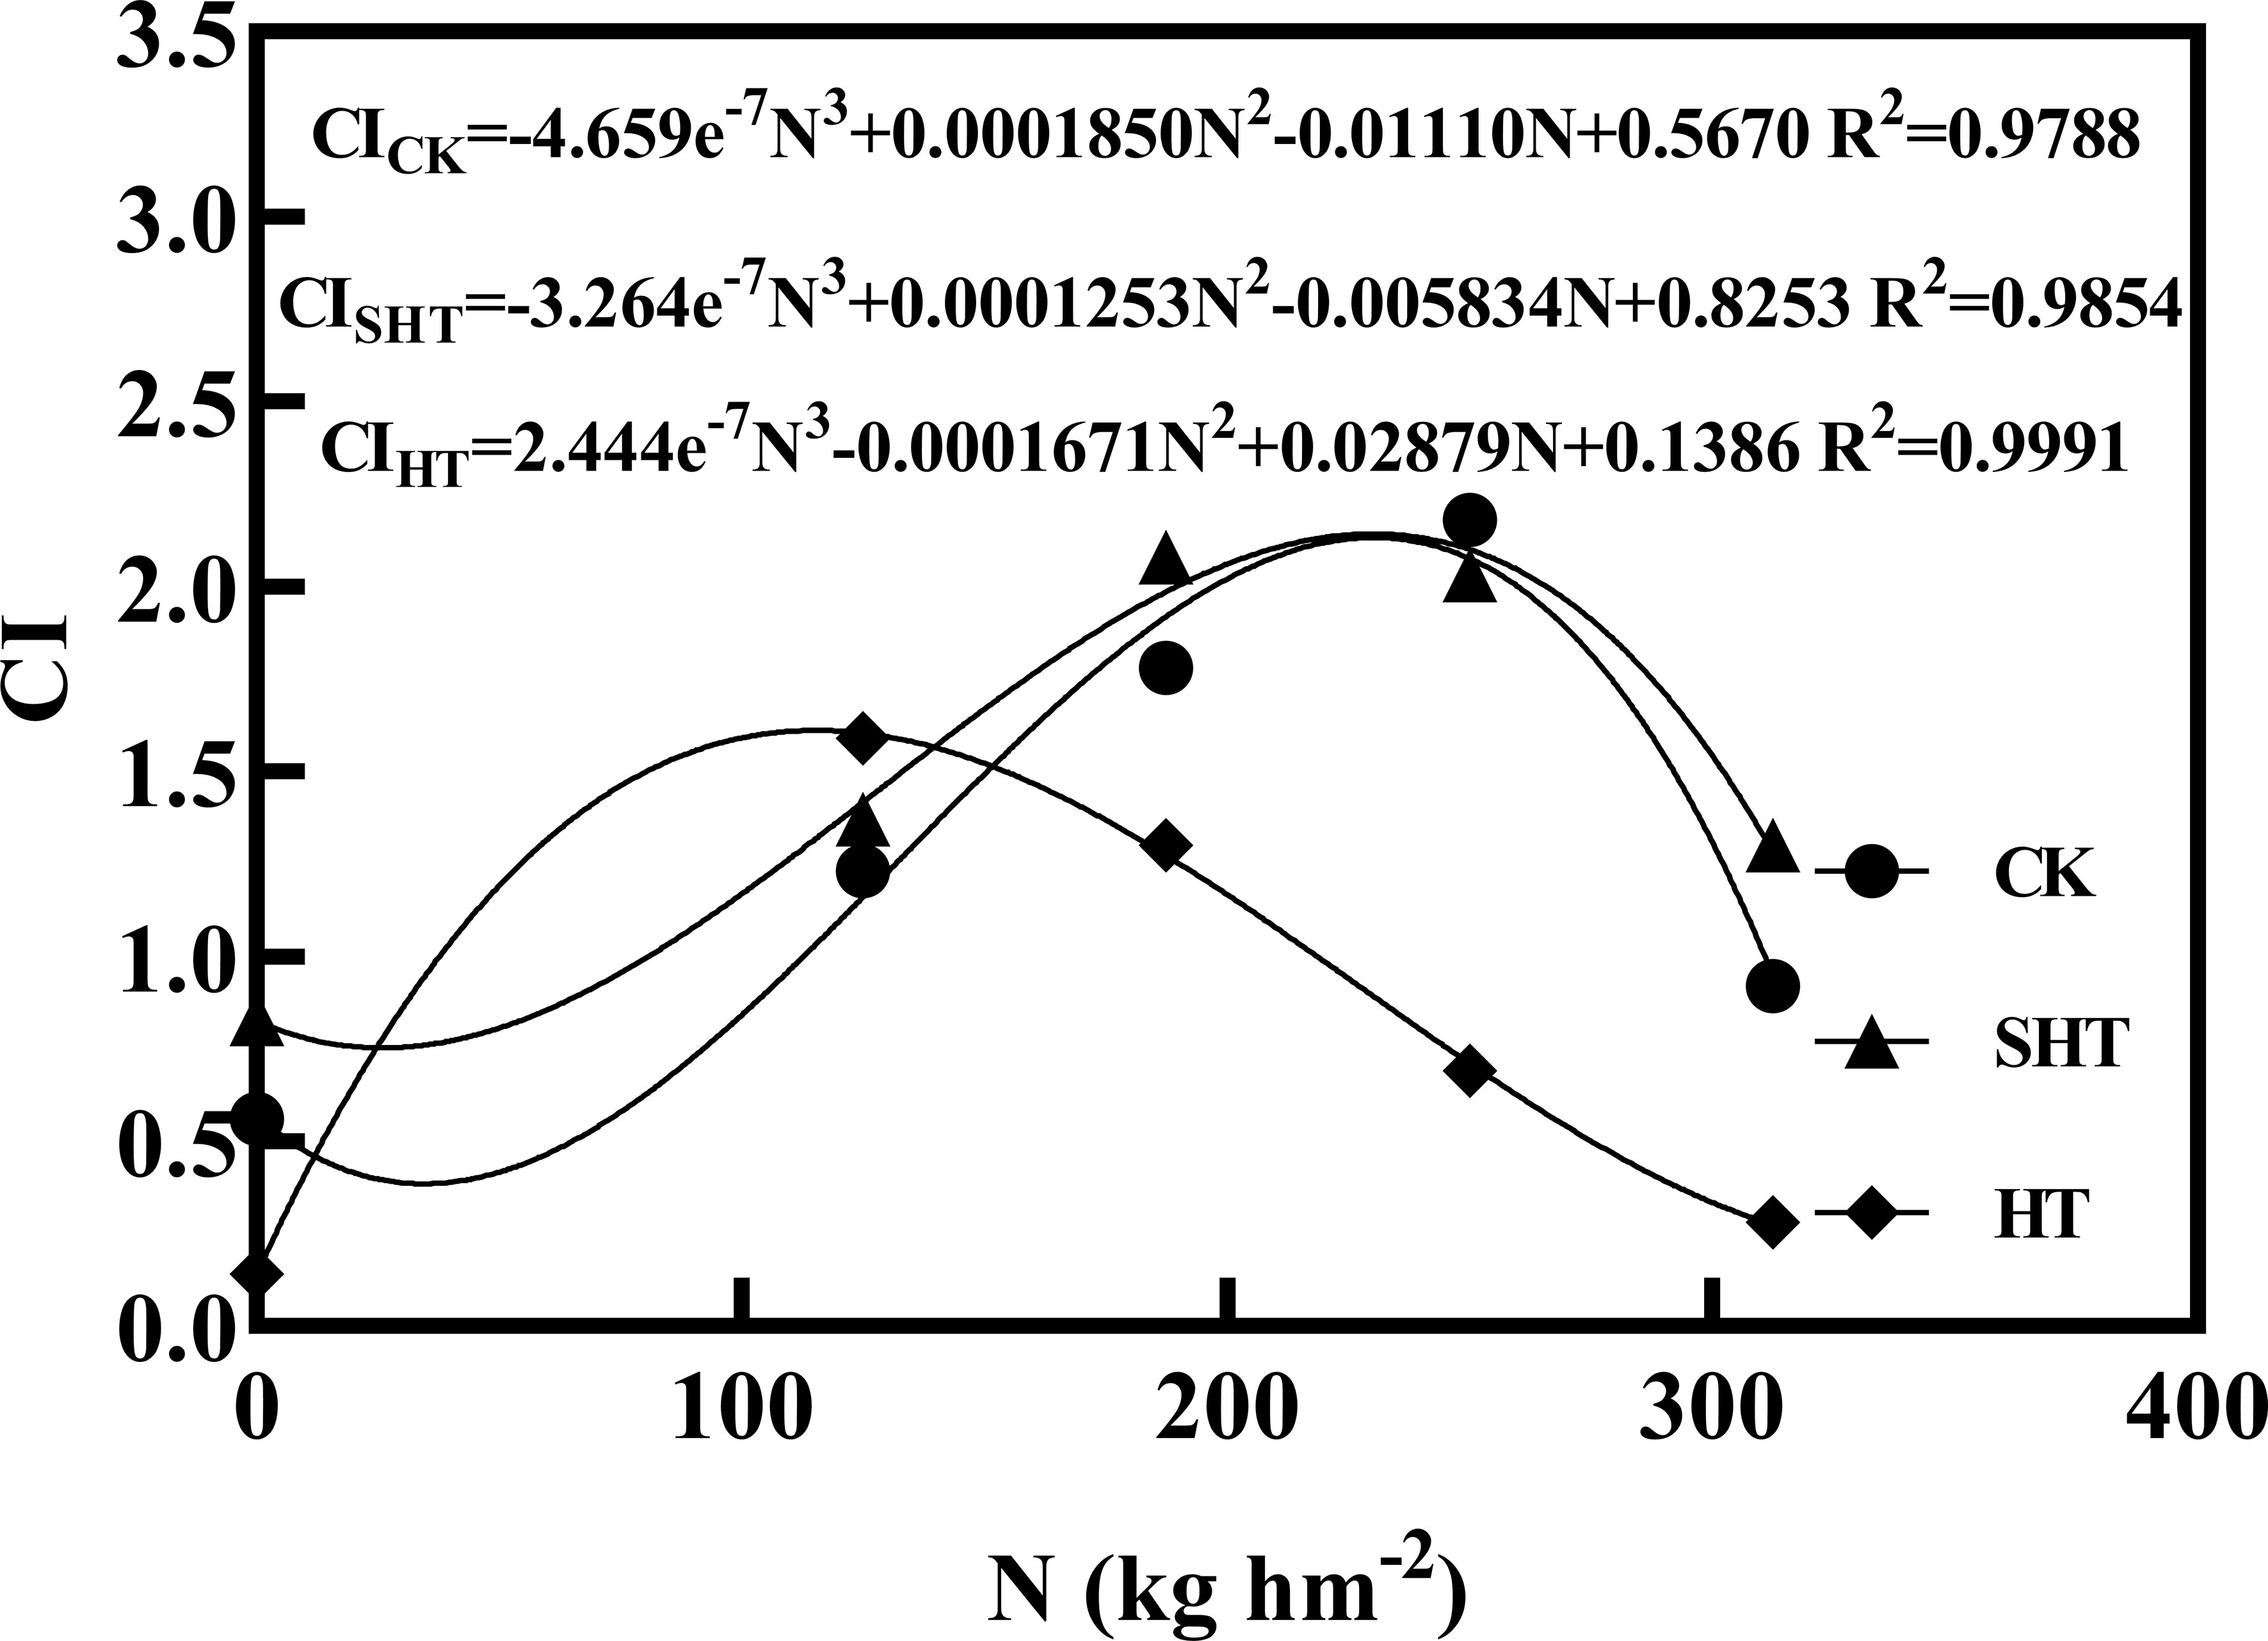
Figure 5 Comprehensive value (CI) of tomatoes as affected by nitrogen application under high-temperature stress. CK, SHT and HT are the control, sub-high temperature and high temperature treatment, respectively. N, nitrogen. R2, coefficient of determination.
Based on the regression equations, the highest CI of CK, SHT, and HT were obtained at the nitrogen of 230.23 kg hm2 (N3-N4), 230.02 kg hm2 (N3-N4), and 115.32 kg hm2 (N2), respectively.
4 Discussion
High temperature is one of the main disasters affecting the growth, yield, and fruit quality of plants (Mathur et al., 2014). The effect of high-temperature stress on plants receives more attention as the frequency and intensity of high-temperature stress increase globally (IPCC, 2021). Nitrogen plays an important role in plant growth, development, and yield. Appropriate nitrogen application can significantly improve high-temperature stress tolerance (James et al., 2018). In this study, we explored how nitrogen affects tomato plants under high-temperature stress.
First, short-term high-temperature stress affects the photosynthetic process of tomato leaves. Photosynthesis is one of the most fundamental metabolic activities in plants (Yin et al., 2006). The PNmax was inhibited under high-temperature (HT) stress, accompanied by different declines of gs, Ls, and WUE (Table 2). However, Ci increased, which indicated that the decrease was due to non-stomatal limitation and mainly resulted from photosystem damage, and inhibition of ribulose bisphosphate (Rubisco) (Farquhar and Sharkey, 1982; Liu et al., 2013). In addition, HT also significantly decreased the SPAD value of tomato leaves (Figure 2), which reflected that the chloroplast development and photosynthetic performance were inhibited (Lu et al., 2019). Interestingly, short-term sub-high temperature (SHT) stress had positive impacts on the photosynthetic process, which was characterized by higher PNmax, gs, Ls, WUE, SPAD value, and lower Ci, compared to CK. The SHT may improve chloroplast and cytoplasmic structure. Consequently, the Rubisco carboxylation activities and ribulose diphosphate (RuBP) carboxylation regeneration ability increased, thereby maintaining higher photosynthetic efficiency (Dias and Brüggemann, 2010; Han et al., 2019; Li et al., 2020). Nitrogen has positive impacts on photosynthetic reactions (Hamner, 1936; Liu et al., 2013; Ru et al., 2022). Appropriate nitrogen application not only can alleviate the damage of Chl-containing structure and function by high-temperature stress but also maintain the photosynthetic capacity of chloroplasts under high-temperature stress. In our study, maximum PNmax, gs, Ls, WUE, and SPAD value occurred at N2 under HT treatments. Similarly, these photosynthetic parameters were the highest in N3, for CK and SHT stress. High-temperature stress was the main cause of the decrease in photosynthetic rate when nitrogen was overused, which was similar to the result of Han et al. (2019).
Second, nitrogen metabolism is tightly associated with nitrogen uptake and photosynthesis and is also closely related to the ultimate life state of the plants, such as growth and development under stress conditions (Xu and Zhou, 2006; Liu et al., 2013; Shu et al., 2016). In this study, short-term HT stress significantly hampered nitrogen metabolism, which further influenced the content of nutrients (Figure 2). Previous studies suggested that the decrease in nitrogen metabolism was due to the increase of NH4+ accumulation in plants, which hindered ammonia assimilation and ATP synthesis required for nitrate (Crawford and Glass, 1998; Yuan et al., 2017). However, under short-term SHT stress, the content of soluble protein and free amino acids increased in tomato leaves, accompanied by different improvements in the activity of NR and GS. These results showed that short-term SHT stress could stimulate enzyme activity in plants. Appropriate nitrogen can effectively enhance the high-temperature tolerance of tomato plants. The findings had also been confirmed on wheat (Ru et al., 2022), cotton (Iqbal et al., 2020), etc. In this study, NR, GS, soluble protein, and free amino acids were the highest in N3-N4, N3-N4, and N2-N3, respectively, for CK, SHT, and HT stress.
Third, plant morphology is also significantly affected by high-temperature stress (Źróbek-Sokolnik, 2012; Fahad et al., 2016). The plant height growth, stem diameter growth, main root length, and LAI were remarkably declined in tomatoes (Table 3), which were recognized as sensitive to HT stress. In contrast, short-term SHT stress improved plant morphology. An early study indicated that the maintenance of normal transfer and distribution of photosynthetic products in tomatoes ensured plant growth and development (Xu et al., 2020). Plant morphology changed with nitrogen levels (Boussadia et al., 2010; Bhuvaneswari et al., 2014; Razaq et al., 2017). For example, the results of LAI were consistent with those of previous studies, which found that moderate nitrogen with increased LAI (Meier and Leuschner, 2008). In addition, appropriate nitrogen can effectively alleviate the symptoms brought by high-temperature stress. The high LAI of appropriate nitrogen under high-temperature stress was caused by the increase of the photosynthetic rate during growth and the increase of facilitating nutrient uptake.
Therefore, tomato plants are affected by many factors. The fruit quality is also sensitive to changes in the environment (Gajc-Wolska et al., 2008; Alenazi et al., 2020). In our study, under HT stress, the yield and intrinsic fruit quality were both significantly decreased (Table 4; Figure 3). This result was also consistent with Hernández et al. (2022). Although the intrinsic quality was also obviously reduced after SHT stress, which was characterized by lower VC, soluble sugar, lycopene, and soluble solids, SHT stress had an improvement in yield. These results indicated that short-term SHT stress maintained higher photosynthetic efficiency and nitrogen metabolism to uptake nutrients, thereby maintaining the high growth and yield of tomatoes. However, high yield is not always conducive to good fruit quality (Sansavini and Corelli-Grappadelli, 1996). Appropriate nitrogen can effectively enhance the heat stress tolerance of plants (Iqbal et al., 2020). On one hand, moderate nitrogen can increase the absorbance of light energy by increasing the leaf area, thus increasing the rate of photosynthesis (Fois et al., 2009; Gautam et al., 2021). On the other hand, it can enhance the activities of nitrogen metabolism via higher photosynthesis, causing enough nutrients, which in turn increases the yield and fruit quality (Nava et al., 2007; Ru et al., 2022). Consequently, the highest yield and fruit quality occurred at N3-N4, N3-N4, and N2-N3, respectively, for CK, SHT, and HT stress.
Temperature and nitrogen interaction affects fruit development and quality through the regulation of various plant physiological processes. For example, temperature and nitrogen interaction might regulate the balance between vegetative and reproductive growth in plants. Additionally, the interaction between nitrogen and temperature might influence the activity of enzymes involved in the biosynthesis of plant hormones such as auxins and cytokinins, which play a critical role in fruit development and quality (Ding et al., 2013). The production and signaling of reactive oxygen species (ROS) in plants have been shown to influence fruit development and quality (Tian et al., 2013). Therefore, temperature and nitrogen interaction might influence fruit development and quality via ROS production and signaling. In summary, the mechanism of nitrogen and temperature interaction in co-regulating fruit development and quality involves the regulation of several physiological processes such as plant metabolic rate, gene expression, and hormone signaling, which collectively influence fruit growth, development, and quality.
Principal component analysis is a very useful method for evaluating objects that are influenced by many factors (Wold et al., 1987). Previous studies had demonstrated that using this method to make comprehensive evaluations was feasible (Shi et al., 2021; Xu et al., 2021). According to our results, PNmax, yield, soluble sugar, GS, stem diameter growth, and lycopene were selected to construct the CI (Table 6). PNmax plays a vital role in photosynthesis (Xu et al., 2013). Meanwhile, GS is tightly associated with some fundamental processes, including nitrogen uptake and photosynthesis (Thum et al., 2003). Soluble sugar is considered an important factor in the fruit quality and anti-adversity of plants, and it is mainly accumulated by photosynthesis (Wahid et al., 2007). Additionally, lycopene also can reflect the intrinsic fruit quality due to the pigment principally responsible for the characteristic deep-red color of ripe tomato fruits, and it also acts as a natural antioxidant (Shi and Maguer, 2000). Therefore, these six indicators could be used to construct the CI to respond to the effects of nitrogen application under high-temperature stress. Based on the CI, the tomato growth, yield, and fruit quality were the highest in 230.23 kg hm2 (N3-N4), 230.02 kg hm2 (N3-N4), and 115.32 kg hm2 (N2), respectively, at CK, SHT, and HT stress, which can provide scientific contributions for higher yield and better fruit quality of tomato plants in the greenhouse.
5 Conclusions
In this study, the growth, yield, and fruit quality of tomato plants were inhibited by short-term high-temperature (HT) stress. However, sub-high temperature (SHT) stress improved growth and yield whereas fruit quality was reduced. Appropriate nitrogen application could enhance the HT stress tolerance of tomato plants. The PNmax, gs, LS, WUE, NR, GS, soluble protein, and free amino acids were the highest in CKN3, SHTN3, and HTN2, respectively, whereas Ci, was the lowest. Maximum SPAD value, plant height growth, stem diameter growth, main root length, LAI, yield, VC, soluble sugar, lycopene, and soluble solids occurred at N3-N4, N3-N4, and N2-N3, respectively, for CK, SHT, and HT. The appropriate nitrogen maintained higher photosynthetic efficiency, nitrogen efficiency, and protein synthesis, thereby maintaining the high yield and quality of tomato plants. This study suggested that the optimum nitrogen application for tomato growth, yield, and fruit quality was 230.23 kg hm2 (N3-N4), 230.02 kg hm2 (N3-N4), and 115.32 kg hm2 (N2), respectively, at CK, SHT, and HT stress.
Data availability statement
The original contributions presented in the study are included in the article/Supplementary Material. Further inquiries can be directed to the corresponding author.
Author contributions
JL: Methodology, Data curation, Software, Formal analysis, Writing-original draft. ZY: Conceptualization, Methodology, Validation, Supervision, Writing-original draft. FZ: Methodology, Supervision, Writing-review and editing. CL: Supervision, Writing-review and editing. All authors contributed to the article and approved the submitted version.
Funding
This work was supported by the National Natural Science Foundation of China (41975142).
Conflict of interest
The authors declare that the research was conducted in the absence of any commercial or financial relationships that could be construed as a potential conflict of interest.
Publisher’s note
All claims expressed in this article are solely those of the authors and do not necessarily represent those of their affiliated organizations, or those of the publisher, the editors and the reviewers. Any product that may be evaluated in this article, or claim that may be made by its manufacturer, is not guaranteed or endorsed by the publisher.
Supplementary material
The Supplementary Material for this article can be found online at: https://www.frontiersin.org/articles/10.3389/fpls.2023.1172078/full#supplementary-material
References
Alenazi, M. M., Shafiq, M., Alsadon, A. A., Alhelal, I. M., Alhamdan, A. M., Solieman, T. H., et al. (2020). Improved functional and nutritional properties of tomato fruit during cold storage. Saudi J. Biol. Sci. 27 (6), 1467–1474. doi: 10.1016/j.sjbs.2020.03.026
Allakhverdiev, S. I., Kreslavski, V. D., Klimov, V. V., Los, D. A., Carpentier, R., Mohanty, P. (2008). Heat stress: an overview of molecular responses in photosynthesis. Photosynth. Res. 98, 541–550. doi: 10.1007/s11120-008-9331-0
Alvar-Beltrán, J., Dao, A., Dalla Marta, A., Saturnin, C., Casini, P., Sanou, J., et al. (2019). Effect of drought, nitrogen fertilization, temperature and photoperiodicity on quinoa plant growth and development in the sahel. Agronomy 9 (10), 607. doi: 10.3390/agronomy9100607
Ashalley, R. N. (2014). Effectiveness and efficacy of different waxing materials on the quality of cucumber fruits stored under different storage conditions [master's thesis]. (Legon: University of Ghana).
Ashraf, M., Harris, P. (2004). Potential biochemical indicators of salinity tolerance in plants. Plant Sci. 166 (1), 3–16. doi: 10.1016/j.plantsci.2003.10.024
Berry, J., Bjorkman, O. (1980). Photosynthetic response and adaptation to temperature in higher plants. Annu. Rev. Plant Physiol. 31 (1), 491–543. doi: 10.1146/annurev.pp.31.060180.002423
Bertin, N., Guichard, S., Leonardi, C., Longuenesse, J., Langlois, D., Navez, B. (2000). Seasonal evolution of the quality of fresh glasshouse tomatoes under Mediterranean conditions, as affected by air vapour pressure deficit and plant fruit load. Ann. Bot. 85 (6), 741–750. doi: 10.1006/anbo.2000.1123
Bhuvaneswari, G., Sivaranjani, R., Reetha, S., Ramakrishan, K. (2014). Application of nitrogen fertilizer on plant density, growth, yield and fruit of bell peppers (Capsicum annuum l.). Int. Lett. Nat. Sci. 8 (2), 81–90. doi: 10.56431/p-t5jc5t
Birje, P., Kshirsagar, D., Shinde, S. (2020). Performance study of fl hybrids of tomato (Solonum lycopersicum l.). J. Pharmacogn. Phytochem. 9 (5S), 01–03. doi: 10.22271/phyto.2020.v9.i5Sa.12298
Bita, C. E., Gerats, T. (2013). Plant tolerance to high temperature in a changing environment: scientific fundamentals and production of heat stress-tolerant crops. Front. Plant Sci. 4. doi: 10.3389/fpls.2013.00273
Boussadia, O., Steppe, K., Zgallai, H., El Hadj, S. B., Braham, M., Lemeur, R., et al. (2010). Effects of nitrogen deficiency on leaf photosynthesis, carbohydrate status and biomass production in two olive cultivars ‘Meski’and ‘Koroneiki’. Sci. Hortic. 123 (3), 336–342. doi: 10.1016/j.scienta.2009.09.023
Camejo, D., Rodríguez, P., Morales, M. A., Dell’Amico, J. M., Torrecillas, A., Alarcón, J. J. (2005). High temperature effects on photosynthetic activity of two tomato cultivars with different heat susceptibility. J. Plant Physiol. 162 (3), 281–289. doi: 10.1016/j.jplph.2004.07.014
Crawford, N. M., Glass, A. D. (1998). Molecular and physiological aspects of nitrate uptake in plants. Trends Plant Sci. 3 (10), 389–395. doi: 10.1016/S1360-1385(98)01311-9
Dias, M., Brüggemann, W. (2010). Limitations of photosynthesis in phaseolus vulgaris under drought stress: gas exchange, chlorophyll fluorescence and Calvin cycle enzymes. Photosynthetica 48, 96–102. doi: 10.1007/s11099-010-0013-8
Ding, J. G., Chen, B. W., Xia, X. J., Mao, W. H., Shi, K., Zhou, Y. H., et al. (2013). Cytokinin-induced parthenocarpic fruit development in tomato is partly dependent on enhanced gibberellin and auxin biosynthesis. PloS One 8 (7), e70080. doi: 10.1371/journal.pone.0070080
Djanaguiraman, M., Narayanan, S., Erdayani, E., Prasad, P. V. (2020). Effects of high temperature stress during anthesis and grain filling periods on photosynthesis, lipids and grain yield in wheat. BMC Plant Biol. 20, 1–12. doi: 10.1186/s12870-020-02479-0
Du, X. H., Zhou, X. J., Peng, F. R. (2008). Determination and analysis of ammonium assimilation enzyme activities in different organs of tea plants. Non-wood For. Res. 26 (2), 23–28. doi: 10.3969/j.issn.1003-8981.2008.02.005
Ezquer, I., Salameh, I., Colombo, L., Kalaitzis, P. (2020). Plant cell walls tackling climate change: biotechnological strategies to improve crop adaptations and photosynthesis in response to global warming. Plants 9 (2), 212. doi: 10.3390/plants9020212
Fahad, S., Hussain, S., Saud, S., Hassan, S., Ihsan, Z., Shah, A. N., et al. (2016). Exogenously applied plant growth regulators enhance the morpho-physiological growth and yield of rice under high temperature. Front. Plant Sci. 7. doi: 10.3389/fpls.2016.01250
Farquhar, G. D., Sharkey, T. D. (1982). Stomatal conductance and photosynthesis. Annu. Rev. Plant Physiol. 33 (1), 317–345. doi: 10.1146/annurev.pp.33.060182.001533
Fois, S., Motzo, R., Giunta, F. (2009). The effect of nitrogenous fertiliser application on leaf traits in durum wheat in relation to grain yield and development. Field Crops Res. 110 (1), 69–75. doi: 10.1016/j.fcr.2008.07.004
Friedman, M. (2004). Applications of the ninhydrin reaction for analysis of amino acids, peptides, and proteins to agricultural and biomedical sciences. J. Agric. Food. Chem. 52 (3), 385–406. doi: 10.1021/jf030490p
Gajc-Wolska, J., Bujalski, D., Chrzanowska, A. (2008). Effect of a substrate on yielding and quality of greenhouse cucumber fruits. J. Elementol. 13 (2), 205–210.
Gautam, H., Sehar, Z., Rehman, M. T., Hussain, A., AlAjmi, M. F., Khan, N. A. (2021). Nitric oxide enhances photosynthetic nitrogen and sulfur-use efficiency and activity of ascorbate-glutathione cycle to reduce high temperature stress-induced oxidative stress in rice (Oryza sativa l.) plants. Biomolecules 11 (2), 305. doi: 10.3390/biom11020305
Hammer, K. J., Borum, J., Hasler-Sheetal, H., Shields, E. C., Sand-Jensen, K., Moore, K. A. (2018). High temperatures cause reduced growth, plant death and metabolic changes in eelgrass zostera marina. Mar. Ecol. Prog. Ser. 604, 121–132. doi: 10.3354/meps12740
Hamner, K. C. (1936). Effects of nitrogen supply on rates of photosynthesis and respiration in plants. Bot. Gaz. 97 (4), 744–764. doi: 10.1086/334601
Han, W., Yang, Z. Q., Huang, L. D., Sun, C. X., Yu, X. J., Zhao, M. F. (2019). Fuzzy comprehensive evaluation of the effects of relative air humidity on the morpho-physiological traits of pakchoi (Brassica chinensis l.) under high temperature. Sci. Hortic. 246, 971–978. doi: 10.1016/j.scienta.2018.11.079
Hao, P. F., Qiu, C. W., Ding, G. H., Vincze, E., Zhang, G. P., Zhang, Y. S., et al. (2020). Agriculture organic wastes fermentation CO2 enrichment in greenhouse and the fermentation residues improve growth, yield and fruit quality in tomato. J. Clean. Prod. 275, 123885. doi: 10.1016/j.jclepro.2020.123885
Hernández, V., Hellín, P., Botella, M.Á., Vicente, E., Fenoll, J., Flores, P. (2022). Oligosaccharins alleviate heat stress in greenhouse-grown tomatoes during the spring-summer season in a semi-arid climate. Agronomy 12 (4), 802. doi: 10.3390/agronomy12040802
Hoffmann, R., Muttarak, R., Peisker, J., Stanig, P. (2022). Climate change experiences raise environmental concerns and promote green voting. Nat. Clim. Change 12 (2), 148–155. doi: 10.21203/rs.3.rs-738080/v1
Imran, M., Ghorat, F., Ul-Haq, I., Ur-Rehman, H., Aslam, F., Heydari, M., et al. (2020). Lycopene as a natural antioxidant used to prevent human health disorders. Antioxidants 9 (8), 706. doi: 10.3390/antiox9080706
IPCC. (2021). Summary for Policymakers. In: Climate Change 2021: The Physical Science Basis. Contribution of Working Group I to the Sixth Assessment Report of the Intergovernmental Panel on Climate Change. Eds. Masson-Delmotte, V., Zhai, P., Pirani, A., Connors, S. L., Péan, C., Berger, S., et al. (Cambridge, United Kingdom and New York, NY, USA: Cambridge University Press), pp. 3–32. doi: 10.1017/9781009157896.001
Iqbal, A., Dong, Q., Wang, X., Gui, H., Zhang, H., Zhang, X., et al. (2020). High nitrogen enhance drought tolerance in cotton through antioxidant enzymatic activities, nitrogen metabolism and osmotic adjustment. Plants 9 (2), 178. doi: 10.3390/plants9020178
James, D., Borphukan, B., Fartyal, D., Ram, B., Singh, J., Manna, M., et al. (2018). Concurrent overexpression of OsGS1; 1 and OsGS2 genes in transgenic rice (Oryza sativa l.): impact on tolerance to abiotic stresses. Front. Plant Sci. 9. doi: 10.3389/fpls.2018.00786
JAOAC (1984). Official methods of analysis. Vitamin c (ascorbic acid) in vitamin preparation and juices: 2, 6-dicholoindophenol titrimetric method (Washington, DC: Association of Official Analytical Chemists).
Li, Z. J., Ji, W., Hong, E., Fan, Z., Lin, B. Y., Xia, X. Z., et al. (2023). Study on heat resistance of peony using photosynthetic indexes and rapid fluorescence kinetics. Horticulturae 9 (1), 100. doi: 10.3390/horticulturae9010100
Li, X., Li, M. H., Deng, W. W., Ahammed, G. J., Wei, J. P., Yan, P., et al. (2020). Exogenous melatonin improves tea quality under moderate high temperatures by increasing epigallocatechin-3-gallate and theanine biosynthesis in Camellia sinensis l. J. Plant Physiol. 253, 153273. doi: 10.1016/j.jplph.2020.153273
Li, Y. G., Yang, W. X., Shen, X. J., Yuan, G. H., Wang, J. W. (2019). Water environment management and performance evaluation in central China: a research based on comprehensive evaluation system. Water 11 (12), 2472. doi: 10.3390/w11122472
Liu, Z. X., Bie, Z. L., Huang, Y., Zhen, A., Niu, M. L., Lei, B. (2013). Rootstocks improve cucumber photosynthesis through nitrogen metabolism regulation under salt stress. Acta Physio. Plant 35, 2259–2267. doi: 10.1007/s11738-013-1262-5
Liu, K., Deng, J., Lu, J., Wang, X. Y., Lu, B. L., Tian, X. H., et al. (2019). High nitrogen levels alleviate yield loss of super hybrid rice caused by high temperatures during the flowering stage. Front. Plant Sci. 10. doi: 10.3389/fpls.2019.00357
Liu, J., Wang, X. W. (2020). Tomato diseases and pests detection based on improved yolo V3 convolutional neural network. Front. Plant Sci. 11. doi: 10.3389/fpls.2020.00898
Lu, T., Yu, H. J., Li, Q., Chai, L., Jiang, W. J. (2019). Improving plant growth and alleviating photosynthetic inhibition and oxidative stress from low-light stress with exogenous GR24 in tomato (Solanum lycopersicum l.) seedlings. Front. Plant Sci. 10. doi: 10.3389/fpls.2019.00490
Marlon, J. R., Wang, X., Mildenberger, M., Bergquist, P., Swain, S., Hayhoe, K., et al. (2021). Hot dry days increase perceived experience with global warming. Global Environ. Change 68, 102247. doi: 10.1016/j.gloenvcha.2021.102247
Mathur, S., Agrawal, D., Jajoo, A. (2014). Photosynthesis: response to high temperature stress. J. Photochem. Photobiol. B 137, 116–126. doi: 10.1016/j.jphotobiol.2014.01.010
Meier, I. C., Leuschner, C. (2008). Leaf size and leaf area index in fagus sylvatica forests: competing effects of precipitation, temperature, and nitrogen availability. Ecosystems 11, 655–669. doi: 10.1007/s10021-008-9135-2
Miflin, B. J., Habash, D. Z. (2002). The role of glutamine synthetase and glutamate dehydrogenase in nitrogen assimilation and possibilities for improvement in the nitrogen utilization of crops. J. Exp. Bot. 53 (370), 979–987. doi: 10.1093/jexbot/53.370.979
Nava, G., Dechen, A. R., Nachtigall, G. R. (2007). Nitrogen and potassium fertilization affect apple fruit quality in southern Brazil. Commun. Soil Sci. Plant Anal. 39 (1-2), 96–107. doi: 10.1080/00103620701759038
Nicola, S., Tibaldi, G., Fontana, E., Crops, A.-V., Plants, A. (2009). Tomato production systems and their application to the tropics. Acta Hortic. 821 (821), 27–34. doi: 10.17660/ActaHortic.2009.821.1
Peng, Y., Yuanquan, C., Adamou, D., Zhiqiang, T., Peng, S. (2017). Effect of nitrogen regimes on narrowing the magnitude of maize yield penalty caused by high temperature stress in north China plain. Plant Soil Environ. 63 (3), 131–138. doi: 10.17221/6/2017-PSE
Prasad, P., Staggenborg, S., Ristic, Z. (2008). Impacts of drought and/or heat stress on physiological, developmental, growth, and yield processes of crop plants. Response Crops to limited water: Understanding modeling Water Stress effects Plant Growth processes 1, 301–355. doi: 10.2134/advagricsystmodel1.c11
Razaq, M., Zhang, P., Shen, H.-l. (2017). Influence of nitrogen and phosphorous on the growth and root morphology of acer mono. PloS One 12 (2), e0171321. doi: 10.1371/journal.pone.0171321
Ru, C., Hu, X. T., Chen, D. Y., Song, T. Y., Wang, W., Lv, M. W., et al. (2022). Nitrogen modulates the effects of short-term heat, drought and combined stresses after anthesis on photosynthesis, nitrogen metabolism, yield, and water and nitrogen use efficiency of wheat. Water 14 (9), 1407. doi: 10.3390/w14091407
Salvucci, M. E., Crafts-Brandner, S. J. (2004). Relationship between the heat tolerance of photosynthesis and the thermal stability of rubisco activase in plants from contrasting thermal environments. Plant Physiol. 134 (4), 1460–1470. doi: 10.1104/pp.103.038323
Sansavini, S., Corelli-Grappadelli, L. (1996). “Yield and light efficiency for high quality fruit in apple and peach high density planting,” in VI International Symposium on Integrated Canopy, Rootstock, Environmental Physiology in Orchard Systems. Eds. Barritt, B. H., Kappel, F. (Leuven, Belgium: International Society for Horticultural Science (ISHS)), 451, 559–568.
Sedmak, J. J., Grossberg, S. E. (1977). A rapid, sensitive, and versatile assay for protein using coomassie brilliant blue G250. Anal. Biochem. 79 (1-2), 544–552. doi: 10.1016/0003-2697(77)90428-6
Shi, J., Maguer, M. L. (2000). Lycopene in tomatoes: chemical and physical properties affected by food processing. Crit. Rev. Food Sci. Nutr. 40 (1), 1–42. doi: 10.1080/07388550091144212
Shi, S. J., Wang, E. T., Li, C. X., Zhou, H., Cai, M. L., Cao, C. G., et al. (2021). Comprehensive evaluation of 17 qualities of 84 types of rice based on principal component analysis. Foods 10 (11), 2883. doi: 10.3390/foods10112883
Shu, S., Tang, Y. Y., Yuan, Y. H., Sun, J., Zhong, M., Guo, S. R. (2016). The role of 24-epibrassinolide in the regulation of photosynthetic characteristics and nitrogen metabolism of tomato seedlings under a combined low temperature and weak light stress. Plant Physiol. Biochem. 107, 344–353. doi: 10.1016/j.plaphy.2016.06.021
Sun, P., Mantri, N., Lou, H. Q., Hu, Y., Sun, D., Zhu, Y. Q., et al. (2012). Effects of elevated CO2 and temperature on yield and fruit quality of strawberry (Fragaria× ananassa duch.) at two levels of nitrogen application. PloS One 7 (7), e41000. doi: 10.1371/journal.pone.0041000
Thum, K. E., Shasha, D. E., Lejay, L. V., Coruzzi, G. M. (2003). Light-and carbon-signaling pathways. modeling circuits of interactions. Plant Physiol. 132 (2), 440–452. doi: 10.1104/pp.103.022780
Tian, S. P., Qin, G. Z., Li, B. Q. (2013). Reactive oxygen species involved in regulating fruit senescence and fungal pathogenicity. Plant Mol. Biol. 82, 593–602. doi: 10.1007/s11103-013-0035-2
Van Ploeg, D., Heuvelink, E. (2005). Influence of sub-optimal temperature on tomato growth and yield: a review. J. Hortic. Sci. Biotech. 80 (6), 652–659. doi: 10.1080/14620316.2005.11511994
Wahid, A., Gelani, S., Ashraf, M., Foolad, M. R. (2007). Heat tolerance in plants: an overview. Environ. Exp. Bot. 61 (3), 199–223. doi: 10.1016/j.envexpbot.2007.05.011
Wang, Z. H., Chen, X. J., Lyu, D. S., Li, W. H., Wang, T. Y., Wei, C. L. (2020). Effects of water and fertilizer coupling on the yield and quality of processing tomato under aerated drip irrigation. Trans. Chin. Soc Agric. Eng. 36 (18), 66–75. doi: 10.11975/j.issn.1002-6819.2020.19.008
Wang, F., Li, G. A., Wang, L. L., Zhou, J. B., Lou, Y. D., Yao, H. Y. (2017). Examining the effects of reduced nitrogen fertilization on the yield and fruit quality of greenhouse cultivated cucumber. Chin. J. Appl. Ecol. 28 (11), 3627–3633. doi: 10.13287/j.1001-9332.201711.041
Wei, T. T. (2020). Effects of elevated air humidity at high temperature on organic acid metabolism and intrinsic quality of facility tomato fruits [master's thesis]. (Nanjing, China: Nanjing University of Information Science and Technology).
Wold, S., Esbensen, K., Geladi, P. (1987). Principal component analysis. Chemometr. Intell. Lab. 2 (1-3), 37–52. doi: 10.1016/0169-7439(87)80084-9
Xu, S. G., Cui, Y. X., Yang, C. X., Wei, S. J., Dong, W. P., Huang, L. H., et al. (2021). The fuzzy comprehensive evaluation (FCE) and the principal component analysis (PCA) model simulation and its applications in water quality assessment of nansi lake basin, China. Environ. Eng. Res. 26 (2), 200022. doi: 10.4491/eer.2020.022
Xu, W. Z., Deng, X. P., Xu, B. C. (2013). Effects of water stress and fertilization on leaf gas exchange and photosynthetic light-response curves of bothriochloa ischaemum l. Photosynthetica 51, 603–612. doi: 10.1007/s11099-013-0061-y
Xu, C., Yang, Z. Q., Yang, S. Q., Wang, L., Wang, M. T. (2020). High humidity alleviates photosynthetic inhibition and oxidative damage of tomato seedlings under heat stress. Photosynthetica 58 (1), 146–155. doi: 10.32615/ps.2019.168
Xu, Z. Z., Zhou, G. S. (2006). Combined effects of water stress and high temperature on photosynthesis, nitrogen metabolism and lipid peroxidation of a perennial grass leymus chinensis. Planta 224, 1080–1090. doi: 10.1007/s00425-006-0281-5
Yang, Y. Z., Meng, C. R., Zhang, X. J., Bai, R. X., Wei, C. Z. (2017). Effect of nitrogen and potassium fertilizer on yield and quality of processing tomato under drip irrigation with plastic film mulching. Soil Fert. Sci. China 1), 61–67. doi: 10.11838/sfsc.20170111
Ye, Z. P. (2012). Nonlinear optical absorption of photosynthetic pigment molecules in leaves. Photosynth. Res. 112 (1), 31–37. doi: 10.1007/s11120-012-9730-0
Ye, Z. P., Suggett, D. J., Robakowski, P., Kang, H. J. (2013). A mechanistic model for the photosynthesis–light response based on the photosynthetic electron transport of photosystem II in C3 and C4 species. New Phytol. 199 (1), 110–120. doi: 10.1111/nph.12242
Yin, C. Y., Berninger, F., Li, C. Y. (2006). Photosynthetic responses of populus przewalski subjected to drought stress. Photosynthetica 44 (1), 62–68. doi: 10.1007/s11099-005-0159-y
Yuan, L. Y., Tang, L., Zhu, S. D., Hou, J. F., Chen, G. H., Liu, F., et al. (2017). Influence of heat stress on leaf morphology and nitrogen–carbohydrate metabolisms in two wucai (Brassica campestris l.) genotypes. Acta Soc Bot. Pol. 86 (2), 3554. doi: 10.5586/asbp.3554
Zhao, R. L., Chen, X. Y., Xie, X. X., Lin, W., Lin, F. (2022). Effects of the compound substrate of Sparassiscris pa fungi residues on the yield and quality of greenhouse tomatoes. Fujian Agric. Sci. Technol. 53 (8), 28–32. doi: 10.13651/j.cnki.fjnykj.2022.08.005
Keywords: high-temperature stress, nitrogen, tomato, abiotic stress tolerance, principal component analysis, comprehensive evaluation
Citation: Luo J, Yang Z, Zhang F and Li C (2023) Effect of nitrogen application on enhancing high-temperature stress tolerance of tomato plants during the flowering and fruiting stage. Front. Plant Sci. 14:1172078. doi: 10.3389/fpls.2023.1172078
Received: 23 February 2023; Accepted: 18 May 2023;
Published: 08 June 2023.
Edited by:
Biao Jin, Yangzhou University, ChinaReviewed by:
Francisco M. Del Amor, Instituto Murciano de Investigación y Desarrollo Agrario y Alimentario (IMIDA), SpainHongbo Zhao, Zhejiang Agriculture and Forestry University, China
Copyright © 2023 Luo, Yang, Zhang and Li. This is an open-access article distributed under the terms of the Creative Commons Attribution License (CC BY). The use, distribution or reproduction in other forums is permitted, provided the original author(s) and the copyright owner(s) are credited and that the original publication in this journal is cited, in accordance with accepted academic practice. No use, distribution or reproduction is permitted which does not comply with these terms.
*Correspondence: Zaiqiang Yang, eXpxQG51aXN0LmVkdS5jbg==