 Olle Thureborn
 Sylvain G. Razafimandimbison
 Niklas Wikström1,3
 Catarina Rydin
- 1Department of Ecology, Environment and Plant Sciences, Stockholm University, Stockholm, Sweden
- 2Department of Botany, Swedish Museum of Natural History, Stockholm, Sweden
- 3Bergius Foundation, Royal Swedish Academy of Sciences, Stockholm, Sweden
Subfamily Rubioideae is the largest of the main lineages in the coffee family (Rubiaceae), with over 8,000 species and 29 tribes. Phylogenetic relationships among tribes and other major clades within this group of plants are still only partly resolved despite considerable efforts. While previous studies have mainly utilized data from the organellar genomes and nuclear ribosomal DNA, we here use a large number of low-copy nuclear genes obtained via a target capture approach to infer phylogenetic relationships within Rubioideae. We included 101 Rubioideae species representing all but two (the monogeneric tribes Foonchewieae and Aitchinsonieae) of the currently recognized tribes, and all but one non-monogeneric tribe were represented by more than one genus. Using data from the 353 genes targeted with the universal Angiosperms353 probe set we investigated the impact of data type, analytical approach, and potential paralogs on phylogenetic reconstruction. We inferred a robust phylogenetic hypothesis of Rubioideae with the vast majority (or all) nodes being highly supported across all analyses and datasets and few incongruences between the inferred topologies. The results were similar to those of previous studies but novel relationships were also identified. We found that supercontigs [coding sequence (CDS) + non-coding sequence] clearly outperformed CDS data in levels of support and gene tree congruence. The full datasets (353 genes) outperformed the datasets with potentially paralogous genes removed (186 genes) in levels of support but increased gene tree incongruence slightly. The pattern of gene tree conflict at short internal branches were often consistent with high levels of incomplete lineage sorting (ILS) due to rapid speciation in the group. While concatenation- and coalescence-based trees mainly agreed, the observed phylogenetic discordance between the two approaches may be best explained by their differences in accounting for ILS. The use of target capture data greatly improved our confidence and understanding of the Rubioideae phylogeny, highlighted by the increased support for previously uncertain relationships and the increased possibility to explore sources of underlying phylogenetic discordance.
Introduction
The subfamily Rubioideae, the largest of the major lineages of the species-rich and morphologically diverse coffee family (the Rubiaceae), includes over 8,000 species (Wikström et al., 2020). The members of the subfamily are characterized as herbs or shrubs (rarely trees) with tissues containing raphides (calcium oxalate crystals), valvate corolla aestivation, indumentum of septate hairs and heterostylous flowers (e.g., Robbrecht, 1988; Bremer and Manen, 2000; Robbrecht and Manen, 2006; Bremer and Eriksson, 2009). As for the remaining family, most species are found in tropical and subtropical regions around the world, however, several species of the tribes Anthospermeae, Putorieae, Rubieae, and Theligoneae are distributed in temperate regions. The wind-pollinated flowers in the tribes Anthospermeae and Theligoneae are also an unusual trait, relative to other Rubiaceae, found in this subfamily. The four aforementioned temperate tribes belong to one of the major clades within the subfamily, the cosmopolitan and mainly herbaceous Spermacoceae alliance, which contain over 3,000 species. Together the tribes Spermacoceae and Rubieae make up the bulk of species with more than 1,300 and 900 species, respectively (Wikström et al., 2020). The other major informal group of Rubioideae, the pan-tropical and mainly woody Psychotrieae alliance, also contains over 3,000 species, of which most belong to the tribes Palicoureeae and Psychotrieae, much due to the large genera Psychotria and Palicourea, with about 1,600 and 800 species, respectively (Razafimandimbison et al., 2008, 2014; Davis et al., 2009).
In total, Wikström et al. (2020) recognized 27 tribes in the subfamily Rubioideae in their summary, based on previous molecular phylogenetic studies. Recently two additional monospecific tribes have been described; the tribe Seychelleeae, which is sister to the tribe Colletoecemateae (Razafimandimbison et al., 2020), and the tribe Aitchinsonieae, which is placed in the Putorieae-Rubieae-Theligoneae clade (also referred to as the Rubieae complex, Bordbar et al., 2021). The Rubioideae thus include the two major groups the Psychotrieae and the Spermacoceae alliances, and seven additional tribes: Colletoecemateae, Seychelleeae, Urophylleae, Ophiorrhizeae, Lasiantheae, Perameae, and Coussareeae. The members of the Psychotrieae alliance are classified in nine tribes: Craterispermeae, Gaertnereae, Mitchelleae, Morindeae, Palicoureeae, Prismatomerideae, Psychotrieae, Schizocoleeae, and Schradereae. In the Spermacoceae alliance, 13 tribes are recognized: Aitchinsonieae, Argostemmateae, Anthospermeae, Cyanoneuroneae, Danaideae, Dunnieae, Foonchewieae, Knoxieae, Paederieae, Putorieae, Rubieae, Spermacoceae, and Theligoneae.
Until recent years, phylogenetic studies in the Rubioideae have mainly relied on information from selected plastid markers (e.g., atpB-rbcL, rbcL, rps16, trnT-trnL-trnF, ndhF) (Andersson and Rova, 1999; Bremer and Manen, 2000; Piesschaert et al., 2000; Robbrecht and Manen, 2006; Rydin et al., 2008; Bremer and Eriksson, 2009; Wikström et al., 2015; Janssens et al., 2016) or plastid markers combined with a few nuclear ribosomal regions (e.g., nrITS and/or nrETS) (Razafimandimbison et al., 2008, 2014; Antonelli et al., 2009; Rydin et al., 2009b; Razafimandimbison and Rydin, 2019). Such studies laid the foundation of the phylogenetic understanding within Rubioideae and the rest of the family. Recently, Rydin et al. (2017) and Wikström et al. (2020) used organellar genome scale datasets to reconstruct the phylogeny of the Rubiaceae family. Wikström et al. (2020) also analyzed nuclear ribosomal cistron data. Their results were mostly well supported and corroborated the overall picture of intertribal-relationships within Rubioideae, although high support values were not always achieved. Furthermore, results from the three different genomic compartments were not fully consistent (Rydin et al., 2017; Wikström et al., 2020). For example, deep-branching relationships within Rubioideae showed well supported yet conflicting tree topologies with either Ophiorrhizeae, a clade comprising Colletoecemateae and Urophylleae, or a clade comprising Colletoecemateae as sister to an Ophiorrhizeae + Urophylleae clade, resolved as sister group to the remaining subfamily. Another example of supported conflict was revealed by analysis of nuclear ribosomal data, which placed Coussareeae as sister to the Spermacoceae alliance, challenging the well documented sister-relationship between the Spermacoceae and Psychotrieae alliances in a number of previous studies (e.g., Bremer and Manen, 2000; Razafimandimbison et al., 2008; Rydin et al., 2009b). Relationships within the Psychotrieae and Spermacoceae alliances also differed between analyses of the different compartments, including deep splits within the Spermacoceae alliance, relationships among tribes of the Rubieae complex and the position of Gaertnereae in the Psychotrieae alliance. Antonelli et al. (2021) examined the higher-level relationships in the entire Gentianales using target capture data, and while results were mostly consistent with those of previous studies, some surprising relationships were retrieved among their results. For instance, the sister relationship between Argostemmateae and the remaining tribes of the Spermacoceae alliance in their coalescent tree based on nuclear data, and the placement of Cyanoneuroneae nested within Psychotrieae alliance based on plastid data (Antonelli et al., 2021).
However, these family- and order-wide phylogenies have as a rule included only one representative taxon per sampled tribe and some key taxa have been unsampled. Furthermore, analysis of an organellar genome is generally considered to represent a single gene-tree within the species phylogeny (Gitzendanner et al., 2018; Doyle, 2022) and can thus fail to reflect the correct species tree due to processes such as incomplete lineage sorting (ILS) and hybridization (Nicholls et al., 2015; Wolf et al., 2018). Sampling a large number of presumably independently evolving genetic loci can avoid such problems and may even be necessary to infer the correct species tree (Degnan and Rosenberg, 2009; Nicholls et al., 2015; Ruane et al., 2015).
Targeted sequence capture uses short (often RNA) probes that are designed for the group of study to selectively capture target DNA regions from sequencing libraries and has emerged as a standard method for generating genome-scale nuclear multi-gene datasets for species tree inference in several plant groups (Johnson et al., 2019; Hale et al., 2020). The relative cost effectiveness and the fact that it works well also with degraded DNA, which is common among extractions of herbarium specimens, are some benefits of this approach (McKain et al., 2018; Johnson et al., 2019). The probe set used may be specifically designed for the group of study (e.g., Vatanparast et al., 2018; Sanderson et al., 2020) or designed to be universally applicable across larger groups such as the Angiosperms353 probe kit (Johnson et al., 2019). The large amount and heterogeneity of the data generated for phylogenomic studies do, however, not come without challenges. Factors such as poorly resolved gene trees due to low phylogenetic signal (Zhang et al., 2018), different types of data (Braun and Kimball, 2021), different data filtering strategies (Molloy and Warnow, 2018), and different underlying assumptions of phylogenetic inference methods such as concatenation- and coalescent-based methods (Roch and Steel, 2015) may all potentially affect accuracy of species tree inference.
Here, we attempt to resolve the phylogeny of the subfamily Rubioideae using large amounts of target capture data from the nuclear genome, and a much denser sampling of taxa, including several representatives of nearly all tribes of the subfamily, compared to previous work. We examine the impact of data type [coding sequence (CDS) and CDS + non-coding sequence], analytical approach (coalescence and concatenation), and potential paralogs (inclusion/exclusion of putative paralogous genes) on phylogenetic reconstruction. Our main aim is to improve the understanding of relationships within Rubioideae, mainly among tribes but also within tribes.
Materials and methods
Taxon sampling
One hundred and one Rubioideae species were selected to obtain a good representation of the subfamily. These species included representatives from all but two (the monogeneric tribes Foonchewieae and Aitchinsonieae) of the currently recognized tribes, and all but one non-monogeneric tribe was represented by more than one genus. For outgroup sampling we included twenty species to represent the major lineages of the remaining Rubiaceae, including representatives from the two other subfamilies and the two unplaced tribes Coptosapelteae and Luculieae. Three outgroup species from the Gentianales families Gentianaceae, Loganiaceae, and Apocynaceae were also selected. For 93 species, material was selected from vegetative tissue material (either silica dried material from field collections or from herbarium specimens) or from DNA aliquots already available from previous work. We also downloaded raw sequence data from the European Nucleotide Archive for 31 species available via the Plant and Fungal Tree of Life (PAFTOL) Research Program (Baker et al., 2022). Species and voucher information for all included taxa is provided in Supplementary Table 1.
Library preparation and target capture
DNA was extracted using a cetyl trimethylammonium bromide method (Doyle and Doyle, 1987). The plant tissue was pulverized using a TissueLyser LT (Qiagen, Hilden, Germany). Some samples were additionally cleaned with AMPure XP beads (Beckman Coulter, Indianapolis, IN, United States) or with a QIAquick polymerase chain reaction (PCR) kit (Qiagen, Hilden, Germany) according to the instructions provided by the manufacturers. DNA degradation was assessed by agarose gel (1%) electrophoresis and quantified on a Qubit 3 Flourometer (Thermo Fisher Scientific, Waltham, MA, United States) using the Qubit dsDNA HS kit. Samples with a large fraction of DNA fragments above 350 bp were placed in 96 microTUBE Plate wells and fragmented on a Covaris E220 Focused-ultrasonicator (Covaris, Woburn, MA, United States) using the program for a target insert size of 350 bp at Science for Life Laboratory (Solna, Sweden).
Libraries were prepared using a modified version of the Meyer and Kircher (2010) protocol. Briefly, the major steps of library preparation consisted of blunt-end repair, adapter ligation and adapter fill-in, followed by four separate index PCRs. End repair was performed in 40 μl reactions with 20 μl of DNA extract. AMPure bead cleanups after blunt-end repair and adapter ligation were performed using ratios of 0.9–1.8:1 AMPure to reaction volume. Adapter concentration in the ligation reaction was reduced to 0.25 μM of each adapter, and the cleanup step after adapter fill-in was substituted with heat inactivation of the Bst polymerase at 80°C for 20 min following Kircher et al. (2012).
Each adapter-ligated library was then amplified with P5 and P7 dual-indexing primers in four separate PCR reactions to reduce amplification bias. One initial 12 cycle PCR per library was performed and the PCR products were loaded on a 1% agarose gel to verify amplification success and to determine an appropriate number of cycles for the remaining PCRs. Each 25 μl reaction contained 7 μl DNA library template and the following final concentrations: 1 × PCR Gold buffer, 2.5 mM MgCl2, 0.25 mM of each dNTP, 200 nM of each primer and 5 U AmpliTaq Gold. Reactions were subjected to the following thermocycling conditions: 94°C 12 min; 6–14 cycles of 94°C for 30 s, 60°C for 30 s, 72°C for 45 s; and a final extension of 72°C for 10 min. Individual PCR products for each sample were then pooled and cleaned using AMPure XP beads using ratios of 0.85-1:1 AMPure to reaction volume. The specific ratio used varied depending on DNA degradation, concentration and amount of unwanted short fragments (e.g., adapter-dimers) of the samples. The cleaned libraries were quantified using the Qubit dsDNA HS kit on a Qubit 3 Flourometer and fragment size distribution inspected with a high-sensitivity DNAchip on a Bioanalyzer 2100 (Agilent, Santa Clara, CA, United States).
Libraries of similar size were combined into 6-plex or 8-plex pools resulting in approximately equimolar 600 and 800 ng pools, respectively. Before pooling, apart from fragment size distribution, other factors, such as tissue source, number of PCR cycles during library preparation, age and library concentration were also considered. The pools were concentrated using either a miVac (Genevac, Ipswich, United Kingdom) or SpeedVac (Thermo Fisher Scientific, Waltham, MA, United States) at approximately 43°C. The pools were then enriched with the myBaits Expert Predesigned Panel (Arbor Biosciences, Ann Arbor, MI, United States) Angiosperms353 v1 (Catalog #308196; Johnson et al., 2019) following the manufacturer’s protocol (v4).1 Hybridization was carried out at 62°C for 24 or 36 h. Enriched products were amplified with KAPA HiFi (2×) HotStart ReadyMix PCR Kit (Roche, Basel, Switzerland) for 13–14 cycles with IS5_reamp. P5 and IS6_reamp.P7 primers (Meyer and Kircher, 2010) and subsequently cleaned using a 0.9:1 AMPure to reaction volume ratio. The hybridized and cleaned pools were quantified using the Qubit dsDNA HS kit and fragment size distribution inspected with a high-sensitivity DNAchip on a Bioanalyzer 2100. Finally, the enriched library pools were multiplexed at equimolar concentrations and sequenced on a NextSeq 500 using “Mid-Output” chemistry or NovaSeq 6000 using “NovaSeqXp” workflow in “S4” mode flowcell (Illumina, San Diego, CA, United States) with 151 bp paired-end reads at Science for Life Laboratory (Solna, Sweden).
Data pre-processing
The Bcl to FastQ conversion was performed using bcl2fastq_v2.20.0.422 from the CASAVA software suite +, at Science for Life Laboratory (Solna, Sweden). The quality scale used was Sanger/phred33/Illumina 1.8. Further preprocessing of the obtained 151 bp paired-end reads was performed using utilities in the BBTools suite (BBTools, 2022). Dedupe or alternatively Clumpify was used to remove duplicate reads. BBduk was used to trim adapters, trim low-quality bases (Q < 20) and remove reads shorter than 36 bp. Dedupe and BBduk were used from within Geneious 11.1.5 (Kearse et al., 2012).
Gene assemblies
HybPiper v1.3.1 (Johnson et al., 2016) was used to assemble sequences for each gene. With the aim to increase gene recovery (gene length and number) the default target file for the Angiosperms353 kit was expanded by adding sequences of the Gentianales samples included in the mega353 target file produced by McLay et al. (2021) and the 348 sequences from the annotated Coffea canephora genome available via The Kew Tree of Life Explorer (Baker et al., 2022). The reads of library replicates from the same sample were combined before assembly. Read mapping was conducted using BWA v0.7.17 (Li and Durbin, 2009) and the coverage cut-off option was kept at the default value of eight for the SPAdes v3.15.2 (Bankevich et al., 2012) contig assembly. In addition to the default HybPiper coding sequence (CDS) output extracted with exonerate v2.2 (Slater and Birney, 2005) the optional HybPiper intronerate.py script was run to also extract so called supercontig sequences, which contain both CDS and non-coding flanking sequence. Recovery statistics were generated using the two HybPiper scripts get_seq_lengths.py and hybpiper_stats.py. The HybPiper script paralog_investigator.py was run to identify genes with paralog warnings. A HybPiper paralog warning is generated when HybPiper assembles multiple contigs covering more than 85% of the target length. In such a case HybPiper selects the sequence with highest sequencing coverage. If the copies have similar coverage, the copy with highest percent identity to the target sequence is chosen.
Alignment, dataset generation and phylogenetic analysis
The CDS and supercontig outputs for each target gene were aligned with MAFFT v7.467 (Katoh and Standley, 2013) with the L-INS-I algorithm and the additional –adjust direction flag. CDS alignments were aligned as amino acids and backtranslated using PAL2NAL v14 (Suyama et al., 2006). BMGE v1.12 (Criscuolo and Gribaldo, 2010) was used to trim sites with more than 90% gaps. The trimmed alignments were then concatenated using AMAS v1.0 (Borowiec, 2016), and Spruceup v2020.2.19 (Borowiec, 2019) was used to detect and trim outlier sequence windows from individual samples using the Jukes-Cantor-corrected distance method, a window size of 20 bp, an overlap size of 15 bp, a lognormal distribution and a cutoff value of 0.99. AMAS was then used to split the concatenated alignment into single-locus alignments and again trimmed with BMGE to remove sites with more than 90% gaps. The resulting alignments were used for phylogenetic inference. Alignment length, number and proportion of parsimony informative sites (PIS) and other alignment statistics were obtained using AMAS.
A total of four datasets were created. For each data type we created a dataset comprising the full set of genes (i.e., the direct HybPiper output), which we refer to as the full CDS dataset and full supercontig dataset. We also created a putative one-to-one ortholog dataset for each data type, which we refer to as the paralog-filtered CDS dataset and the paralog-filtered supercontig dataset. The two paralog-filtered datasets were created by conservatively removing any gene with at least one paralog warning from the respective full set of genes. The datasets were analyzed using a coalescent approach and a concatenation approach.
We used IQ-TREE 2 v2.0.3 (Minh et al., 2020) to infer a gene tree for each single gene alignment under the GTR + G model with support assessed with 1,000 ultrafast bootstrap replicates (Hoang et al., 2018). Following gene tree estimation, we collapsed nodes with less than 20% support using Newick Utilities v1.6 (Junier and Zdobnov, 2010) as this can help improve gene tree accuracy (Zhang et al., 2018). We then used the collapsed gene trees for species tree inference with a coalescent-based approach, using the quartet-based summary method ASTRAL III v5.7.8 (Zhang et al., 2018), which accounts for gene tree discordance due to ILS. Node support was assessed by local posterior probability (LPP; Sayyari and Mirarab, 2016). We also performed the polytomy test implemented in ASTRAL, which uses quartet gene tree frequencies to evaluate whether polytomies could be rejected at short branches (Sayyari and Mirarab, 2018). The normalized quartet score (NQS), which reflects the percentage of the gene tree quartets included in the species tree and part of the ASTRAL output, was used to assess the level of gene tree discordance for the respective datasets. To further examine gene tree discordance ASTRAL trees were annotated with quartet frequencies for alternative topologies using the –t 8 option in ASTRAL-III.
For each of the four datasets we also concatenated the single gene alignments to infer phylogenies in a concatenation framework. The concatenated matrices were analyzed using IQ-TREE 2 using a partitioned model (Chernomor et al., 2016), with each gene treated as a separate partition with a GTR + G model specified for each partition and allowing the possibility of separate rates among partitions. To assess branch support, ultrafast bootstrap supports (BS) were calculated based on 1,000 replicates.
Treeio (Wang et al., 2020) and ape (Paradis and Schliep, 2019) R packages (R Core Team, 2022) were used to plot the trees followed by editing in Inkscape v1.1.2 (Inkscape Project, 2022).
Results
Sequencing and assembly statistics
Sequencing and data filtration results can be found in Supplementary Table 1. Across all newly generated libraries the number of deduplicated and trimmed reads had a mean of 14,535,279. Across all libraries (i.e., including also the 31 PAFTOL samples downloaded from ENA) the number of deduplicated and trimmed reads had a mean of 11,653,388. The average library had 23% duplicate reads removed.
Assembly results are provided in Supplementary Table 2. At least a fraction of each of the 353 targeted genes were recovered in at least five taxa. Across the newly sequenced samples, the average sample had 336, 312, and 263 genes with sequences at least 25, 50, and 75% of the average target length, respectively, and a total gene length of 245,218 bp. Across all samples the average sample had 323, 291, and 237 genes with sequences at least 25, 50, and 75% of the average target length, respectively, and a total gene length of 228,644 bp. In addition to the targeted coding regions, large amounts of non-targeted sequence data were recovered. The average total length of recovered supercontig (coding sequence and non-coding flanking sequence) data was 710,450 and 661,303 bp for the newly sequenced samples and all samples, respectively. Across the full taxon sample, HybPiper gave paralog warnings for at least one sample in 167 of 353 genes. On average, samples had nine paralog warnings.
Dataset characteristics
The main characteristics of the four assembled datasets are summarized in Table 1 and full statistics for each single locus alignment are provided in Supplementary Table 3. Across the 353 loci the average final alignment had a taxon coverage of 94% (117/124 species), and a length of 880 and 2,989 bp for the CDS and supercontig datasets, respectively. The total concatenated length of the full CDS dataset was 310,806 bp and the full supercontig dataset was 1,055,164 bp. The exclusion of the putatively paralogous genes (i.e., the genes flagged with paralog warnings by HybPiper) resulted in 186 alignments each for the paralog-filtered datasets with a total concatenated length of 181,088 and 632,932 bp for the CDS and supercontig datasets, respectively. On average, supercontig alignments contained over five times more PIS than CDS alignments.
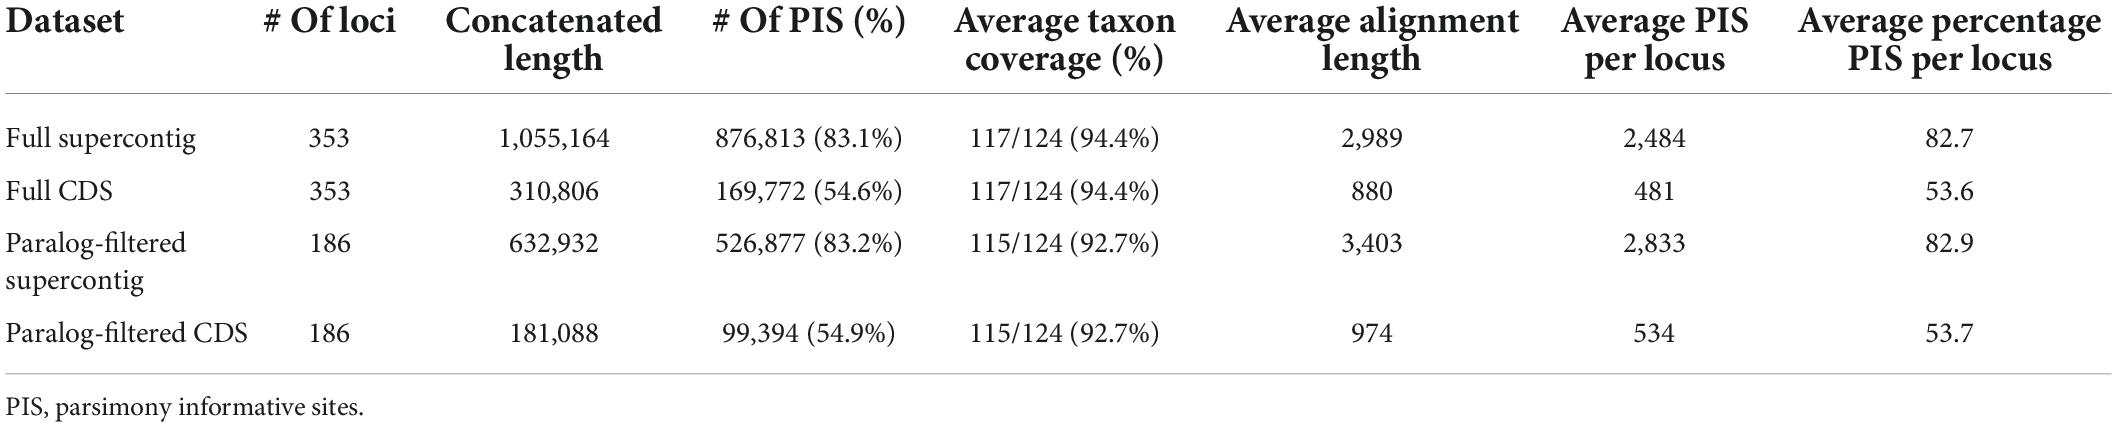
Table 1. Characteristics of assembled datasets used for phylogenetic inference.
Comparison of data types and inclusion/exclusion of potential paralogous genes
The performance of the four datasets on branch support, gene tree discordance (NQS values) and ability to reject polytomies are summarized in Table 2. Across both gene sets (i.e., inclusion/exclusion of putatively paralogous genes) and analytical approaches, the addition of non-coding sequences increased the average branch support, number of branches where a polytomy could be rejected, number of highly supported nodes, and gene tree concordance (i.e., higher NQS values). For the coalescence-based analyses of the full and paralog-filtered datasets there were nine (ingroup = seven) and 12 (ingroup = nine) more strongly supported nodes when using supercontigs instead of CDS alone, respectively. For the concatenated analyses of the full and paralog-filtered datasets there were 10 (ingroup = seven) and six (ingroup = five) more strongly supported nodes when using supercontigs instead of CDS alone, respectively. The number of branches where a polytomy could be rejected using the polytomy test in ASTRAL in the analyses of the full and paralog-filtered datasets was also higher when supercontigs were used instead of CDS alone, increasing with six (ingroup = four) and nine (ingroup = five) branches, respectively. Across both gene sets, supercontigs increased average BS support with 2.1% for the full and paralog-filtered datasets. Across both gene sets, supercontigs increased average LPP support with 1.9 and 2.8% for the full and paralog-filtered datasets, respectively. Across both gene sets the addition of flanking regions resulted in higher NQS values, increasing with 0.050 and 0.057 for the full and paralog-filtered datasets, respectively.
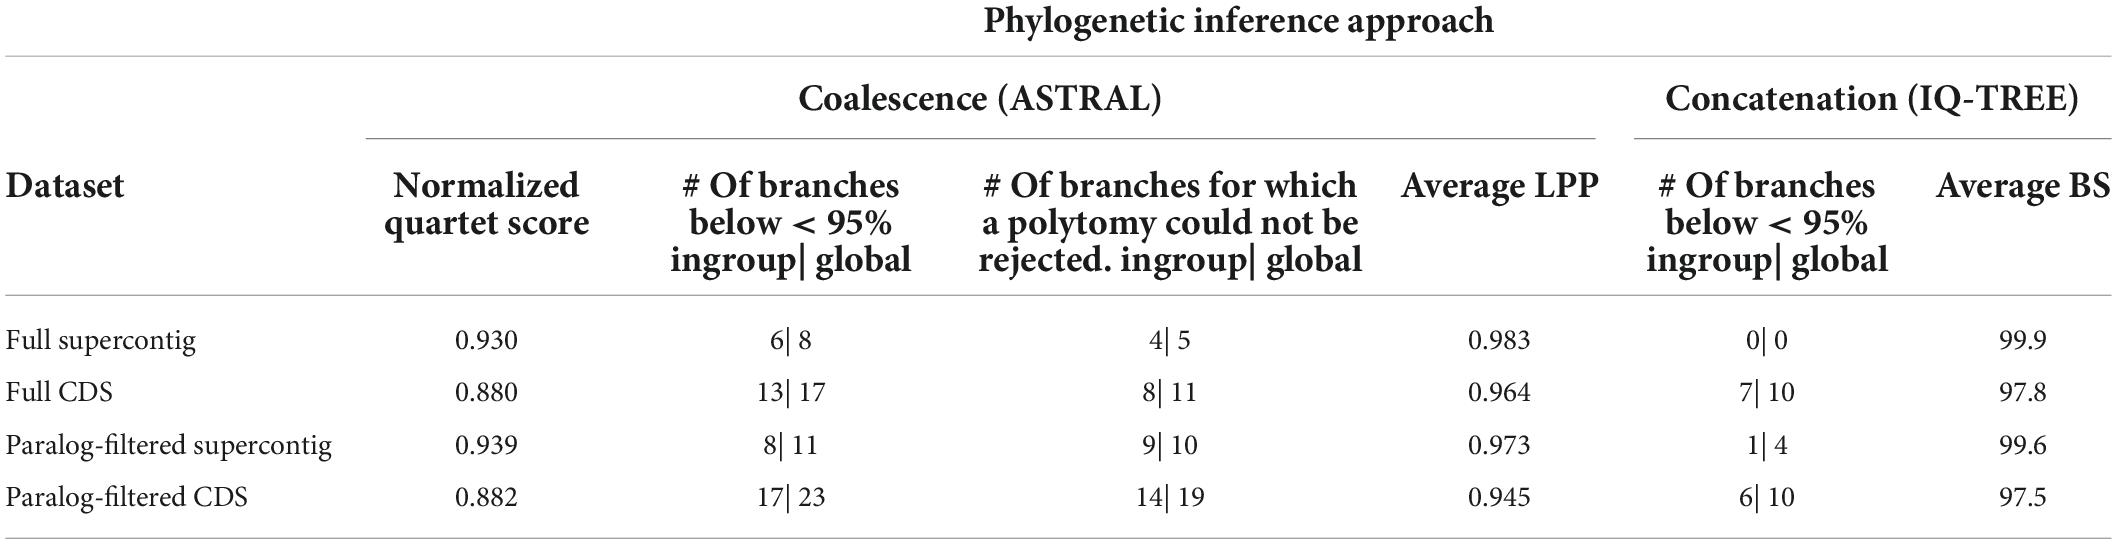
Table 2. Phylogenetic inference performance of the assembled datasets for attributes under consideration.
Across both data types and analytical approaches, the exclusion of genes with putative paralogs reduced the average branch support, number of branches where a polytomy could be rejected, and number of highly supported nodes, except for the concatenated analyses of CDS data where the exclusion of putatively paralogous genes resulted in one more well-supported ingroup branch. Excluding putatively paralogous genes from the supercontig data, the number of strongly supported nodes was reduced by four (ingroup = one) for the concatenation-based analysis. Excluding putatively paralogous genes from the supercontig and CDS data, the number of strongly supported nodes was reduced by three (ingroup = two) and six (ingroup = four) nodes for the coalescence-based analyses, respectively. Excluding putatively paralogous genes from supercontig and CDS data, the number of branches where a polytomy could be rejected decreased by five (ingroup = five) and eight (ingroup = six) branches, respectively. Across both data types, excluding putatively paralogous genes decreased average BS support by 0.3% for the full and paralog-filtered datasets. Across both gene sets, excluding putatively paralogous genes decreased average LPP support by 1 and 1.9% for the supercontig and CDS datasets, respectively. However, across both data types the removal of putatively paralogous genes resulted in slightly higher NQS values, with an increase of 0.002 and 0.009 for the CDS and supercontig datasets, respectively.
Phylogenetic results
The inferred species tree topologies were highly similar regardless of method (coalescence- or concatenation-based), data type (CDS or supercontigs) and inclusion/exclusion of potentially paralogous genes (Figures 1, 2 and Supplementary Figures 1–6). The few topological conflicts were often not well supported (i.e., were supported by less than 95%). Overall, both the addition of flanking regions and inclusion of all genes increased statistical support and the power to reject polytomies. Therefore, we in the following, focus on the results obtained from the analyses of the full supercontig dataset (Figures 1, 2).
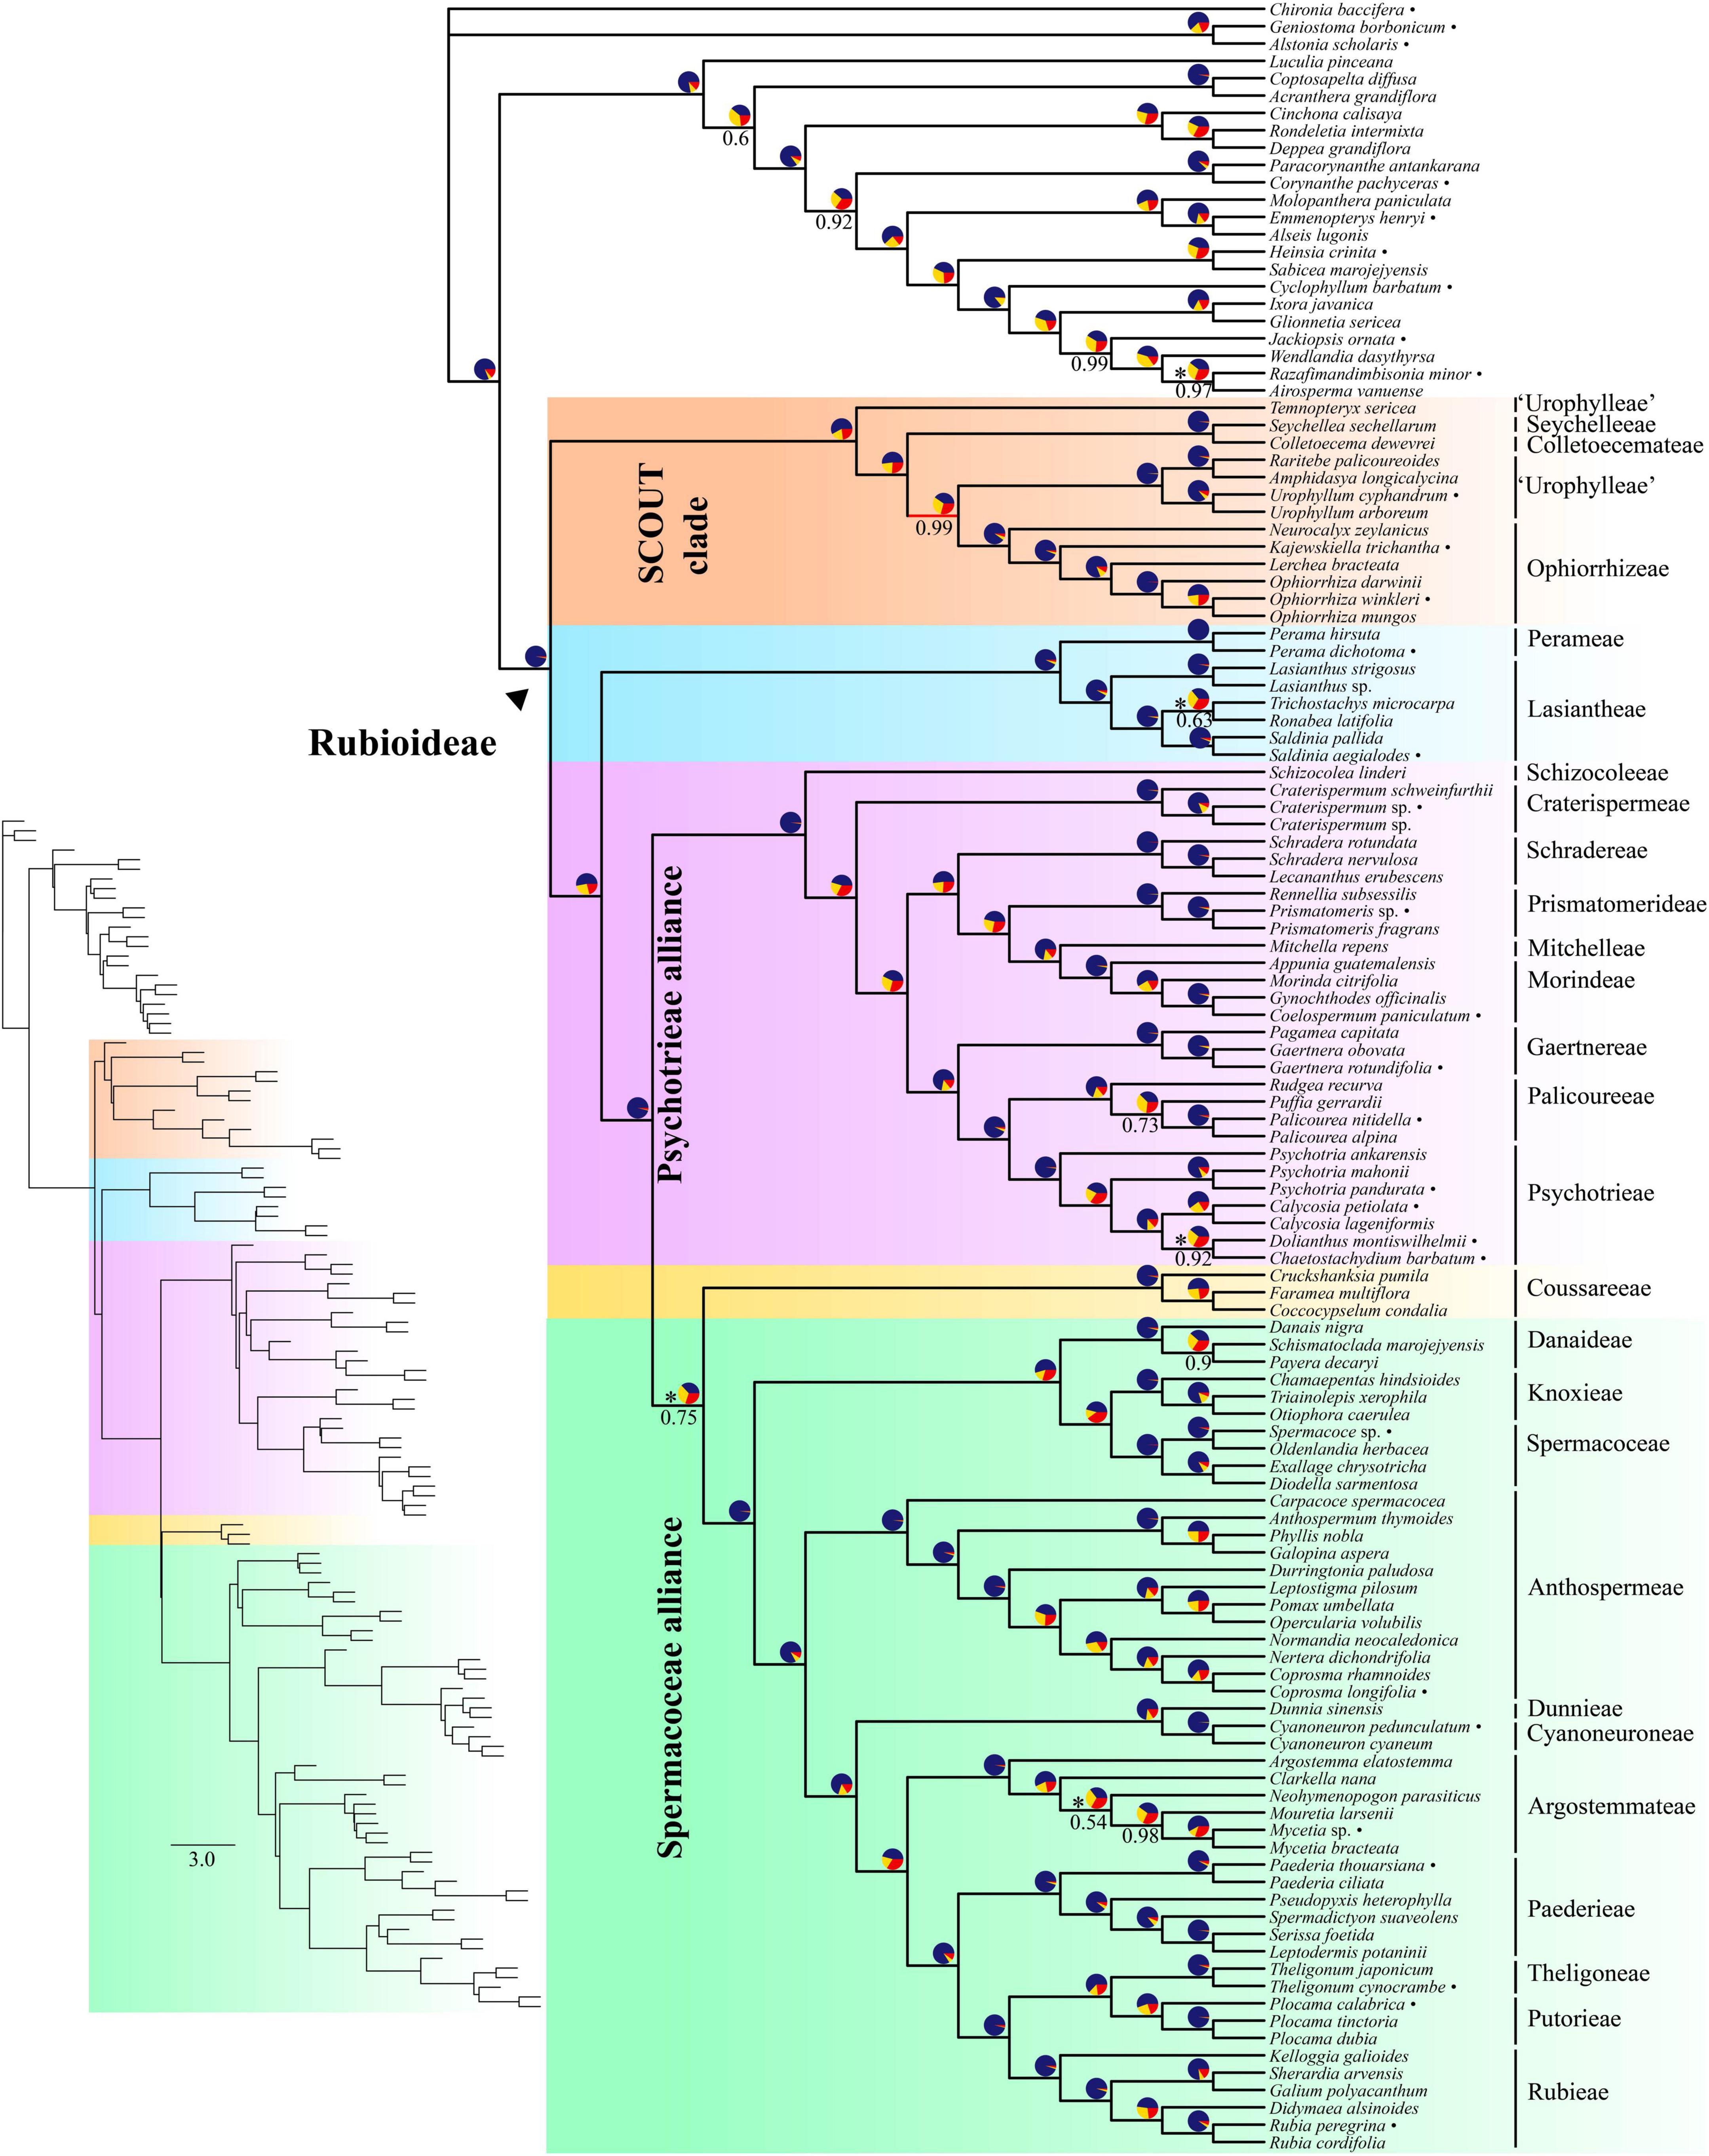
Figure 1. Coalescent-based species tree estimated using ASTRAL on the full supercontig dataset. Numbers below branches denote local posterior probability (LPP) support values. Only support values smaller than 100% are shown. Pie charts show relative frequencies of the three quartet topologies around the branch (blue = congruent with species tree, yellow = first alternative topology, red = second alternative topology). Asterisks next to pie charts indicate failure to reject the hypothesis that the branch is a polytomy. Bullets after species names indicate samples downloaded from ENA. Inset shows branch lengths in coalescent units.
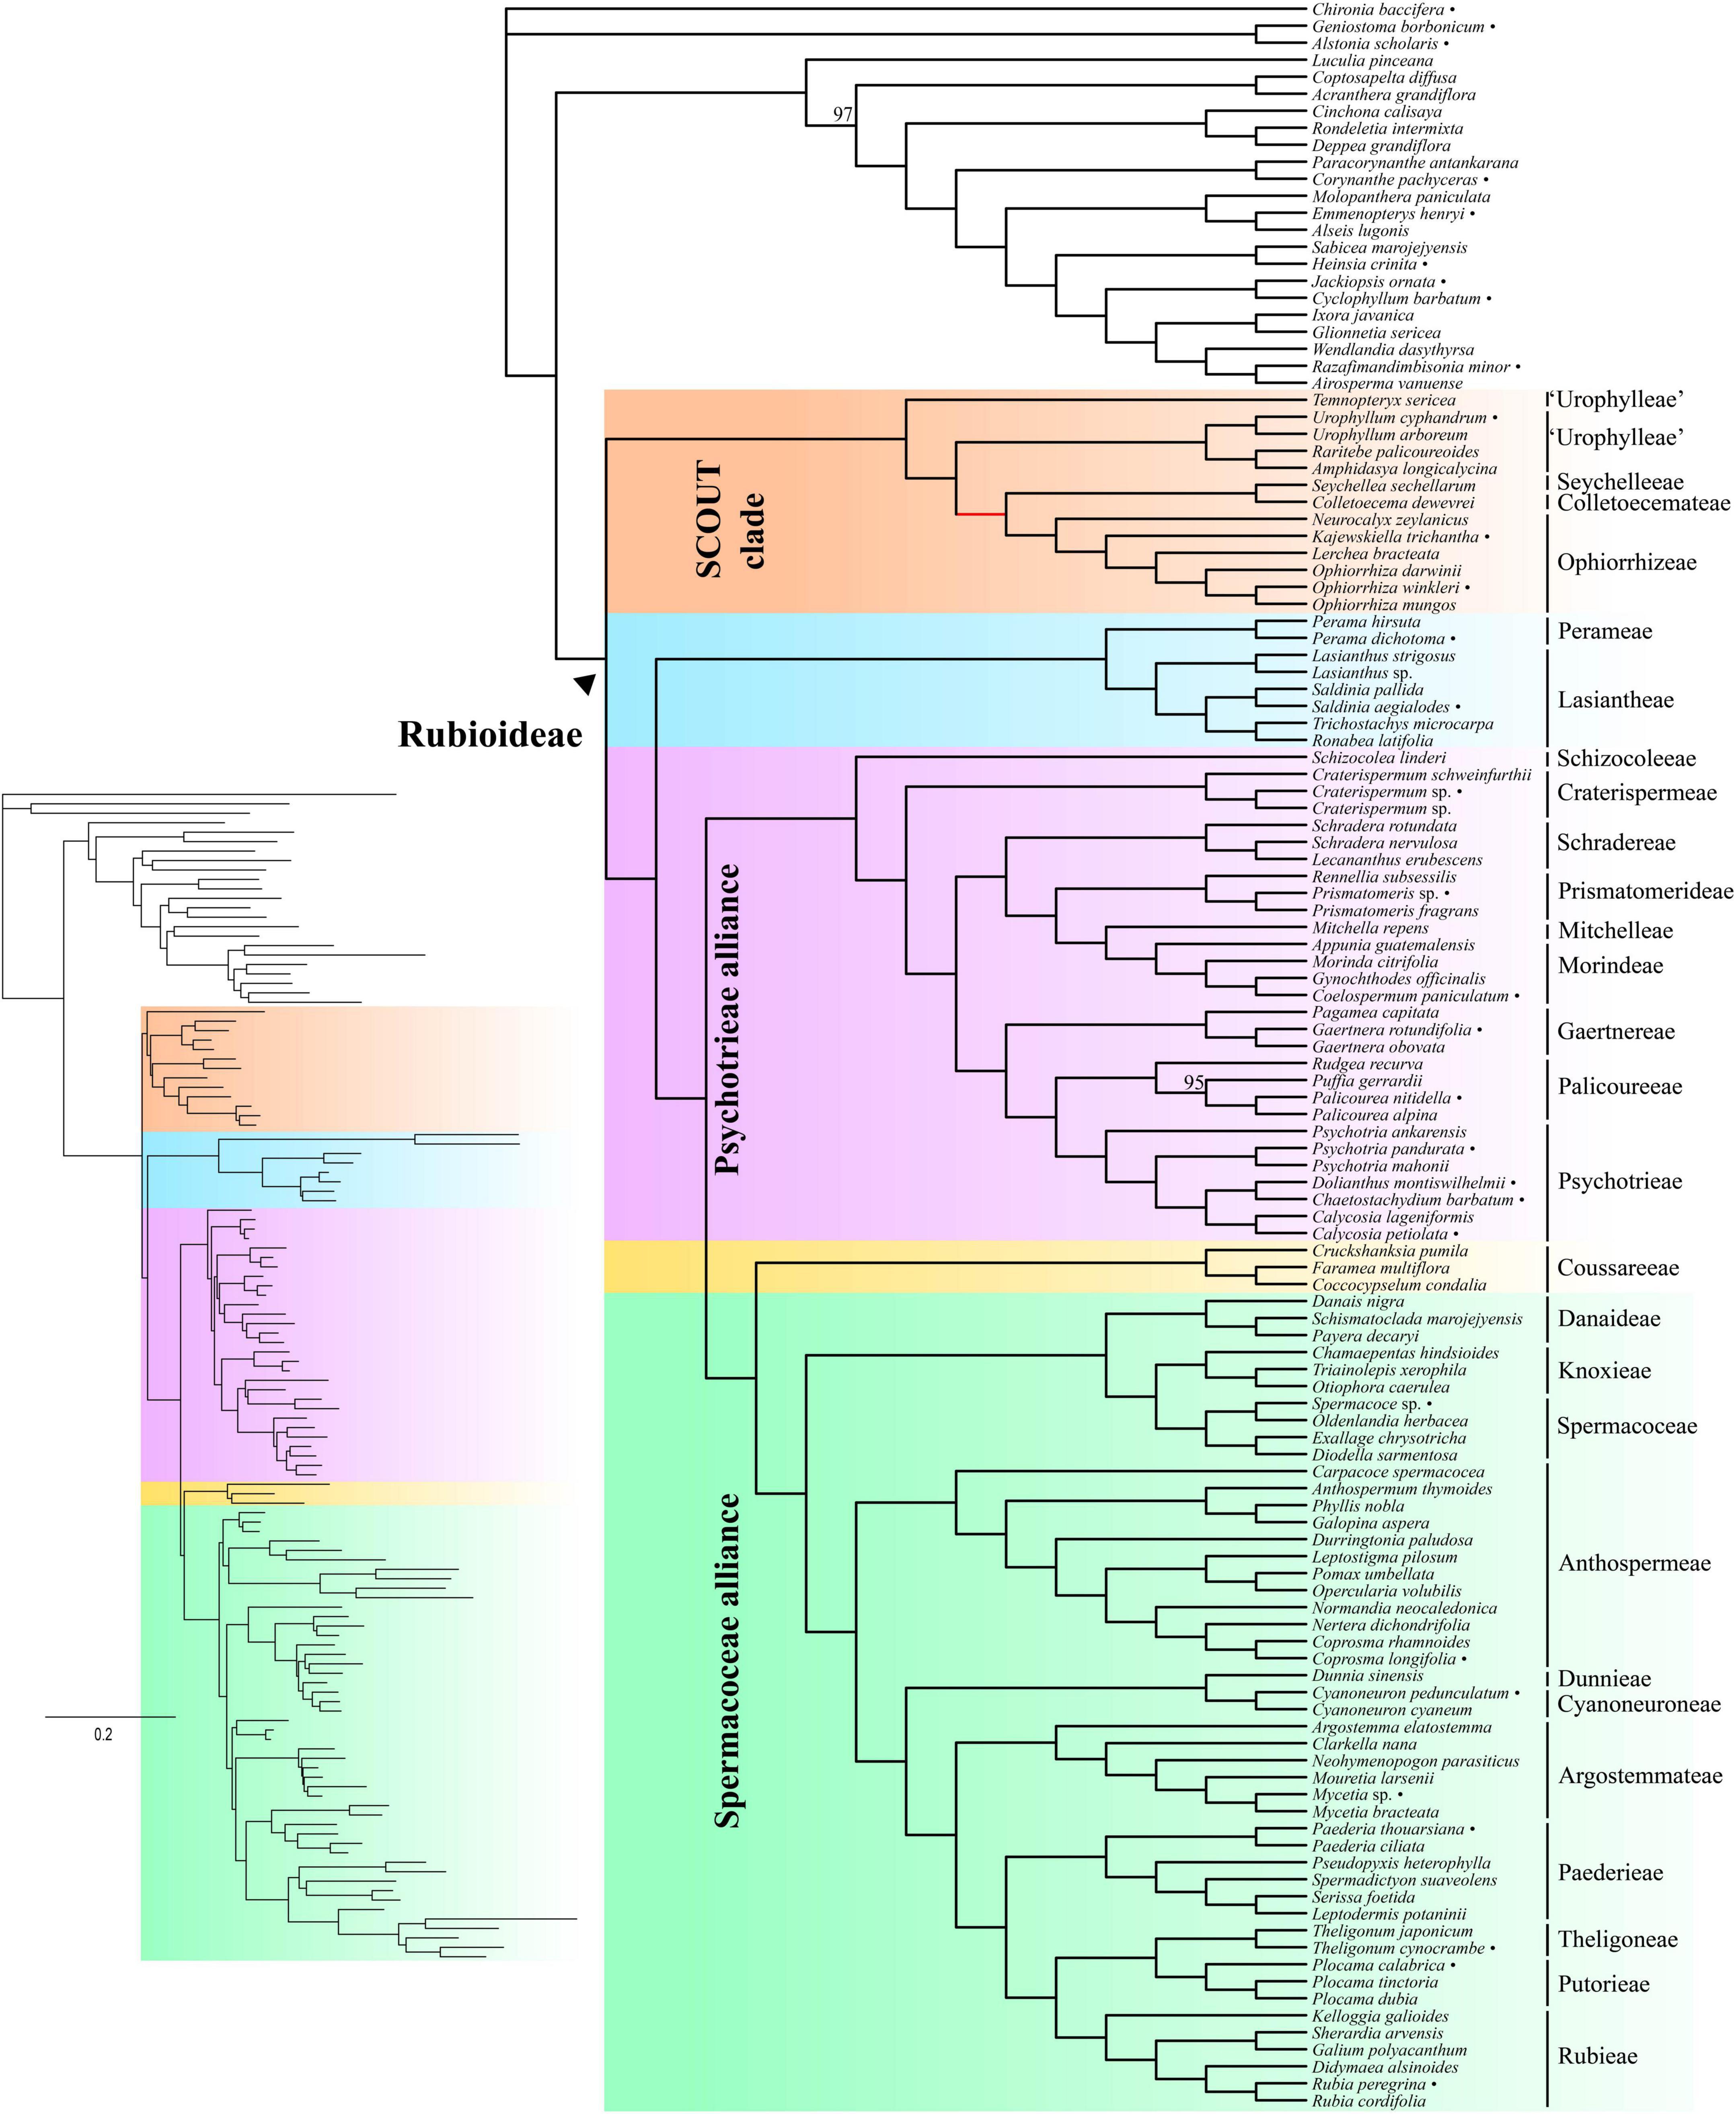
Figure 2. Concatenation-based tree estimated using IQ-TREE on the full supercontig dataset. Numbers above branches denote ultrafast bootstrap (BS) support values. Only support values smaller than 100% are shown. Bullets after species names indicate samples downloaded from ENA. Inset shows branch lengths in number of substitutions per site.
Monophyly of Rubioideae, alliances, and tribes
Rubioideae, the Spermacoceae and Psychotrieae alliances, and all tribes except Urophylleae were highly supported as monophyletic (Figures 1, 2). Urophylleae as delimited by Smedmark et al. (2008) was never monophyletic in any of the inferred species trees. However, Urophylleae excluding Temnopteryx was always highly supported as monophyletic (Figures 1, 2), and this clade will hereafter be referred to as Urophylleae sensu stricto (s.s.).
Rubioideae backbone
Colletoecemateae, Ophiorrhizeae, Seychelleeae, Urophylleae s.s., and the genus Temnopteryx formed a clade (hereafter referred to as the SCOUT clade) sister to remaining Rubioideae, followed by a Lasiantheae + Perameae clade, the Psychotrieae alliance and a clade that joins the tribe Coussareeae and the Spermacoceae alliance (Figures 1, 2). All these relationships were, with one exception, strongly supported and polytomies were rejected. The exception was the sister relationship between Coussareeae and the Spermacoceae alliance, which was strongly supported (BS = 100) in the concatenated analysis (Figure 2) but had low support (LPP = 0.75) in the coalescence-based tree (Figure 1) and a polytomy could not be rejected.
SCOUT clade
Relationships within the SCOUT clade differed between analytical approaches. The coalescence-based tree resolved the genus Temnopteryx as sister to the remaining members, followed by a Seychelleeae + Colletoecemateae clade, and a Urophylleae s.s. + Ophiorrhizeae clade (Figure 1). The concatenation-based tree instead resolved Ophiorrhizeae as sister to the Seychelleeae + Colletoecemateae clade (Figure 2). Support for these sets of relationships was high for all nodes and polytomies were rejected.
Psychotrieae alliance
The tribe Schizocoleeae and Craterispermeae were successive sisters to the remaining Psychotrieae alliance; this last clade was in turn resolved in two sister lineages: A clade formed by Schradereae, Prismatomerideae, Morindeae and Mitchelleae and a clade uniting Gaertnereae and Psychotrieae + Palicoureeae (Figures 1, 2). Within the former clade, Schradereae and Prismatomerideae are successive sisters to Morindeae plus Mitchelleae (Figures 1, 2). Support for this set of relationships was high for all nodes and polytomies were rejected.
Spermacoceae alliance
In the Spermacoceae alliance a clade that joins Danaideae and Spermacoceae + Knoxieae was together sister to the remaining tribes, followed by Anthospermeae, a clade that joins Dunnieae + Cyanoneuroneae, Argostemmateae, Paederieae, and a clade that joins Theligoneae and Putorieae and Rubieae (Figures 1, 2). Support for this set of relationships was high for all nodes and polytomies were rejected.
Discussion
The most comprehensive multigene phylogenetic analysis of Rubioideae yet published is presented here. The vast majority of nodes was strongly supported (≥ 95%) in both the coalescence-based and concatenation-based phylogenies (Figures 1, 2). We analyzed the data using a coalescent approach as well as a concatenation approach to phylogenetic inference of this group of plants, and we tested the inclusion/exclusion of putatively paralogous genes and the added information of non-targeted flanking regions in order to explore if relationships are reliant on a specific dataset or method. Leveraging substantial amounts of nuclear low-copy genetic data from a comprehensive taxon sample allowed us to infer a robust phylogenetic framework for the Rubioideae, potentially resolving and clarifying previously contentious relationships across the phylogeny of the group. For example, all inter-tribal relationships within the Spermacoceae and Psychotrieae alliances are robustly supported. Our study further supports the sister relationship between Coussareeae and the Spermacoceae alliance previously reported by Wikström et al. (2020) based on nuclear ribosomal cistron data. Within the Psychotrieae alliance, the Southeast Asian genus Lecananthus is nested in Schradera, more closely related to the Asian species Schradera nervulosa than either is to the neotropical Schradera rotundata. Clarkella is clearly included in the Argostemmateae, and Pseudopyxis in the Paederieae. The last three results are not unexpected considering morphological and geographic data. Furthermore, Temnopteryx is excluded from all currently described tribes of Rubiaceae; it is sister to remaining taxa in a well-supported SCOUT clade also comprising the tribes Seychelleeae, Colletoecemateae, Ophiorrhizeae and Urophylleae s.s., which together are supported as sister group to the remaining Rubioideae. Our study also shows that target capture data can resolve phylogenetic relationships with high confidence even in situations involving short branches, especially so when the combined information of coding and non-coding regions are used. Overall, our results indicate that ILS due to rapid diversification is likely one of the major underlying causes responsible for most of the phylogenetic incongruences at short branches in the Rubioideae phylogeny.
Impact of potential paralogs, data type, and analytical method on phylogenetic inference
Inclusion of paralogous sequences can have important consequences for phylogenetic inference (Fitch, 1970; Yang and Smith, 2014). However, the topological results based on the full and paralog-filtered datasets mainly agree and statistical support increases when all genes are used. These factors suggest that (potential) paralogy did not change the topological results in any significant way, although the NQS values indicated slightly less gene tree discordance in the paralog-filtered data. This is in line with the results of Yan et al. (2021), which showed that ASTRAL and other coalescence-based methods are robust to species tree inference also in the presence of paralogs. Their study did, however, not include analyses of concatenated datasets, in which outlier genes have been shown to have extreme impact on topological results (Brown and Thomson, 2017). We used the target-capture data assembly HybPiper pipeline to assemble our datasets. This pipeline identifies paralogous copies and by default selects one copy based on sequencing coverage and percent identity to the target sequence. In other words, one copy per sample for each gene is selected and the approach is often applied to assemble target capture datasets (e.g., Antonelli et al., 2021; Clarkson et al., 2021; Maurin et al., 2021). However, this method may also flag genes with allelic variants rather than paralogs (Johnson et al., 2016) and may not uncover all paralogs (Zhou et al., 2022). Hence, both over- and underestimation of the number of detected putative paralogs is a possible outcome. Another common approach to deal with paralogs is to exclude entire genes that show evidence of paralogy, e.g., by removing putatively paralogous genes flagged by HybPiper (e.g., Larridon et al., 2020; Christe et al., 2021; Kuhnhäuser et al., 2021). Here, this approach resulted in a severe reduction of available sequence data left for species tree inference, which is common when many species are sampled (Emms and Kelly, 2018; Jones et al., 2019). This strict reliance on one-to-one orthologs led to an overall decrease in support and is likely to be an overly conservative approach in many phylogenetic contexts. Although (potential) paralogy did not seem to have any significant impact on the topological results presented in this paper, a more thorough analysis of paralogy may be worthwhile for future studies of subclades (e.g., genera) of Rubioideae. For example, identified paralogous copies could be used as additional loci (Gardner et al., 2021).
One advantage of targeted enrichment sequencing is that it facilitates assembly of non-targeted exon-flanking regions, including introns and sequence 5′ and 3′ to CDSs (Weitemier et al., 2014). Using the combined information of targeted CDS and non-targeted non-coding flanking sequence (supercontigs) improved overall statistical support as measured by number of highly supported nodes and average statistical support when compared to analyses of targeted CDS regions only. This finding is corroborated by other studies that have demonstrated increased statistical support for relationships by addition of flanking regions (e.g., Jones et al., 2019; Bagley et al., 2020; Gardner et al., 2021; Thomas et al., 2021). Addition of flanking regions also increased gene tree concordance and the power to reject polytomies with the polytomy test implemented in ASTRAL. Highly variable non-coding regions can be difficult to align but conserved flanking exons can help improve accuracy by anchoring the alignment (Gardner et al., 2021). Non-coding regions generally have higher evolutionary rates relative to CDS and should therefore contain more phylogenetic information, which may be necessary in order to resolve rapid speciation events (Chen et al., 2017). On the other hand, the higher variability (both in length and evolutionary rate) of non-coding regions may lead to higher degrees of noise. The overall higher statistical support we obtained using supercontig sequences and higher NQS values indicate that potential noise is overcome by the increased signal contained in these larger datasets.
It is notable, however, that there is one supported intertribal conflict between the paralog-filtered CDS and supercontig coalescence-based trees. While the analysis of the paralog-filtered supercontig data supported a Knoxieae + Danaideae clade (LPP = 0.96; Supplementary Figure 3), the paralog-filtered CDS data supported a Knoxieae + Spermacoceae clade (Supplementary Figure 5; LPP = 1). The latter relationship is highly supported in all other analyses in this study (including the concatenated analysis of the paralog-filtered dataset) and is also well established based on previous analyses of organellar and nuclear ribosomal DNA (Rydin et al., 2017; Wikström et al., 2020). Inspection of quartet frequencies shows that the two alternative quartet frequencies around the Knoxieae + Danaideae branch are not close (Supplementary Figure 1). This is contrary to the expectation of matching frequencies between the two alternative topologies if incongruence is due to ILS, indicating that sources of discordance other than ILS are involved, such as gene tree estimation error or gene flow (Degnan and Rosenberg, 2009; Leebens-Mack et al., 2019). The failure of the paralog-filtered dataset to resolve the Knoxieae + Spermacoceae relationship may be due to the much lower gene sampling in that dataset. However, the two alternative quartet frequencies around the Knoxieae + Spermacoceae branch in the full supercontig tree are also not close (Figure 1). Interestingly, the two alternative quartet frequencies around the Knoxieae + Spermacoceae branch in the two CDS trees (Supplementary Figures 3, 5) are similar and more indicative of ILS as the main source of discordance. A possible explanation for the patterns of quartet frequencies between analysis of CDS and supercontig data is that the highly variable non-coding regions of the supercontigs introduce gene tree estimation error due to noise in this part of the tree. Another possible explanation could be that introgression of DNA is biased toward non-coding regions following hybridization.
Gene tree heterogeneity is widespread in multigene datasets (Edwards et al., 2016). Potential biological reasons for gene tree incongruence include ILS, hybridization, and gene duplication and loss (Maddison, 1997). Of these, ILS, which is modeled by the multispecies coalescent model (MSCM) (Pamilo and Nei, 1988), is the most prevalent and has so far received most attention (Edwards, 2009; Davidson et al., 2015). High levels of ILS are most likely to occur when there is a short time between speciation events, i.e., when internal branches of the species tree are short (Maddison, 1997; Whitfield and Lockhart, 2007). The concatenation approach combines the information from all available alignments into a single alignment and can mitigate low phylogenetic signal-to-noise problems (Philippe et al., 2005; de Queiroz and Gatesy, 2007). However, it ignores ILS and may, conversely to coalescence-based approaches, return highly supported but erroneous estimates of relationships in or near the anomaly zone, a region of tree space caused by successive rapid speciation events in the species tree, in which the most probable gene tree topology differs from the species tree topology (Degnan and Rosenberg, 2006; Kubatko and Degnan, 2007; Liu and Edwards, 2009; Edwards et al., 2016; Mendes and Hahn, 2018).
Despite this drawback concatenation often performs well under many conditions, even in the presence of moderately high ILS levels (Bayzid and Warnow, 2013; Mirarab et al., 2016). Unlike concatenation, ASTRAL and several other coalescence-based methods can accommodate gene tree discordance due to ILS, and are statistically consistent under the MSCM (Mirarab and Warnow, 2015; Roch and Steel, 2015). Yet, coalescence-based approaches have been criticized for violating the MSCM assumptions such as error-free gene trees, absence of recombination within genes and free recombination between genes (Gatesy and Springer, 2014). While violations of the assumption of free recombination between loci can result in inaccurate phylogenetic estimates (Wang and Liu, 2016), both simulation and empirical studies have indicated that analyses using ASTRAL are largely robust to inclusion of recombinant loci (Lanier and Knowles, 2012; Wang and Liu, 2016; Folk et al., 2017; Morales-Briones et al., 2018). Nevertheless, coalescent-based methods can be sensitive to gene tree error, which can be alleviated using more informative genes and/or collapsing poorly supported relationships in gene trees prior to species tree inference (Zhang et al., 2018).
In Rubioideae, concatenation- and coalescence-based approaches generated highly similar topologies. However, one notable and highly supported topological conflict between the two approaches was detected: in the concatenated tree Ophiorrhizeae and Colletoecemateae + Seychelleeae formed a clade (BS = 100; Figure 2), whereas Ophiorrhizeae and Urophylleae s.s. formed a clade (LPP = 0.99; Figure 1) in the coalescence tree. This part of the tree has successive relatively short internal branches, a typical pattern of the anomaly zone, and indicate that the divergent placements of Ophiorrhizeae can be due to ILS and how it is differently accounted for in the two analytical approaches (Linkem et al., 2016). While inaccurate ortholog inference as well as gene tree error can generate gene tree incongruence, the pattern of gene tree quartet frequencies (Figure 1) with one main topology and balanced frequencies among the alternative topologies is more compatible with ILS as the main source of incongruence (Zou et al., 2008; Degnan and Rosenberg, 2009). It should be noted that the same incongruence is found also between the two analyses of the paralog-filtered dataset (Supplementary Figures 3, 4), but the support for the Ophiorrhizeae + Urophylleae s.s. branch was low (LPP = 0.91) and a polytomy could not be rejected. In contrast, this incongruence was not observed in the trees resulting from the analyses of the two CDS datasets, but except for the well-supported Colletoecemateae + Seychelleeae branch, all other intertribal relationships within the SCOUT clade were poorly supported in those trees and polytomies could not be rejected (Supplementary Figures 1, 2, 5, 6).
Phylogeny of Rubioideae
SCOUT clade
Studies addressing the deepest divergences in Rubioideae have often come to different conclusions but have most commonly involved the relative placements of the tropical African tribe Colletoecemateae, the Australasian tribe Ophiorrhizeae and the pantropical tribe Urophylleae. Analyses based on chloroplast sequence data have shown contradictory results; early studies based on Sanger sequencing of a few selected markers often found Colletoecemateae as sister to the remaining members of the subfamily (Robbrecht and Manen, 2006; Rydin et al., 2008, 2009a) but using a relaxed-clock model, Wikström et al. (2015) instead found Urophylleae as sister to the remaining tribes. More recent phylogenomic work has also resulted in topological incongruence; Ophiorrhizeae was sister to the remaining Rubioideae based on plastome data (Wikström et al., 2020), whereas the study by Rydin et al. (2017) based on mitochondrial data instead found Colletoecemateae + Ophiorrhizeae as sister to the remaining subfamily. The few analyses using nuclear data have consistently found a Colletoecemateae-Ophiorrhizeae-Urophylleae clade as the sister-group to the remaining Rubioideae, a result first reported by Rydin et al. (2009a) based on nrITS data and more recently also found based on nuclear ribosomal cistron (Wikström et al., 2020) and Angiosperm353 data (Antonelli et al., 2021). Based on plastid markers, the monogeneric seychellean tribe Seychelleeae was recently found to be sister-taxon to the species-poor monogeneric tropical African tribe Colletoecemateae (Razafimandimbison et al., 2020), a relationship that is confirmed here. Our analyses consistently resolved a Seychelleeae-Colletoecemateae-Ophiorrhizeae-Urophylleae s.s. clade as the sister to the remaining subfamily Rubioideae, and we further show that the African genus Temnopteryx belongs in this clade, the SCOUT clade. Early classifications have differed in the tribal and subfamilial position of Temnopteryx, summarized by Khan et al. (2008), Smedmark et al. (2008). Khan et al. (2008) was the first phylogenetic study based on molecular to include Temnopteryx, and they showed that it belongs to Rubioideae although they did not resolve its position within the subfamily. In subsequent work based on molecular data (Smedmark et al., 2008, 2010; Smedmark and Bremer, 2011; Yang et al., 2016), Temnopteryx has been resolved as sister to the (remaining) tribe Urophylleae, although not always with high support. Here we instead find Temnopteryx strongly supported as sister to the remaining members of the SCOUT-clade (Figures 1, 2).
Lasiantheae-Perameae
The second deepest split in the Rubioideae phylogeny separates a Lasiantheae-Perameae clade from the remaining members of the subfamily, i.e., a clade comprising the Psychotrieae and Spermacoceae alliances and the tribe Coussareeae. The sister-group relationship between the monogeneric tribe Perameae and Lasiantheae was first found by Andersson and Rova (1999) based on plastid rps16 intron data and was considered surprising at the time, as there is no obvious morphological similarity between the two tribes. Although the tribe Perameae has not been as frequently sampled as Lasiantheae in molecular phylogenetic studies of Rubiaceae, the Lasiantheae-Perameae clade is well founded based on DNA sequence data with several subsequent studies supporting this relationship (e.g., Piesschaert et al., 2000; Smedmark et al., 2014; Antonelli et al., 2021; this study). While Perameae are tiny herbaceous plants with dry capsular fruits, Lasiantheae are woody, shrubby plants with fleshy drupes (Bremer and Manen, 2000; Smedmark et al., 2014). A feature they have in common is a solitary ovule in each locule, but the feature is found in several other members of Rubioideae as well (Bremer and Manen, 2000; Smedmark et al., 2014). The two tribes are thus morphologically distinct and we agree with previous authors (Andersson and Rova, 1999; Bremer and Manen, 2000) that merging the two tribes into Perameae should be avoided as it would create a morphologically undefinable taxon.
Coussareeae-Spermacoceae alliance
A notable result from the study by Wikström et al. (2020) was the placement of the tribe Coussareeae as sister to the Spermacoceae alliance on the basis of nuclear ribosomal data. The result conflicted with their own as well as previous results based on plastid data (Rydin et al., 2008, 2009a; Wikström et al., 2015, 2020; Neupane et al., 2017), plastid data + nrITS (Rydin et al., 2009b) and mitochondrial data (Rydin et al., 2017), which have all consistently supported the Coussareeae as sister to a clade comprised by the Spermacoceae and the Psychotrieae alliances. Our work (based on nuclear data) is congruent with the analyses of nuclear ribosomal cistron data by Wikström et al. (2020) regarding the relative positions of these three groups, but while the support for the sister relationship between the Coussareeae and the Spermacoceae alliance is high in the concatenated tree (BS = 100, Figure 2) it is relatively low in the coalescence-based tree (LPP = 0.75, Figure 1). The branch uniting Coussareeae and Spermacoceae alliance is short and gene tree heterogeneity high with quartet frequencies fairly even. Taken together, these findings indicate that ILS is the probable explanation for observed gene tree heterogeneity, and that a rapid speciation event may constitute the origin of these two sister clades.
Psychotrieae alliance
The nuclear phylogeny presented here includes representatives of all nine currently recognized tribes of the Psychotrieae alliance (Razafimandimbison et al., 2008, 2017) and shows, in contrast to previous studies based on Sanger-data, strong support across almost all relationships (including all inter-tribal relationships). Our study further supports the rare case of an evolutionary change from one-seeded carpels to many-seeded carpels found in the Psychotrieae alliance (Razafimandimbison et al., 2008), with Schradereae being the sole tribe with numerous ovules per locule. Our results are congruent with previously published phylogenies based on nuclear and mitochondrial data, although the studies by Rydin et al. (2017) and Wikström et al. (2020) did not include Schradereae and Antonelli et al. (2021) did not include Schradereae and Mitchelleae. Schradereae is here resolved as sister to the clade containing Prismatomerideae and the Morindeae-Mitchelleae clade. This clade is in turn sister to a clade comprising Gaertnereae and the Palicoureeae-Psychotrieae clade. The positions of the monogeneric African tribes Schizocoleeae and Craterispermeae as successive sisters to all other members of Psychotrieae alliance is consistent also with previous analyses based on plastid data. However, analyses of plastid data have found a sister-relationship between Gaertnereae and Prismatomerideae together sister to the Morindeae-Mitchelleae clade (Wikström et al., 2020; Antonelli et al., 2021), or Gaertnereae forming a clade with Schradereae, Morindeae and Mitchelleae together sister to the Palicoureeae-Psychotrieae clade with Prismatomerideae placed as sister to those two clades (Wikström et al., 2015).
Analyses based on combined plastid and nuclear ribosomal markers have largely produced results consistent with our results but have supported a Craterispermeae + Prismatomerideae clade (Razafimandimbison et al., 2008), or the placement of Gaertnereae in a clade together with Schradereae, Prismatomerideae, Mitchelleae and Morindeae (Razafimandimbison et al., 2017). It is interesting to note that the nuclear results and mitochondrial results agree and are both in conflict with the plastid signal. Such discrepancies between results obtained with nuclear and mitochondrial data on one hand and plastid data on the other may be the result of old introgression events. However, the relatively short branch lengths and the quartet frequencies along the backbone nodes of the Psychotrieae alliance indicate relatively high levels of ILS during the early diversification of this clade.
Spermacoceae alliance
Resolving relationships in Spermacoceae alliance has been problematic, with relationships either unconvincingly supported or showing discordant topologies. In the Spermacoceae alliance our results support the position of the Danaideae-Knoxieae-Spermacoceae clade as sister taxon to the remaining members of the alliance. Several previous studies have shown results congruent with this, including a study based on mitochondrial data Rydin et al. (2017), the plastome-based phylogenomic analyses in Wikström et al. (2020), and analyses of a few selected plastid markers alone or in combination with nuclear ribosomal ITS (nrITS, e.g., Rydin et al., 2009a; Krüger, 2014; Wikström et al., 2015; Thureborn et al., 2019). Other analyses based on a few selected plastid markers, alone or in combination with nuclear ribosomal ITS, have not produced results congruent with ours, but have often found Danaideae as sole sister to the remaining members of the alliance (e.g., Bremer and Manen, 2000; Bremer and Eriksson, 2009; Rydin et al., 2009b; Yang et al., 2016). Analyses of the nuclear ribosomal cistron recovered yet another unexpected relationship with Anthospermeae sister to the Knoxieae-Spermacoceae clade, and Danaideae nested in a clade comprising the other sampled members of the alliance (Wikström et al., 2020). Further, the results presented by Antonelli et al. (2021) based on nuclear Angiosperms353 data showed surprisingly Argostemmateae (represented by one sample, Mycetia sp.) followed by Spermacoceae (represented by one sample, Spermacoce sp.) as successive sisters to the rest of Spermacoceae alliance. Those same samples were included in the present study (Figures 1, 2), yielding other (more expected) topological placements of these samples. The discordance between our results and those of Antonelli et al. (2021) regarding the phylogenetic placement of these two samples may potentially be explained by the denser taxon sampling in the present study, for example in terms of tribes (11 vs. 8) and genera (40 vs. 10).
In the Rubieae complex, our results support the sister-relationship between Theligoneae and Putorieae and corroborate previous results based on nuclear ribosomal cistron Wikström et al. (2020) and Angiosperm353 data (Antonelli et al., 2021). Previous studies utilizing plastid data or a combination of plastid and nrITS data have either shown results consistent with our result (Yang et al., 2016; Antonelli et al., 2021; Rincón-Barrado et al., 2021) or have instead resolved Theligoneae and Rubieae as sister groups (e.g., Backlund et al., 2007; Bremer and Eriksson, 2009; Rydin et al., 2009b; Deng et al., 2017; Ehrendorfer et al., 2018; Wikström et al., 2020), a result also found when analyzing mitochondrial data (Rydin et al., 2017). While obvious morphological similarities supporting the Theligoneae + Rubieae clade seem to be lacking (Ehrendorfer et al., 2018) there are some morphological characters shared between some Putorieae species and members of clades within Rubieae (Natali et al., 1995; Ehrendorfer et al., 2018). Interestingly a recent study (Bordbar et al., 2021) found on the basis of the plastid trnL-F marker that Plocama rosea (Hemsl. ex Aitch.) M.Backlund and Thulin (= Aitchisonia rosea Hemsl. ex Aitch.) formed a clade with Rubieae, with Theligoneae and a clade containing the remaining sampled Putorieae/Plocama species as successive sisters to this clade. Based on those results the authors resurrected the monospecific genus Aitchisonia Hemsl. ex Aitch., and described the new monogeneric tribe Aitchisonieae to accommodate A. rosea. However, based on nrITS data the placement of Plocama rosea was inconclusive (Bordbar et al., 2021).
The sister group to the Rubieae complex is in our trees the tribe Paederieae, a relationship previously found in analyses based on nuclear and/or plastid data (Robbrecht and Manen, 2006; Rydin et al., 2009a,b; Wikström et al., 2015, 2020; Yang et al., 2016; Antonelli et al., 2021), although based on data from the mitochondrion this relationship was intervened by Argostemmateae (Rydin et al., 2017).
In our trees Anthospermeae, the Dunnieae + Cyanoneuroneae clade and Argostemmateae are supported as sequential sister groups to the Paederieae-Rubieae complex clade, a result fully congruent with the analyses of plastid data in Wikström et al. (2020). Other previous studies using plastid data and a combination of plastid and nuclear nrITS data have often been partly congruent with our results. The Anthospermeae-sister relationship has often been well supported but relationships among representatives of the remaining groups have generally been poorly supported (Rydin et al., 2009a,b; Wikström et al., 2015; Yang et al., 2016). Analyses of mitochondrial data have instead found Anthospermeae + Dunnieae, Paederieae and Argostemmateae as successive sisters to the Rubieae complex (Rydin et al., 2017). Analyses of the nuclear ribosomal cistron supported Anthospermeae as sister to the Knoxieae-Spermacoceae clade, and Danaideae nested in a clade containing the other sampled members of the alliance (Wikström et al., 2020). Previous analyses utilizing nuclear Angiosperm353 data (Antonelli et al., 2021) found Argostemmateae placed as sister to the remaining Spermacoceae alliance (represented by Spermacoceae, Cyanoneuroneae, Anthospermeae, Paederieae and the Rubieae complex) in their coalescence-based tree (their concatenation-based tree was inconclusive except for the Paederieae-Rubieae complex phylogeny). However, our respective results are not fully comparable since Argostemmateae in our study includes also the single representative sample of Argostemmateae (Mycetia sp.) used in Antonelli et al. (2021) and the conflicting signal may thus be due to low sampling in their study relative to ours.
Our results support the close relationship between the two relatively recently described monogeneric tribes Dunnieae (China) (Rydin et al., 2009b) and Cyanoneuroneae (Borneo and Sulawesi) (Ginter et al., 2015). This result is congruent with Ginter et al. (2015) who, based on combined plastid and nuclear (nrETS and nrITS) data, found that those two tribes formed a clade that also included yet another recently described monogeneric tribe, the Foonchewieae from China (Wen and Wang, 2012). Thureborn et al. (2019) included representation from all these three tribes and found, based on plastid data, that they form a clade together with Argostemmateae (appendix B in Thureborn et al., 2019). Recent studies addressing major relationships in Rubiaceae have otherwise typically only included representation from one of these three tribes [for example, Antonelli et al. (2021) included Cyanoneuroneae and Rydin et al. (2017) and Wikström et al. (2020) included Dunnieae], but the close relationship between Foonchewieae and Dunnieae has been confirmed in several studies based on analyses of plastid data (Wikström et al., 2015; Yang et al., 2016). However, a highly unexpected placement of Cyanoneuroneae was found in the plastid tree of Antonelli et al. (2021); the Spermacoceae alliance excluding Cyanoneuroneae was strongly supported and Cyanoneuroneae was with strong support deeply nested in a clade comprising the sampled members of the Psychotrieae alliance. This result is not retrieved in other previous studies, nor in the results of the present study.
Infratribal relationships
Within tribes, our results reveal novel relationships and place a genus previously not included in phylogenetic analyses based on molecular data. Here we discuss intergeneric relationships within tribes whenever relevant and/or possible considering our sample of taxa.
Ophiorrhizeae
Within the Ophiorrhizeae, Neurocalyx is sister to the remaining tribe, and Kajewskiella is sister to Lerchea + Ophiorrhiza (Figures 1, 2). The results are consistent with those of a recent study that investigated the phylogeny of Ophiorrhizeae using extensive species representation, five molecular markers and morphological considerations (Razafimandimbison and Rydin, 2019). Material for DNA-sequencing of Kajewskiella was unavailable to the authors at the time, but they predicted its inclusion in Ophiorrhizeae based on morphology, presumably sister to Xanthophytum (Razafimandimbison and Rydin, 2019). A later study included molecular data from Kajewskiella and confirmed its phylogenetic position in Ophiorrhizeae (Antonelli et al., 2021), although limited taxon sampling prevented further conclusions. The exact position of Kajewskiella within Ophiorrhizeae remains unresolved. The affinity to Xanthophytum was first suggested by Tange (1995) who discovered raphides in bract tissue in the inflorescences, “…indistinguishable from those found in Xanthophytum” (citation from Tange, 1995). The author found additional morphological indications of an affinity to Xanthophytum (Tange, 1995), and this was thus endorsed in the recent (greatly expanded) study of Ophiorrhizeae by some of us (Razafimandimbison and Rydin, 2019). Furthermore, Tange (1995) added information on Kajewskiella to Axelius’s (1990) morphological data matrix of Xanthophytum, and reported that his parsimony analysis of the data placed Kajewskiella with Xanthophytum papuanum, X. grandiporum, X. magnisepalum, and X. nitens, a clade that had a derived position in Axelius’s work (Axelius, 1990). There is thus ample morphological support for the reduction of Kajewskiella into Xanthophytum, as suggested by Tange (1995), but the hypothesis remains to be tested using molecular data from an adequate sample of species within the entire tribe, analyzed with state-of-the-art analytical tools.
Schradereae
In the tribe Schradereae, the Southeast Asian genus Lecananthus (Puff et al., 1998a) was recently shown to be nested in Schradera (Razafimandimbison et al., 2017), a result corroborated in the current study and further confirming the paraphyly of Schradera as delimited by Puff et al. (1998b). However, here Lecananthus is more closely related to the Asian species Schradera nervulosa than to the neotropical species Schradera rotundata.
Anthospermeae
We included representatives from 11 of the 12 genera of the Anthospermeae; only Nenax was not sampled since a recent study showed that species of Nenax are intermixed with those of Anthospermum in an Anthospermum-Nenax clade (Thureborn et al., 2019). Our results support the position of the South African genus Carpacoce as sister to a clade that unites an African clade and a Pacific clade, which is entirely congruent with results in Thureborn et al. (2019). Within the African clade, the positions of the southeastern Africa-centered genus Galopina and the Macaronesian genus Phyllis and their relationship(s) to Anthospermum-Nenax have been problematic with incongruent results and poor statistic support (Anderson et al., 2001; Yang et al., 2016; Thureborn et al., 2019). Here, Galopina and Phyllis form a highly supported clade (Figures 1, 2), a relationship that has been suggested based on morphology (Sunding, 1979). It is worth noting that although this sister relationship is highly supported in all concatenated trees, only the supercontig dataset that includes non-coding data had the power to reject the null hypothesis of a polytomy for this relatively short branch. The quartet frequencies (Figure 1) indicate that ILS contributes to a large proportion of the gene tree incongruence, which in combination with a relatively short branch suggest rapid speciation in the diversification history of this group. Within the Pacific clade, our results support the Australian genus Durringtonia as sister to the remaining clade, which in turn comprises (a) Leptostigma and Pomax + Opercularia, and (b) Normandia and Coprosma + Nertera. The analyses of nuclear data by Thureborn et al. (2019) placed Durringtonia in the latter clade but results were otherwise completely congruent with those presented here. Our results show that the subtribal classification of Anthospermeae, based mainly on flower and fruit characters (Puff, 1982), needs revision. The Australian subtribe Operculariinae (Pomax and Opercularia) is monophyletic but is nested in the paraphyletic subtribe Coprosminae. Analyses of plastid data have previously indicated that both these subtribes are non-monophyletic (Thureborn et al., 2019) but support values were not significant. It should further be noted that Thureborn et al. (2019) detected some cases of supported cytonuclear discordance in the tribe. Generic interrelationships in Anthospermeae should be further investigated using genomic data.
Argostemmateae
Five of the genera we included in the present study were resolved in the Argostemmateae: Argostemma, Clarkella, Neohymenopogon, Mouretia, and Mycetia. Argostemma is sister to the remaining tribe. Clarkella, a small Asian herbaceous genus containing a single species (Clarkella nana), is here addressed for the first time using molecular data (but see Figure 2C in Yang et al., 2016), and the results show that it belongs in Argostemmateae, sister to Neohymenopogon + a Mycetia–Mouretia clade (Figures 1, 2). Clarkella is currently placed in its own tribe Clarkelleae (Deb, 2001), but it was placed in Argostemmateae in earlier classifications (Verdcourt, 1958; Bremekamp, 1966). It was later excluded from Argostemmateae based on flower and pollen characters (Bremer, 1987) but both vegetative and fruit characters of Clarkella resemble those of some species of Argostemma (Puff and Chayamarit, 2008).
The intergeneric relationships within Argostemmateae are identical between the two inference methods we used (Figures 1, 2) and all but one node (the Neohymenopogon + Mycetia–Mouretia clade in the coalescent tree, where a polytomy could not be rejected; Figure 1) are strongly supported. Our results differ, however, from those in previous studies (which are based on limited amount of molecular data, i.e., Rydin et al., 2009b; Ginter et al., 2015; Yang et al., 2016). Results in those studies are not always well supported and we too find indications of inconsistency regarding relationships in Argostemmateae. For example, in the analyses of the full CDS data, the coalescent tree supports a Neohymenopogon + Mouretia clade (Supplementary Figure 1), and the concatenation tree was inconclusive (i.e., support values were below 95%) for several relationships (Supplementary Figure 2) and inconsistent with the coalescent tree. Addition of data in the form of genes or longer sequences has been shown to lead to more congruence between species tree estimates (Cai et al., 2021; Gardner et al., 2021), and such a trend seems to be present also in Argostemmateae. Relationships in the tribe should nevertheless be investigated further, preferably also including the Asian and herbaceous genus Leptomischus, which recently was proposed to be sister to the remaining Argostemmateae based on plastid (rbcL) data (Razafimandimbison and Rydin, 2019).
Paederieae
We included five (Leptodermis, Paederia, Pseudopyxis, Serissa, and Spermadictyon) of the six currently recognized genera of Paederieae (Backlund et al., 2007; Rydin et al., 2009b). One of those is Pseudopyxis (P. heterophylleae), a genus here included in a molecular study for the first time. Its inclusion in the Paederieae is in line with Puff’s (1982) classification of this tribe on the basis of morphology and geography. Pseudopyxis (three species) comprises perennial herbs occurring in China and Japan, and is here sister to a mainly woody Southeast Asian clade consisting of Spermadictyon, Leptodermis, and Serissa. Sister to those four genera is Paederia, a genus of pantropical and woody climbers. Our results agree well with the informal infratribal groupings suggested by Puff (1989) based on morphology and geography and are also consistent with previous molecular results based on plastid data (Backlund et al., 2007; Yang et al., 2016) as well as results based on a combination of plastid data and nrITS data (Rydin et al., 2009b). The Southeast Asian genus Saprosma is unfortunately not represented in our study. The genus was placed in Paederieae by Robbrecht (1993) based on morphology, and most subsequent work based on molecular data has since supported this, placing Saprosma either as sister to all other members of Paederieae (Rydin et al., 2009b) or sister to Paederia (Yang et al., 2016). It was however sister to the Rubieae complex in Backlund et al. (2007).
Data availability statement
The raw data generated for the present study are deposited in the European Nucleotide Archive (ENA) under study accession number PRJEB53647. The ENA sample accession numbers of all the samples are available in Supplementary Table 1. The target file used for HybPiper assembly and the assembled sequences are uploaded to Dryad Digital Repository, doi: 10.5061/dryad.d7wm37q44.
Author contributions
OT carried out the molecular experiments, post-sequencing bioinformatics analyses, and the phylogenetic analyses, and wrote the manuscript with input from all authors. All authors contributed to conception and design of the study, read, and approved the submitted version.
Funding
This project was funded by the Royal Swedish Academy of Sciences to CR.
Acknowledgments
We thank the herbaria AAU, BRI, CAS, CR, FUHM, GB, KLU, L, MEXU, MO, P, S, SBT, SEY, SPF, UPS, WAG, and WU for access to their collections and Anbar Khodabandeh, Bodil Cronholm, and Martin Irestedt for technical help related to library preparation and/or sequencing. We also thank the two reviewers for their constructive and helpful comments on the manuscript. We acknowledge support from the National Genomics Infrastructure in Stockholm funded by Science for Life Laboratory, the Knut and Alice Wallenberg Foundation and the Swedish Research Council, and SNIC/Uppsala Multidisciplinary Center for Advanced Computational Science for assistance with massively parallel sequencing and access to the UPPMAX computational infrastructure.
Conflict of interest
The authors declare that the research was conducted in the absence of any commercial or financial relationships that could be construed as a potential conflict of interest.
Publisher’s note
All claims expressed in this article are solely those of the authors and do not necessarily represent those of their affiliated organizations, or those of the publisher, the editors and the reviewers. Any product that may be evaluated in this article, or claim that may be made by its manufacturer, is not guaranteed or endorsed by the publisher.
Supplementary material
The Supplementary Material for this article can be found online at: https://www.frontiersin.org/articles/10.3389/fpls.2022.967456/full#supplementary-material
Footnotes
References
Anderson, C. L., Rova, J. H. E., and Andersson, L. (2001). Molecular phylogeny of the tribe Anthospermeae (Rubiaceae): Systematic and biogeographic implications. Aust. Syst. Bot. 14:231. doi: 10.1071/SB00021
Andersson, L., and Rova, J. H. E. (1999). The rps16 intron and the phylogeny of the Rubioideae (Rubiaceae). Plant Syst. Evol. 214, 161–186. doi: 10.1007/BF00985737
Antonelli, A., Clarkson, J. J., Kainulainen, K., Maurin, O., Brewer, G. E., Davis, A. P., et al. (2021). Settling a family feud: A high-level phylogenomic framework for the Gentianales based on 353 nuclear genes and partial plastomes. Am. J. Bot. 108, 1143–1165. doi: 10.1002/ajb2.1697
Antonelli, A., Nylander, J. A. A., Persson, C., and Sanmartín, I. (2009). Tracing the impact of the Andean uplift on Neotropical plant evolution. Proc. Natl. Acad. Sci. 106, 9749–9754. doi: 10.1073/pnas.0811421106
Axelius, B. (1990). The genus Xanthophytum (Rubiaceae). Taxonomy, phylogeny and biogeography. Blumea Biodivers. Evol. Biogeogr. Plants 34, 425–497.
Backlund, M., Bremer, B., and Thulin, M. (2007). Paraphyly of Paederieae, recognition of Putorieae and expansion of Plocama (Rubiaceae-Rubioideae). Taxon 56, 315–328. doi: 10.1002/tax.562006
Bagley, J. C., Uribe-Convers, S., Carlsen, M. M., and Muchhala, N. (2020). Utility of targeted sequence capture for phylogenomics in rapid, recent angiosperm radiations: Neotropical Burmeistera bellflowers as a case study. Mol. Phylogenet. Evol. 152:106769. doi: 10.1016/j.ympev.2020.106769
Baker, W. J., Bailey, P., Barber, V., Barker, A., Bellot, S., Bishop, D., et al. (2022). A comprehensive phylogenomic platform for exploring the angiosperm tree of life. Syst. Biol. 71, 301–319. doi: 10.1093/sysbio/syab035
Bankevich, A., Nurk, S., Antipov, D., Gurevich, A. A., Dvorkin, M., Kulikov, A. S., et al. (2012). SPAdes: A new genome assembly algorithm and its applications to single-cell sequencing. J. Comput. Biol. 19, 455–477. doi: 10.1089/cmb.2012.0021
Bayzid, M. S., and Warnow, T. (2013). Naive binning improves phylogenomic analyses. Bioinformatics 29, 2277–2284. doi: 10.1093/bioinformatics/btt394
BBTools (2022). BBMap. Available online at: https://sourceforge.net/projects/bbmap/. (accessed February 7, 2021).
Bordbar, F., Mirtadzadini, M., and Razafimandimbison, S. G. (2021). Phylogenetic re-assessment of the delimitation of Plocama and its species relationships and limits (Rubiaceae, Putorieae): Resurrection of the monospecific genus Aitchisonia and a description of trib. nov. Aitchisonieae. Plant Syst. Evol. 308:7. doi: 10.1007/s00606-021-01799-4
Borowiec, M. (2019). Spruceup: Fast and flexible identification, visualization, and removal of outliers from large multiple sequence alignments. J. Open Source Softw. 41635. doi: 10.21105/joss.01635
Borowiec, M. L. (2016). AMAS: A fast tool for alignment manipulation and computing of summary statistics. PeerJ 4:e1660. doi: 10.7717/peerj.1660
Braun, E. L., and Kimball, R. T. (2021). Data types and the phylogeny of Neoaves. Birds 2, 1–22. doi: 10.3390/birds2010001
Bremekamp, C. E. B. (1966). Remarks on the position, the delimitation and the subdivision of the Rubiaceae. Acta Bot. Neerlandica 15, 1–33. doi: 10.1111/j.1438-8677.1966.tb00207.x
Bremer, B. (1987). The sister group of the paleotropical tribe Argostemmateae: A redefined neotropical tribe Hamelieae (Rubiaceae, Rubioideae). Cladistics 3, 35–51. doi: 10.1111/j.1096-0031.1987.tb00495.x
Bremer, B., and Eriksson, T. (2009). Time tree of Rubiaceae: Phylogeny and dating the family, subfamilies, and tribes. Int. J. Plant Sci. 170, 766–793. doi: 10.1086/599077
Bremer, B., and Manen, J.-F. (2000). Phylogeny and classification of the subfamily Rubioideae (Rubiaceae). Plant Syst. Evol. 225, 43–72. doi: 10.1007/BF00985458
Brown, J. M., and Thomson, R. C. (2017). Bayes factors unmask highly variable information content, bias, and extreme influence in phylogenomic analyses. Syst. Biol. 66, 517–530. doi: 10.1093/sysbio/syw101
Cai, L., Xi, Z., Lemmon, E. M., Lemmon, A. R., Mast, A., Buddenhagen, C. E., et al. (2021). The perfect storm: Gene tree estimation error, incomplete lineage sorting, and ancient gene flow explain the most recalcitrant ancient angiosperm clade, Malpighiales. Syst. Biol. 70, 491–507. doi: 10.1093/sysbio/syaa083
Chen, M.-Y., Liang, D., and Zhang, P. (2017). Phylogenomic resolution of the phylogeny of laurasiatherian mammals: Exploring phylogenetic signals within coding and noncoding sequences. Genome Biol. Evol. 9, 1998–2012. doi: 10.1093/gbe/evx147
Chernomor, O., von Haeseler, A., and Minh, B. Q. (2016). Terrace aware data structure for phylogenomic inference from supermatrices. Syst. Biol. 65, 997–1008. doi: 10.1093/sysbio/syw037
Christe, C., Boluda, C. G., Koubínová, D., Gautier, L., and Naciri, Y. (2021). New genetic markers for Sapotaceae phylogenomics: More than 600 nuclear genes applicable from family to population levels. Mol. Phylogenet. Evol. 160:107123. doi: 10.1016/j.ympev.2021.107123
Clarkson, J. J., Zuntini, A. R., Maurin, O., Downie, S. R., Plunkett, G. M., Nicolas, A. N., et al. (2021). A higher-level nuclear phylogenomic study of the carrot family (Apiaceae). Am. J. Bot. 108, 1252–1269. doi: 10.1002/ajb2.1701
Criscuolo, A., and Gribaldo, S. (2010). BMGE (Block Mapping and Gathering with Entropy): A new software for selection of phylogenetic informative regions from multiple sequence alignments. BMC Evol. Biol. 10:210. doi: 10.1186/1471-2148-10-210
Davidson, R., Vachaspati, P., Mirarab, S., and Warnow, T. (2015). Phylogenomic species tree estimation in the presence of incomplete lineage sorting and horizontal gene transfer. BMC Genomics 16:S1. doi: 10.1186/1471-2164-16-S10-S1
Davis, A. P., Govaerts, R., Bridson, D. M., Ruhsam, M., Moat, J., and Brummitt, N. A. (2009). A global assessment of distribution, diversity, endemism, and taxonomic effort in the Rubiaceae. Ann. Mo. Bot. Gard. 96, 68–78. doi: 10.3417/2006205
de Queiroz, A., and Gatesy, J. (2007). The supermatrix approach to systematics. Trends Ecol. Evol. 22, 34–41. doi: 10.1016/j.tree.2006.10.002
Degnan, J. H., and Rosenberg, N. A. (2006). Discordance of species trees with their most likely gene trees. PLoS Genet. 2:e68. doi: 10.1371/journal.pgen.0020068
Degnan, J. H., and Rosenberg, N. A. (2009). Gene tree discordance, phylogenetic inference and the multispecies coalescent. Trends Ecol. Evol. 24, 332–340. doi: 10.1016/j.tree.2009.01.009
Deng, T., Zhang, J.-W., Meng, Y., Volis, S., Sun, H., and Nie, Z.-L. (2017). Role of the Qinghai-Tibetan Plateau uplift in the Northern Hemisphere disjunction: Evidence from two herbaceous genera of Rubiaceae. Sci. Rep. 7:13411. doi: 10.1038/s41598-017-13543-5
Doyle, J. J., and Doyle, J. L. (1987). A rapid DNA isolation procedure for small quantities of fresh leaf tissue. Phytochem. Bull. 19, 11–15.
Doyle, J. J. (2022). Defining coalescent genes: Theory meets practice in organelle phylogenomics. Syst. Biol. 71, 476–489.
Edwards, S. V. (2009). Is a new and general theory of molecular systematics emerging? Evolution 63, 1–19. doi: 10.1111/j.1558-5646.2008.00549.x
Edwards, S. V., Xi, Z., Janke, A., Faircloth, B. C., McCormack, J. E., Glenn, T. C., et al. (2016). Implementing and testing the multispecies coalescent model: A valuable paradigm for phylogenomics. Mol. Phylogenet. Evol. 94, 447–462. doi: 10.1016/j.ympev.2015.10.027
Ehrendorfer, F., Barfuss, M. H. J., Manen, J.-F., and Schneeweiss, G. M. (2018). Phylogeny, character evolution and spatiotemporal diversification of the species-rich and world-wide distributed tribe Rubieae (Rubiaceae). PLoS One 13:e0207615. doi: 10.1371/journal.pone.0207615
Emms, D. M., and Kelly, S. (2018). STAG: Species tree inference from all genes. bioRxiv [preprint]. doi: 10.1101/267914
Fitch, W. M. (1970). Distinguishing homologous from analogous proteins. Syst. Zool. 19, 99–113. doi: 10.2307/2412448
Folk, R. A., Mandel, J. R., and Freudenstein, J. V. (2017). Ancestral gene flow and parallel organellar genome capture result in extreme phylogenomic discord in a lineage of angiosperms. Syst. Biol. 66, 320–337. doi: 10.1093/sysbio/syw083
Gardner, E. M., Johnson, M. G., Pereira, J. T., Puad, A. S. A., Arifiani, D., and Sahromi, et al. (2021). Paralogs and off-target sequences improve phylogenetic resolution in a densely sampled study of the breadfruit genus (Artocarpus, Moraceae). Syst. Biol. 70, 558–575. doi: 10.1093/sysbio/syaa073
Gatesy, J., and Springer, M. S. (2014). Phylogenetic analysis at deep timescales: Unreliable gene trees, bypassed hidden support, and the coalescence/concatalescence conundrum. Mol. Phylogenet. Evol. 80, 231–266. doi: 10.1016/j.ympev.2014.08.013
Ginter, A., Razafimandimbison, S. G., and Bremer, B. (2015). Phylogenetic affinities of Myrioneuron and Cyanoneuron, generic limits of the tribe Argostemmateae and description of a new Asian tribe, Cyanoneuroneae (Rubiaceae). Taxon 64, 286–298. doi: 10.12705/642.2
Gitzendanner, M. A., Soltis, P. S., Wong, G. K.-S., Ruhfel, B. R., and Soltis, D. E. (2018). Plastid phylogenomic analysis of green plants: A billion years of evolutionary history. Am. J. Bot. 105, 291–301. doi: 10.1002/ajb2.1048
Hale, H., Gardner, E. M., Viruel, J., Pokorny, L., and Johnson, M. G. (2020). Strategies for reducing per-sample costs in target capture sequencing for phylogenomics and population genomics in plants. Appl. Plant Sci. 8:e11337. doi: 10.1002/aps3.11337
Hoang, D. T., Chernomor, O., von Haeseler, A., Minh, B. Q., and Vinh, L. S. (2018). UFBoot2: Improving the ultrafast bootstrap approximation. Mol. Biol. Evol. 35, 518–522. doi: 10.1093/molbev/msx281
Inkscape Project (2022). Inkscape. Draw freely. Available online at: https://inkscape.org/ (accessed February 28, 2022).
Janssens, S. B., Groeninckx, I., De Block, P. J., Verstraete, B., Smets, E. F., and Dessein, S. (2016). Dispersing towards Madagascar: Biogeography and evolution of the madagascan endemics of the Spermacoceae tribe (Rubiaceae). Mol. Phylogenet. Evol. 95, 58–66. doi: 10.1016/j.ympev.2015.10.024
Johnson, M. G., Gardner, E. M., Liu, Y., Medina, R., Goffinet, B., Shaw, A. J., et al. (2016). HybPiper: Extracting coding sequence and introns for phylogenetics from high-throughput sequencing reads using target enrichment. Appl. Plant Sci. 4:1600016. doi: 10.3732/apps.1600016
Johnson, M. G., Pokorny, L., Dodsworth, S., Botigué, L. R., Cowan, R. S., Devault, A., et al. (2019). A universal probe set for targeted sequencing of 353 nuclear genes from any flowering plant designed using k-medoids clustering. Syst. Biol. 68, 594–606. doi: 10.1093/sysbio/syy086
Jones, K. E., Fér, T., Schmickl, R. E., Dikow, R. B., Funk, V. A., Herrando-Moraira, S., et al. (2019). An empirical assessment of a single family-wide hybrid capture locus set at multiple evolutionary timescales in Asteraceae. Appl. Plant Sci. 7:e11295. doi: 10.1002/aps3.11295
Junier, T., and Zdobnov, E. M. (2010). The Newick utilities: High-throughput phylogenetic tree processing in the UNIX shell. Bioinformatics 26, 1669–1670. doi: 10.1093/bioinformatics/btq243
Katoh, K., and Standley, D. M. (2013). MAFFT multiple sequence alignment software version 7: Improvements in performance and usability. Mol. Biol. Evol. 30, 772–780. doi: 10.1093/molbev/mst010
Kearse, M., Moir, R., Wilson, A., Stones-Havas, S., Cheung, M., Sturrock, S., et al. (2012). Geneious Basic: An integrated and extendable desktop software platform for the organization and analysis of sequence data. Bioinformatics 28, 1647–1649. doi: 10.1093/bioinformatics/bts199
Khan, S. A., Razafimandimbison, S. G., Bremer, B., and Liede-Schumann, S. (2008). Sabiceeae and Virectarieae (Rubiaceae, Ixoroideae): One or two tribes? New tribal and generic circumscriptions of Sabiceeae and biogeography of Sabicea s.l. Taxon 57, 7–23. doi: 10.2307/25065944
Kircher, M., Sawyer, S., and Meyer, M. (2012). Double indexing overcomes inaccuracies in multiplex sequencing on the Illumina platform. Nucleic Acids Res. 40, e3–e3. doi: 10.1093/nar/gkr771
Krüger, Å (2014). Systematics and biogeography of Western Indian Ocean region Rubiaceae: Examples from Danaideae, Hymenodictyeae, and Naucleeae. [Doctoral dissertation]. Stockholm: Stockholm University.
Kubatko, L. S., and Degnan, J. H. (2007). Inconsistency of phylogenetic estimates from concatenated data under coalescence. Syst. Biol. 56, 17–24. doi: 10.1080/10635150601146041
Kuhnhäuser, B. G., Bellot, S., Couvreur, T. L. P., Dransfield, J., Henderson, A., Schley, R., et al. (2021). A robust phylogenomic framework for the calamoid palms. Mol. Phylogenet. Evol. 157:107067. doi: 10.1016/j.ympev.2020.107067
Lanier, H. C., and Knowles, L. L. (2012). Is recombination a problem for species-tree analyses? Syst. Biol. 61, 691–701. doi: 10.1093/sysbio/syr128
Larridon, I., Villaverde, T., Zuntini, A. R., Pokorny, L., Brewer, G. E., Epitawalage, N., et al. (2020). Tackling rapid radiations with targeted sequencing. Front. Plant Sci. 10:1655. doi: 10.3389/fpls.2019.01655
Leebens-Mack, J. H., Barker, M. S., Carpenter, E. J., Deyholos, M. K., Gitzendanner, M. A., Graham, S. W., et al. (2019). One thousand plant transcriptomes and the phylogenomics of green plants. Nature 574, 679–685. doi: 10.1038/s41586-019-1693-2
Li, H., and Durbin, R. (2009). Fast and accurate short read alignment with Burrows-Wheeler transform. Bioinformatics. 25, 1754–1760. doi: 10.1093/bioinformatics/btp324
Linkem, C. W., Minin, V. N., and Leaché, A. D. (2016). Detecting the anomaly zone in species trees and evidence for a misleading signal in higher-level skink phylogeny (Squamata: Scincidae). Syst. Biol. 65, 465–477. doi: 10.1093/sysbio/syw001
Liu, L., and Edwards, S. V. (2009). Phylogenetic analysis in the anomaly zone. Syst. Biol. 58, 452–460. doi: 10.1093/sysbio/syp034
Maddison, W. P. (1997). Gene trees in species trees. Syst. Biol. 46, 523–536. doi: 10.1093/sysbio/46.3.523
Maurin, O., Anest, A., Bellot, S., Biffin, E., Brewer, G., Charles-Dominique, T., et al. (2021). A nuclear phylogenomic study of the angiosperm order Myrtales, exploring the potential and limitations of the universal Angiosperms353 probe set. Am. J. Bot. 108, 1087–1111. doi: 10.1002/ajb2.1699
McKain, M. R., Johnson, M. G., Uribe-Convers, S., Eaton, D., and Yang, Y. (2018). Practical considerations for plant phylogenomics. Appl. Plant Sci. 6:e1038. doi: 10.1002/aps3.1038
McLay, T. G. B., Birch, J. L., Gunn, B. F., Ning, W., Tate, J. A., Nauheimer, L., et al. (2021). New targets acquired: Improving locus recovery from the Angiosperms353 probe set. Appl. Plant Sci. 9:as3.11420. doi: 10.1002/aps3.11420
Mendes, F. K., and Hahn, M. W. (2018). Why concatenation fails near the anomaly zone. Syst. Biol. 67, 158–169. doi: 10.1093/sysbio/syx063
Meyer, M., and Kircher, M. (2010). Illumina sequencing library preparation for highly multiplexed target capture and sequencing. Cold Spring Harb. Protoc. 2010:db.rot5448. doi: 10.1101/pdb.prot5448
Minh, B. Q., Schmidt, H. A., Chernomor, O., Schrempf, D., Woodhams, M. D., Von Haeseler, A., et al. (2020). IQ-TREE 2: New models and efficient methods for phylogenetic inference in the genomic era. Mol. Biol. Evol. 37, 1530–1534.
Mirarab, S., and Warnow, T. (2015). ASTRAL-II: Coalescent-based species tree estimation with many hundreds of taxa and thousands of genes. Bioinformatics 31, i44–i52. doi: 10.1093/bioinformatics/btv234
Mirarab, S., Bayzid, M. S., and Warnow, T. (2016). Evaluating summary methods for multilocus species tree estimation in the presence of incomplete lineage sorting. Syst. Biol. 65, 366–380. doi: 10.1093/sysbio/syu063
Molloy, E. K., and Warnow, T. (2018). To include or not to include: The impact of gene filtering on species tree estimation methods. Syst. Biol. 67, 285–303. doi: 10.1093/sysbio/syx077
Morales-Briones, D. F., Liston, A., and Tank, D. C. (2018). Phylogenomic analyses reveal a deep history of hybridization and polyploidy in the Neotropical genus Lachemilla (Rosaceae). New Phytol. 218, 1668–1684. doi: 10.1111/nph.15099
Natali, A., Manen, J.-F., and Ehrendorfer, F. (1995). Phylogeny of the Rubiaceae-Rubioideae, in particular the tribe Rubieae: Evidence from a non-coding chloroplast DNA sequence. Ann. Mo. Bot. Gard. 82, 428–439. doi: 10.2307/2399892
Neupane, S., Lewis, P. O., Dessein, S., Shanks, H., Paudyal, S., and Lens, F. (2017). Evolution of woody life form on tropical mountains in the tribe Spermacoceae (Rubiaceae). Am. J. Bot. 104, 419–438. doi: 10.3732/ajb.1600248
Nicholls, J. A., Pennington, R. T., Koenen, E. J. M., Hughes, C. E., Hearn, J., Bunnefeld, L., et al. (2015). Using targeted enrichment of nuclear genes to increase phylogenetic resolution in the neotropical rain forest genus Inga (Leguminosae: Mimosoideae). Front. Plant Sci 6:710. doi: 10.3389/fpls.2015.00710
Pamilo, P., and Nei, M. (1988). Relationships between gene trees and species trees. Mol. Biol. Evol. 5, 568–583. doi: 10.1093/oxfordjournals.molbev.a040517
Paradis, E., and Schliep, K. (2019). Ape 5.0: An environment for modern phylogenetics and evolutionary analyses in R. Bioinformatics 35, 526–528. doi: 10.1093/bioinformatics/bty633
Philippe, H., Delsuc, F., Brinkmann, H., and Lartillot, N. (2005). Phylogenomics. Annu. Rev. Ecol. Evol. Syst. 36, 541–562. doi: 10.1146/annurev.ecolsys.35.112202.130205
Piesschaert, F., Andersson, L., Jansen, S., Dessein, S., Robbrecht, E., and Smets, E. (2000). Searching for the taxonomic position of the African genus Colletoecema (Rubiaceae): Morphology and anatomy compared to an rps16-intron analysis of the Rubioideae. Can. J. Bot. 78, 288–304. doi: 10.1139/b00-002
Puff, C. (1982). The delimitation of the tribe Anthospermeae and its affinities to the Paederieae (Rubiaceae). Bot. J. Linn. Soc. 84, 355–377. doi: 10.1111/j.1095-8339.1982.tb00369.x
Puff, C. (1989). The affinities and relationships of the Japanese endemic Pseudopyxis (Rubiaceae-Paederieae). Plant Species Biol. 4, 145–155.
Puff, C., and Chayamarit, K. (2008). Additional to “Rubiaceae of Thailand. A pictorial guide to indigenous and cultivated genera. Thai For. Bull. (Bot.) 36, 70–80.
Puff, C., Buchner, R., and Greimler, J. (1998a). Revision of Lecananthus (Rubiaceae-Schradereae). Blumea Biodivers. Evol. Biogeogr. Plants 43, 337–346.
Puff, C., Greimler, J., and Buchner, R. (1998b). Revision of Schradera (Rubiaceae-Schradereae) in Malesia. Blumea Biodivers. Evol. Biogeogr. Plants 43, 287–335.
R Core Team (2022). R: A language and environment for statistical computing. Vienna: R Foundation for Statistical Computing.
Razafimandimbison, S. G., and Rydin, C. (2019). Molecular-based assessments of tribal and generic limits and relationships in Rubiaceae (Gentianales): Polyphyly of Pomazoteae and paraphyly of Ophiorrhizeae and Ophiorrhiza. Taxon 68, 72–91. doi: 10.1002/tax.12023
Razafimandimbison, S. G., Kainulainen, K., Senterre, B., Morel, C., and Rydin, C. (2020). Phylogenetic affinity of an enigmatic Rubiaceae from the Seychelles revealing a recent biogeographic link with Central Africa: Gen. nov. Seychellea and trib. nov. Seychelleeae. Mol. Phylogenet. Evol. 143:106685. doi: 10.1016/j.ympev.2019.106685
Razafimandimbison, S. G., Kainulainen, K., Wikström, N., and Bremer, B. (2017). Historical biogeography and phylogeny of the pantropical Psychotrieae alliance (Rubiaceae), with particular emphasis on the Western Indian Ocean Region. Am. J. Bot. 104, 1407–1423. doi: 10.3732/ajb.1700116
Razafimandimbison, S. G., Rydin, C., and Bremer, B. (2008). Evolution and trends in the Psychotrieae alliance (Rubiaceae)—A rarely reported evolutionary change of many-seeded carpels from one-seeded carpels. Mol. Phylogenet. Evol. 48, 207–223. doi: 10.1016/j.ympev.2008.03.034
Razafimandimbison, S. G., Taylor, C. M., Wikstrom, N., Pailler, T., Khodabandeh, A., and Bremer, B. (2014). Phylogeny and generic limits in the sister tribes Psychotrieae and Palicoureeae (Rubiaceae): Evolution of schizocarps in Psychotria and origins of bacterial leaf nodules of the Malagasy species. Am. J. Bot. 101, 1102–1126. doi: 10.3732/ajb.1400076
Rincón-Barrado, M., Olsson, S., Villaverde, T., Moncalvillo, B., Pokorny, L., Forrest, A., et al. (2021). Ecological and geological processes impacting speciation modes drive the formation of wide-range disjunctions within tribe Putorieae (Rubiaceae). J. Syst. Evol. 59, 915–934. doi: 10.1111/jse.12747
Robbrecht, E. (1993). Supplement to the 1988 outline of the classification of the Rubiaceae: Index to genera. Opera Bot. Belg. 6, 173–196.
Robbrecht, E. (1988). Tropical woody Rubiaceae. Characteristic features and progressions. Contribution to a new subfamilial classification. Opera Bot. Belg. 1, 251–267.
Robbrecht, E., and Manen, J.-F. (2006). The major evolutionary lineages of the coffee family (Rubiaceae, angiosperms). Combined analysis (nDNA and cpDNA) to infer the position of Coptosapelta and Luculia, and supertree construction based on rbcL, rps16, trnL-trnF and atpB-rbcL data. A new classification in two subfamilies, Cinchonoideae and Rubioideae. Syst. Geogr. Plants 76, 85–146. doi: 10.2307/20649700
Roch, S., and Steel, M. (2015). Likelihood-based tree reconstruction on a concatenation of aligned sequence data sets can be statistically inconsistent. Theor. Popul. Biol. 100, 56–62. doi: 10.1016/j.tpb.2014.12.005
Ruane, S., Raxworthy, C. J., Lemmon, A. R., Lemmon, E. M., and Burbrink, F. T. (2015). Comparing species tree estimation with large anchored phylogenomic and small Sanger-sequenced molecular datasets: An empirical study on Malagasy pseudoxyrhophiine snakes. BMC Evol. Biol. 15, 1–14. doi: 10.1186/s12862-015-0503-1
Rydin, C., Razafimandimbison, S. G., Khodabandeh, A., and Bremer, B. (2009b). Evolutionary relationships in the Spermacoceae alliance (Rubiaceae) using information from six molecular loci: Insights into systematic affinities of Neohymenopogon and Mouretia. Taxon 58, 793–810. doi: 10.1002/tax.583009
Rydin, C., Kainulainen, K., Razafimandimbison, S. G., Smedmark, J. E. E., and Bremer, B. (2009a). Deep divergences in the coffee family and the systematic position of Acranthera. Plant Syst. Evol. 278, 101–123. doi: 10.1007/s00606-008-0138-4
Rydin, C., Razafimandimbison, S. G., and Bremer, B. (2008). Rare and enigmatic genera (Dunnia, Schizocolea, Colletoecema), sisters to species-rich clades: Phylogeny and aspects of conservation biology in the coffee family. Mol. Phylogenet. Evol. 48, 74–83. doi: 10.1016/j.ympev.2008.04.006
Rydin, C., Wikström, N., and Bremer, B. (2017). Conflicting results from mitochondrial genomic data challenge current views of Rubiaceae phylogeny. Am. J. Bot. 104, 1522–1532. doi: 10.3732/ajb.1700255
Sanderson, B. J., DiFazio, S. P., Cronk, Q. C. B., Ma, T., and Olson, M. S. (2020). A targeted sequence capture array for phylogenetics and population genomics in the Salicaceae. Appl. Plant Sci. 8:e11394. doi: 10.1002/aps3.11394
Sayyari, E., and Mirarab, S. (2016). Fast coalescent-based computation of local branch support from quartet frequencies. Mol. Biol. Evol. 33, 1654–1668. doi: 10.1093/molbev/msw079
Sayyari, E., and Mirarab, S. (2018). Testing for polytomies in phylogenetic species trees using quartet frequencies. Genes 9, 132. doi: 10.3390/genes9030132
Slater, G. S. C., and Birney, E. (2005). Automated generation of heuristics for biological sequence comparison. BMC Bioinformatics 6, 31. doi: 10.1186/1471-2105-6-31
Smedmark, J. E. E., and Bremer, B. (2011). Molecular systematics and incongruent gene trees of Urophylleae (Rubiaceae). Taxon 60, 1397–1406. doi: 10.1002/tax.605015
Smedmark, J. E. E., Eriksson, T., and Bremer, B. (2010). Divergence time uncertainty and historical biogeography reconstruction – an example from Urophylleae (Rubiaceae). J. Biogeogr. 37, 2260–2274. doi: 10.1111/j.1365-2699.2010.02366.x
Smedmark, J. E. E., Razafimandimbison, S. G., Wikström, N., and Bremer, B. (2014). Inferring geographic range evolution of a pantropical tribe in the coffee family (Lasiantheae, Rubiaceae) in the face of topological uncertainty. Mol. Phylogenet. Evol. 70, 182–194. doi: 10.1016/j.ympev.2013.09.007
Smedmark, J. E. E., Rydin, C., Razafimandimbison, S. G., Khan, S. A., Liede-Schumann, S., and Bremer, B. (2008). A phylogeny of Urophylleae (Rubiaceae) based on rps16 intron data. Taxon 57, 24–32. doi: 10.2307/25065945
Sunding, P. (1979). “Origins of the macaronesian Flora,” in Plants and islands, ed. D. Bramwell (London: Academic Press), 13–40.
Suyama, M., Torrents, D., and Bork, P. (2006). PAL2NAL: Robust conversion of protein sequence alignments into the corresponding codon alignments. Nucleic Acids Res. 34, W609–W612. doi: 10.1093/nar/gkl315
Tange, C. (1995). The identity of Siderobombyx and a new species of Xanthophytum (Rubiaceae). Nord. J. Bot. 15, 575–581.
Thomas, A. E., Igea, J., Meudt, H. M., Albach, D. C., Lee, W. G., and Tanentzap, A. J. (2021). Using target sequence capture to improve the phylogenetic resolution of a rapid radiation in New Zealand Veronica. Am. J. Bot. 108, 1289–1306. doi: 10.1002/ajb2.1678
Thureborn, O., Razafimandimbison, S. G., Wikström, N., Khodabandeh, A., and Rydin, C. (2019). Phylogeny of Anthospermeae of the coffee family inferred using clock and nonclock models. Int. J. Plant Sci. 180, 386–402. doi: 10.1086/703353
Vatanparast, M., Powell, A., Doyle, J. J., and Egan, A. N. (2018). Targeting legume loci: A comparison of three methods for target enrichment bait design in Leguminosae phylogenomics. Appl. Plant Sci. 6, e1036. doi: 10.1002/aps3.1036
Verdcourt, B. (1958). Remarks on the classification of the Rubiaceae. Bull. Jard. Bot. LÉtat Brux. 28, 209–290. doi: 10.2307/3667090
Wang, L.-G., Lam, T. T.-Y., Xu, S., Dai, Z., Zhou, L., Feng, T., et al. (2020). Treeio: An R package for phylogenetic tree input and output with richly annotated and associated data. Mol. Biol. Evol. 37, 599–603. doi: 10.1093/molbev/msz240
Wang, Z., and Liu, K. J. (2016). A performance study of the impact of recombination on species tree analysis. BMC Genomics 17:785. doi: 10.1186/s12864-016-3104-5
Weitemier, K., Straub, S. C. K., Cronn, R. C., Fishbein, M., Schmickl, R., McDonnell, A., et al. (2014). Hyb-Seq: Combining target enrichment and genome skimming for plant phylogenomics. Appl. Plant Sci. 2:1400042. doi: 10.3732/apps.1400042
Wen, H.-Z., and Wang, R.-J. (2012). Foonchewia guangdongensis gen. et sp. nov. (Rubioideae: Rubiaceae) and its systematic position inferred from chloroplast sequences and morphology. J. Syst. Evol. 50, 467–476. doi: 10.1111/j.1759-6831.2012.00196.x
Whitfield, J. B., and Lockhart, P. J. (2007). Deciphering ancient rapid radiations. Trends Ecol. Evol. 22, 258–265. doi: 10.1016/j.tree.2007.01.012
Wikström, N., Bremer, B., and Rydin, C. (2020). Conflicting phylogenetic signals in genomic data of the coffee family (Rubiaceae). J. Syst. Evol. 58, 440–460. doi: 10.1111/jse.12566
Wikström, N., Kainulainen, K., Razafimandimbison, S. G., Smedmark, J. E. E., and Bremer, B. (2015). A revised time tree of the asterids: Establishing a temporal framework for evolutionary studies of the coffee family (Rubiaceae). PLoS One 10:e0126690. doi: 10.1371/journal.pone.0126690
Wolf, P. G., Robison, T. A., Johnson, M. G., Sundue, M. A., Testo, W. L., and Rothfels, C. J. (2018). Target sequence capture of nuclear-encoded genes for phylogenetic analysis in ferns. Appl. Plant Sci. 6, e01148. doi: 10.1002/aps3.1148
Yan, Z., Smith, M. L., Du, P., Hahn, M. W., and Nakhleh, L. (2021). Species tree inference methods intended to deal with incomplete lineage sorting are robust to the presence of paralogs. Syst. Biol 71, 367–381. doi: 10.1093/sysbio/syab056
Yang, L.-L., Li, H.-L., Wei, L., Yang, T., Kuang, D.-Y., Li, M.-H., et al. (2016). A supermatrix approach provides a comprehensive genus-level phylogeny for Gentianales: Phylogeny of Gentianales. J. Syst. Evol. 54, 400–415. doi: 10.1111/jse.12192
Yang, Y., and Smith, S. A. (2014). Orthology inference in nonmodel organisms using transcriptomes and low-coverage genomes: Improving accuracy and matrix occupancy for phylogenomics. Mol. Biol. Evol. 31, 3081–3092. doi: 10.1093/molbev/msu245
Zhang, C., Rabiee, M., Sayyari, E., and Mirarab, S. (2018). ASTRAL-III: Polynomial time species tree reconstruction from partially resolved gene trees. BMC Bioinformatics 19, 153. doi: 10.1186/s12859-018-2129-y
Zhou, W., Soghigian, J., and Xiang, Q.-Y. (2022). A new pipeline for removing paralogs in target enrichment data. Syst. Biol 71, 410–425. doi: 10.1093/sysbio/syab044
Keywords: Angiosperms353, incomplete lineage sorting, non-coding DNA, nuclear phylogeny, phylogenomics, Rubiaceae, Rubioideae, target capture
Citation: Thureborn O, Razafimandimbison SG, Wikström N and Rydin C (2022) Target capture data resolve recalcitrant relationships in the coffee family (Rubioideae, Rubiaceae). Front. Plant Sci. 13:967456. doi: 10.3389/fpls.2022.967456
Received: 12 June 2022; Accepted: 03 August 2022;
Published: 08 September 2022.
Edited by:
Stefan Wanke, Technical University Dresden, GermanyReviewed by:
Carolina Granados Mendoza, National Autonomous University of Mexico, MexicoDiego F. Morales-Briones, Ludwig Maximilian University of Munich, Germany
Copyright © 2022 Thureborn, Razafimandimbison, Wikström and Rydin. This is an open-access article distributed under the terms of the Creative Commons Attribution License (CC BY). The use, distribution or reproduction in other forums is permitted, provided the original author(s) and the copyright owner(s) are credited and that the original publication in this journal is cited, in accordance with accepted academic practice. No use, distribution or reproduction is permitted which does not comply with these terms.
*Correspondence: Olle Thureborn, b2xsZS50aHVyZWJvcm5Ac3Uuc2U=